Wilton, CA Map & Demographics
Wilton Map
Wilton Overview
$53,140
PER CAPITA INCOME
$158,222
AVG FAMILY INCOME
$176,875
AVG HOUSEHOLD INCOME
37.3%
WAGE / INCOME GAP [ % ]
62.7¢/ $1
WAGE / INCOME GAP [ $ ]
0.32
INEQUALITY / GINI INDEX
6,663
TOTAL POPULATION
3,584
MALE POPULATION
3,079
FEMALE POPULATION
116.40
MALES / 100 FEMALES
85.91
FEMALES / 100 MALES
49.7
MEDIAN AGE
3.4
AVG FAMILY SIZE
3.3
AVG HOUSEHOLD SIZE
3,110
LABOR FORCE [ PEOPLE ]
56.2%
PERCENT IN LABOR FORCE
1.7%
UNEMPLOYMENT RATE
Wilton Zip Codes
Wilton Area Codes
Income in Wilton
Income Overview in Wilton
Per Capita Income in Wilton is $53,140, while median incomes of families and households are $158,222 and $176,875 respectively.
| Characteristic | Number | Measure |
| Per Capita Income | 6,663 | $53,140 |
| Median Family Income | 1,598 | $158,222 |
| Mean Family Income | 1,598 | $158,514 |
| Median Household Income | 2,015 | $176,875 |
| Mean Household Income | 2,015 | $160,587 |
| Income Deficit | 1,598 | $0 |
| Wage / Income Gap (%) | 6,663 | 37.31% |
| Wage / Income Gap ($) | 6,663 | 62.69¢ per $1 |
| Gini / Inequality Index | 6,663 | 0.32 |
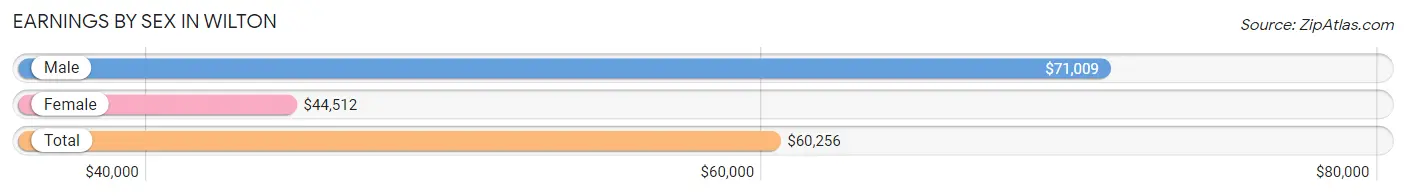
Earnings by Sex in Wilton
Average Earnings in Wilton are $60,256, $71,009 for men and $44,512 for women, a difference of 37.3%.
| Sex | Number | Average Earnings |
| Male | 1,782 (54.5%) | $71,009 |
| Female | 1,488 (45.5%) | $44,512 |
| Total | 3,270 (100.0%) | $60,256 |
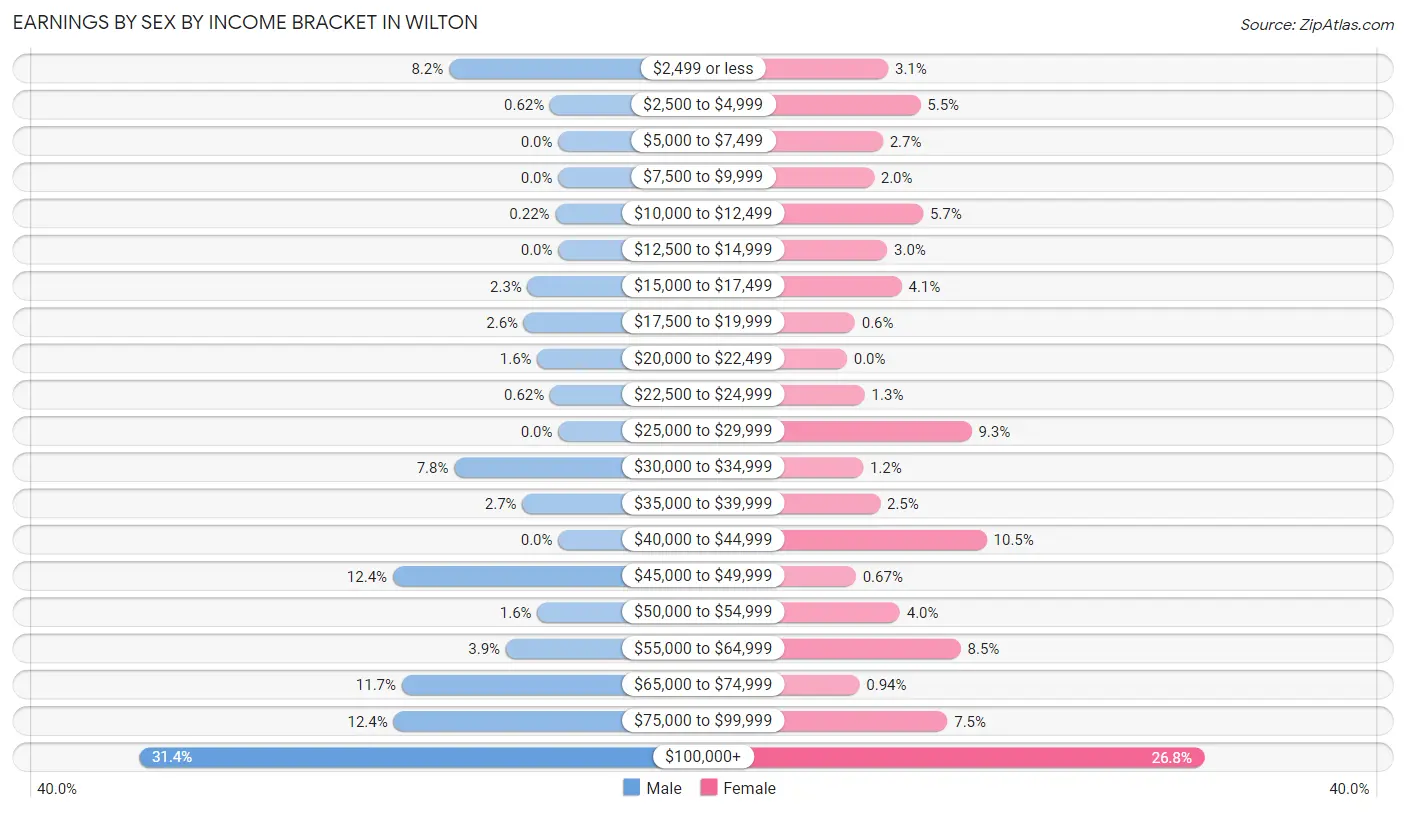
Earnings by Sex by Income Bracket in Wilton
The most common earnings brackets in Wilton are $100,000+ for men (560 | 31.4%) and $100,000+ for women (398 | 26.8%).
| Income | Male | Female |
| $2,499 or less | 146 (8.2%) | 46 (3.1%) |
| $2,500 to $4,999 | 11 (0.6%) | 82 (5.5%) |
| $5,000 to $7,499 | 0 (0.0%) | 40 (2.7%) |
| $7,500 to $9,999 | 0 (0.0%) | 30 (2.0%) |
| $10,000 to $12,499 | 4 (0.2%) | 85 (5.7%) |
| $12,500 to $14,999 | 0 (0.0%) | 45 (3.0%) |
| $15,000 to $17,499 | 41 (2.3%) | 61 (4.1%) |
| $17,500 to $19,999 | 46 (2.6%) | 9 (0.6%) |
| $20,000 to $22,499 | 28 (1.6%) | 0 (0.0%) |
| $22,500 to $24,999 | 11 (0.6%) | 20 (1.3%) |
| $25,000 to $29,999 | 0 (0.0%) | 139 (9.3%) |
| $30,000 to $34,999 | 139 (7.8%) | 18 (1.2%) |
| $35,000 to $39,999 | 48 (2.7%) | 37 (2.5%) |
| $40,000 to $44,999 | 0 (0.0%) | 156 (10.5%) |
| $45,000 to $49,999 | 221 (12.4%) | 10 (0.7%) |
| $50,000 to $54,999 | 28 (1.6%) | 59 (4.0%) |
| $55,000 to $64,999 | 70 (3.9%) | 127 (8.5%) |
| $65,000 to $74,999 | 209 (11.7%) | 14 (0.9%) |
| $75,000 to $99,999 | 220 (12.3%) | 112 (7.5%) |
| $100,000+ | 560 (31.4%) | 398 (26.8%) |
| Total | 1,782 (100.0%) | 1,488 (100.0%) |
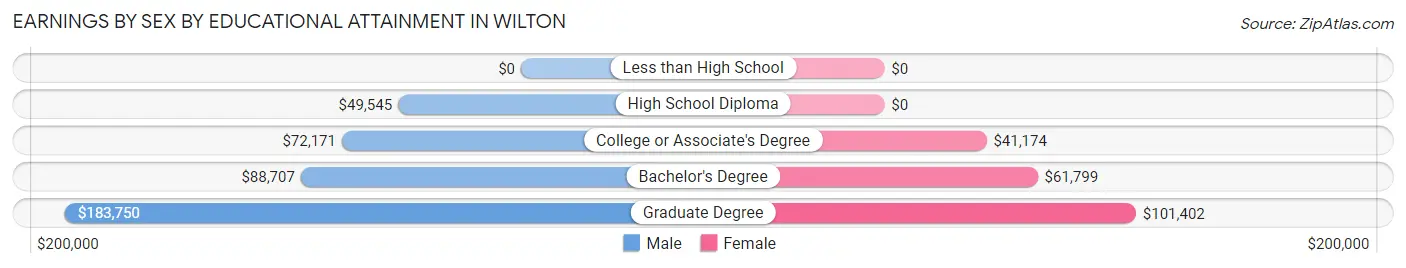
Earnings by Sex by Educational Attainment in Wilton
Average earnings in Wilton are $74,675 for men and $44,899 for women, a difference of 39.9%. Men with an educational attainment of graduate degree enjoy the highest average annual earnings of $183,750, while those with high school diploma education earn the least with $49,545. Women with an educational attainment of graduate degree earn the most with the average annual earnings of $101,402, while those with college or associate's degree education have the smallest earnings of $41,174.
| Educational Attainment | Male Income | Female Income |
| Less than High School | - | - |
| High School Diploma | $49,545 | $0 |
| College or Associate's Degree | $72,171 | $41,174 |
| Bachelor's Degree | $88,707 | $61,799 |
| Graduate Degree | $183,750 | $101,402 |
| Total | $74,675 | $44,899 |
Family Income in Wilton
Family Income Brackets in Wilton
According to the Wilton family income data, there are 460 families falling into the $200,000+ income range, which is the most common income bracket and makes up 28.8% of all families.
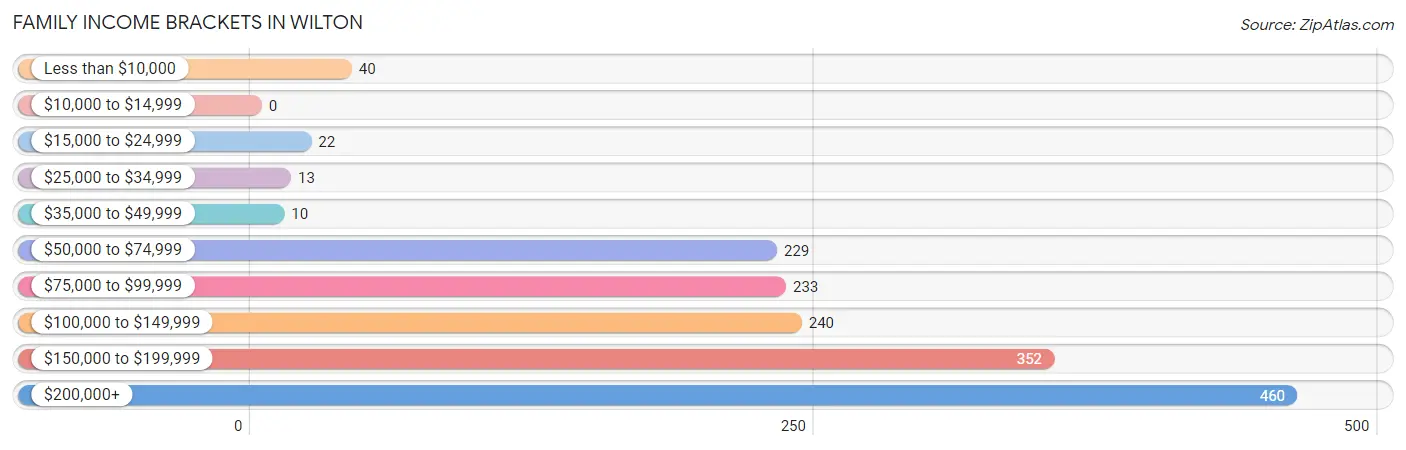
| Income Bracket | # Families | % Families |
| Less than $10,000 | 40 | 2.5% |
| $10,000 to $14,999 | 0 | 0.0% |
| $15,000 to $24,999 | 22 | 1.4% |
| $25,000 to $34,999 | 13 | 0.8% |
| $35,000 to $49,999 | 10 | 0.6% |
| $50,000 to $74,999 | 229 | 14.3% |
| $75,000 to $99,999 | 233 | 14.6% |
| $100,000 to $149,999 | 240 | 15.0% |
| $150,000 to $199,999 | 352 | 22.0% |
| $200,000+ | 460 | 28.8% |
Family Income by Famaliy Size in Wilton
4-person families (296 | 18.5%) account for the highest median family income in Wilton with $206,351 per family, while 2-person families (785 | 49.1%) have the highest median income of $58,264 per family member.
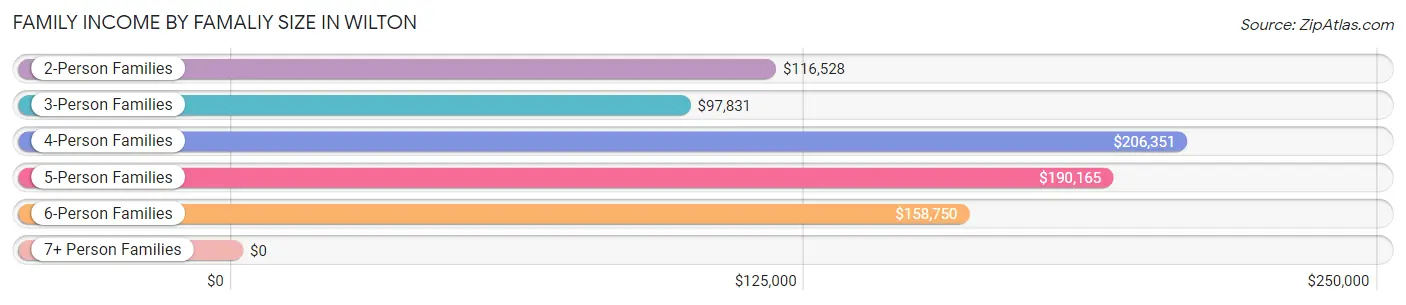
| Income Bracket | # Families | Median Income |
| 2-Person Families | 785 (49.1%) | $116,528 |
| 3-Person Families | 189 (11.8%) | $97,831 |
| 4-Person Families | 296 (18.5%) | $206,351 |
| 5-Person Families | 215 (13.5%) | $190,165 |
| 6-Person Families | 84 (5.3%) | $158,750 |
| 7+ Person Families | 29 (1.8%) | $0 |
| Total | 1,598 (100.0%) | $158,222 |
Family Income by Number of Earners in Wilton
The median family income in Wilton is $158,222, with families comprising 2 earners (627) having the highest median family income of $179,934, while families with no earners (307) have the lowest median family income of $104,688, accounting for 39.2% and 19.2% of families, respectively.
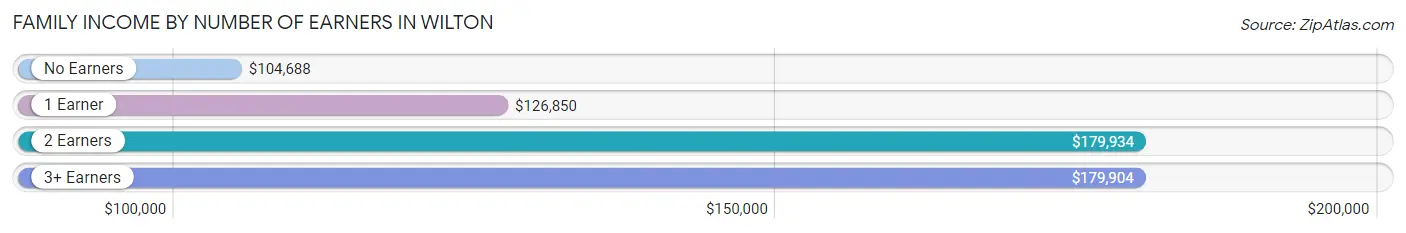
| Number of Earners | # Families | Median Income |
| No Earners | 307 (19.2%) | $104,688 |
| 1 Earner | 445 (27.9%) | $126,850 |
| 2 Earners | 627 (39.2%) | $179,934 |
| 3+ Earners | 219 (13.7%) | $179,904 |
| Total | 1,598 (100.0%) | $158,222 |
Household Income in Wilton
Household Income Brackets in Wilton
With 659 households falling in the category, the $200,000+ income range is the most frequent in Wilton, accounting for 32.7% of all households. In contrast, only 20 households (1.0%) fall into the $35,000 to $49,999 income bracket, making it the least populous group.
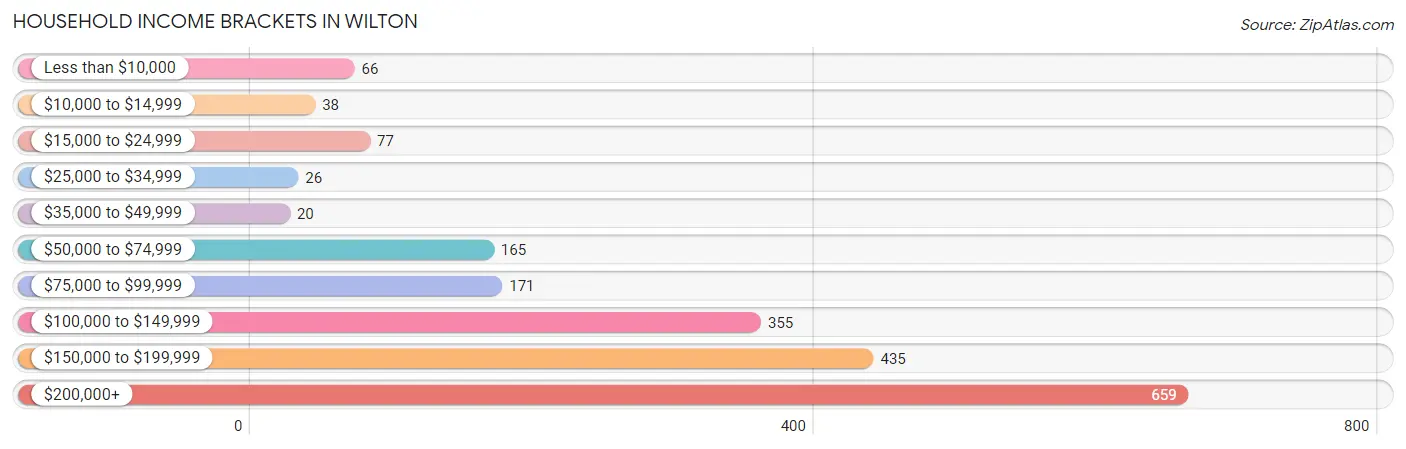
| Income Bracket | # Households | % Households |
| Less than $10,000 | 66 | 3.3% |
| $10,000 to $14,999 | 38 | 1.9% |
| $15,000 to $24,999 | 77 | 3.8% |
| $25,000 to $34,999 | 26 | 1.3% |
| $35,000 to $49,999 | 20 | 1.0% |
| $50,000 to $74,999 | 165 | 8.2% |
| $75,000 to $99,999 | 171 | 8.5% |
| $100,000 to $149,999 | 355 | 17.6% |
| $150,000 to $199,999 | 435 | 21.6% |
| $200,000+ | 659 | 32.7% |
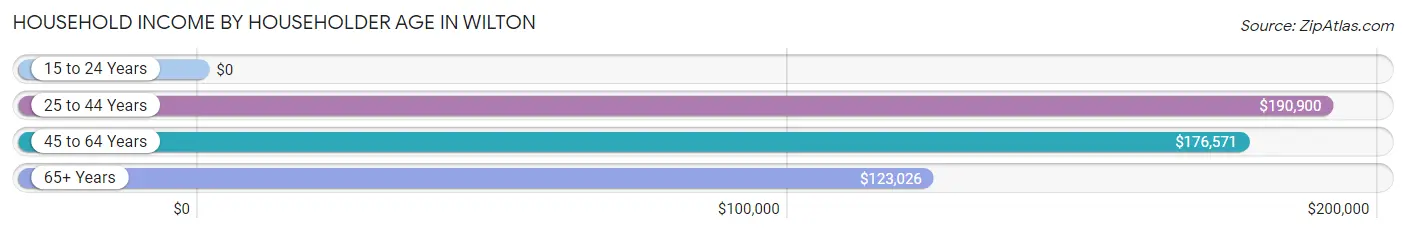
Household Income by Householder Age in Wilton
The median household income in Wilton is $176,875, with the highest median household income of $190,900 found in the 25 to 44 years age bracket for the primary householder. A total of 392 households (19.5%) fall into this category.
| Income Bracket | # Households | Median Income |
| 15 to 24 Years | 0 (0.0%) | $0 |
| 25 to 44 Years | 392 (19.5%) | $190,900 |
| 45 to 64 Years | 877 (43.5%) | $176,571 |
| 65+ Years | 746 (37.0%) | $123,026 |
| Total | 2,015 (100.0%) | $176,875 |
Poverty in Wilton
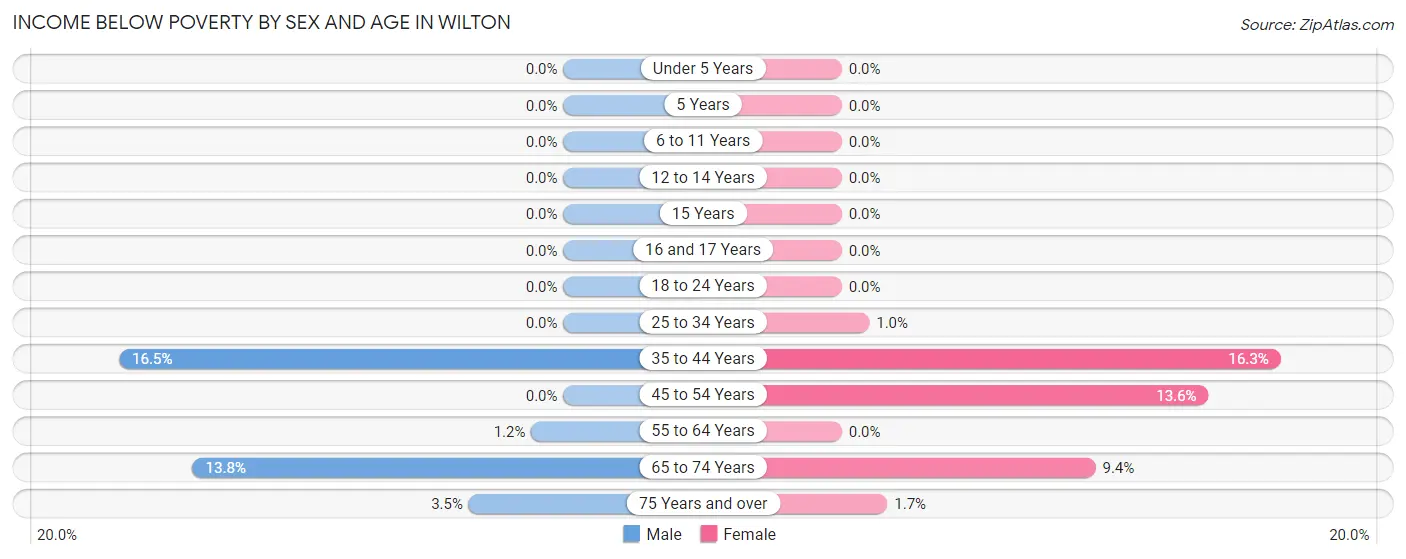
Income Below Poverty by Sex and Age in Wilton
With 4.0% poverty level for males and 5.6% for females among the residents of Wilton, 35 to 44 year old males and 35 to 44 year old females are the most vulnerable to poverty, with 61 males (16.5%) and 50 females (16.3%) in their respective age groups living below the poverty level.
| Age Bracket | Male | Female |
| Under 5 Years | 0 (0.0%) | 0 (0.0%) |
| 5 Years | 0 (0.0%) | 0 (0.0%) |
| 6 to 11 Years | 0 (0.0%) | 0 (0.0%) |
| 12 to 14 Years | 0 (0.0%) | 0 (0.0%) |
| 15 Years | 0 (0.0%) | 0 (0.0%) |
| 16 and 17 Years | 0 (0.0%) | 0 (0.0%) |
| 18 to 24 Years | 0 (0.0%) | 0 (0.0%) |
| 25 to 34 Years | 0 (0.0%) | 5 (1.0%) |
| 35 to 44 Years | 61 (16.5%) | 50 (16.3%) |
| 45 to 54 Years | 0 (0.0%) | 69 (13.6%) |
| 55 to 64 Years | 9 (1.2%) | 0 (0.0%) |
| 65 to 74 Years | 64 (13.8%) | 44 (9.4%) |
| 75 Years and over | 8 (3.5%) | 5 (1.7%) |
| Total | 142 (4.0%) | 173 (5.6%) |
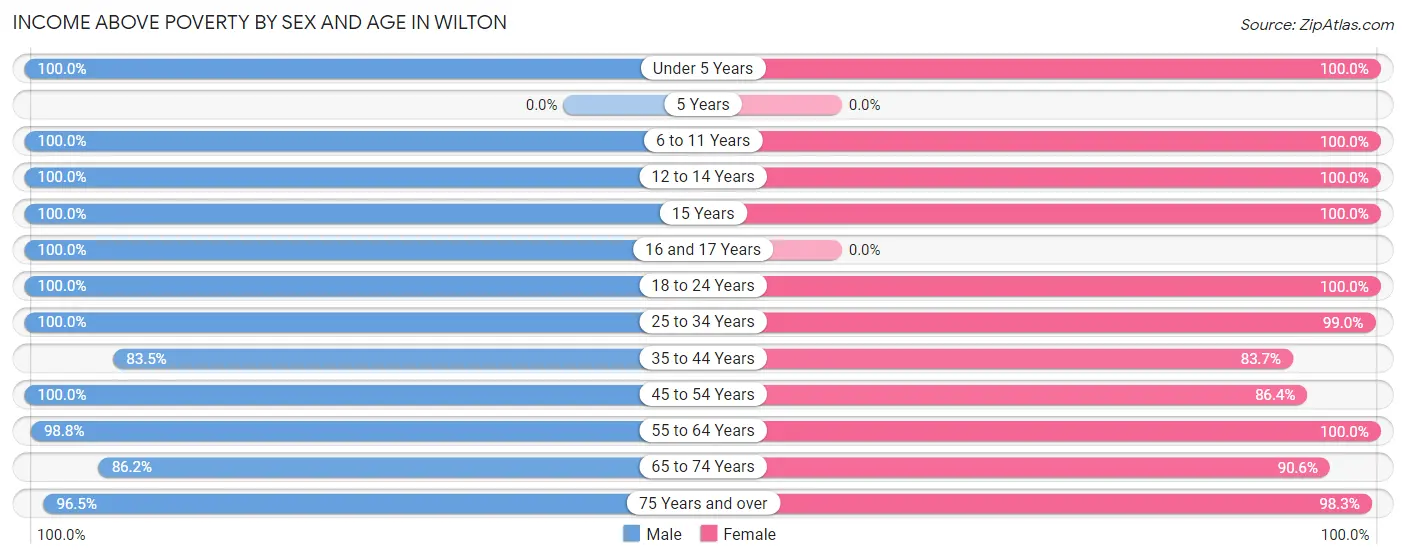
Income Above Poverty by Sex and Age in Wilton
According to the poverty statistics in Wilton, males aged under 5 years and females aged under 5 years are the age groups that are most secure financially, with 100.0% of males and 100.0% of females in these age groups living above the poverty line.
| Age Bracket | Male | Female |
| Under 5 Years | 216 (100.0%) | 27 (100.0%) |
| 5 Years | 0 (0.0%) | 0 (0.0%) |
| 6 to 11 Years | 189 (100.0%) | 263 (100.0%) |
| 12 to 14 Years | 208 (100.0%) | 83 (100.0%) |
| 15 Years | 83 (100.0%) | 60 (100.0%) |
| 16 and 17 Years | 63 (100.0%) | 0 (0.0%) |
| 18 to 24 Years | 250 (100.0%) | 70 (100.0%) |
| 25 to 34 Years | 489 (100.0%) | 483 (99.0%) |
| 35 to 44 Years | 309 (83.5%) | 257 (83.7%) |
| 45 to 54 Years | 268 (100.0%) | 438 (86.4%) |
| 55 to 64 Years | 746 (98.8%) | 506 (100.0%) |
| 65 to 74 Years | 401 (86.2%) | 423 (90.6%) |
| 75 Years and over | 220 (96.5%) | 291 (98.3%) |
| Total | 3,442 (96.0%) | 2,901 (94.4%) |
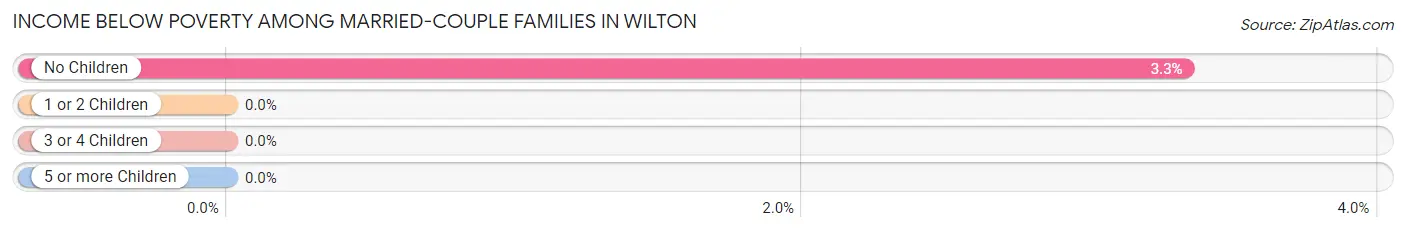
Income Below Poverty Among Married-Couple Families in Wilton
The poverty statistics for married-couple families in Wilton show that 2.1% or 25 of the total 1,198 families live below the poverty line. Families with no children have the highest poverty rate of 3.3%, comprising of 25 families. On the other hand, families with 1 or 2 children have the lowest poverty rate of 0.0%, which includes 0 families.
| Children | Above Poverty | Below Poverty |
| No Children | 726 (96.7%) | 25 (3.3%) |
| 1 or 2 Children | 311 (100.0%) | 0 (0.0%) |
| 3 or 4 Children | 136 (100.0%) | 0 (0.0%) |
| 5 or more Children | 0 (0.0%) | 0 (0.0%) |
| Total | 1,173 (97.9%) | 25 (2.1%) |
Income Below Poverty Among Single-Parent Households in Wilton
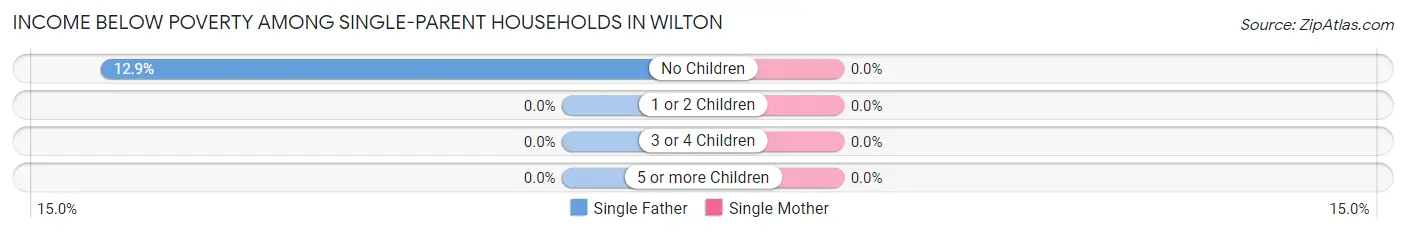
| Children | Single Father | Single Mother |
| No Children | 26 (12.9%) | 0 (0.0%) |
| 1 or 2 Children | 0 (0.0%) | 0 (0.0%) |
| 3 or 4 Children | 0 (0.0%) | 0 (0.0%) |
| 5 or more Children | 0 (0.0%) | 0 (0.0%) |
| Total | 26 (10.4%) | 0 (0.0%) |
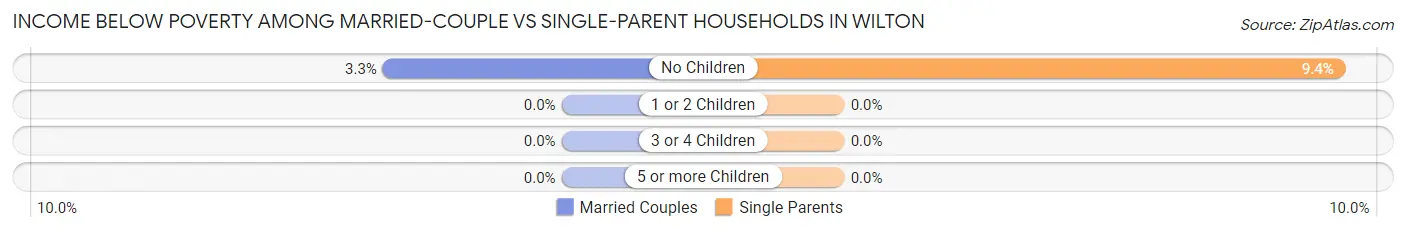
Income Below Poverty Among Married-Couple vs Single-Parent Households in Wilton
The poverty data for Wilton shows that 25 of the married-couple family households (2.1%) and 26 of the single-parent households (6.5%) are living below the poverty level. Within the married-couple family households, those with no children have the highest poverty rate, with 25 households (3.3%) falling below the poverty line. Among the single-parent households, those with no children have the highest poverty rate, with 26 household (9.3%) living below poverty.
| Children | Married-Couple Families | Single-Parent Households |
| No Children | 25 (3.3%) | 26 (9.3%) |
| 1 or 2 Children | 0 (0.0%) | 0 (0.0%) |
| 3 or 4 Children | 0 (0.0%) | 0 (0.0%) |
| 5 or more Children | 0 (0.0%) | 0 (0.0%) |
| Total | 25 (2.1%) | 26 (6.5%) |
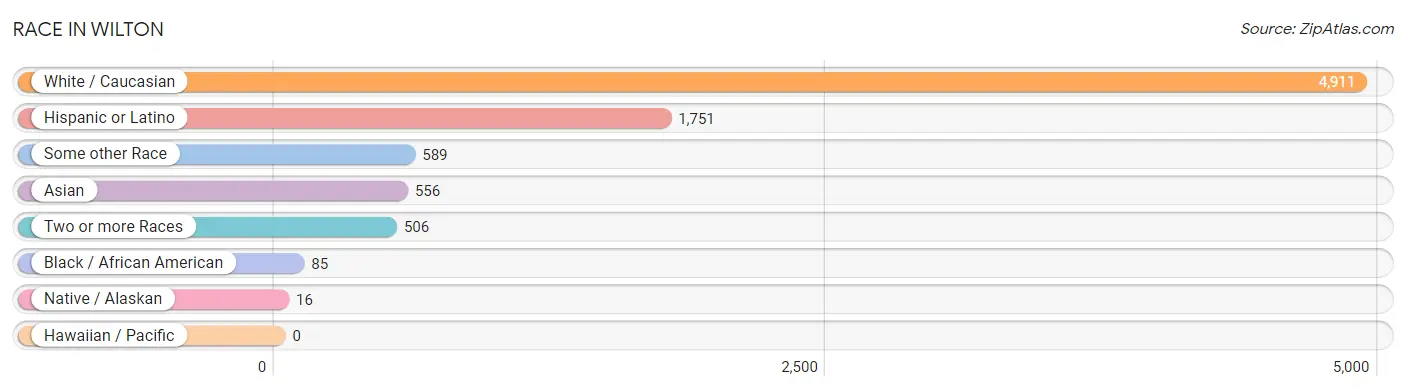
Race in Wilton
The most populous races in Wilton are White / Caucasian (4,911 | 73.7%), Hispanic or Latino (1,751 | 26.3%), and Some other Race (589 | 8.8%).
| Race | # Population | % Population |
| Asian | 556 | 8.3% |
| Black / African American | 85 | 1.3% |
| Hawaiian / Pacific | 0 | 0.0% |
| Hispanic or Latino | 1,751 | 26.3% |
| Native / Alaskan | 16 | 0.2% |
| White / Caucasian | 4,911 | 73.7% |
| Two or more Races | 506 | 7.6% |
| Some other Race | 589 | 8.8% |
| Total | 6,663 | 100.0% |
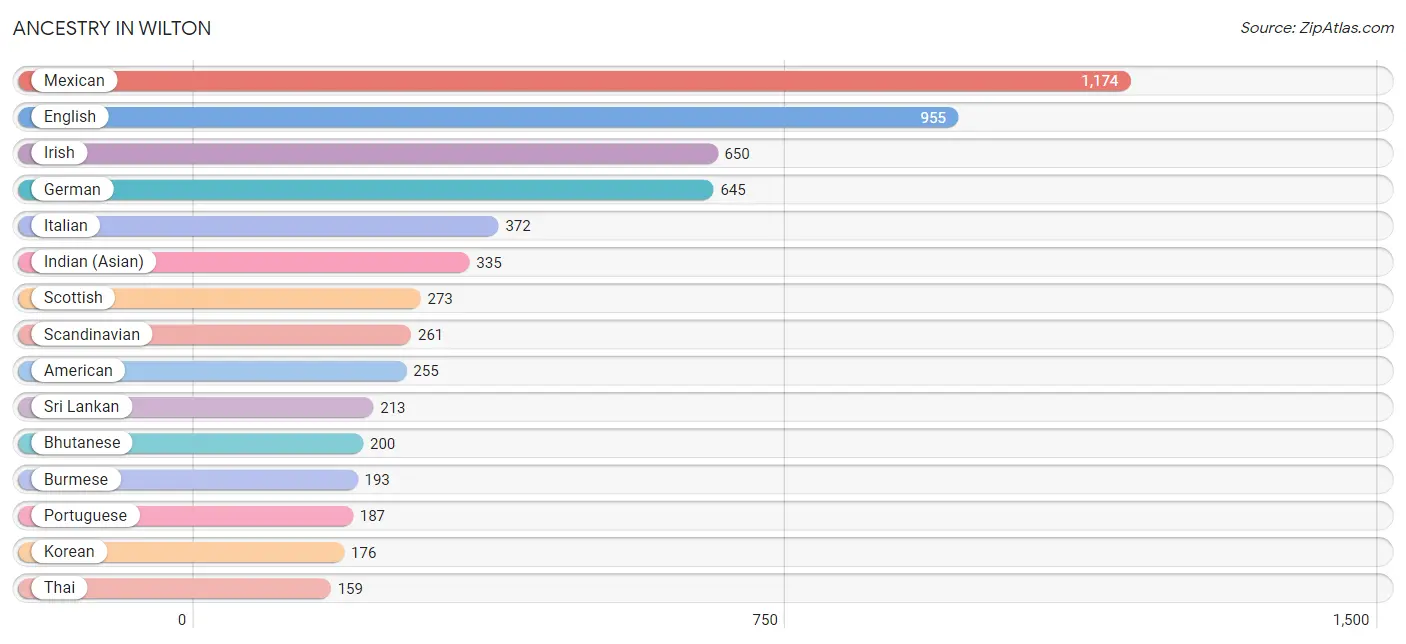
Ancestry in Wilton
The most populous ancestries reported in Wilton are Mexican (1,174 | 17.6%), English (955 | 14.3%), Irish (650 | 9.8%), German (645 | 9.7%), and Italian (372 | 5.6%), together accounting for 57.0% of all Wilton residents.
| Ancestry | # Population | % Population |
| American | 255 | 3.8% |
| Argentinean | 14 | 0.2% |
| Assyrian / Chaldean / Syriac | 37 | 0.6% |
| Bhutanese | 200 | 3.0% |
| British | 5 | 0.1% |
| Burmese | 193 | 2.9% |
| Central American | 10 | 0.2% |
| Cherokee | 10 | 0.2% |
| Colombian | 15 | 0.2% |
| Cuban | 14 | 0.2% |
| Czech | 17 | 0.3% |
| Danish | 22 | 0.3% |
| Dutch | 144 | 2.2% |
| Ecuadorian | 81 | 1.2% |
| English | 955 | 14.3% |
| Estonian | 5 | 0.1% |
| European | 48 | 0.7% |
| French | 139 | 2.1% |
| French Canadian | 4 | 0.1% |
| German | 645 | 9.7% |
| Greek | 98 | 1.5% |
| Guatemalan | 9 | 0.1% |
| Honduran | 1 | 0.0% |
| Indian (Asian) | 335 | 5.0% |
| Iranian | 19 | 0.3% |
| Irish | 650 | 9.8% |
| Italian | 372 | 5.6% |
| Korean | 176 | 2.6% |
| Mexican | 1,174 | 17.6% |
| Native Hawaiian | 51 | 0.8% |
| Norwegian | 59 | 0.9% |
| Polish | 64 | 1.0% |
| Portuguese | 187 | 2.8% |
| Puerto Rican | 45 | 0.7% |
| Russian | 56 | 0.8% |
| Scandinavian | 261 | 3.9% |
| Scotch-Irish | 28 | 0.4% |
| Scottish | 273 | 4.1% |
| South American | 110 | 1.7% |
| Spaniard | 138 | 2.1% |
| Sri Lankan | 213 | 3.2% |
| Swedish | 137 | 2.1% |
| Thai | 159 | 2.4% |
| Welsh | 97 | 1.5% | View All 44 Rows |
Immigrants in Wilton
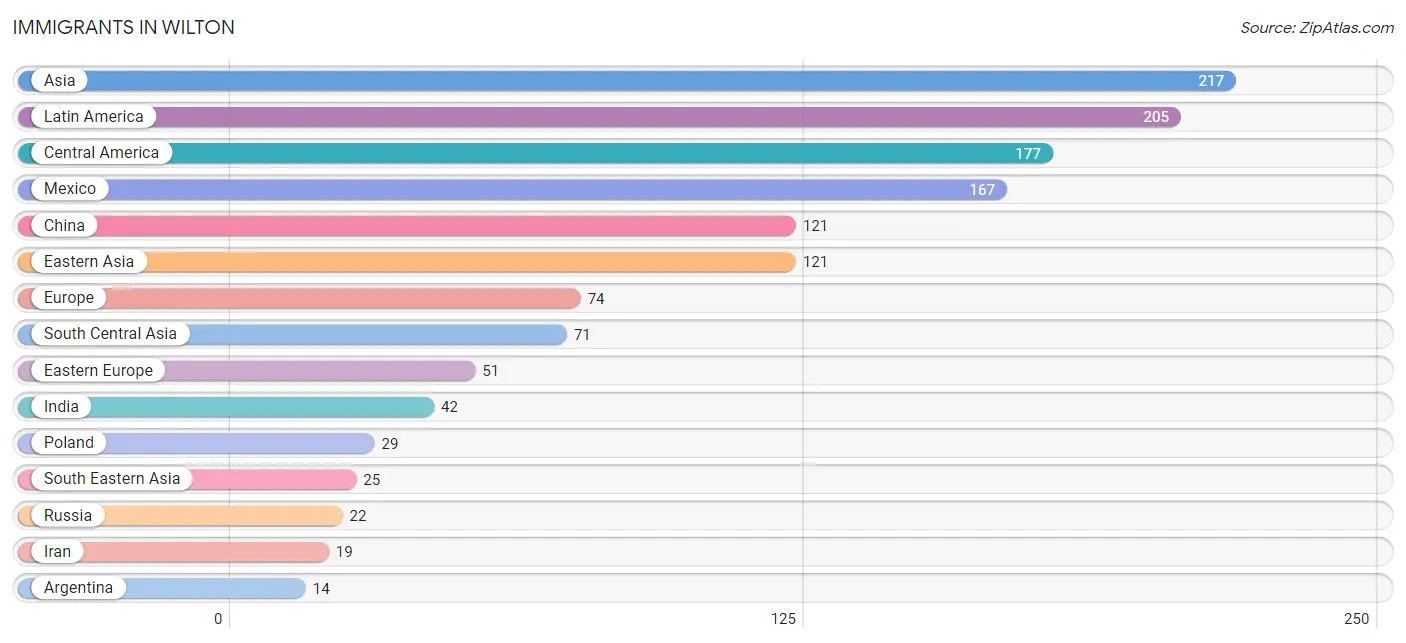
The most numerous immigrant groups reported in Wilton came from Asia (217 | 3.3%), Latin America (205 | 3.1%), Central America (177 | 2.7%), Mexico (167 | 2.5%), and China (121 | 1.8%), together accounting for 13.3% of all Wilton residents.
| Immigration Origin | # Population | % Population |
| Argentina | 14 | 0.2% |
| Asia | 217 | 3.3% |
| Caribbean | 14 | 0.2% |
| Central America | 177 | 2.7% |
| China | 121 | 1.8% |
| Cuba | 14 | 0.2% |
| Eastern Asia | 121 | 1.8% |
| Eastern Europe | 51 | 0.8% |
| England | 9 | 0.1% |
| Europe | 74 | 1.1% |
| Germany | 14 | 0.2% |
| Guatemala | 9 | 0.1% |
| Honduras | 1 | 0.0% |
| India | 42 | 0.6% |
| Iran | 19 | 0.3% |
| Latin America | 205 | 3.1% |
| Mexico | 167 | 2.5% |
| Northern Europe | 9 | 0.1% |
| Pakistan | 10 | 0.2% |
| Philippines | 12 | 0.2% |
| Poland | 29 | 0.4% |
| Russia | 22 | 0.3% |
| South America | 14 | 0.2% |
| South Central Asia | 71 | 1.1% |
| South Eastern Asia | 25 | 0.4% |
| Vietnam | 13 | 0.2% |
| Western Europe | 14 | 0.2% | View All 27 Rows |
Sex and Age in Wilton
Sex and Age in Wilton
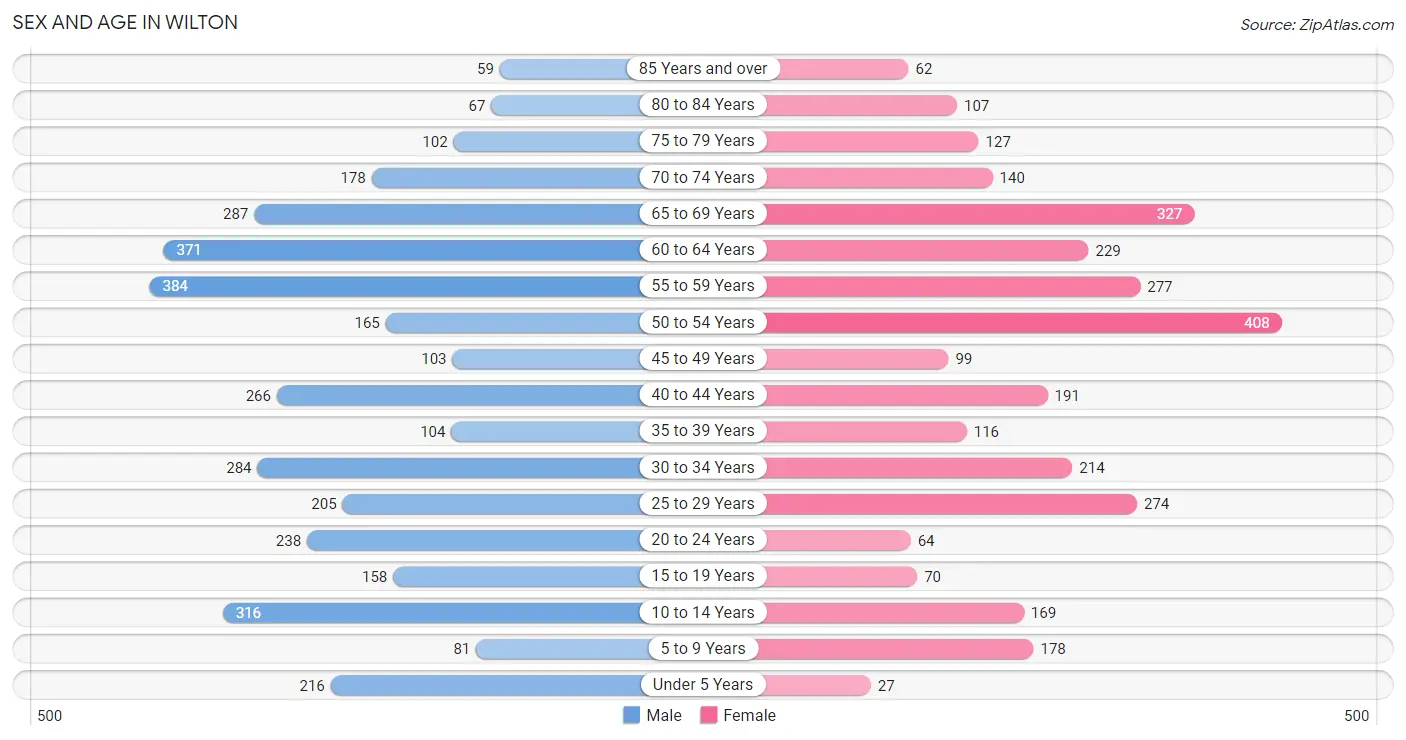
The most populous age groups in Wilton are 55 to 59 Years (384 | 10.7%) for men and 50 to 54 Years (408 | 13.3%) for women.
| Age Bracket | Male | Female |
| Under 5 Years | 216 (6.0%) | 27 (0.9%) |
| 5 to 9 Years | 81 (2.3%) | 178 (5.8%) |
| 10 to 14 Years | 316 (8.8%) | 169 (5.5%) |
| 15 to 19 Years | 158 (4.4%) | 70 (2.3%) |
| 20 to 24 Years | 238 (6.6%) | 64 (2.1%) |
| 25 to 29 Years | 205 (5.7%) | 274 (8.9%) |
| 30 to 34 Years | 284 (7.9%) | 214 (7.0%) |
| 35 to 39 Years | 104 (2.9%) | 116 (3.8%) |
| 40 to 44 Years | 266 (7.4%) | 191 (6.2%) |
| 45 to 49 Years | 103 (2.9%) | 99 (3.2%) |
| 50 to 54 Years | 165 (4.6%) | 408 (13.3%) |
| 55 to 59 Years | 384 (10.7%) | 277 (9.0%) |
| 60 to 64 Years | 371 (10.3%) | 229 (7.4%) |
| 65 to 69 Years | 287 (8.0%) | 327 (10.6%) |
| 70 to 74 Years | 178 (5.0%) | 140 (4.5%) |
| 75 to 79 Years | 102 (2.9%) | 127 (4.1%) |
| 80 to 84 Years | 67 (1.9%) | 107 (3.5%) |
| 85 Years and over | 59 (1.7%) | 62 (2.0%) |
| Total | 3,584 (100.0%) | 3,079 (100.0%) |
Families and Households in Wilton
Median Family Size in Wilton
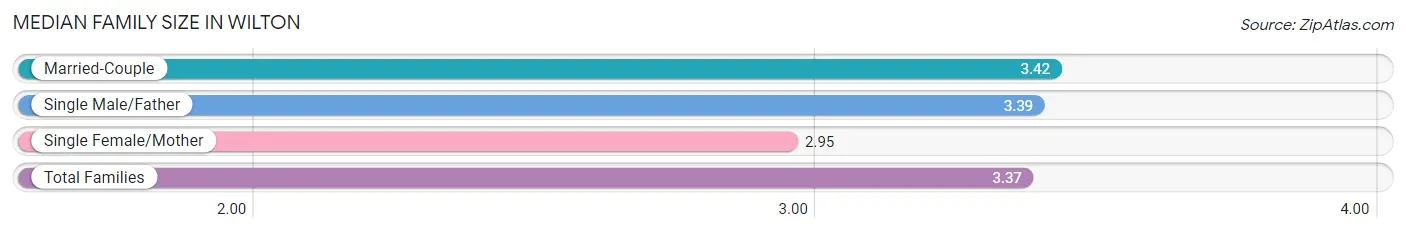
The median family size in Wilton is 3.37 persons per family, with married-couple families (1,198 | 75.0%) accounting for the largest median family size of 3.42 persons per family. On the other hand, single female/mother families (151 | 9.5%) represent the smallest median family size with 2.95 persons per family.
| Family Type | # Families | Family Size |
| Married-Couple | 1,198 (75.0%) | 3.42 |
| Single Male/Father | 249 (15.6%) | 3.39 |
| Single Female/Mother | 151 (9.5%) | 2.95 |
| Total Families | 1,598 (100.0%) | 3.37 |
Median Household Size in Wilton
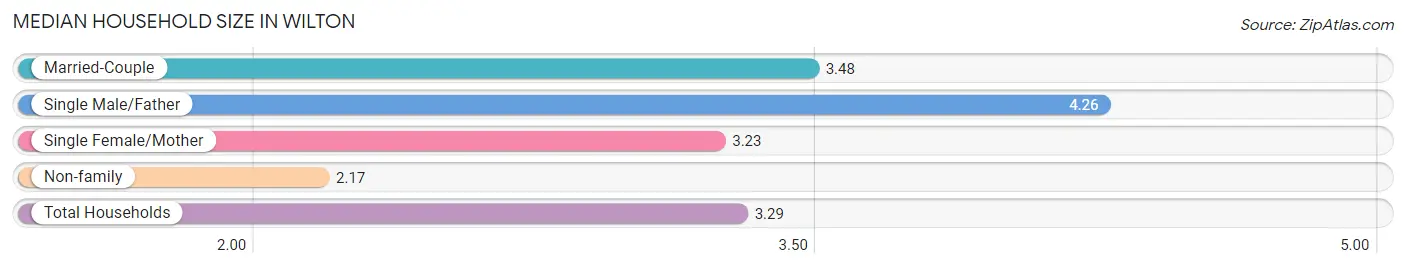
The median household size in Wilton is 3.29 persons per household, with single male/father households (249 | 12.4%) accounting for the largest median household size of 4.26 persons per household. non-family households (417 | 20.7%) represent the smallest median household size with 2.17 persons per household.
| Household Type | # Households | Household Size |
| Married-Couple | 1,198 (59.5%) | 3.48 |
| Single Male/Father | 249 (12.4%) | 4.26 |
| Single Female/Mother | 151 (7.5%) | 3.23 |
| Non-family | 417 (20.7%) | 2.17 |
| Total Households | 2,015 (100.0%) | 3.29 |
Household Size by Marriage Status in Wilton
Out of a total of 2,015 households in Wilton, 1,598 (79.3%) are family households, while 417 (20.7%) are nonfamily households. The most numerous type of family households are 2-person households, comprising 629, and the most common type of nonfamily households are 1-person households, comprising 226.
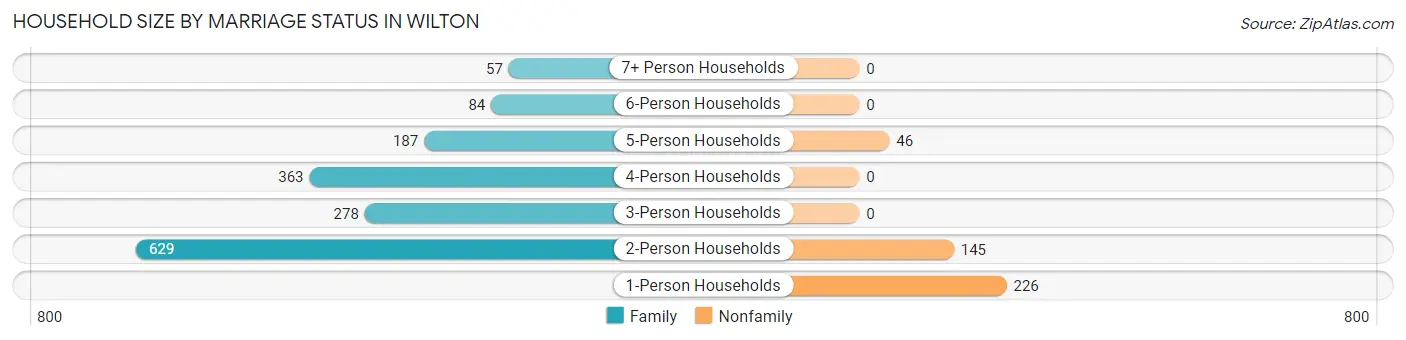
| Household Size | Family Households | Nonfamily Households |
| 1-Person Households | - | 226 (11.2%) |
| 2-Person Households | 629 (31.2%) | 145 (7.2%) |
| 3-Person Households | 278 (13.8%) | 0 (0.0%) |
| 4-Person Households | 363 (18.0%) | 0 (0.0%) |
| 5-Person Households | 187 (9.3%) | 46 (2.3%) |
| 6-Person Households | 84 (4.2%) | 0 (0.0%) |
| 7+ Person Households | 57 (2.8%) | 0 (0.0%) |
| Total | 1,598 (79.3%) | 417 (20.7%) |
Female Fertility in Wilton
Fertility by Age in Wilton
| Age Bracket | Women with Births | Births / 1,000 Women |
| 15 to 19 years | 0 (0.0%) | 0.0 |
| 20 to 34 years | 0 (0.0%) | 0.0 |
| 35 to 50 years | 0 (0.0%) | 0.0 |
| Total | 0 (0.0%) | 0.0 |
Fertility by Age by Marriage Status in Wilton
| Age Bracket | Married | Unmarried |
| 15 to 19 years | 0 (0.0%) | 0 (0.0%) |
| 20 to 34 years | 0 (0.0%) | 0 (0.0%) |
| 35 to 50 years | 0 (0.0%) | 0 (0.0%) |
| Total | 0 (0.0%) | 0 (0.0%) |
Fertility by Education in Wilton
| Educational Attainment | Women with Births | Births / 1,000 Women |
| Less than High School | 0 (0.0%) | 0.0 |
| High School Diploma | 0 (0.0%) | 0.0 |
| College or Associate's Degree | 0 (0.0%) | 0.0 |
| Bachelor's Degree | 0 (0.0%) | 0.0 |
| Graduate Degree | 0 (0.0%) | 0.0 |
| Total | 0 (0.0%) | 0.0 |
Fertility by Education by Marriage Status in Wilton
| Educational Attainment | Married | Unmarried |
| Less than High School | 0 (0.0%) | 0 (0.0%) |
| High School Diploma | 0 (0.0%) | 0 (0.0%) |
| College or Associate's Degree | 0 (0.0%) | 0 (0.0%) |
| Bachelor's Degree | 0 (0.0%) | 0 (0.0%) |
| Graduate Degree | 0 (0.0%) | 0 (0.0%) |
| Total | 0 (0.0%) | 0 (0.0%) |
Employment Characteristics in Wilton
Employment by Class of Employer in Wilton
Among the 2,884 employed individuals in Wilton, private company employees (1,323 | 45.9%), state government employees (514 | 17.8%), and local government employees (430 | 14.9%) make up the most common classes of employment.
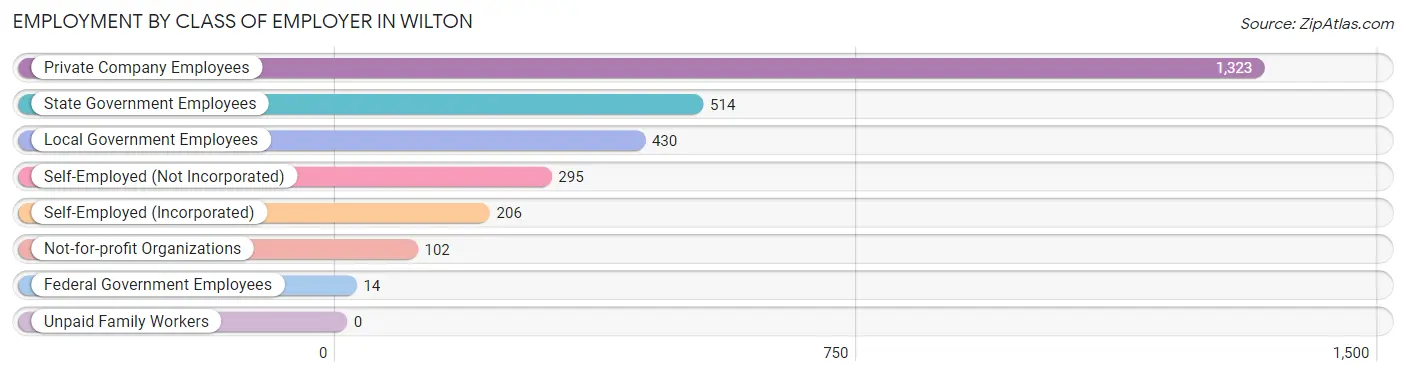
| Employer Class | # Employees | % Employees |
| Private Company Employees | 1,323 | 45.9% |
| Self-Employed (Incorporated) | 206 | 7.1% |
| Self-Employed (Not Incorporated) | 295 | 10.2% |
| Not-for-profit Organizations | 102 | 3.5% |
| Local Government Employees | 430 | 14.9% |
| State Government Employees | 514 | 17.8% |
| Federal Government Employees | 14 | 0.5% |
| Unpaid Family Workers | 0 | 0.0% |
| Total | 2,884 | 100.0% |
Employment Status by Age in Wilton
According to the labor force statistics for Wilton, out of the total population over 16 years of age (5,533), 56.2% or 3,110 individuals are in the labor force, with 1.7% or 53 of them unemployed. The age group with the highest labor force participation rate is 25 to 29 years, with 95.4% or 457 individuals in the labor force. Within the labor force, the 65 to 74 years age range has the highest percentage of unemployed individuals, with 8.6% or 15 of them being unemployed.
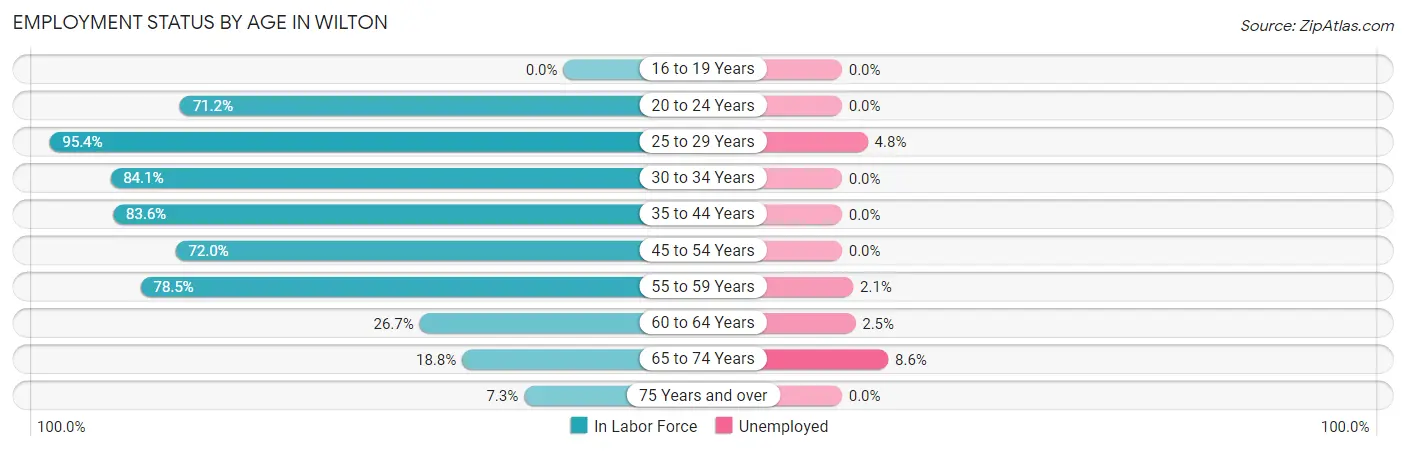
| Age Bracket | In Labor Force | Unemployed |
| 16 to 19 Years | 0 (0.0%) | 0 (0.0%) |
| 20 to 24 Years | 215 (71.2%) | 0 (0.0%) |
| 25 to 29 Years | 457 (95.4%) | 22 (4.8%) |
| 30 to 34 Years | 419 (84.1%) | 0 (0.0%) |
| 35 to 44 Years | 566 (83.6%) | 0 (0.0%) |
| 45 to 54 Years | 558 (72.0%) | 0 (0.0%) |
| 55 to 59 Years | 519 (78.5%) | 11 (2.1%) |
| 60 to 64 Years | 160 (26.7%) | 4 (2.5%) |
| 65 to 74 Years | 175 (18.8%) | 15 (8.6%) |
| 75 Years and over | 38 (7.3%) | 0 (0.0%) |
| Total | 3,110 (56.2%) | 53 (1.7%) |
Employment Status by Educational Attainment in Wilton
According to labor force statistics for Wilton, 72.6% of individuals (2,679) out of the total population between 25 and 64 years of age (3,690) are in the labor force, with 1.4% or 38 of them being unemployed. The group with the highest labor force participation rate are those with the educational attainment of bachelor's degree or higher, with 84.1% or 1,021 individuals in the labor force. Within the labor force, individuals with bachelor's degree or higher education have the highest percentage of unemployment, with 2.2% or 22 of them being unemployed.
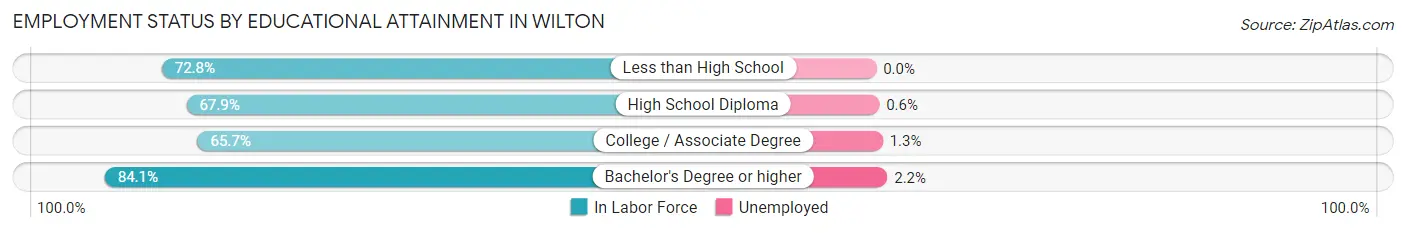
| Educational Attainment | In Labor Force | Unemployed |
| Less than High School | 75 (72.8%) | 0 (0.0%) |
| High School Diploma | 723 (67.9%) | 6 (0.6%) |
| College / Associate Degree | 859 (65.7%) | 17 (1.3%) |
| Bachelor's Degree or higher | 1,021 (84.1%) | 27 (2.2%) |
| Total | 2,679 (72.6%) | 52 (1.4%) |
Employment Occupations by Sex in Wilton
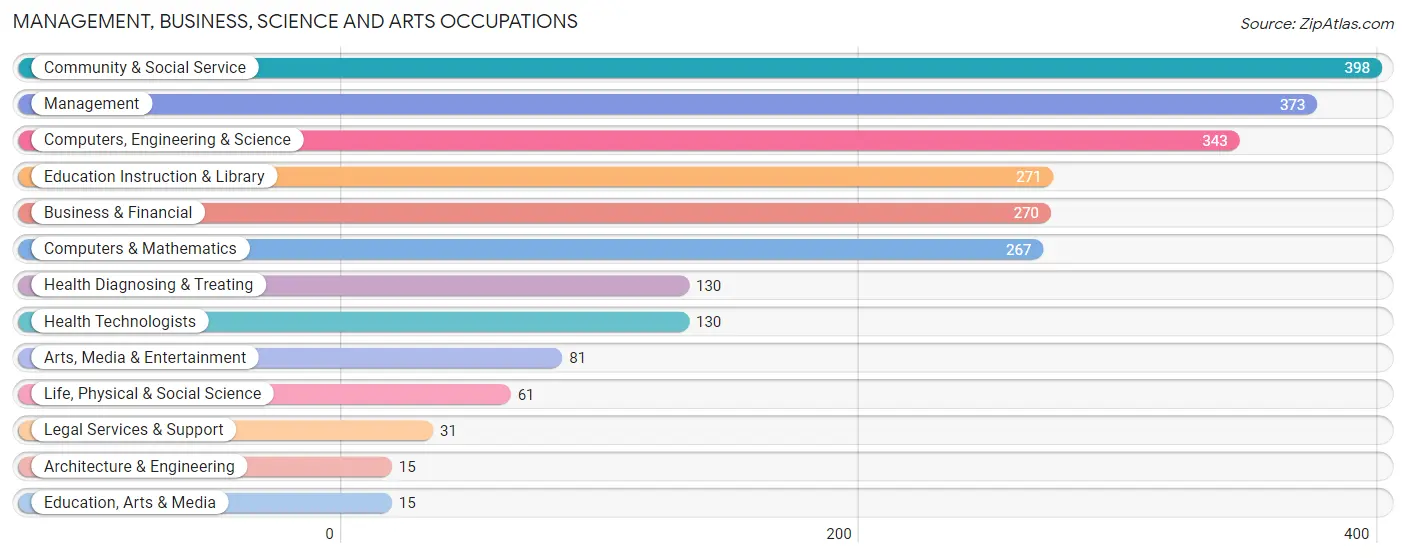
Management, Business, Science and Arts Occupations
The most common Management, Business, Science and Arts occupations in Wilton are Community & Social Service (398 | 13.0%), Management (373 | 12.2%), Computers, Engineering & Science (343 | 11.2%), Education Instruction & Library (271 | 8.9%), and Business & Financial (270 | 8.8%).
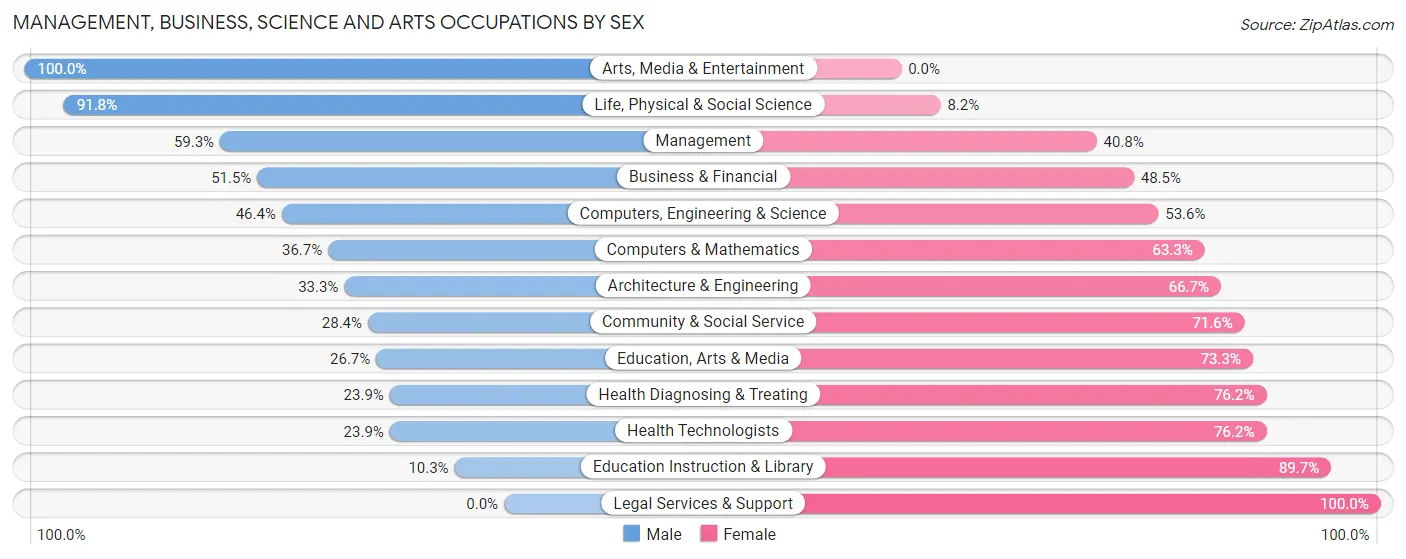
Management, Business, Science and Arts Occupations by Sex
Within the Management, Business, Science and Arts occupations in Wilton, the most male-oriented occupations are Arts, Media & Entertainment (100.0%), Life, Physical & Social Science (91.8%), and Management (59.3%), while the most female-oriented occupations are Legal Services & Support (100.0%), Education Instruction & Library (89.7%), and Health Diagnosing & Treating (76.1%).
| Occupation | Male | Female |
| Management | 221 (59.3%) | 152 (40.7%) |
| Business & Financial | 139 (51.5%) | 131 (48.5%) |
| Computers, Engineering & Science | 159 (46.4%) | 184 (53.6%) |
| Computers & Mathematics | 98 (36.7%) | 169 (63.3%) |
| Architecture & Engineering | 5 (33.3%) | 10 (66.7%) |
| Life, Physical & Social Science | 56 (91.8%) | 5 (8.2%) |
| Community & Social Service | 113 (28.4%) | 285 (71.6%) |
| Education, Arts & Media | 4 (26.7%) | 11 (73.3%) |
| Legal Services & Support | 0 (0.0%) | 31 (100.0%) |
| Education Instruction & Library | 28 (10.3%) | 243 (89.7%) |
| Arts, Media & Entertainment | 81 (100.0%) | 0 (0.0%) |
| Health Diagnosing & Treating | 31 (23.8%) | 99 (76.1%) |
| Health Technologists | 31 (23.8%) | 99 (76.1%) |
| Total (Category) | 663 (43.8%) | 851 (56.2%) |
| Total (Overall) | 1,667 (54.6%) | 1,388 (45.4%) |
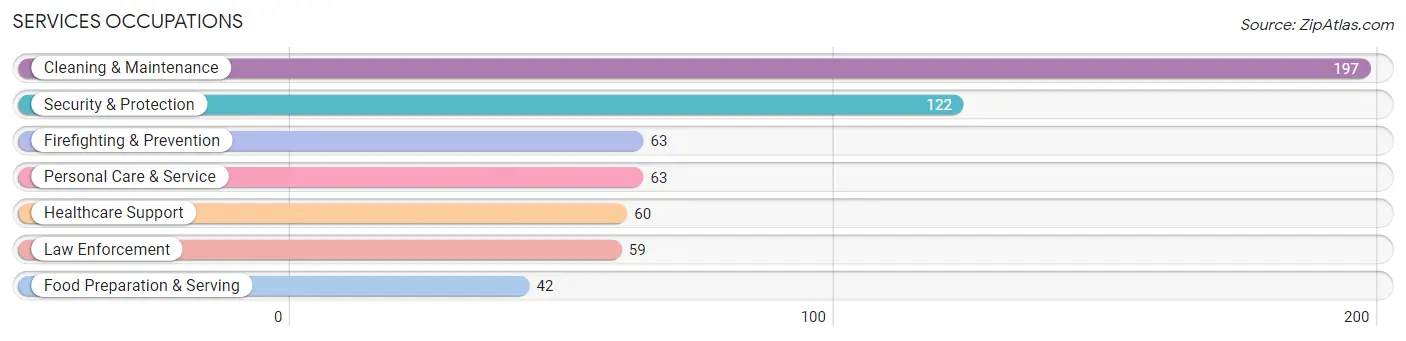
Services Occupations
The most common Services occupations in Wilton are Cleaning & Maintenance (197 | 6.5%), Security & Protection (122 | 4.0%), Firefighting & Prevention (63 | 2.1%), Personal Care & Service (63 | 2.1%), and Healthcare Support (60 | 2.0%).
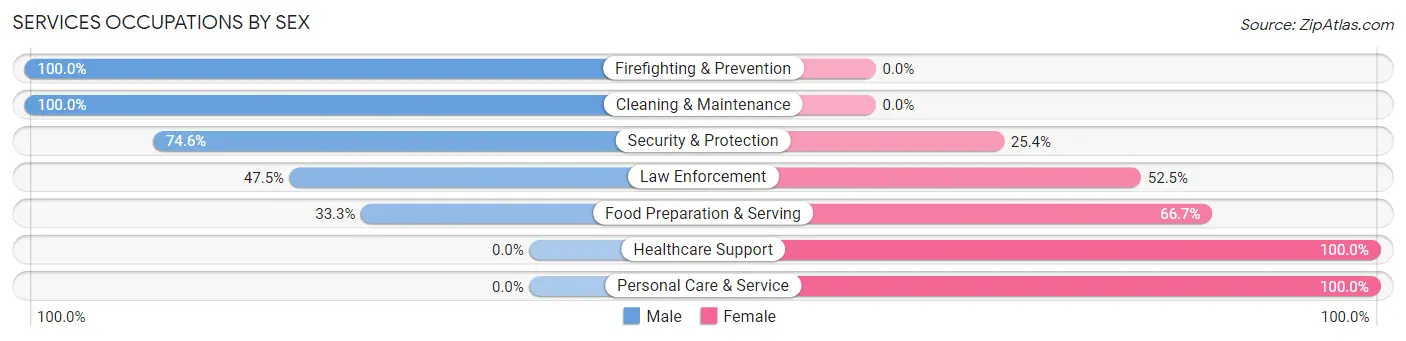
Services Occupations by Sex
Within the Services occupations in Wilton, the most male-oriented occupations are Firefighting & Prevention (100.0%), Cleaning & Maintenance (100.0%), and Security & Protection (74.6%), while the most female-oriented occupations are Healthcare Support (100.0%), Personal Care & Service (100.0%), and Food Preparation & Serving (66.7%).
| Occupation | Male | Female |
| Healthcare Support | 0 (0.0%) | 60 (100.0%) |
| Security & Protection | 91 (74.6%) | 31 (25.4%) |
| Firefighting & Prevention | 63 (100.0%) | 0 (0.0%) |
| Law Enforcement | 28 (47.5%) | 31 (52.5%) |
| Food Preparation & Serving | 14 (33.3%) | 28 (66.7%) |
| Cleaning & Maintenance | 197 (100.0%) | 0 (0.0%) |
| Personal Care & Service | 0 (0.0%) | 63 (100.0%) |
| Total (Category) | 302 (62.4%) | 182 (37.6%) |
| Total (Overall) | 1,667 (54.6%) | 1,388 (45.4%) |
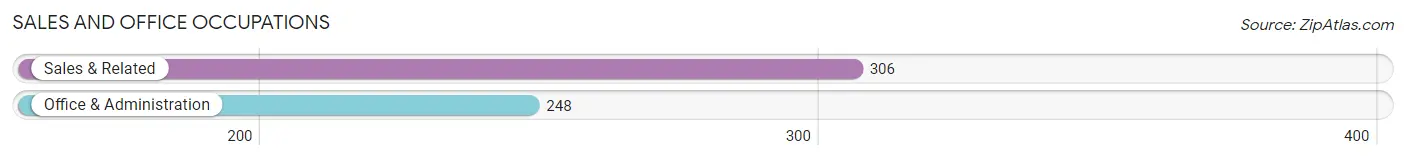
Sales and Office Occupations
The most common Sales and Office occupations in Wilton are Sales & Related (306 | 10.0%), and Office & Administration (248 | 8.1%).
Sales and Office Occupations by Sex
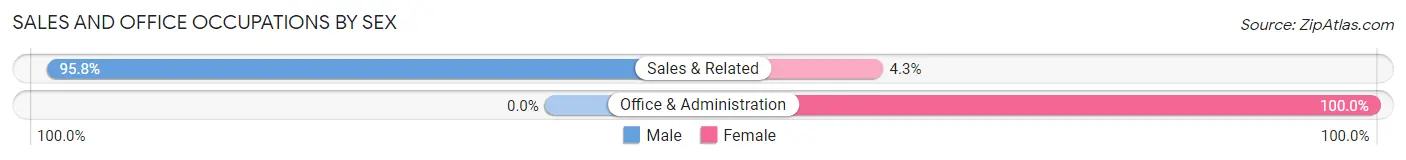
| Occupation | Male | Female |
| Sales & Related | 293 (95.8%) | 13 (4.3%) |
| Office & Administration | 0 (0.0%) | 248 (100.0%) |
| Total (Category) | 293 (52.9%) | 261 (47.1%) |
| Total (Overall) | 1,667 (54.6%) | 1,388 (45.4%) |
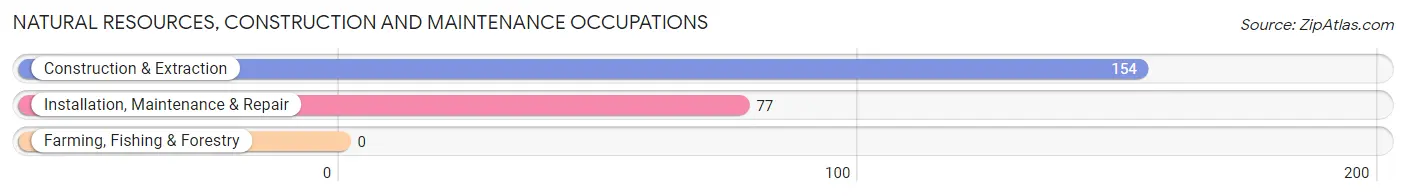
Natural Resources, Construction and Maintenance Occupations
The most common Natural Resources, Construction and Maintenance occupations in Wilton are Construction & Extraction (154 | 5.0%), and Installation, Maintenance & Repair (77 | 2.5%).
Natural Resources, Construction and Maintenance Occupations by Sex
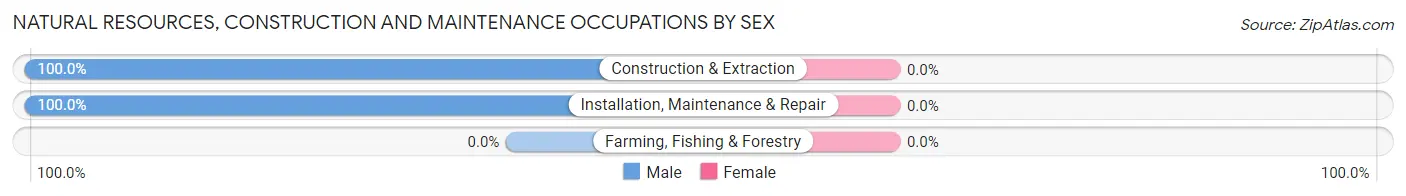
| Occupation | Male | Female |
| Farming, Fishing & Forestry | 0 (0.0%) | 0 (0.0%) |
| Construction & Extraction | 154 (100.0%) | 0 (0.0%) |
| Installation, Maintenance & Repair | 77 (100.0%) | 0 (0.0%) |
| Total (Category) | 231 (100.0%) | 0 (0.0%) |
| Total (Overall) | 1,667 (54.6%) | 1,388 (45.4%) |
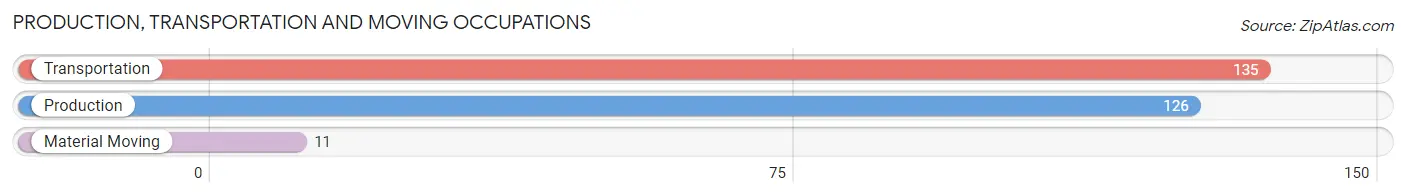
Production, Transportation and Moving Occupations
The most common Production, Transportation and Moving occupations in Wilton are Transportation (135 | 4.4%), Production (126 | 4.1%), and Material Moving (11 | 0.4%).
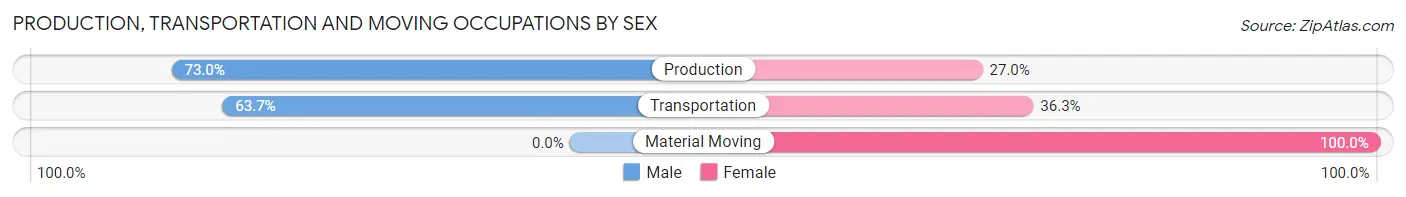
Production, Transportation and Moving Occupations by Sex
| Occupation | Male | Female |
| Production | 92 (73.0%) | 34 (27.0%) |
| Transportation | 86 (63.7%) | 49 (36.3%) |
| Material Moving | 0 (0.0%) | 11 (100.0%) |
| Total (Category) | 178 (65.4%) | 94 (34.6%) |
| Total (Overall) | 1,667 (54.6%) | 1,388 (45.4%) |
Employment Industries by Sex in Wilton
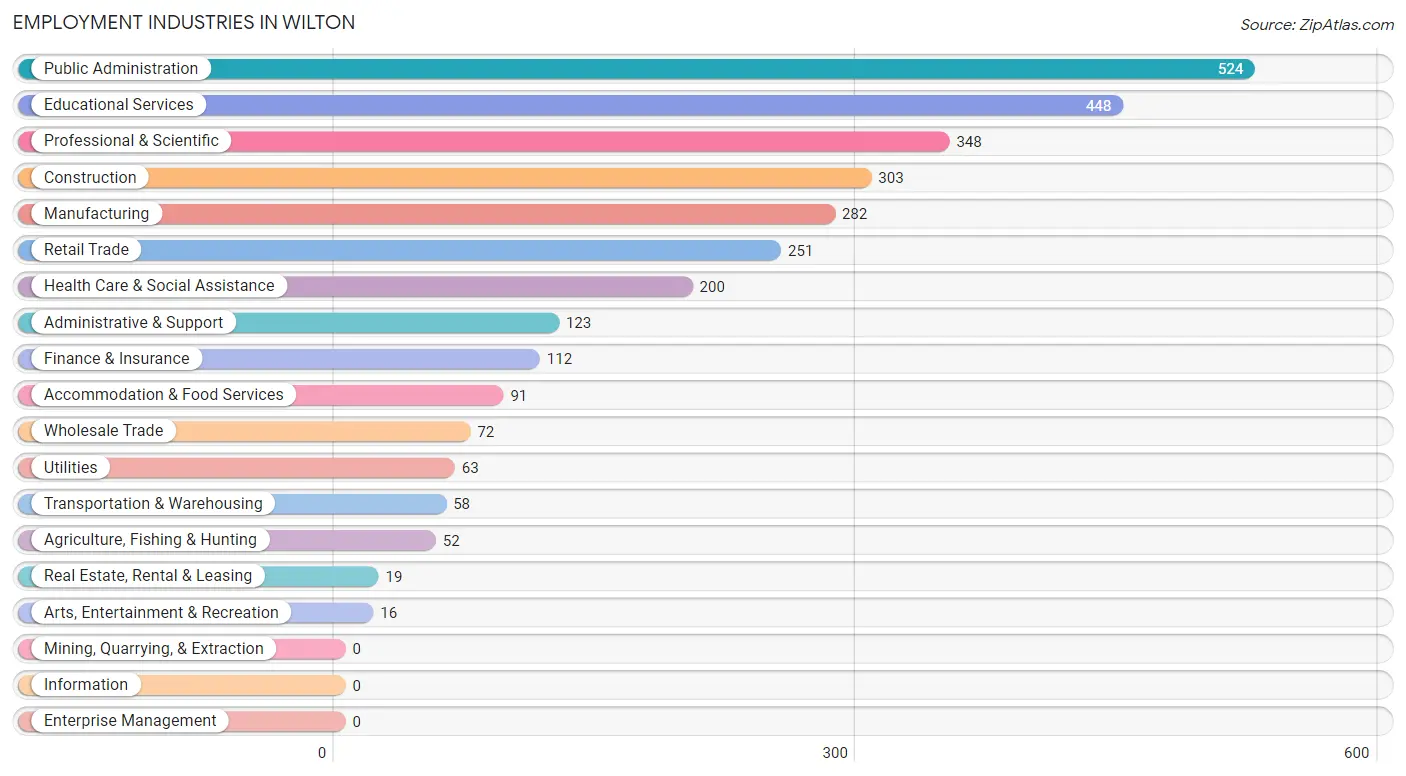
Employment Industries in Wilton
The major employment industries in Wilton include Public Administration (524 | 17.2%), Educational Services (448 | 14.7%), Professional & Scientific (348 | 11.4%), Construction (303 | 9.9%), and Manufacturing (282 | 9.2%).
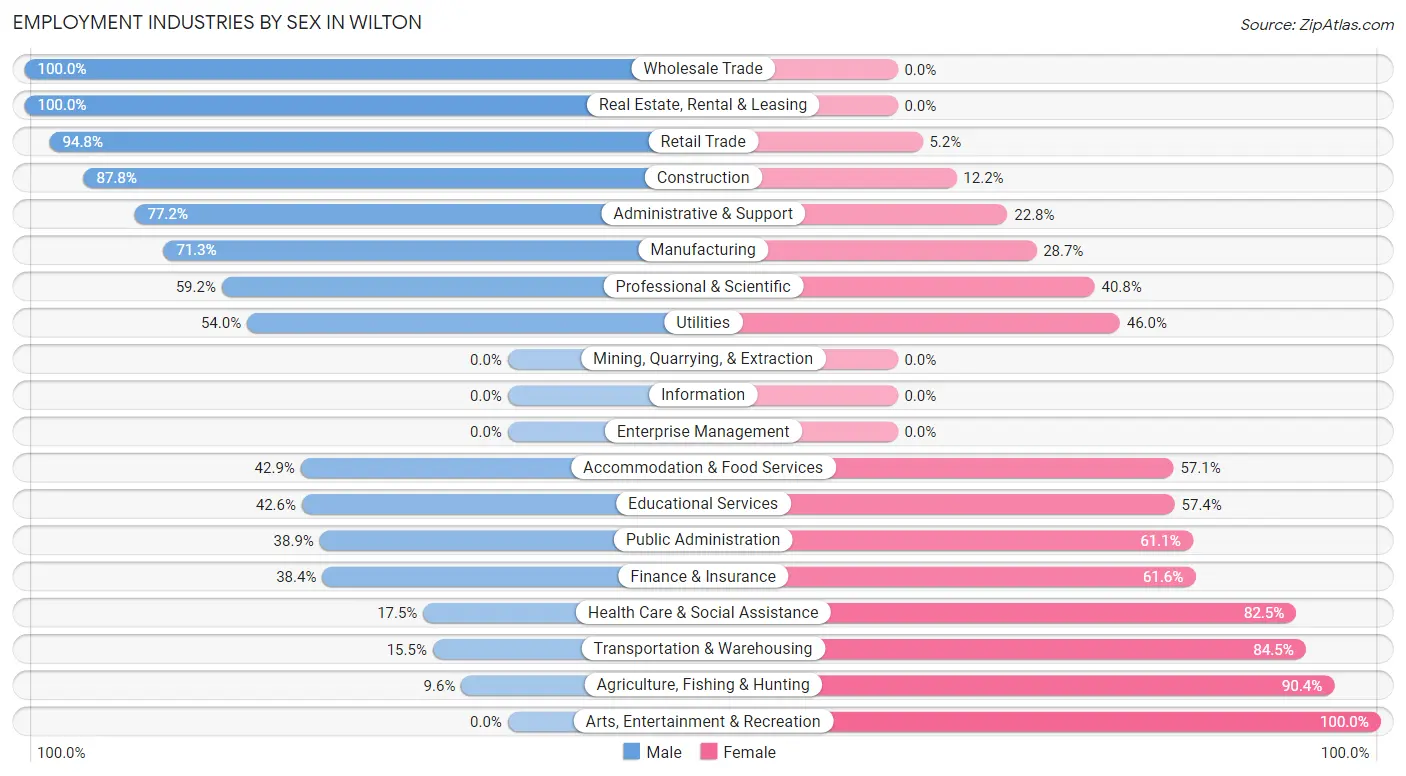
Employment Industries by Sex in Wilton
The Wilton industries that see more men than women are Wholesale Trade (100.0%), Real Estate, Rental & Leasing (100.0%), and Retail Trade (94.8%), whereas the industries that tend to have a higher number of women are Arts, Entertainment & Recreation (100.0%), Agriculture, Fishing & Hunting (90.4%), and Transportation & Warehousing (84.5%).
| Industry | Male | Female |
| Agriculture, Fishing & Hunting | 5 (9.6%) | 47 (90.4%) |
| Mining, Quarrying, & Extraction | 0 (0.0%) | 0 (0.0%) |
| Construction | 266 (87.8%) | 37 (12.2%) |
| Manufacturing | 201 (71.3%) | 81 (28.7%) |
| Wholesale Trade | 72 (100.0%) | 0 (0.0%) |
| Retail Trade | 238 (94.8%) | 13 (5.2%) |
| Transportation & Warehousing | 9 (15.5%) | 49 (84.5%) |
| Utilities | 34 (54.0%) | 29 (46.0%) |
| Information | 0 (0.0%) | 0 (0.0%) |
| Finance & Insurance | 43 (38.4%) | 69 (61.6%) |
| Real Estate, Rental & Leasing | 19 (100.0%) | 0 (0.0%) |
| Professional & Scientific | 206 (59.2%) | 142 (40.8%) |
| Enterprise Management | 0 (0.0%) | 0 (0.0%) |
| Administrative & Support | 95 (77.2%) | 28 (22.8%) |
| Educational Services | 191 (42.6%) | 257 (57.4%) |
| Health Care & Social Assistance | 35 (17.5%) | 165 (82.5%) |
| Arts, Entertainment & Recreation | 0 (0.0%) | 16 (100.0%) |
| Accommodation & Food Services | 39 (42.9%) | 52 (57.1%) |
| Public Administration | 204 (38.9%) | 320 (61.1%) |
| Total | 1,667 (54.6%) | 1,388 (45.4%) |
Education in Wilton
School Enrollment in Wilton
The most common levels of schooling among the 1,447 students in Wilton are college / undergraduate (393 | 27.2%), middle school (392 | 27.1%), and elementary school (285 | 19.7%).
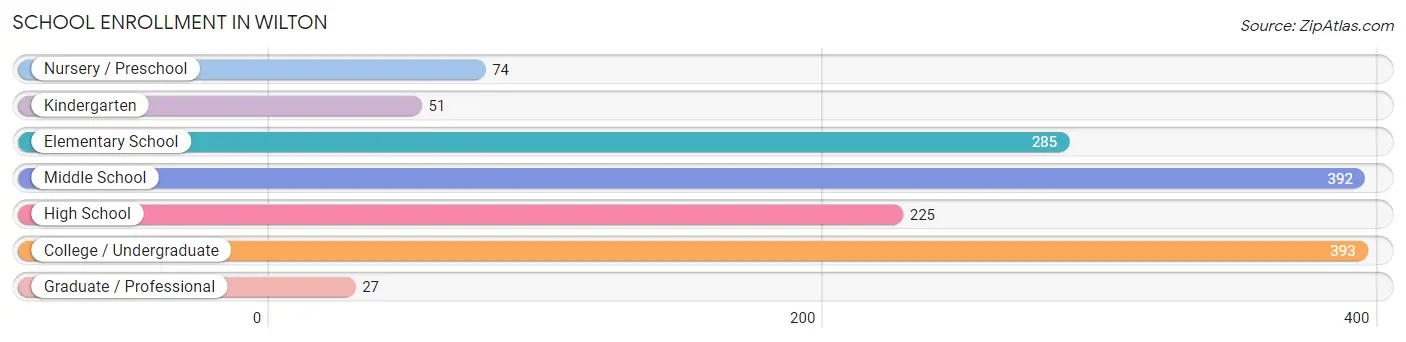
| School Level | # Students | % Students |
| Nursery / Preschool | 74 | 5.1% |
| Kindergarten | 51 | 3.5% |
| Elementary School | 285 | 19.7% |
| Middle School | 392 | 27.1% |
| High School | 225 | 15.5% |
| College / Undergraduate | 393 | 27.2% |
| Graduate / Professional | 27 | 1.9% |
| Total | 1,447 | 100.0% |
School Enrollment by Age by Funding Source in Wilton
Out of a total of 1,447 students who are enrolled in schools in Wilton, 493 (34.1%) attend a private institution, while the remaining 954 (65.9%) are enrolled in public schools. The age group of 35 years and over has the highest likelihood of being enrolled in private schools, with 62 (92.5% in the age bracket) enrolled. Conversely, the age group of 18 to 19 year olds has the lowest likelihood of being enrolled in a private school, with 19 (100.0% in the age bracket) attending a public institution.
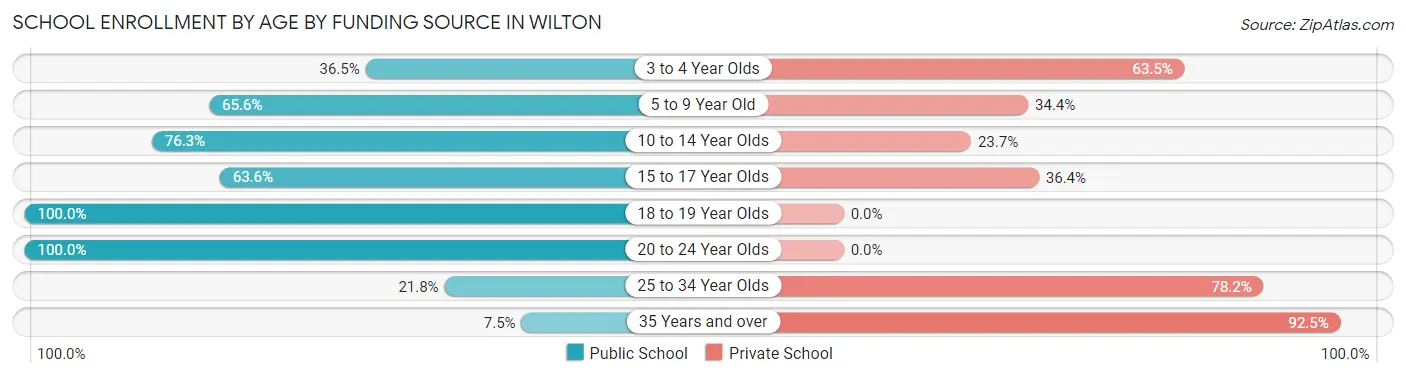
| Age Bracket | Public School | Private School |
| 3 to 4 Year Olds | 27 (36.5%) | 47 (63.5%) |
| 5 to 9 Year Old | 170 (65.6%) | 89 (34.4%) |
| 10 to 14 Year Olds | 370 (76.3%) | 115 (23.7%) |
| 15 to 17 Year Olds | 133 (63.6%) | 76 (36.4%) |
| 18 to 19 Year Olds | 19 (100.0%) | 0 (0.0%) |
| 20 to 24 Year Olds | 201 (100.0%) | 0 (0.0%) |
| 25 to 34 Year Olds | 29 (21.8%) | 104 (78.2%) |
| 35 Years and over | 5 (7.5%) | 62 (92.5%) |
| Total | 954 (65.9%) | 493 (34.1%) |
Educational Attainment by Field of Study in Wilton
Social sciences (332 | 18.3%), business (287 | 15.8%), science & technology (262 | 14.4%), education (168 | 9.3%), and bio, nature & agricultural (126 | 7.0%) are the most common fields of study among 1,813 individuals in Wilton who have obtained a bachelor's degree or higher.
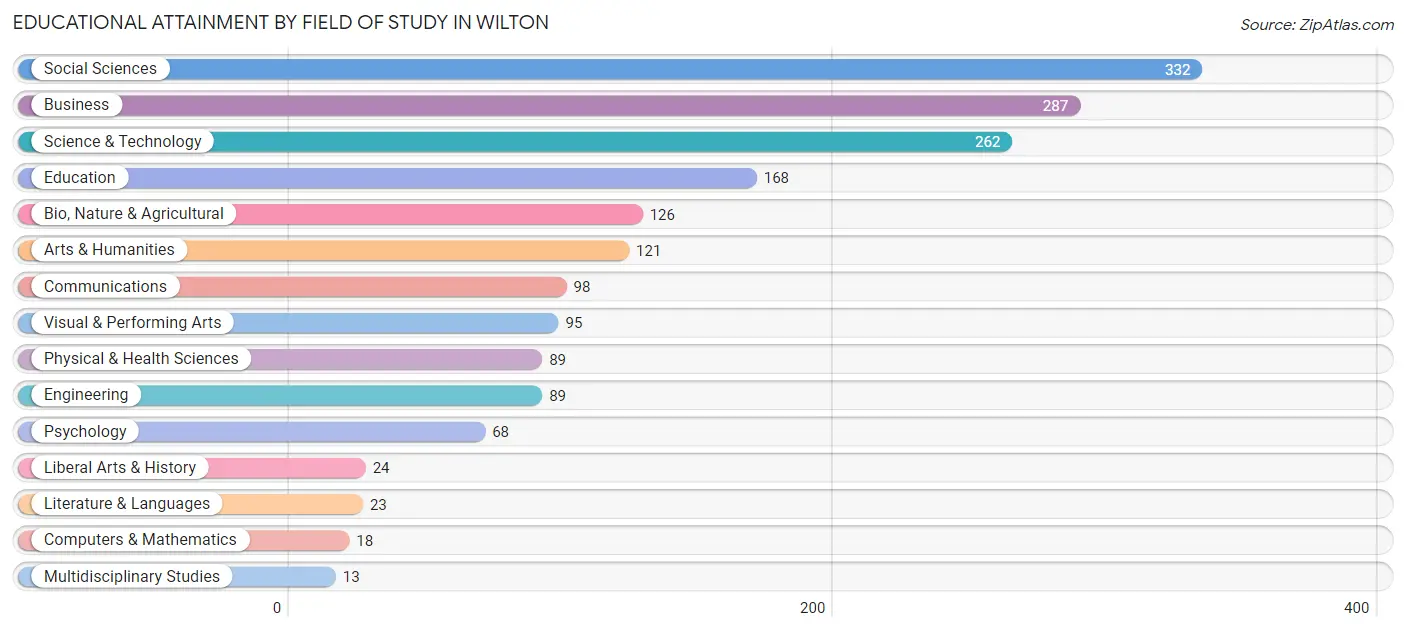
| Field of Study | # Graduates | % Graduates |
| Computers & Mathematics | 18 | 1.0% |
| Bio, Nature & Agricultural | 126 | 7.0% |
| Physical & Health Sciences | 89 | 4.9% |
| Psychology | 68 | 3.7% |
| Social Sciences | 332 | 18.3% |
| Engineering | 89 | 4.9% |
| Multidisciplinary Studies | 13 | 0.7% |
| Science & Technology | 262 | 14.4% |
| Business | 287 | 15.8% |
| Education | 168 | 9.3% |
| Literature & Languages | 23 | 1.3% |
| Liberal Arts & History | 24 | 1.3% |
| Visual & Performing Arts | 95 | 5.2% |
| Communications | 98 | 5.4% |
| Arts & Humanities | 121 | 6.7% |
| Total | 1,813 | 100.0% |
Transportation & Commute in Wilton
Vehicle Availability by Sex in Wilton
The most prevalent vehicle ownership categories in Wilton are males with 5 or more vehicles (612, accounting for 38.0%) and females with 5 or more vehicles (330, making up 48.0%).
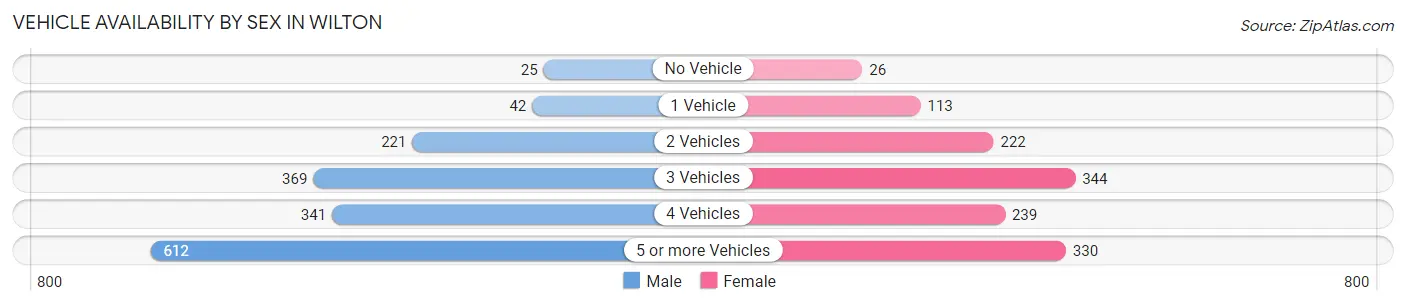
| Vehicles Available | Male | Female |
| No Vehicle | 25 (1.5%) | 26 (2.0%) |
| 1 Vehicle | 42 (2.6%) | 113 (8.9%) |
| 2 Vehicles | 221 (13.7%) | 222 (17.4%) |
| 3 Vehicles | 369 (22.9%) | 344 (27.0%) |
| 4 Vehicles | 341 (21.2%) | 239 (18.8%) |
| 5 or more Vehicles | 612 (38.0%) | 330 (25.9%) |
| Total | 1,610 (100.0%) | 1,274 (100.0%) |
Commute Time in Wilton
The most frequently occuring commute durations in Wilton are 45 to 59 minutes (543 commuters, 22.2%), 20 to 24 minutes (417 commuters, 17.0%), and 30 to 34 minutes (377 commuters, 15.4%).
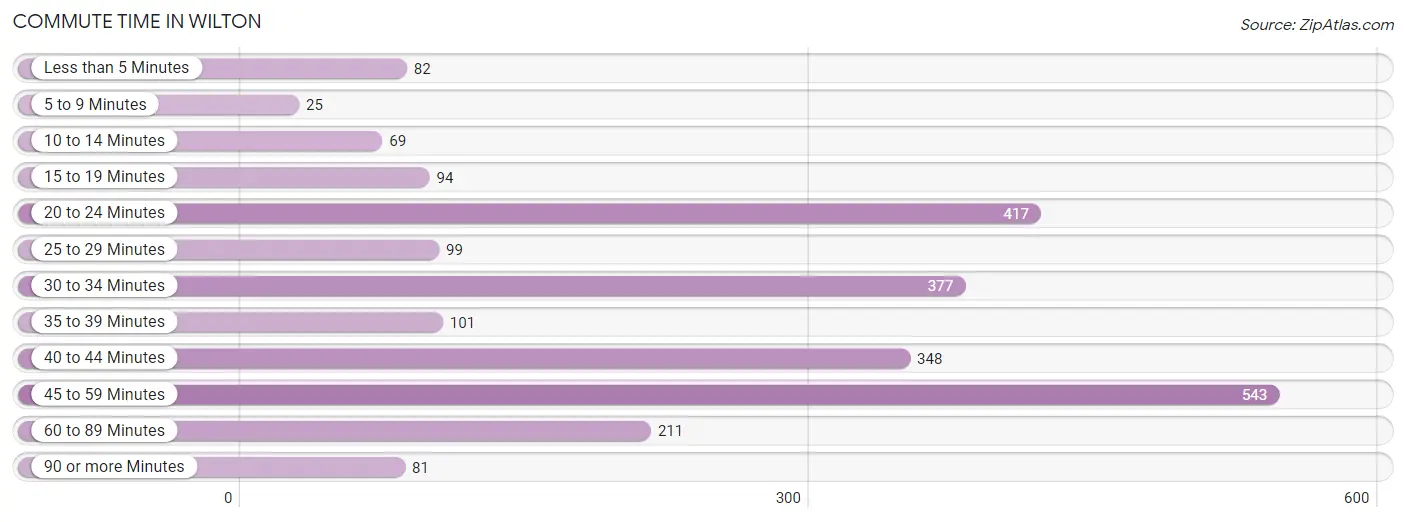
| Commute Time | # Commuters | % Commuters |
| Less than 5 Minutes | 82 | 3.4% |
| 5 to 9 Minutes | 25 | 1.0% |
| 10 to 14 Minutes | 69 | 2.8% |
| 15 to 19 Minutes | 94 | 3.8% |
| 20 to 24 Minutes | 417 | 17.0% |
| 25 to 29 Minutes | 99 | 4.1% |
| 30 to 34 Minutes | 377 | 15.4% |
| 35 to 39 Minutes | 101 | 4.1% |
| 40 to 44 Minutes | 348 | 14.2% |
| 45 to 59 Minutes | 543 | 22.2% |
| 60 to 89 Minutes | 211 | 8.6% |
| 90 or more Minutes | 81 | 3.3% |
Commute Time by Sex in Wilton
The most common commute times in Wilton are 45 to 59 minutes (321 commuters, 23.1%) for males and 45 to 59 minutes (222 commuters, 21.0%) for females.
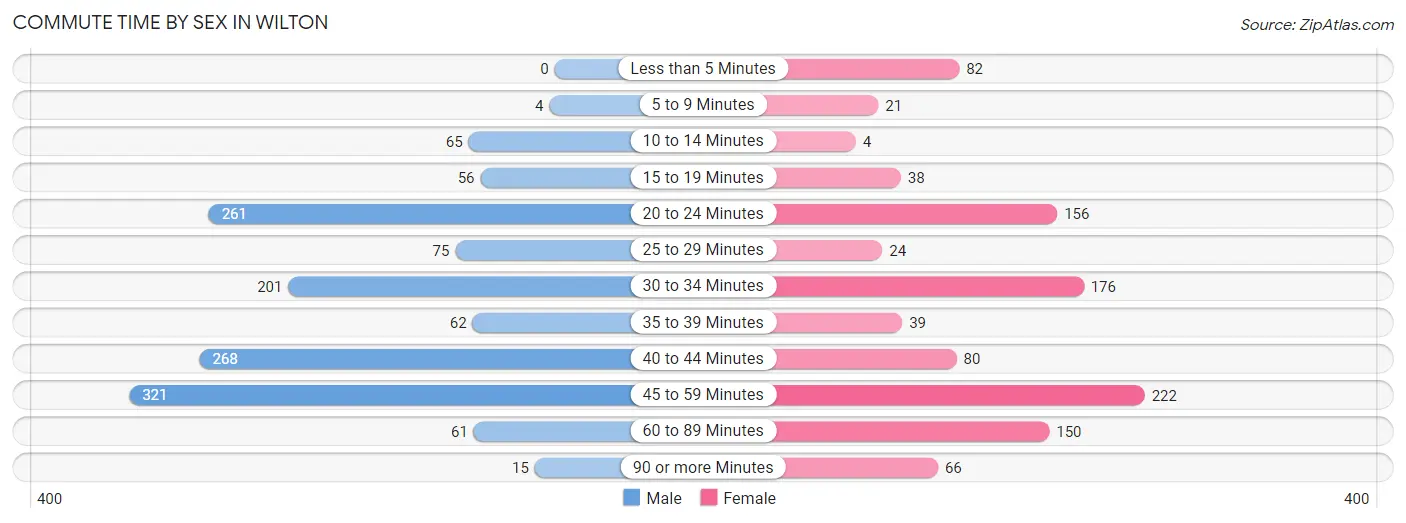
| Commute Time | Male | Female |
| Less than 5 Minutes | 0 (0.0%) | 82 (7.7%) |
| 5 to 9 Minutes | 4 (0.3%) | 21 (2.0%) |
| 10 to 14 Minutes | 65 (4.7%) | 4 (0.4%) |
| 15 to 19 Minutes | 56 (4.0%) | 38 (3.6%) |
| 20 to 24 Minutes | 261 (18.8%) | 156 (14.7%) |
| 25 to 29 Minutes | 75 (5.4%) | 24 (2.3%) |
| 30 to 34 Minutes | 201 (14.5%) | 176 (16.6%) |
| 35 to 39 Minutes | 62 (4.5%) | 39 (3.7%) |
| 40 to 44 Minutes | 268 (19.3%) | 80 (7.6%) |
| 45 to 59 Minutes | 321 (23.1%) | 222 (21.0%) |
| 60 to 89 Minutes | 61 (4.4%) | 150 (14.2%) |
| 90 or more Minutes | 15 (1.1%) | 66 (6.2%) |
Time of Departure to Work by Sex in Wilton
The most frequent times of departure to work in Wilton are 6:00 AM to 6:29 AM (269, 19.4%) for males and 7:00 AM to 7:29 AM (175, 16.5%) for females.
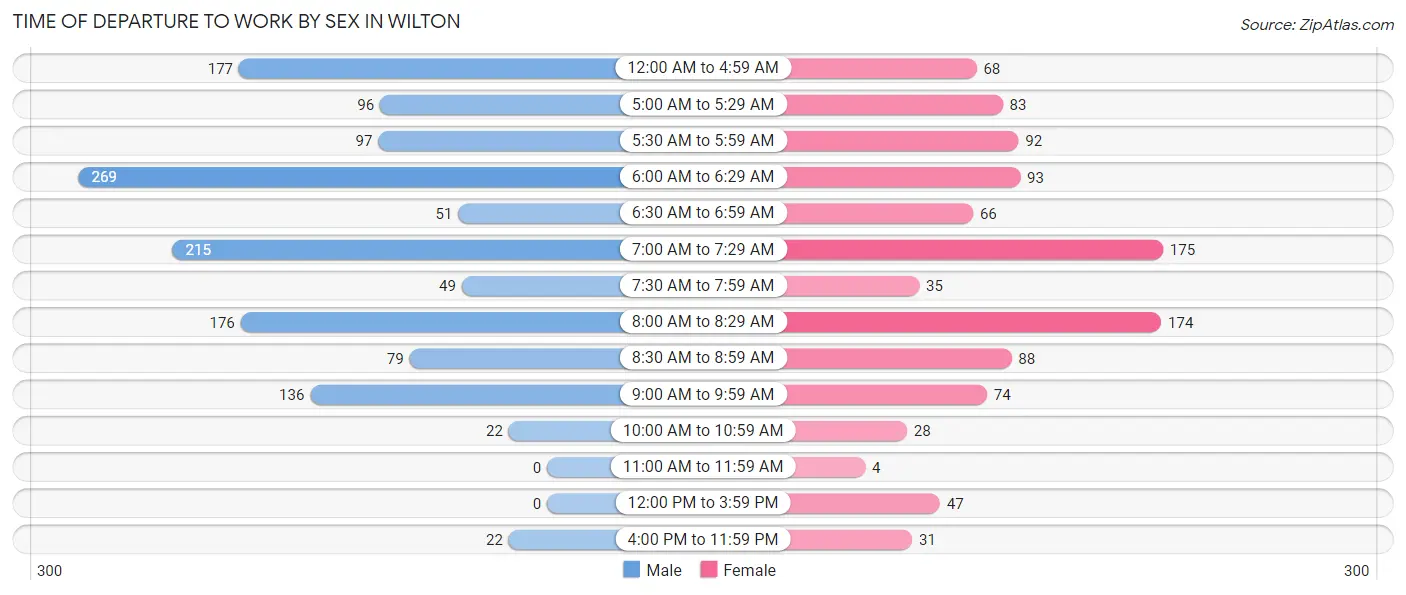
| Time of Departure | Male | Female |
| 12:00 AM to 4:59 AM | 177 (12.7%) | 68 (6.4%) |
| 5:00 AM to 5:29 AM | 96 (6.9%) | 83 (7.8%) |
| 5:30 AM to 5:59 AM | 97 (7.0%) | 92 (8.7%) |
| 6:00 AM to 6:29 AM | 269 (19.4%) | 93 (8.8%) |
| 6:30 AM to 6:59 AM | 51 (3.7%) | 66 (6.2%) |
| 7:00 AM to 7:29 AM | 215 (15.5%) | 175 (16.5%) |
| 7:30 AM to 7:59 AM | 49 (3.5%) | 35 (3.3%) |
| 8:00 AM to 8:29 AM | 176 (12.7%) | 174 (16.5%) |
| 8:30 AM to 8:59 AM | 79 (5.7%) | 88 (8.3%) |
| 9:00 AM to 9:59 AM | 136 (9.8%) | 74 (7.0%) |
| 10:00 AM to 10:59 AM | 22 (1.6%) | 28 (2.6%) |
| 11:00 AM to 11:59 AM | 0 (0.0%) | 4 (0.4%) |
| 12:00 PM to 3:59 PM | 0 (0.0%) | 47 (4.4%) |
| 4:00 PM to 11:59 PM | 22 (1.6%) | 31 (2.9%) |
| Total | 1,389 (100.0%) | 1,058 (100.0%) |
Housing Occupancy in Wilton
Occupancy by Ownership in Wilton
Of the total 2,015 dwellings in Wilton, owner-occupied units account for 1,797 (89.2%), while renter-occupied units make up 218 (10.8%).
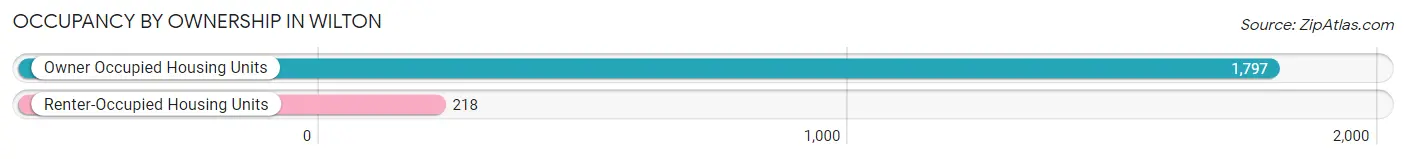
| Occupancy | # Housing Units | % Housing Units |
| Owner Occupied Housing Units | 1,797 | 89.2% |
| Renter-Occupied Housing Units | 218 | 10.8% |
| Total Occupied Housing Units | 2,015 | 100.0% |
Occupancy by Household Size in Wilton
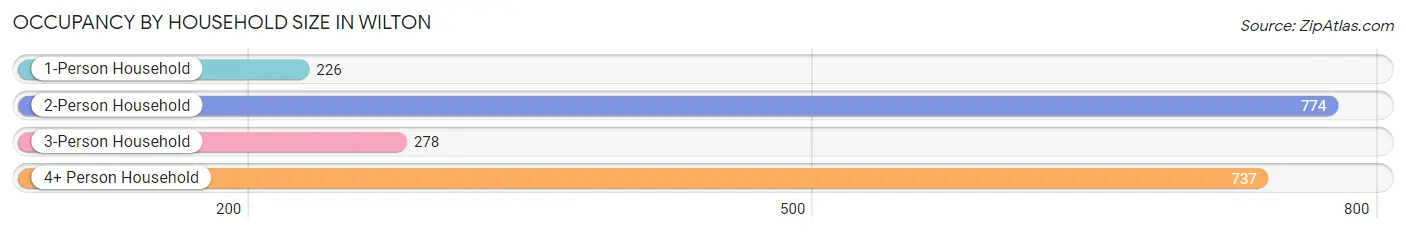
| Household Size | # Housing Units | % Housing Units |
| 1-Person Household | 226 | 11.2% |
| 2-Person Household | 774 | 38.4% |
| 3-Person Household | 278 | 13.8% |
| 4+ Person Household | 737 | 36.6% |
| Total Housing Units | 2,015 | 100.0% |
Occupancy by Ownership by Household Size in Wilton
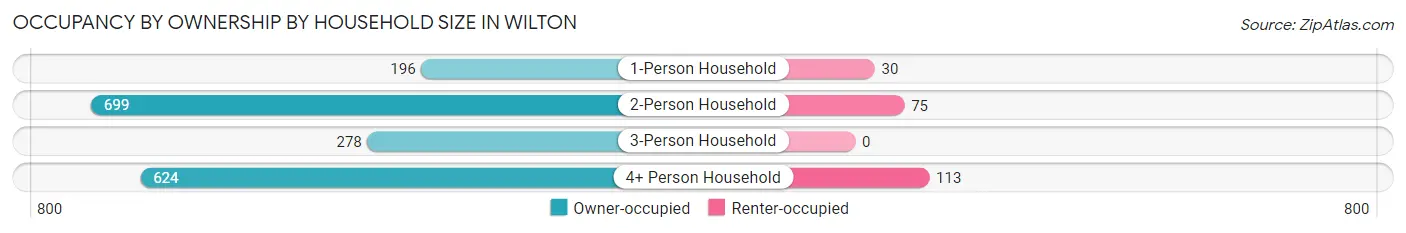
| Household Size | Owner-occupied | Renter-occupied |
| 1-Person Household | 196 (86.7%) | 30 (13.3%) |
| 2-Person Household | 699 (90.3%) | 75 (9.7%) |
| 3-Person Household | 278 (100.0%) | 0 (0.0%) |
| 4+ Person Household | 624 (84.7%) | 113 (15.3%) |
| Total Housing Units | 1,797 (89.2%) | 218 (10.8%) |
Occupancy by Educational Attainment in Wilton
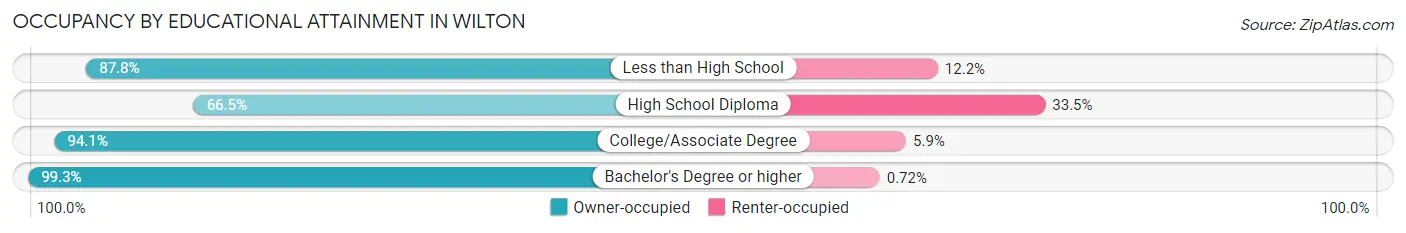
| Household Size | Owner-occupied | Renter-occupied |
| Less than High School | 43 (87.8%) | 6 (12.2%) |
| High School Diploma | 317 (66.5%) | 160 (33.5%) |
| College/Associate Degree | 744 (94.1%) | 47 (5.9%) |
| Bachelor's Degree or higher | 693 (99.3%) | 5 (0.7%) |
Occupancy by Age of Householder in Wilton
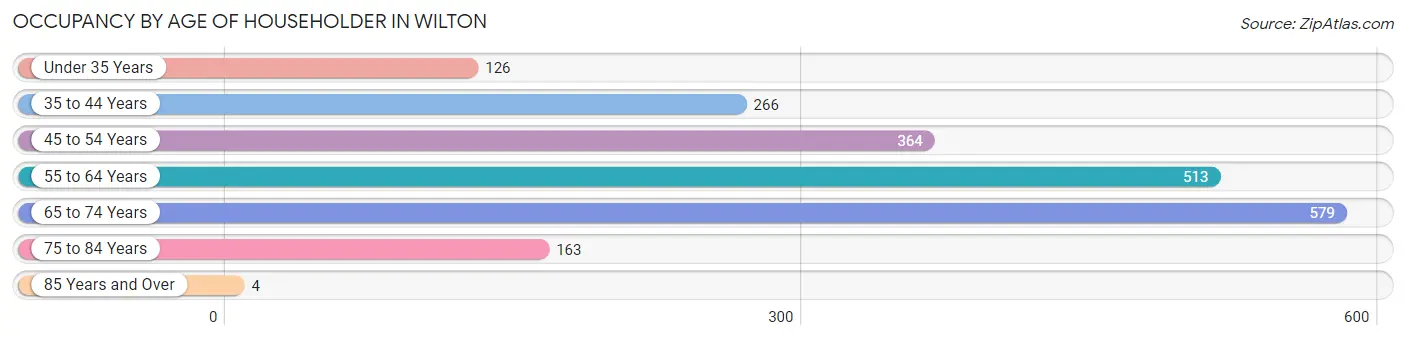
| Age Bracket | # Households | % Households |
| Under 35 Years | 126 | 6.2% |
| 35 to 44 Years | 266 | 13.2% |
| 45 to 54 Years | 364 | 18.1% |
| 55 to 64 Years | 513 | 25.5% |
| 65 to 74 Years | 579 | 28.7% |
| 75 to 84 Years | 163 | 8.1% |
| 85 Years and Over | 4 | 0.2% |
| Total | 2,015 | 100.0% |
Housing Finances in Wilton
Median Income by Occupancy in Wilton
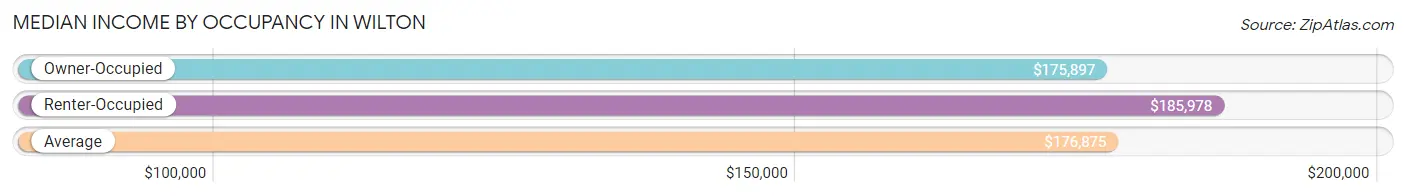
| Occupancy Type | # Households | Median Income |
| Owner-Occupied | 1,797 (89.2%) | $175,897 |
| Renter-Occupied | 218 (10.8%) | $185,978 |
| Average | 2,015 (100.0%) | $176,875 |
Occupancy by Householder Income Bracket in Wilton
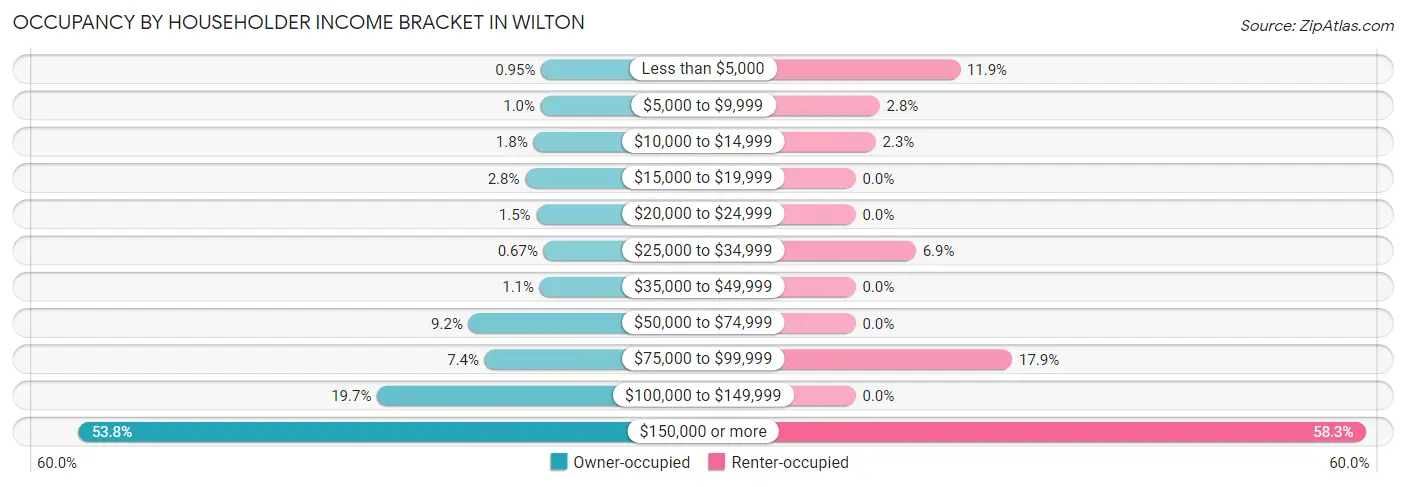
| Income Bracket | Owner-occupied | Renter-occupied |
| Less than $5,000 | 17 (0.9%) | 26 (11.9%) |
| $5,000 to $9,999 | 18 (1.0%) | 6 (2.8%) |
| $10,000 to $14,999 | 33 (1.8%) | 5 (2.3%) |
| $15,000 to $19,999 | 50 (2.8%) | 0 (0.0%) |
| $20,000 to $24,999 | 27 (1.5%) | 0 (0.0%) |
| $25,000 to $34,999 | 12 (0.7%) | 15 (6.9%) |
| $35,000 to $49,999 | 20 (1.1%) | 0 (0.0%) |
| $50,000 to $74,999 | 166 (9.2%) | 0 (0.0%) |
| $75,000 to $99,999 | 133 (7.4%) | 39 (17.9%) |
| $100,000 to $149,999 | 354 (19.7%) | 0 (0.0%) |
| $150,000 or more | 967 (53.8%) | 127 (58.3%) |
| Total | 1,797 (100.0%) | 218 (100.0%) |
Monthly Housing Cost Tiers in Wilton
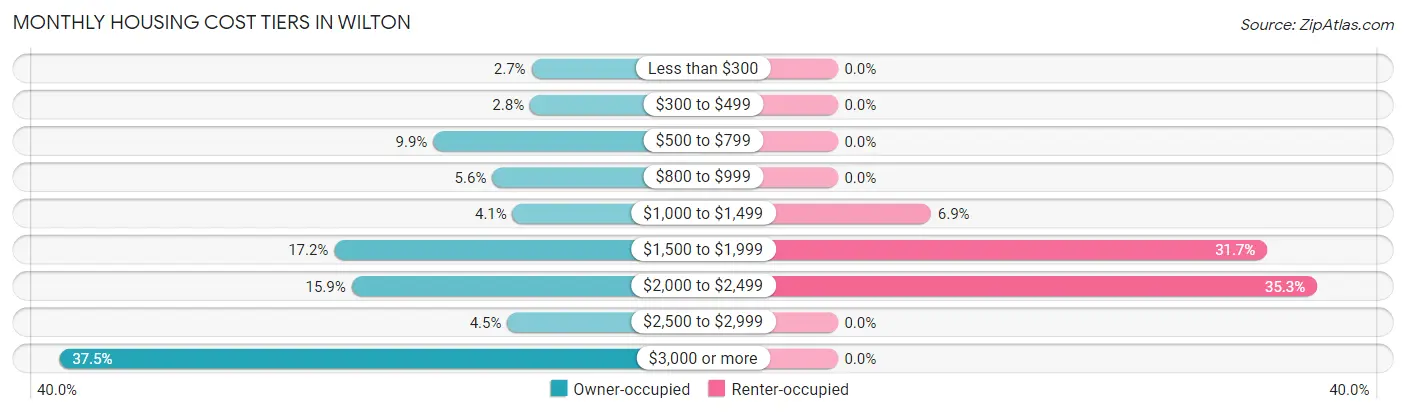
| Monthly Cost | Owner-occupied | Renter-occupied |
| Less than $300 | 48 (2.7%) | 0 (0.0%) |
| $300 to $499 | 50 (2.8%) | 0 (0.0%) |
| $500 to $799 | 178 (9.9%) | 0 (0.0%) |
| $800 to $999 | 100 (5.6%) | 0 (0.0%) |
| $1,000 to $1,499 | 73 (4.1%) | 15 (6.9%) |
| $1,500 to $1,999 | 309 (17.2%) | 69 (31.7%) |
| $2,000 to $2,499 | 286 (15.9%) | 77 (35.3%) |
| $2,500 to $2,999 | 80 (4.4%) | 0 (0.0%) |
| $3,000 or more | 673 (37.4%) | 0 (0.0%) |
| Total | 1,797 (100.0%) | 218 (100.0%) |
Physical Housing Characteristics in Wilton
Housing Structures in Wilton
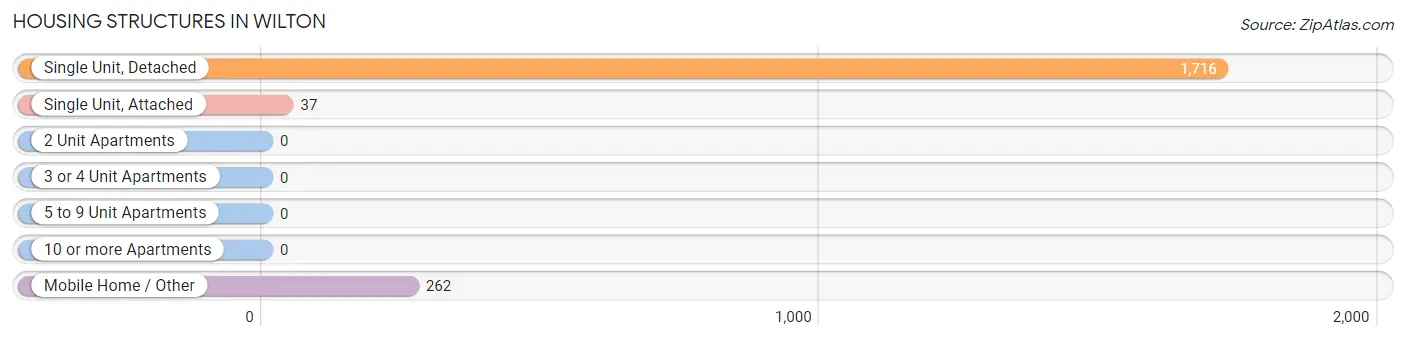
| Structure Type | # Housing Units | % Housing Units |
| Single Unit, Detached | 1,716 | 85.2% |
| Single Unit, Attached | 37 | 1.8% |
| 2 Unit Apartments | 0 | 0.0% |
| 3 or 4 Unit Apartments | 0 | 0.0% |
| 5 to 9 Unit Apartments | 0 | 0.0% |
| 10 or more Apartments | 0 | 0.0% |
| Mobile Home / Other | 262 | 13.0% |
| Total | 2,015 | 100.0% |
Housing Structures by Occupancy in Wilton
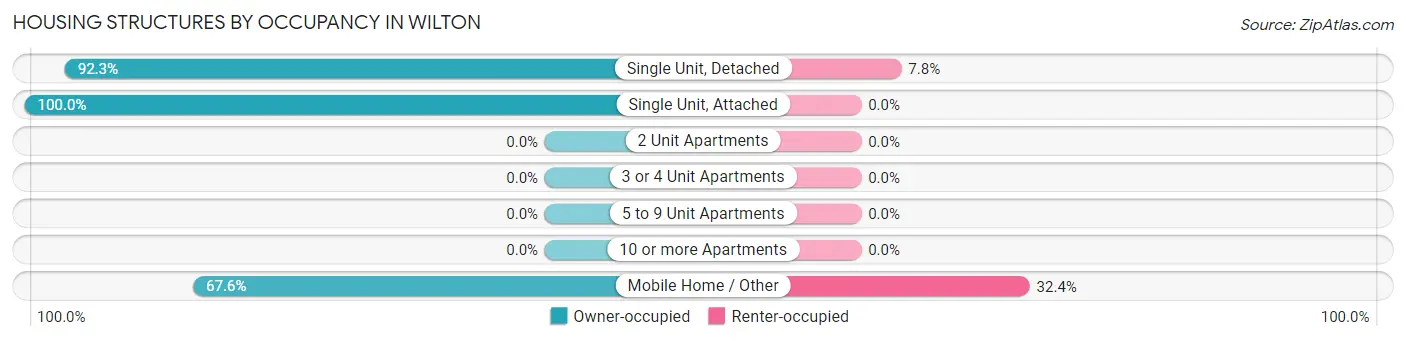
| Structure Type | Owner-occupied | Renter-occupied |
| Single Unit, Detached | 1,583 (92.2%) | 133 (7.7%) |
| Single Unit, Attached | 37 (100.0%) | 0 (0.0%) |
| 2 Unit Apartments | 0 (0.0%) | 0 (0.0%) |
| 3 or 4 Unit Apartments | 0 (0.0%) | 0 (0.0%) |
| 5 to 9 Unit Apartments | 0 (0.0%) | 0 (0.0%) |
| 10 or more Apartments | 0 (0.0%) | 0 (0.0%) |
| Mobile Home / Other | 177 (67.6%) | 85 (32.4%) |
| Total | 1,797 (89.2%) | 218 (10.8%) |
Housing Structures by Number of Rooms in Wilton
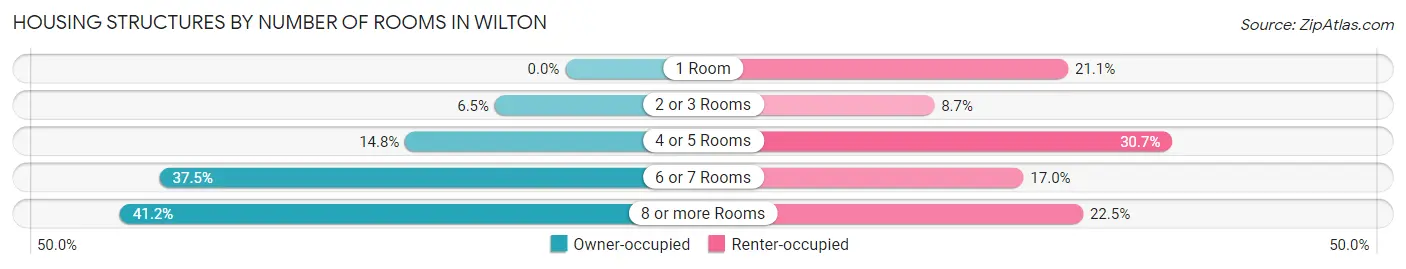
| Number of Rooms | Owner-occupied | Renter-occupied |
| 1 Room | 0 (0.0%) | 46 (21.1%) |
| 2 or 3 Rooms | 117 (6.5%) | 19 (8.7%) |
| 4 or 5 Rooms | 266 (14.8%) | 67 (30.7%) |
| 6 or 7 Rooms | 674 (37.5%) | 37 (17.0%) |
| 8 or more Rooms | 740 (41.2%) | 49 (22.5%) |
| Total | 1,797 (100.0%) | 218 (100.0%) |
Housing Structure by Heating Type in Wilton
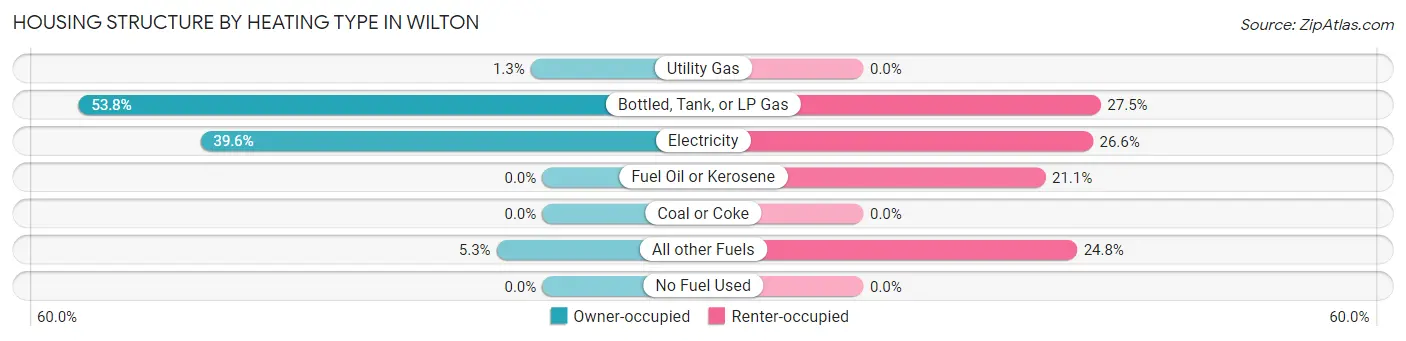
| Heating Type | Owner-occupied | Renter-occupied |
| Utility Gas | 24 (1.3%) | 0 (0.0%) |
| Bottled, Tank, or LP Gas | 966 (53.8%) | 60 (27.5%) |
| Electricity | 712 (39.6%) | 58 (26.6%) |
| Fuel Oil or Kerosene | 0 (0.0%) | 46 (21.1%) |
| Coal or Coke | 0 (0.0%) | 0 (0.0%) |
| All other Fuels | 95 (5.3%) | 54 (24.8%) |
| No Fuel Used | 0 (0.0%) | 0 (0.0%) |
| Total | 1,797 (100.0%) | 218 (100.0%) |
Household Vehicle Usage in Wilton
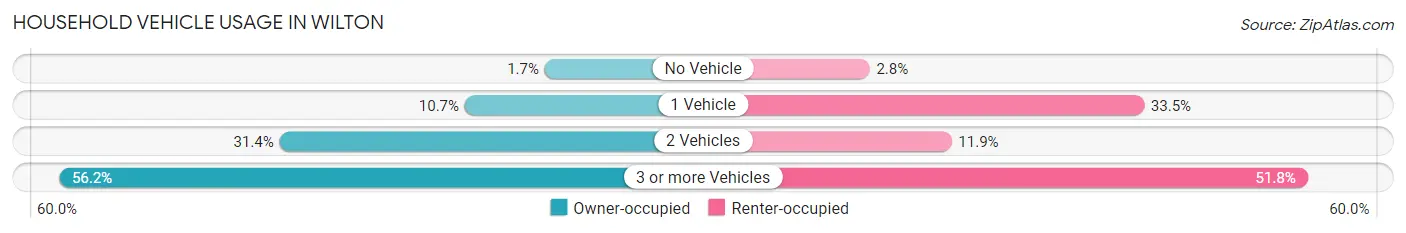
| Vehicles per Household | Owner-occupied | Renter-occupied |
| No Vehicle | 31 (1.7%) | 6 (2.8%) |
| 1 Vehicle | 192 (10.7%) | 73 (33.5%) |
| 2 Vehicles | 565 (31.4%) | 26 (11.9%) |
| 3 or more Vehicles | 1,009 (56.1%) | 113 (51.8%) |
| Total | 1,797 (100.0%) | 218 (100.0%) |
Real Estate & Mortgages in Wilton
Real Estate and Mortgage Overview in Wilton
| Characteristic | Without Mortgage | With Mortgage |
| Housing Units | 387 | 1,410 |
| Median Property Value | $614,900 | $914,100 |
| Median Household Income | $135,313 | $788 |
| Monthly Housing Costs | $613 | $673 |
| Real Estate Taxes | $3,242 | $42 |
Property Value by Mortgage Status in Wilton
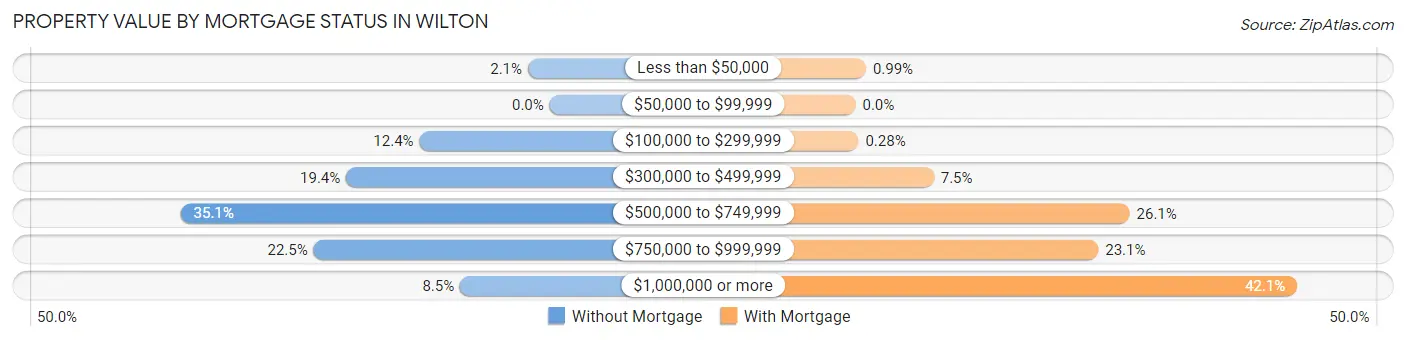
| Property Value | Without Mortgage | With Mortgage |
| Less than $50,000 | 8 (2.1%) | 14 (1.0%) |
| $50,000 to $99,999 | 0 (0.0%) | 0 (0.0%) |
| $100,000 to $299,999 | 48 (12.4%) | 4 (0.3%) |
| $300,000 to $499,999 | 75 (19.4%) | 105 (7.4%) |
| $500,000 to $749,999 | 136 (35.1%) | 368 (26.1%) |
| $750,000 to $999,999 | 87 (22.5%) | 326 (23.1%) |
| $1,000,000 or more | 33 (8.5%) | 593 (42.1%) |
| Total | 387 (100.0%) | 1,410 (100.0%) |
Household Income by Mortgage Status in Wilton
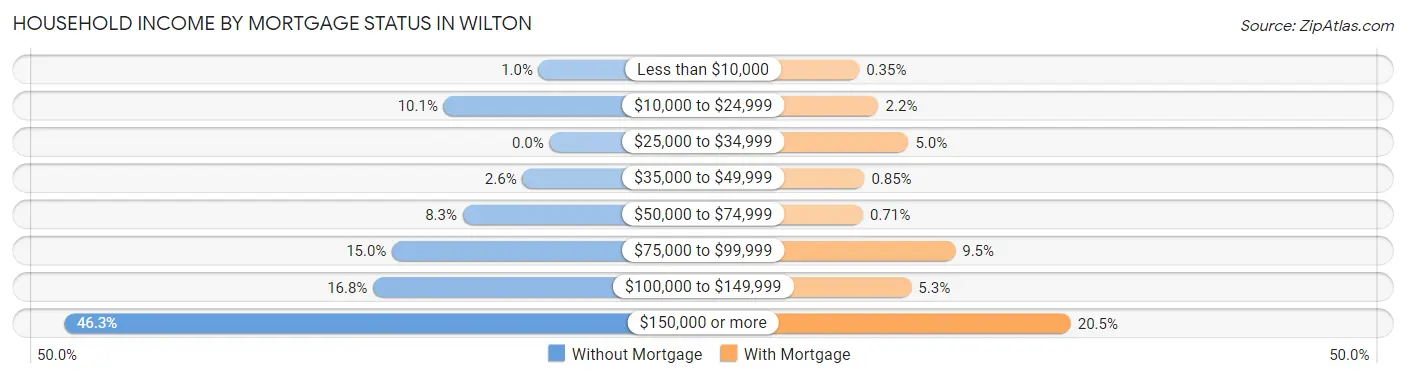
| Household Income | Without Mortgage | With Mortgage |
| Less than $10,000 | 4 (1.0%) | 5 (0.4%) |
| $10,000 to $24,999 | 39 (10.1%) | 31 (2.2%) |
| $25,000 to $34,999 | 0 (0.0%) | 71 (5.0%) |
| $35,000 to $49,999 | 10 (2.6%) | 12 (0.9%) |
| $50,000 to $74,999 | 32 (8.3%) | 10 (0.7%) |
| $75,000 to $99,999 | 58 (15.0%) | 134 (9.5%) |
| $100,000 to $149,999 | 65 (16.8%) | 75 (5.3%) |
| $150,000 or more | 179 (46.3%) | 289 (20.5%) |
| Total | 387 (100.0%) | 1,410 (100.0%) |
Property Value to Household Income Ratio in Wilton
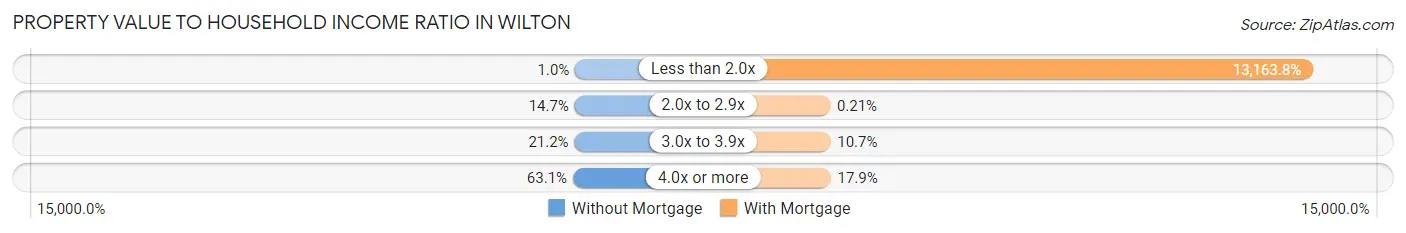
| Value-to-Income Ratio | Without Mortgage | With Mortgage |
| Less than 2.0x | 4 (1.0%) | 185,610 (13,163.8%) |
| 2.0x to 2.9x | 57 (14.7%) | 3 (0.2%) |
| 3.0x to 3.9x | 82 (21.2%) | 151 (10.7%) |
| 4.0x or more | 244 (63.0%) | 252 (17.9%) |
| Total | 387 (100.0%) | 1,410 (100.0%) |
Real Estate Taxes by Mortgage Status in Wilton
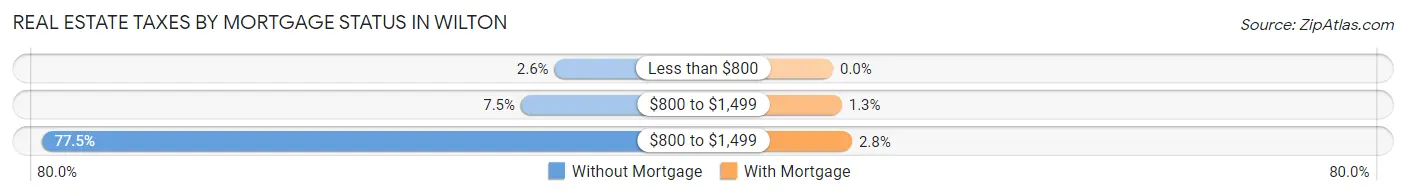
| Property Taxes | Without Mortgage | With Mortgage |
| Less than $800 | 10 (2.6%) | 0 (0.0%) |
| $800 to $1,499 | 29 (7.5%) | 18 (1.3%) |
| $800 to $1,499 | 300 (77.5%) | 39 (2.8%) |
| Total | 387 (100.0%) | 1,410 (100.0%) |
Health & Disability in Wilton
Health Insurance Coverage by Age in Wilton
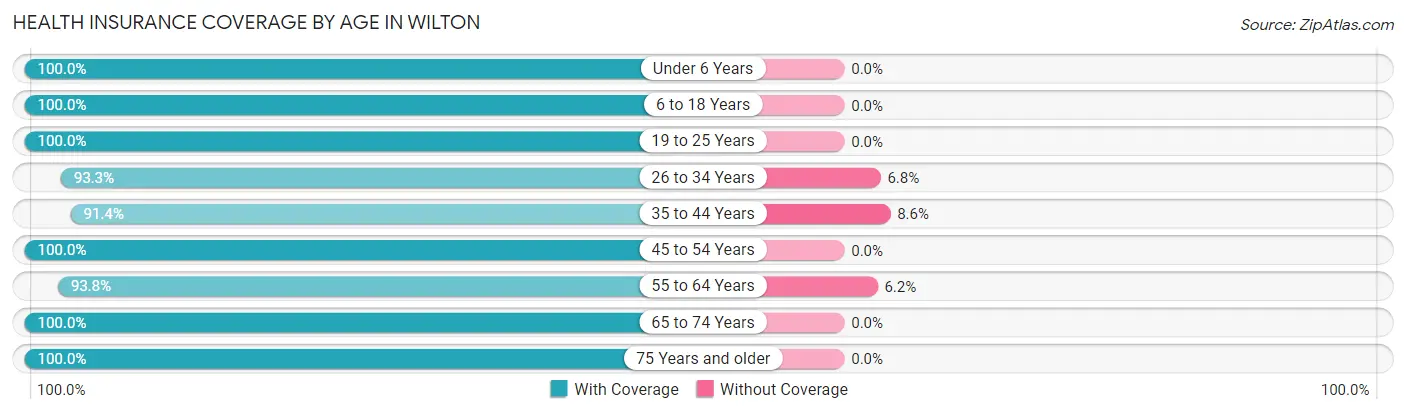
| Age Bracket | With Coverage | Without Coverage |
| Under 6 Years | 243 (100.0%) | 0 (0.0%) |
| 6 to 18 Years | 968 (100.0%) | 0 (0.0%) |
| 19 to 25 Years | 344 (100.0%) | 0 (0.0%) |
| 26 to 34 Years | 871 (93.2%) | 63 (6.8%) |
| 35 to 44 Years | 619 (91.4%) | 58 (8.6%) |
| 45 to 54 Years | 775 (100.0%) | 0 (0.0%) |
| 55 to 64 Years | 1,183 (93.8%) | 78 (6.2%) |
| 65 to 74 Years | 932 (100.0%) | 0 (0.0%) |
| 75 Years and older | 524 (100.0%) | 0 (0.0%) |
| Total | 6,459 (97.0%) | 199 (3.0%) |
Health Insurance Coverage by Citizenship Status in Wilton
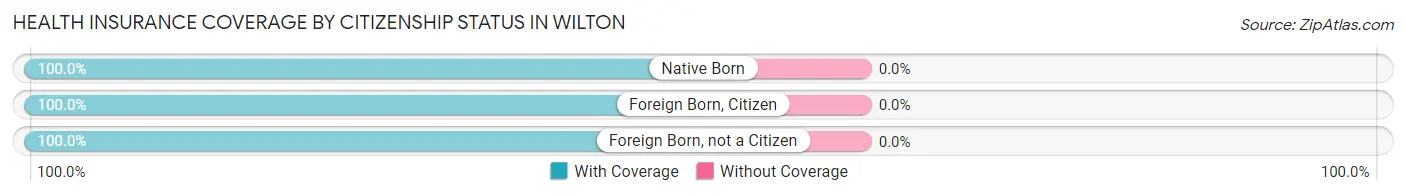
| Citizenship Status | With Coverage | Without Coverage |
| Native Born | 243 (100.0%) | 0 (0.0%) |
| Foreign Born, Citizen | 968 (100.0%) | 0 (0.0%) |
| Foreign Born, not a Citizen | 344 (100.0%) | 0 (0.0%) |
Health Insurance Coverage by Household Income in Wilton
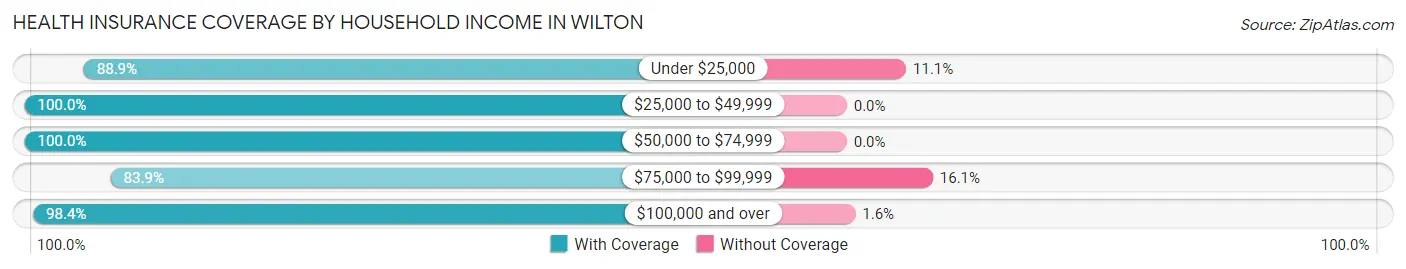
| Household Income | With Coverage | Without Coverage |
| Under $25,000 | 240 (88.9%) | 30 (11.1%) |
| $25,000 to $49,999 | 82 (100.0%) | 0 (0.0%) |
| $50,000 to $74,999 | 459 (100.0%) | 0 (0.0%) |
| $75,000 to $99,999 | 437 (83.9%) | 84 (16.1%) |
| $100,000 and over | 5,203 (98.4%) | 85 (1.6%) |
Public vs Private Health Insurance Coverage by Age in Wilton
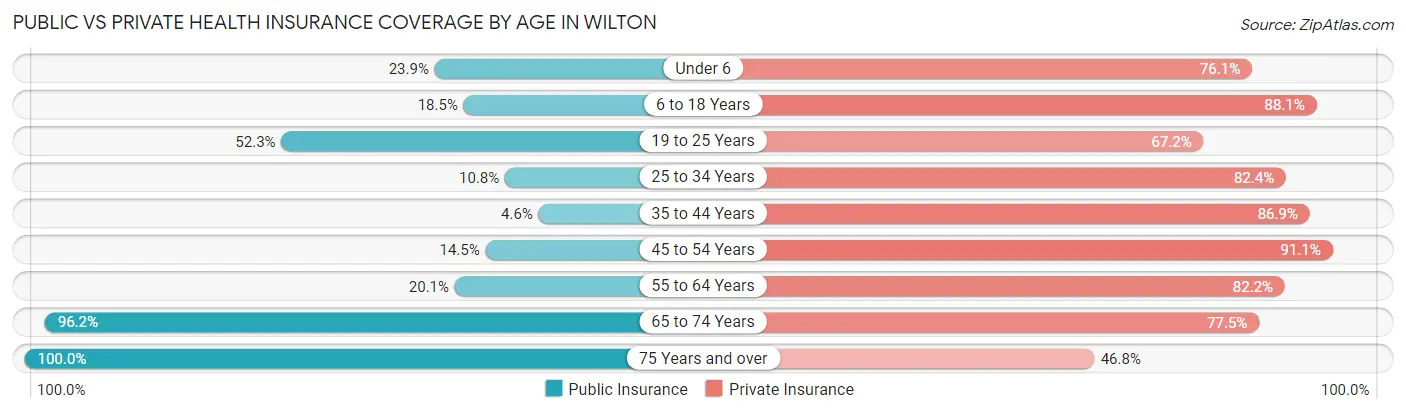
| Age Bracket | Public Insurance | Private Insurance |
| Under 6 | 58 (23.9%) | 185 (76.1%) |
| 6 to 18 Years | 179 (18.5%) | 853 (88.1%) |
| 19 to 25 Years | 180 (52.3%) | 231 (67.1%) |
| 25 to 34 Years | 101 (10.8%) | 770 (82.4%) |
| 35 to 44 Years | 31 (4.6%) | 588 (86.9%) |
| 45 to 54 Years | 112 (14.4%) | 706 (91.1%) |
| 55 to 64 Years | 254 (20.1%) | 1,037 (82.2%) |
| 65 to 74 Years | 897 (96.2%) | 722 (77.5%) |
| 75 Years and over | 524 (100.0%) | 245 (46.8%) |
| Total | 2,336 (35.1%) | 5,337 (80.2%) |
Disability Status by Sex by Age in Wilton
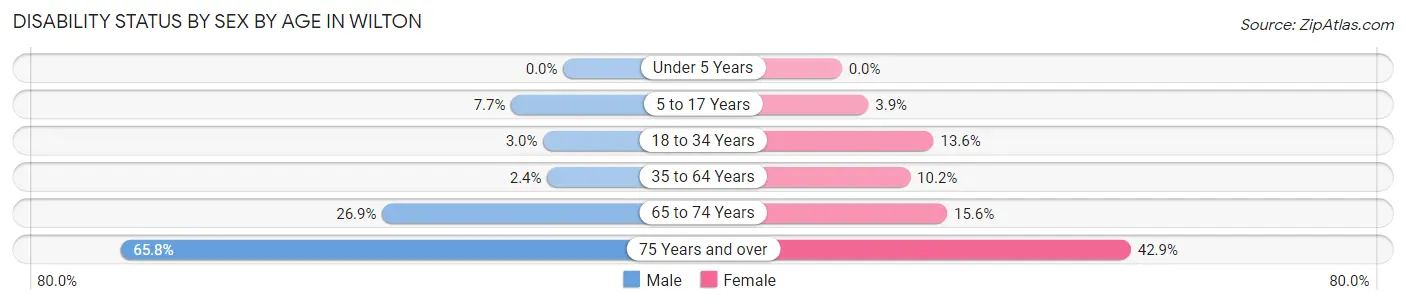
| Age Bracket | Male | Female |
| Under 5 Years | 0 (0.0%) | 0 (0.0%) |
| 5 to 17 Years | 42 (7.7%) | 16 (3.9%) |
| 18 to 34 Years | 22 (3.0%) | 76 (13.6%) |
| 35 to 64 Years | 33 (2.4%) | 134 (10.2%) |
| 65 to 74 Years | 125 (26.9%) | 73 (15.6%) |
| 75 Years and over | 150 (65.8%) | 127 (42.9%) |
Disability Class by Sex by Age in Wilton
Disability Class: Hearing Difficulty
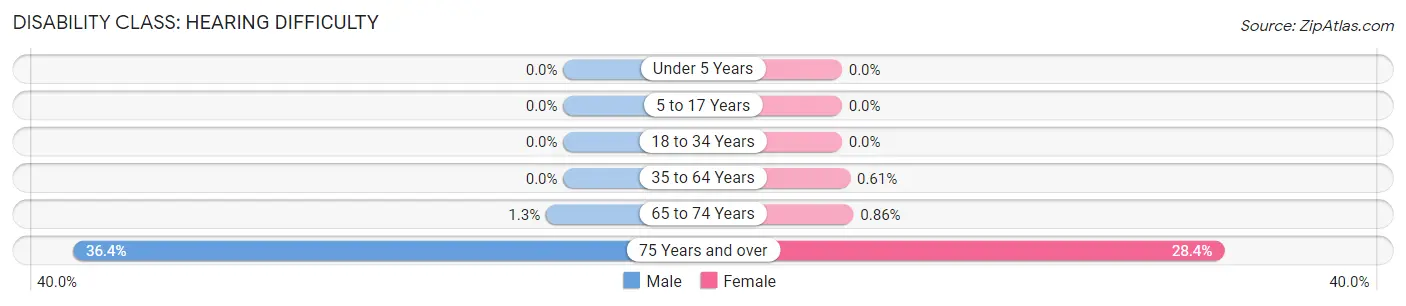
| Age Bracket | Male | Female |
| Under 5 Years | 0 (0.0%) | 0 (0.0%) |
| 5 to 17 Years | 0 (0.0%) | 0 (0.0%) |
| 18 to 34 Years | 0 (0.0%) | 0 (0.0%) |
| 35 to 64 Years | 0 (0.0%) | 8 (0.6%) |
| 65 to 74 Years | 6 (1.3%) | 4 (0.9%) |
| 75 Years and over | 83 (36.4%) | 84 (28.4%) |
Disability Class: Vision Difficulty
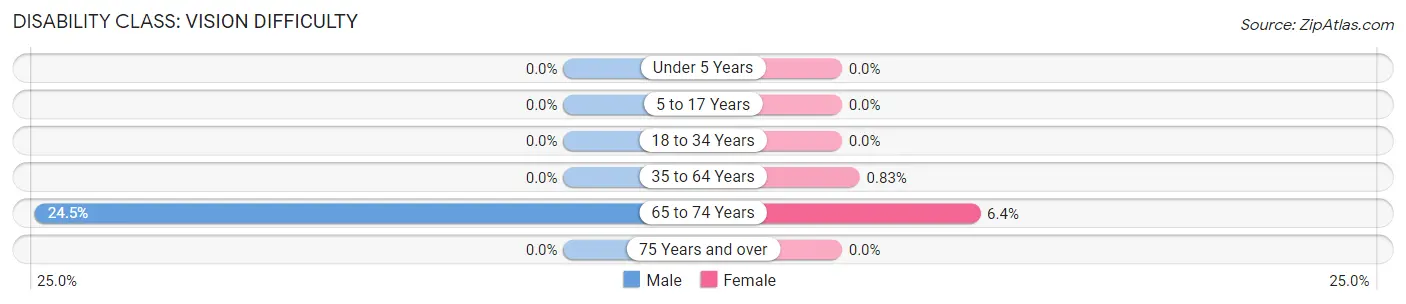
| Age Bracket | Male | Female |
| Under 5 Years | 0 (0.0%) | 0 (0.0%) |
| 5 to 17 Years | 0 (0.0%) | 0 (0.0%) |
| 18 to 34 Years | 0 (0.0%) | 0 (0.0%) |
| 35 to 64 Years | 0 (0.0%) | 11 (0.8%) |
| 65 to 74 Years | 114 (24.5%) | 30 (6.4%) |
| 75 Years and over | 0 (0.0%) | 0 (0.0%) |
Disability Class: Cognitive Difficulty
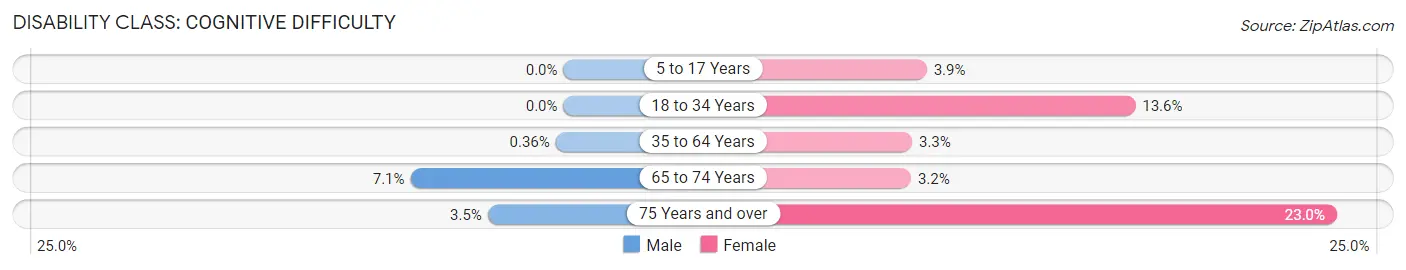
| Age Bracket | Male | Female |
| 5 to 17 Years | 0 (0.0%) | 16 (3.9%) |
| 18 to 34 Years | 0 (0.0%) | 76 (13.6%) |
| 35 to 64 Years | 5 (0.4%) | 43 (3.3%) |
| 65 to 74 Years | 33 (7.1%) | 15 (3.2%) |
| 75 Years and over | 8 (3.5%) | 68 (23.0%) |
Disability Class: Ambulatory Difficulty
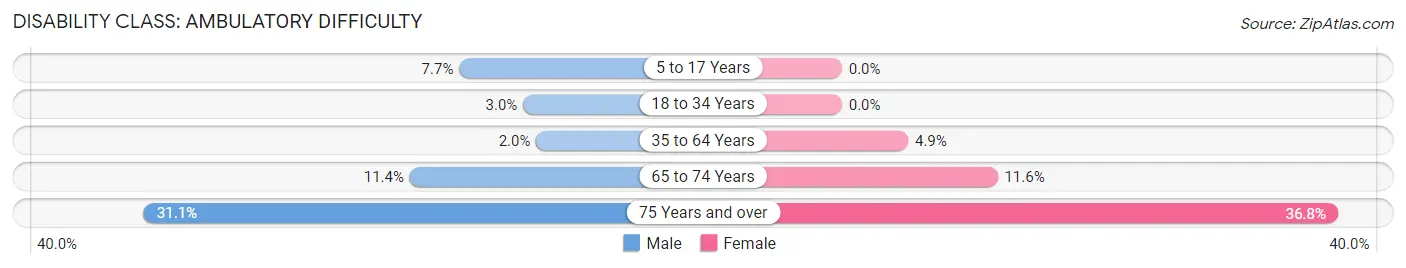
| Age Bracket | Male | Female |
| 5 to 17 Years | 42 (7.7%) | 0 (0.0%) |
| 18 to 34 Years | 22 (3.0%) | 0 (0.0%) |
| 35 to 64 Years | 28 (2.0%) | 65 (4.9%) |
| 65 to 74 Years | 53 (11.4%) | 54 (11.6%) |
| 75 Years and over | 71 (31.1%) | 109 (36.8%) |
Disability Class: Self-Care Difficulty
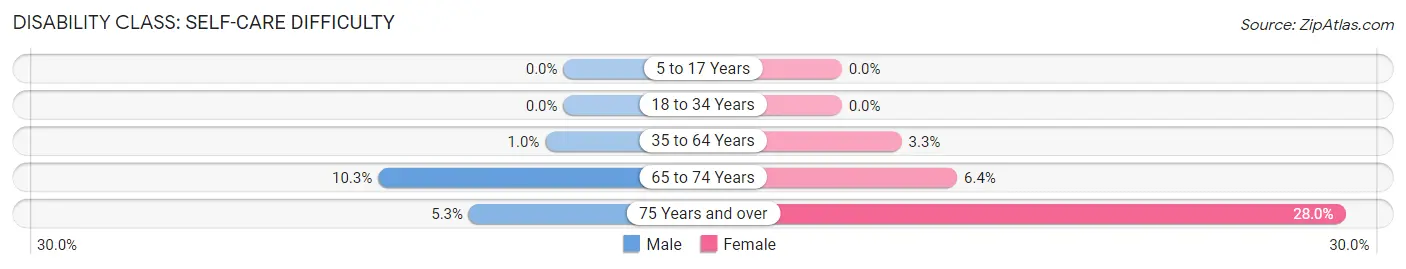
| Age Bracket | Male | Female |
| 5 to 17 Years | 0 (0.0%) | 0 (0.0%) |
| 18 to 34 Years | 0 (0.0%) | 0 (0.0%) |
| 35 to 64 Years | 14 (1.0%) | 44 (3.3%) |
| 65 to 74 Years | 48 (10.3%) | 30 (6.4%) |
| 75 Years and over | 12 (5.3%) | 83 (28.0%) |
Technology Access in Wilton
Computing Device Access in Wilton
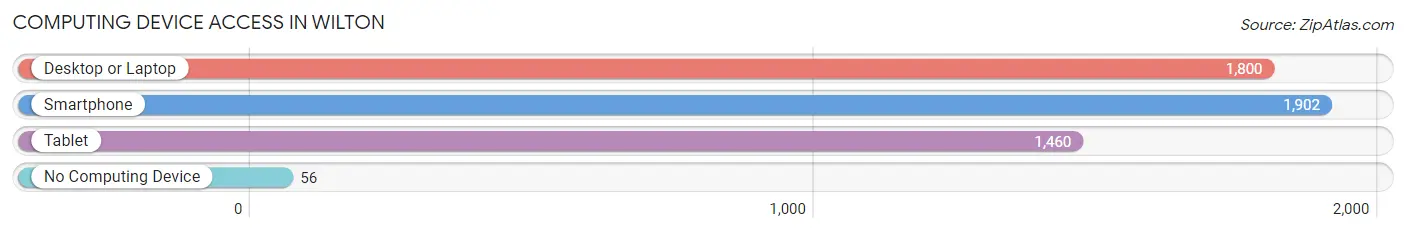
| Device Type | # Households | % Households |
| Desktop or Laptop | 1,800 | 89.3% |
| Smartphone | 1,902 | 94.4% |
| Tablet | 1,460 | 72.5% |
| No Computing Device | 56 | 2.8% |
| Total | 2,015 | 100.0% |
Internet Access in Wilton
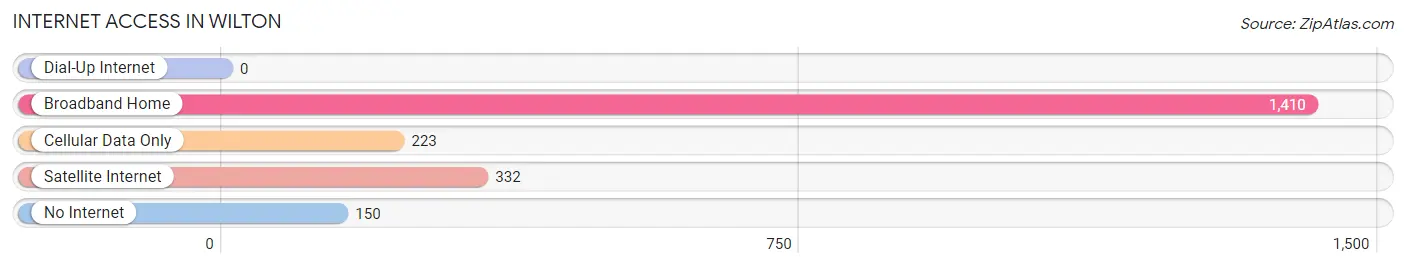
| Internet Type | # Households | % Households |
| Dial-Up Internet | 0 | 0.0% |
| Broadband Home | 1,410 | 70.0% |
| Cellular Data Only | 223 | 11.1% |
| Satellite Internet | 332 | 16.5% |
| No Internet | 150 | 7.4% |
| Total | 2,015 | 100.0% |
Wilton Summary
Wilton is a small unincorporated community located in Sacramento County, California. It is situated in the foothills of the Sierra Nevada Mountains, approximately 20 miles northeast of Sacramento. The population of Wilton was estimated to be 1,845 in 2019.
History
The area now known as Wilton was originally inhabited by the Maidu Native American tribe. The first European settlers arrived in the area in the mid-1800s, and the town was officially founded in 1871. The town was named after Wilton, England, and was originally a farming community.
In the early 1900s, Wilton began to experience a population boom due to the construction of the Southern Pacific Railroad. This allowed for the transportation of goods and people to and from the area, and the population of Wilton grew rapidly.
In the 1950s, Wilton began to experience a decline in population as people moved away from the area in search of better job opportunities. This trend continued until the late 1980s, when the population began to slowly increase again.
Geography
Wilton is located in the foothills of the Sierra Nevada Mountains, approximately 20 miles northeast of Sacramento. The town is situated at an elevation of approximately 200 feet above sea level.
The climate in Wilton is classified as Mediterranean, with hot, dry summers and mild, wet winters. The average annual temperature is around 70 degrees Fahrenheit, and the average annual precipitation is around 20 inches.
The town is surrounded by rolling hills and open fields, and is home to a variety of wildlife, including deer, coyotes, and wild turkeys.
Economy
The economy of Wilton is largely based on agriculture. The town is home to a variety of farms, including almond, walnut, and olive farms. The town is also home to a number of wineries and vineyards.
In addition to agriculture, Wilton is home to a number of small businesses, including restaurants, retail stores, and auto repair shops. The town is also home to a number of light industrial businesses, including a lumber mill and a metal fabrication shop.
Demographics
As of 2019, the population of Wilton was estimated to be 1,845. The racial makeup of the town is predominantly white (83.3%), followed by Hispanic or Latino (7.7%), Asian (3.2%), and African American (2.2%).
The median household income in Wilton is $76,944, and the median home value is $521,000. The town has a low unemployment rate of 3.2%.
Conclusion
Wilton is a small unincorporated community located in Sacramento County, California. It is situated in the foothills of the Sierra Nevada Mountains, approximately 20 miles northeast of Sacramento. The population of Wilton was estimated to be 1,845 in 2019. The town is largely agricultural, with a variety of farms, wineries, and vineyards. The economy of Wilton is also supported by a number of small businesses, including restaurants, retail stores, and auto repair shops. The racial makeup of the town is predominantly white, followed by Hispanic or Latino, Asian, and African American. The median household income in Wilton is $76,944, and the median home value is $521,000.
Common Questions
What is Per Capita Income in Wilton?
Per Capita income in Wilton is $53,140.
What is the Median Family Income in Wilton?
Median Family Income in Wilton is $158,222.
What is the Median Household income in Wilton?
Median Household Income in Wilton is $176,875.
What is Income or Wage Gap in Wilton?
Income or Wage Gap in Wilton is 37.3%.
Women in Wilton earn 62.7 cents for every dollar earned by a man.
What is Inequality or Gini Index in Wilton?
Inequality or Gini Index in Wilton is 0.32.
What is the Total Population of Wilton?
Total Population of Wilton is 6,663.
What is the Total Male Population of Wilton?
Total Male Population of Wilton is 3,584.
What is the Total Female Population of Wilton?
Total Female Population of Wilton is 3,079.
What is the Ratio of Males per 100 Females in Wilton?
There are 116.40 Males per 100 Females in Wilton.
What is the Ratio of Females per 100 Males in Wilton?
There are 85.91 Females per 100 Males in Wilton.
What is the Median Population Age in Wilton?
Median Population Age in Wilton is 49.7 Years.
What is the Average Family Size in Wilton
Average Family Size in Wilton is 3.4 People.
What is the Average Household Size in Wilton
Average Household Size in Wilton is 3.3 People.
How Large is the Labor Force in Wilton?
There are 3,110 People in the Labor Forcein in Wilton.
What is the Percentage of People in the Labor Force in Wilton?
56.2% of People are in the Labor Force in Wilton.
What is the Unemployment Rate in Wilton?
Unemployment Rate in Wilton is 1.7%.