North Richmond, CA Map & Demographics
North Richmond Map
North Richmond Overview
$28,393
PER CAPITA INCOME
$81,464
AVG FAMILY INCOME
$81,046
AVG HOUSEHOLD INCOME
41.9%
WAGE / INCOME GAP [ % ]
58.1¢/ $1
WAGE / INCOME GAP [ $ ]
0.37
INEQUALITY / GINI INDEX
3,734
TOTAL POPULATION
1,582
MALE POPULATION
2,152
FEMALE POPULATION
73.51
MALES / 100 FEMALES
136.03
FEMALES / 100 MALES
35.1
MEDIAN AGE
4.1
AVG FAMILY SIZE
3.5
AVG HOUSEHOLD SIZE
1,963
LABOR FORCE [ PEOPLE ]
69.9%
PERCENT IN LABOR FORCE
3.1%
UNEMPLOYMENT RATE
North Richmond Area Codes
Income in North Richmond
Income Overview in North Richmond
Per Capita Income in North Richmond is $28,393, while median incomes of families and households are $81,464 and $81,046 respectively.
| Characteristic | Number | Measure |
| Per Capita Income | 3,734 | $28,393 |
| Median Family Income | 805 | $81,464 |
| Mean Family Income | 805 | $104,557 |
| Median Household Income | 1,053 | $81,046 |
| Mean Household Income | 1,053 | $100,517 |
| Income Deficit | 805 | $0 |
| Wage / Income Gap (%) | 3,734 | 41.90% |
| Wage / Income Gap ($) | 3,734 | 58.10¢ per $1 |
| Gini / Inequality Index | 3,734 | 0.37 |
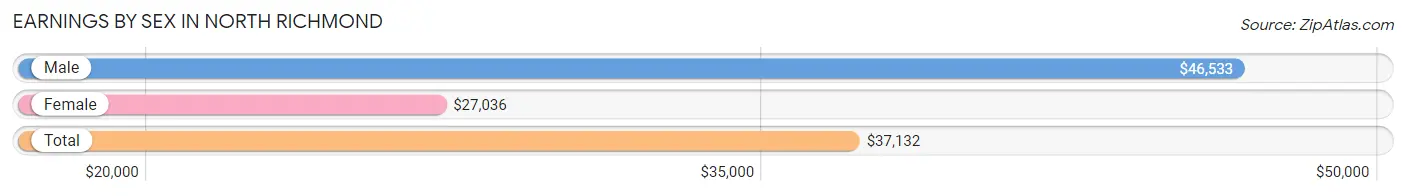
Earnings by Sex in North Richmond
Average Earnings in North Richmond are $37,132, $46,533 for men and $27,036 for women, a difference of 41.9%.
| Sex | Number | Average Earnings |
| Male | 952 (48.2%) | $46,533 |
| Female | 1,021 (51.7%) | $27,036 |
| Total | 1,973 (100.0%) | $37,132 |
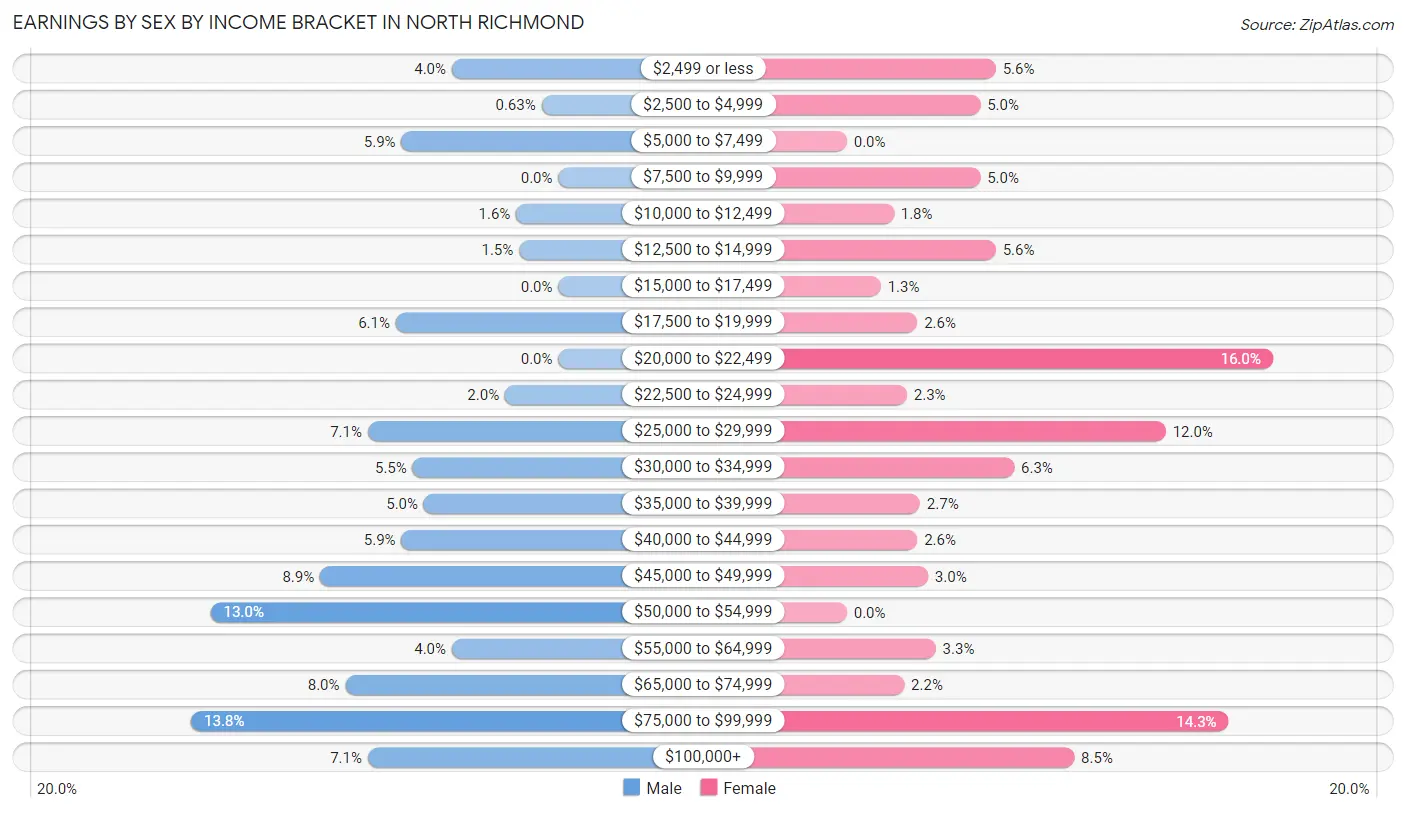
Earnings by Sex by Income Bracket in North Richmond
The most common earnings brackets in North Richmond are $75,000 to $99,999 for men (131 | 13.8%) and $20,000 to $22,499 for women (163 | 16.0%).
| Income | Male | Female |
| $2,499 or less | 38 (4.0%) | 57 (5.6%) |
| $2,500 to $4,999 | 6 (0.6%) | 51 (5.0%) |
| $5,000 to $7,499 | 56 (5.9%) | 0 (0.0%) |
| $7,500 to $9,999 | 0 (0.0%) | 51 (5.0%) |
| $10,000 to $12,499 | 15 (1.6%) | 18 (1.8%) |
| $12,500 to $14,999 | 14 (1.5%) | 57 (5.6%) |
| $15,000 to $17,499 | 0 (0.0%) | 13 (1.3%) |
| $17,500 to $19,999 | 58 (6.1%) | 27 (2.6%) |
| $20,000 to $22,499 | 0 (0.0%) | 163 (16.0%) |
| $22,500 to $24,999 | 19 (2.0%) | 23 (2.2%) |
| $25,000 to $29,999 | 68 (7.1%) | 122 (11.9%) |
| $30,000 to $34,999 | 52 (5.5%) | 64 (6.3%) |
| $35,000 to $39,999 | 48 (5.0%) | 28 (2.7%) |
| $40,000 to $44,999 | 56 (5.9%) | 27 (2.6%) |
| $45,000 to $49,999 | 85 (8.9%) | 31 (3.0%) |
| $50,000 to $54,999 | 124 (13.0%) | 0 (0.0%) |
| $55,000 to $64,999 | 38 (4.0%) | 34 (3.3%) |
| $65,000 to $74,999 | 76 (8.0%) | 22 (2.1%) |
| $75,000 to $99,999 | 131 (13.8%) | 146 (14.3%) |
| $100,000+ | 68 (7.1%) | 87 (8.5%) |
| Total | 952 (100.0%) | 1,021 (100.0%) |
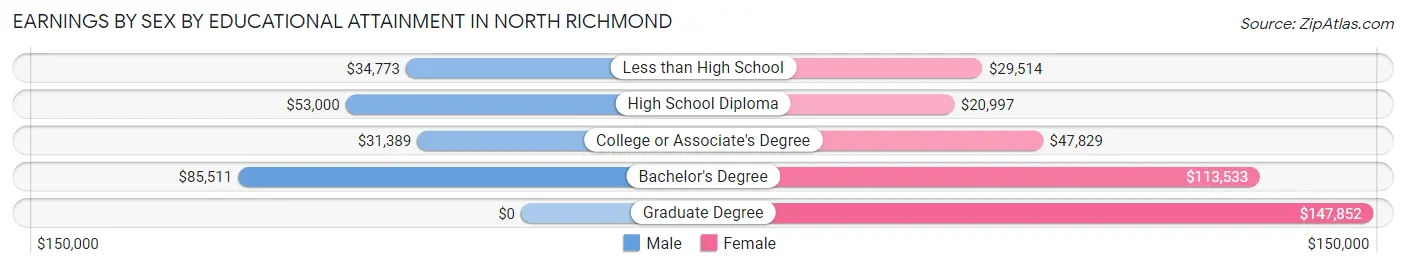
Earnings by Sex by Educational Attainment in North Richmond
Average earnings in North Richmond are $50,357 for men and $29,403 for women, a difference of 41.6%. Men with an educational attainment of bachelor's degree enjoy the highest average annual earnings of $85,511, while those with college or associate's degree education earn the least with $31,389. Women with an educational attainment of graduate degree earn the most with the average annual earnings of $147,852, while those with high school diploma education have the smallest earnings of $20,997.
| Educational Attainment | Male Income | Female Income |
| Less than High School | $34,773 | $29,514 |
| High School Diploma | $53,000 | $20,997 |
| College or Associate's Degree | $31,389 | $47,829 |
| Bachelor's Degree | $85,511 | $113,533 |
| Graduate Degree | - | - |
| Total | $50,357 | $29,403 |
Family Income in North Richmond
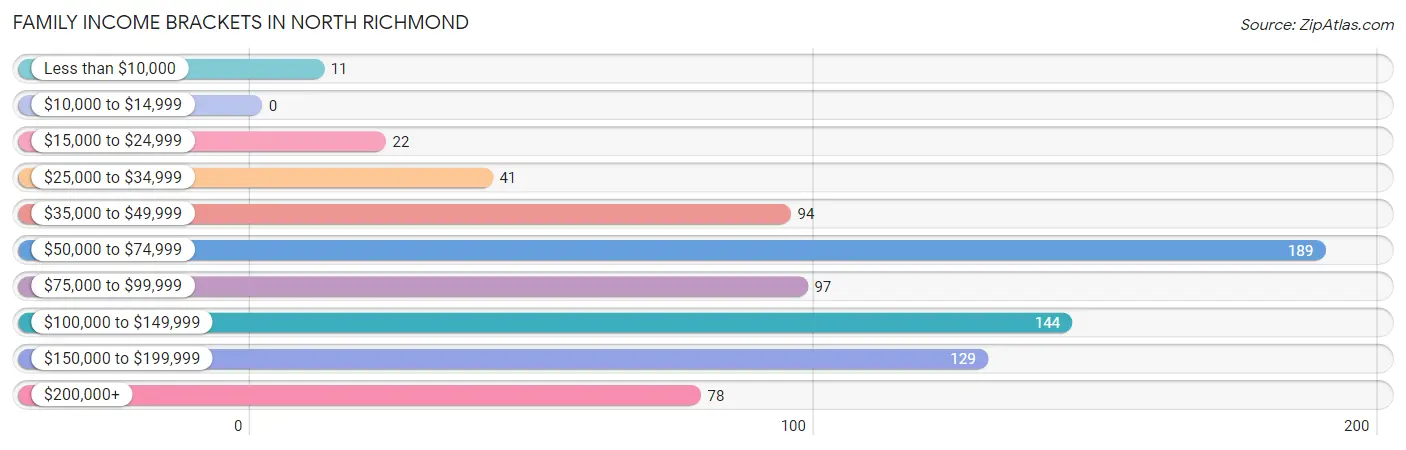
Family Income Brackets in North Richmond
According to the North Richmond family income data, there are 189 families falling into the $50,000 to $74,999 income range, which is the most common income bracket and makes up 23.5% of all families.
| Income Bracket | # Families | % Families |
| Less than $10,000 | 11 | 1.4% |
| $10,000 to $14,999 | 0 | 0.0% |
| $15,000 to $24,999 | 22 | 2.7% |
| $25,000 to $34,999 | 41 | 5.1% |
| $35,000 to $49,999 | 94 | 11.7% |
| $50,000 to $74,999 | 189 | 23.5% |
| $75,000 to $99,999 | 97 | 12.0% |
| $100,000 to $149,999 | 144 | 17.9% |
| $150,000 to $199,999 | 129 | 16.0% |
| $200,000+ | 78 | 9.7% |
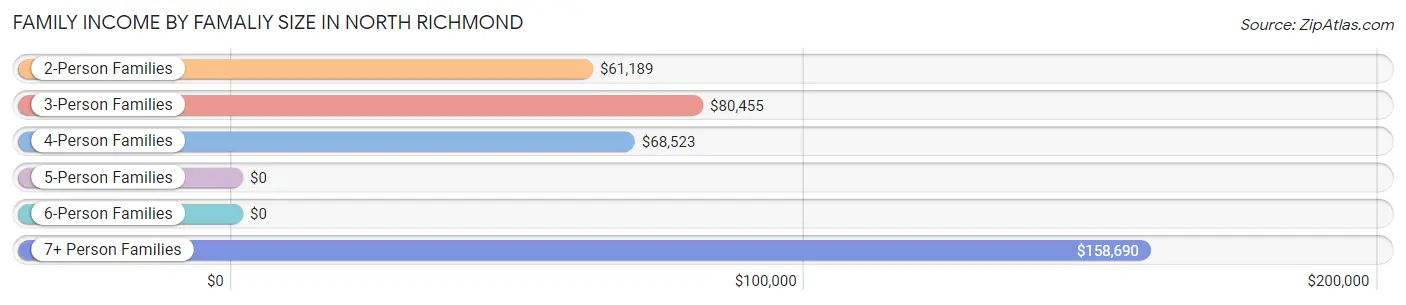
Family Income by Famaliy Size in North Richmond
7+ person families (44 | 5.5%) account for the highest median family income in North Richmond with $158,690 per family, while 2-person families (109 | 13.5%) have the highest median income of $30,594 per family member.
| Income Bracket | # Families | Median Income |
| 2-Person Families | 109 (13.5%) | $61,189 |
| 3-Person Families | 186 (23.1%) | $80,455 |
| 4-Person Families | 204 (25.3%) | $68,523 |
| 5-Person Families | 119 (14.8%) | $0 |
| 6-Person Families | 143 (17.8%) | $0 |
| 7+ Person Families | 44 (5.5%) | $158,690 |
| Total | 805 (100.0%) | $81,464 |
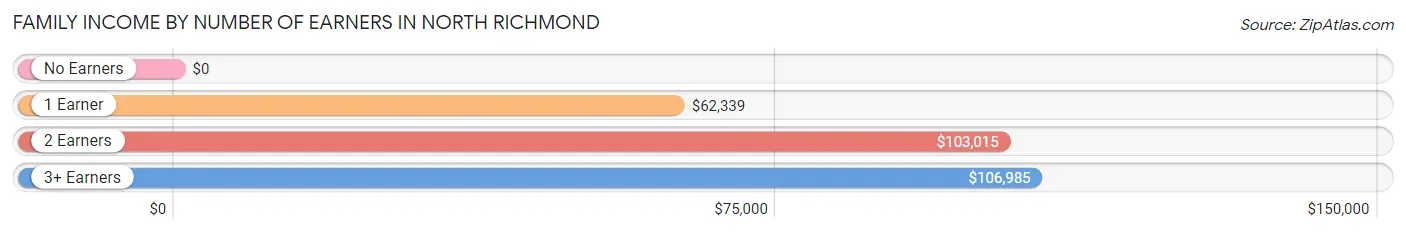
Family Income by Number of Earners in North Richmond
| Number of Earners | # Families | Median Income |
| No Earners | 26 (3.2%) | $0 |
| 1 Earner | 236 (29.3%) | $62,339 |
| 2 Earners | 214 (26.6%) | $103,015 |
| 3+ Earners | 329 (40.9%) | $106,985 |
| Total | 805 (100.0%) | $81,464 |
Household Income in North Richmond
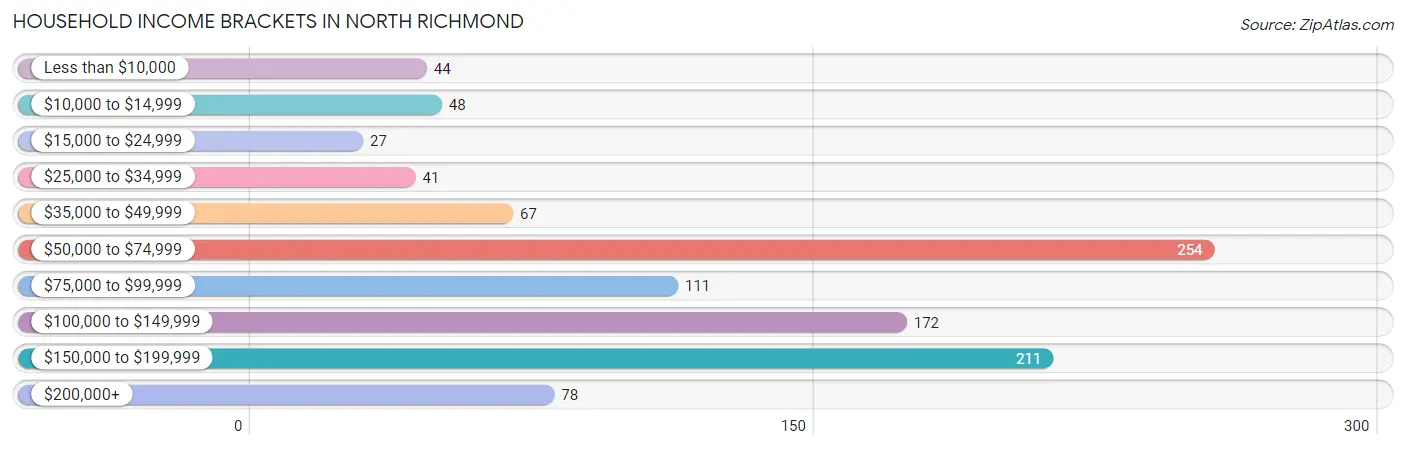
Household Income Brackets in North Richmond
With 254 households falling in the category, the $50,000 to $74,999 income range is the most frequent in North Richmond, accounting for 24.1% of all households. In contrast, only 27 households (2.6%) fall into the $15,000 to $24,999 income bracket, making it the least populous group.
| Income Bracket | # Households | % Households |
| Less than $10,000 | 44 | 4.2% |
| $10,000 to $14,999 | 48 | 4.6% |
| $15,000 to $24,999 | 27 | 2.6% |
| $25,000 to $34,999 | 41 | 3.9% |
| $35,000 to $49,999 | 67 | 6.4% |
| $50,000 to $74,999 | 254 | 24.1% |
| $75,000 to $99,999 | 111 | 10.5% |
| $100,000 to $149,999 | 172 | 16.3% |
| $150,000 to $199,999 | 211 | 20.0% |
| $200,000+ | 78 | 7.4% |
Household Income by Householder Age in North Richmond
The median household income in North Richmond is $81,046, with the highest median household income of $102,684 found in the 45 to 64 years age bracket for the primary householder. A total of 547 households (51.9%) fall into this category. Meanwhile, the 15 to 24 years age bracket for the primary householder has the lowest median household income of $0, with 10 households (0.9%) in this group.
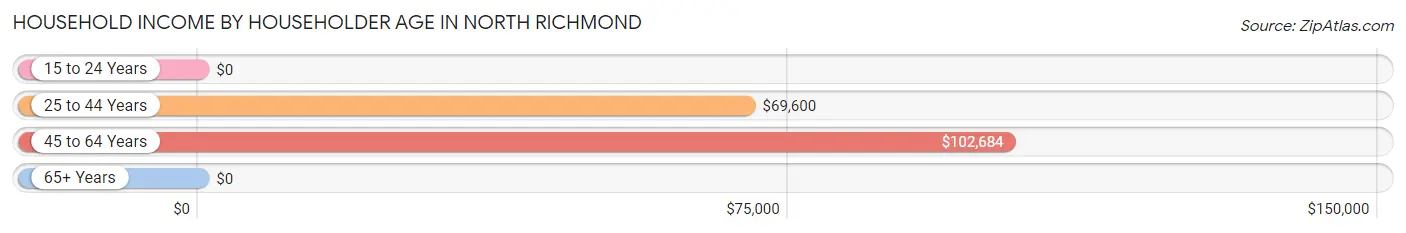
| Income Bracket | # Households | Median Income |
| 15 to 24 Years | 10 (0.9%) | $0 |
| 25 to 44 Years | 310 (29.4%) | $69,600 |
| 45 to 64 Years | 547 (51.9%) | $102,684 |
| 65+ Years | 186 (17.7%) | $0 |
| Total | 1,053 (100.0%) | $81,046 |
Poverty in North Richmond
Income Below Poverty by Sex and Age in North Richmond
With 11.9% poverty level for males and 8.6% for females among the residents of North Richmond, 5 year old males and 65 to 74 year old females are the most vulnerable to poverty, with 16 males (100.0%) and 33 females (40.2%) in their respective age groups living below the poverty level.
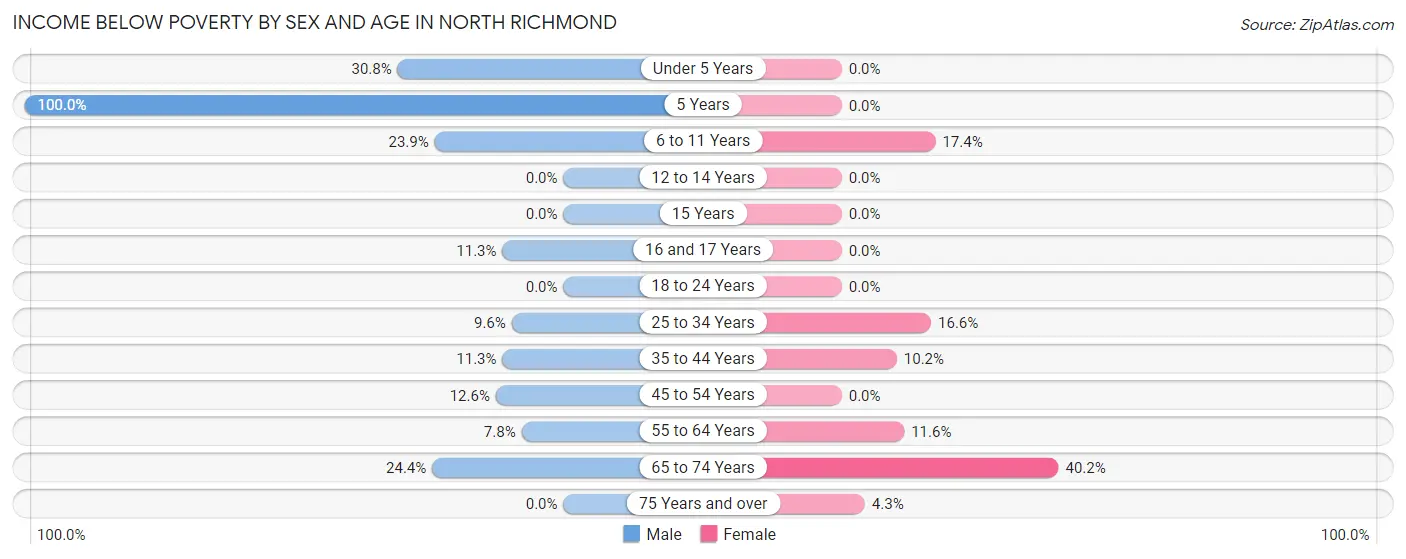
| Age Bracket | Male | Female |
| Under 5 Years | 28 (30.8%) | 0 (0.0%) |
| 5 Years | 16 (100.0%) | 0 (0.0%) |
| 6 to 11 Years | 33 (23.9%) | 48 (17.4%) |
| 12 to 14 Years | 0 (0.0%) | 0 (0.0%) |
| 15 Years | 0 (0.0%) | 0 (0.0%) |
| 16 and 17 Years | 6 (11.3%) | 0 (0.0%) |
| 18 to 24 Years | 0 (0.0%) | 0 (0.0%) |
| 25 to 34 Years | 17 (9.6%) | 32 (16.6%) |
| 35 to 44 Years | 24 (11.3%) | 41 (10.2%) |
| 45 to 54 Years | 31 (12.6%) | 0 (0.0%) |
| 55 to 64 Years | 15 (7.8%) | 24 (11.6%) |
| 65 to 74 Years | 19 (24.4%) | 33 (40.2%) |
| 75 Years and over | 0 (0.0%) | 7 (4.3%) |
| Total | 189 (11.9%) | 185 (8.6%) |
Income Above Poverty by Sex and Age in North Richmond
According to the poverty statistics in North Richmond, males aged 12 to 14 years and females aged under 5 years are the age groups that are most secure financially, with 100.0% of males and 100.0% of females in these age groups living above the poverty line.
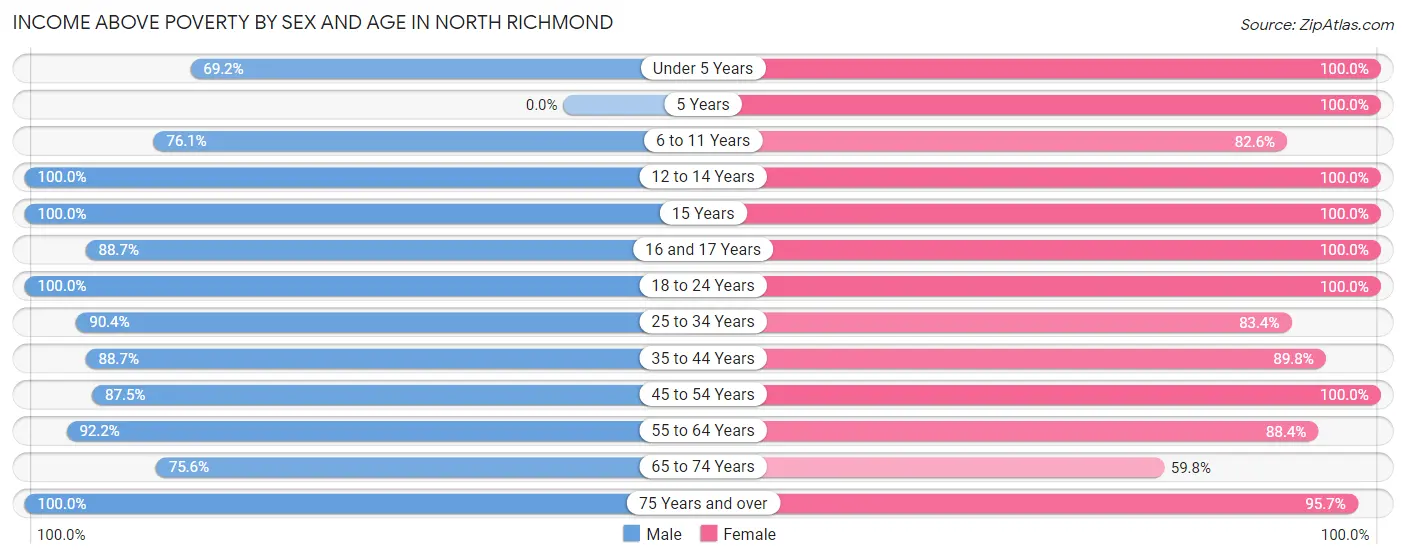
| Age Bracket | Male | Female |
| Under 5 Years | 63 (69.2%) | 83 (100.0%) |
| 5 Years | 0 (0.0%) | 69 (100.0%) |
| 6 to 11 Years | 105 (76.1%) | 228 (82.6%) |
| 12 to 14 Years | 146 (100.0%) | 69 (100.0%) |
| 15 Years | 18 (100.0%) | 19 (100.0%) |
| 16 and 17 Years | 47 (88.7%) | 115 (100.0%) |
| 18 to 24 Years | 148 (100.0%) | 252 (100.0%) |
| 25 to 34 Years | 160 (90.4%) | 161 (83.4%) |
| 35 to 44 Years | 188 (88.7%) | 360 (89.8%) |
| 45 to 54 Years | 216 (87.5%) | 223 (100.0%) |
| 55 to 64 Years | 178 (92.2%) | 183 (88.4%) |
| 65 to 74 Years | 59 (75.6%) | 49 (59.8%) |
| 75 Years and over | 65 (100.0%) | 156 (95.7%) |
| Total | 1,393 (88.0%) | 1,967 (91.4%) |
Income Below Poverty Among Married-Couple Families in North Richmond
The poverty statistics for married-couple families in North Richmond show that 9.1% or 47 of the total 517 families live below the poverty line. Families with no children have the highest poverty rate of 24.4%, comprising of 11 families. On the other hand, families with 1 or 2 children have the lowest poverty rate of 1.8%, which includes 6 families.
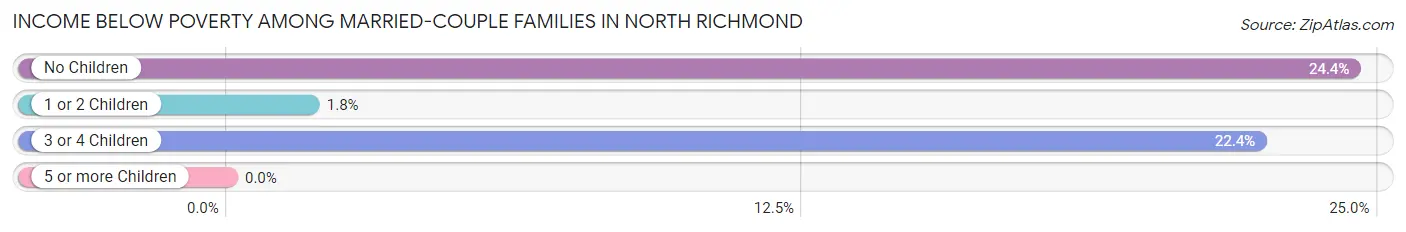
| Children | Above Poverty | Below Poverty |
| No Children | 34 (75.6%) | 11 (24.4%) |
| 1 or 2 Children | 332 (98.2%) | 6 (1.8%) |
| 3 or 4 Children | 104 (77.6%) | 30 (22.4%) |
| 5 or more Children | 0 (0.0%) | 0 (0.0%) |
| Total | 470 (90.9%) | 47 (9.1%) |
Income Below Poverty Among Single-Parent Households in North Richmond
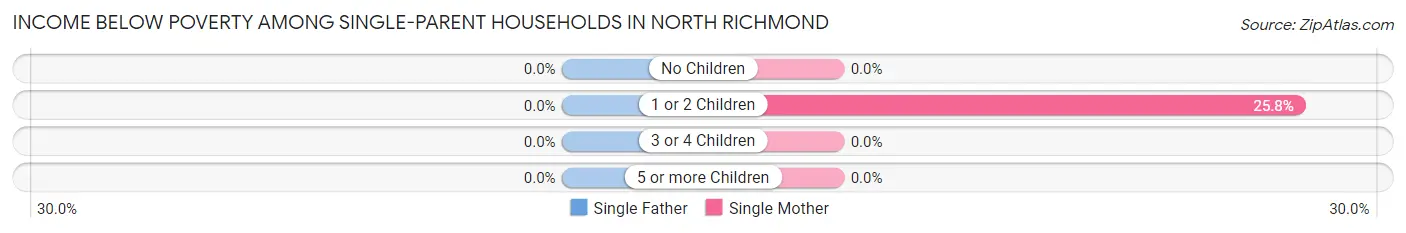
| Children | Single Father | Single Mother |
| No Children | 0 (0.0%) | 0 (0.0%) |
| 1 or 2 Children | 0 (0.0%) | 16 (25.8%) |
| 3 or 4 Children | 0 (0.0%) | 0 (0.0%) |
| 5 or more Children | 0 (0.0%) | 0 (0.0%) |
| Total | 0 (0.0%) | 16 (7.7%) |
Income Below Poverty Among Married-Couple vs Single-Parent Households in North Richmond
The poverty data for North Richmond shows that 47 of the married-couple family households (9.1%) and 16 of the single-parent households (5.6%) are living below the poverty level. Within the married-couple family households, those with no children have the highest poverty rate, with 11 households (24.4%) falling below the poverty line. Among the single-parent households, those with 1 or 2 children have the highest poverty rate, with 16 household (17.6%) living below poverty.
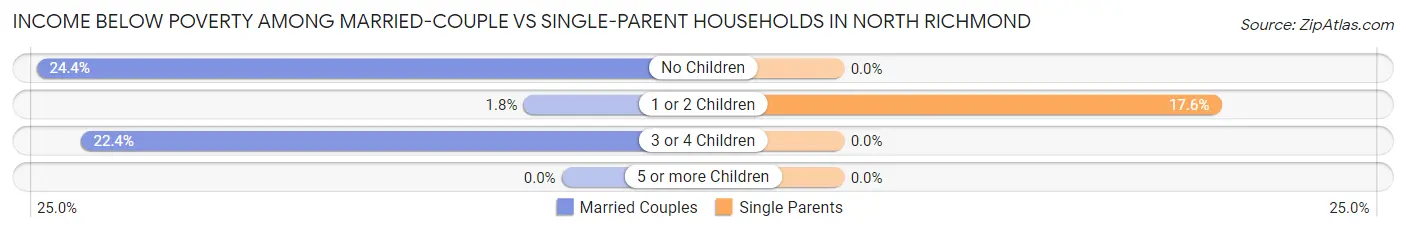
| Children | Married-Couple Families | Single-Parent Households |
| No Children | 11 (24.4%) | 0 (0.0%) |
| 1 or 2 Children | 6 (1.8%) | 16 (17.6%) |
| 3 or 4 Children | 30 (22.4%) | 0 (0.0%) |
| 5 or more Children | 0 (0.0%) | 0 (0.0%) |
| Total | 47 (9.1%) | 16 (5.6%) |
Race in North Richmond
The most populous races in North Richmond are Hispanic or Latino (2,303 | 61.7%), Some other Race (1,498 | 40.1%), and Black / African American (680 | 18.2%).

| Race | # Population | % Population |
| Asian | 340 | 9.1% |
| Black / African American | 680 | 18.2% |
| Hawaiian / Pacific | 245 | 6.6% |
| Hispanic or Latino | 2,303 | 61.7% |
| Native / Alaskan | 16 | 0.4% |
| White / Caucasian | 284 | 7.6% |
| Two or more Races | 671 | 18.0% |
| Some other Race | 1,498 | 40.1% |
| Total | 3,734 | 100.0% |
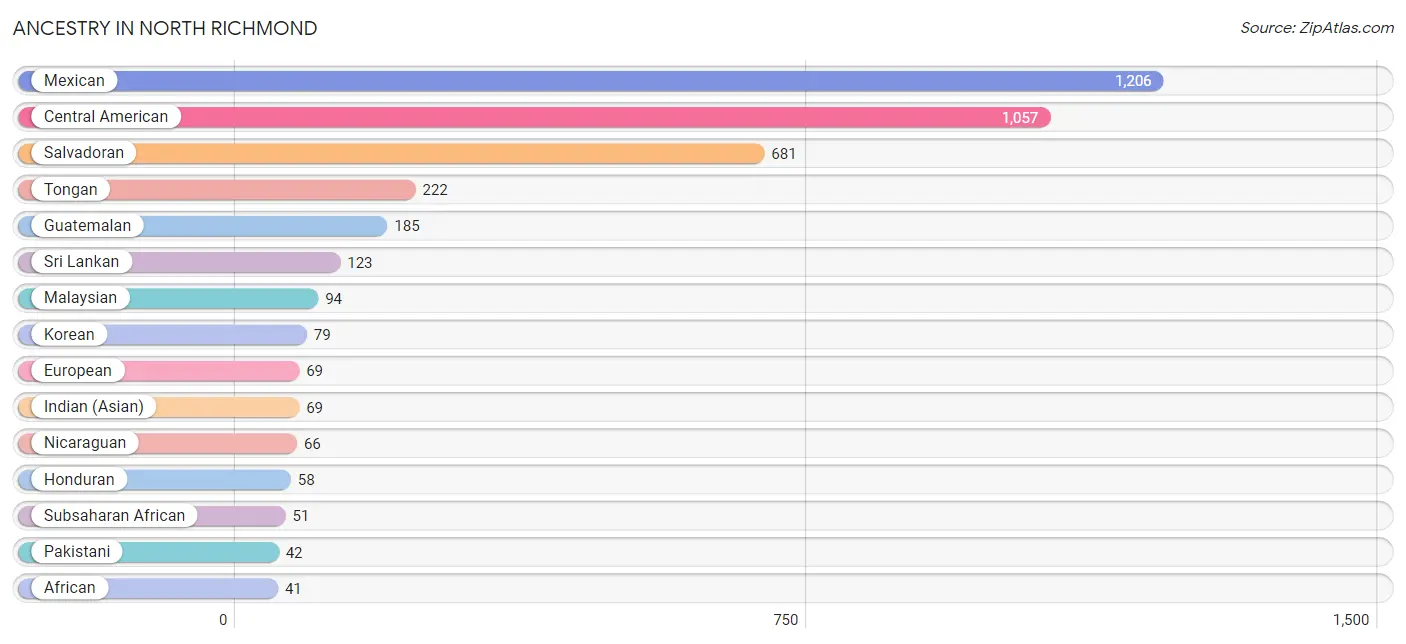
Ancestry in North Richmond
The most populous ancestries reported in North Richmond are Mexican (1,206 | 32.3%), Central American (1,057 | 28.3%), Salvadoran (681 | 18.2%), Tongan (222 | 5.9%), and Guatemalan (185 | 5.0%), together accounting for 89.8% of all North Richmond residents.
| Ancestry | # Population | % Population |
| African | 41 | 1.1% |
| American | 28 | 0.7% |
| Bhutanese | 5 | 0.1% |
| Central American | 1,057 | 28.3% |
| Central American Indian | 16 | 0.4% |
| Cherokee | 10 | 0.3% |
| Chippewa | 7 | 0.2% |
| Colombian | 14 | 0.4% |
| English | 9 | 0.2% |
| European | 69 | 1.8% |
| German | 24 | 0.6% |
| Guatemalan | 185 | 5.0% |
| Honduran | 58 | 1.5% |
| Indian (Asian) | 69 | 1.8% |
| Irish | 10 | 0.3% |
| Korean | 79 | 2.1% |
| Malaysian | 94 | 2.5% |
| Mexican | 1,206 | 32.3% |
| Native Hawaiian | 23 | 0.6% |
| Nicaraguan | 66 | 1.8% |
| Pakistani | 42 | 1.1% |
| Romanian | 29 | 0.8% |
| Salvadoran | 681 | 18.2% |
| South American | 40 | 1.1% |
| Sri Lankan | 123 | 3.3% |
| Subsaharan African | 51 | 1.4% |
| Tongan | 222 | 5.9% |
| Venezuelan | 26 | 0.7% | View All 28 Rows |
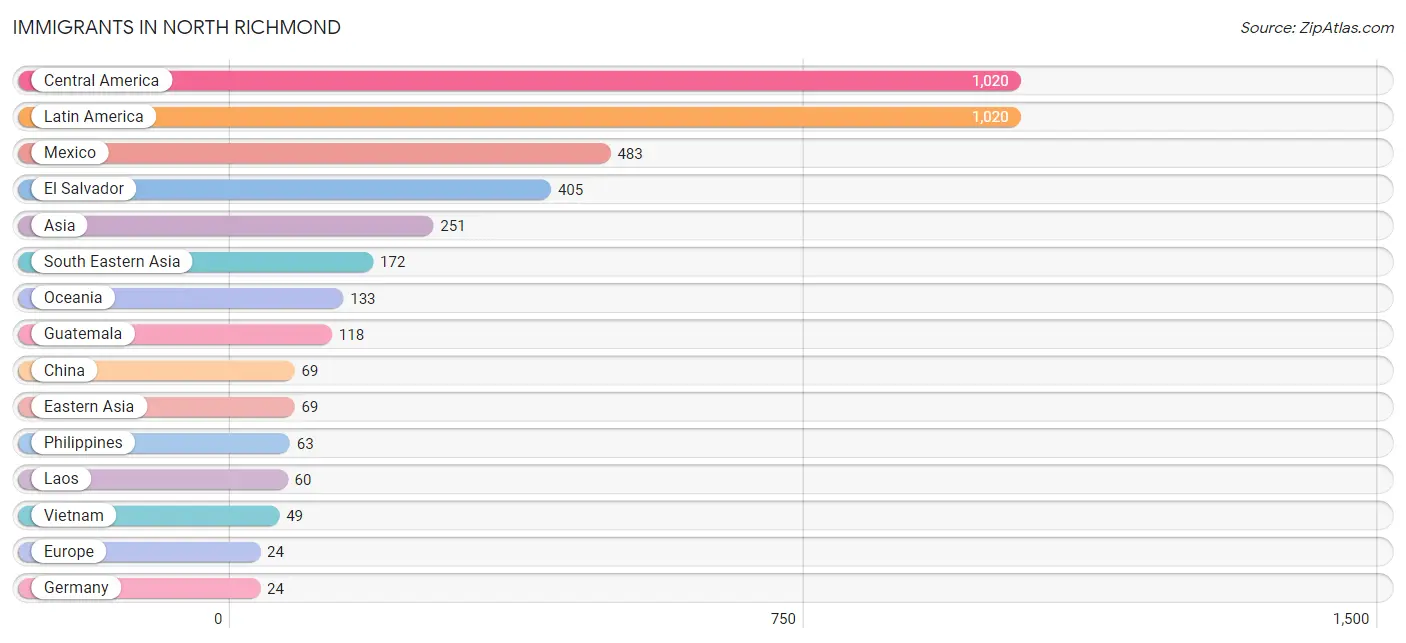
Immigrants in North Richmond
The most numerous immigrant groups reported in North Richmond came from Central America (1,020 | 27.3%), Latin America (1,020 | 27.3%), Mexico (483 | 12.9%), El Salvador (405 | 10.8%), and Asia (251 | 6.7%), together accounting for 85.2% of all North Richmond residents.
| Immigration Origin | # Population | % Population |
| Africa | 15 | 0.4% |
| Asia | 251 | 6.7% |
| Central America | 1,020 | 27.3% |
| China | 69 | 1.8% |
| Eastern Asia | 69 | 1.8% |
| El Salvador | 405 | 10.8% |
| Europe | 24 | 0.6% |
| Germany | 24 | 0.6% |
| Guatemala | 118 | 3.2% |
| Honduras | 14 | 0.4% |
| Laos | 60 | 1.6% |
| Latin America | 1,020 | 27.3% |
| Mexico | 483 | 12.9% |
| Morocco | 15 | 0.4% |
| Nepal | 5 | 0.1% |
| Northern Africa | 15 | 0.4% |
| Oceania | 133 | 3.6% |
| Philippines | 63 | 1.7% |
| South Central Asia | 10 | 0.3% |
| South Eastern Asia | 172 | 4.6% |
| Vietnam | 49 | 1.3% |
| Western Europe | 24 | 0.6% | View All 22 Rows |
Sex and Age in North Richmond
Sex and Age in North Richmond
The most populous age groups in North Richmond are 10 to 14 Years (189 | 11.9%) for men and 40 to 44 Years (277 | 12.9%) for women.
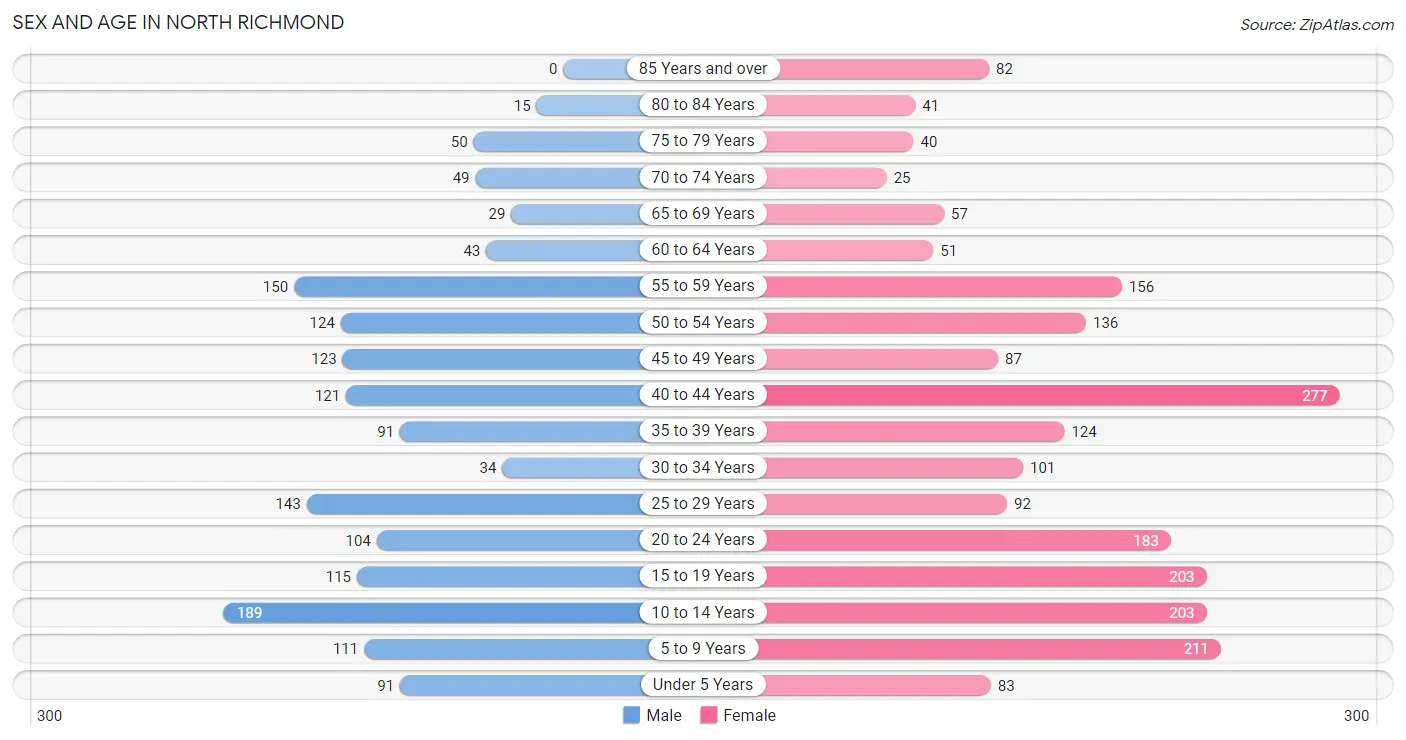
| Age Bracket | Male | Female |
| Under 5 Years | 91 (5.8%) | 83 (3.9%) |
| 5 to 9 Years | 111 (7.0%) | 211 (9.8%) |
| 10 to 14 Years | 189 (11.9%) | 203 (9.4%) |
| 15 to 19 Years | 115 (7.3%) | 203 (9.4%) |
| 20 to 24 Years | 104 (6.6%) | 183 (8.5%) |
| 25 to 29 Years | 143 (9.0%) | 92 (4.3%) |
| 30 to 34 Years | 34 (2.1%) | 101 (4.7%) |
| 35 to 39 Years | 91 (5.8%) | 124 (5.8%) |
| 40 to 44 Years | 121 (7.6%) | 277 (12.9%) |
| 45 to 49 Years | 123 (7.8%) | 87 (4.0%) |
| 50 to 54 Years | 124 (7.8%) | 136 (6.3%) |
| 55 to 59 Years | 150 (9.5%) | 156 (7.2%) |
| 60 to 64 Years | 43 (2.7%) | 51 (2.4%) |
| 65 to 69 Years | 29 (1.8%) | 57 (2.6%) |
| 70 to 74 Years | 49 (3.1%) | 25 (1.2%) |
| 75 to 79 Years | 50 (3.2%) | 40 (1.9%) |
| 80 to 84 Years | 15 (0.9%) | 41 (1.9%) |
| 85 Years and over | 0 (0.0%) | 82 (3.8%) |
| Total | 1,582 (100.0%) | 2,152 (100.0%) |
Families and Households in North Richmond
Median Family Size in North Richmond
The median family size in North Richmond is 4.12 persons per family, with married-couple families (517 | 64.2%) accounting for the largest median family size of 4.56 persons per family. On the other hand, single female/mother families (208 | 25.8%) represent the smallest median family size with 3.10 persons per family.
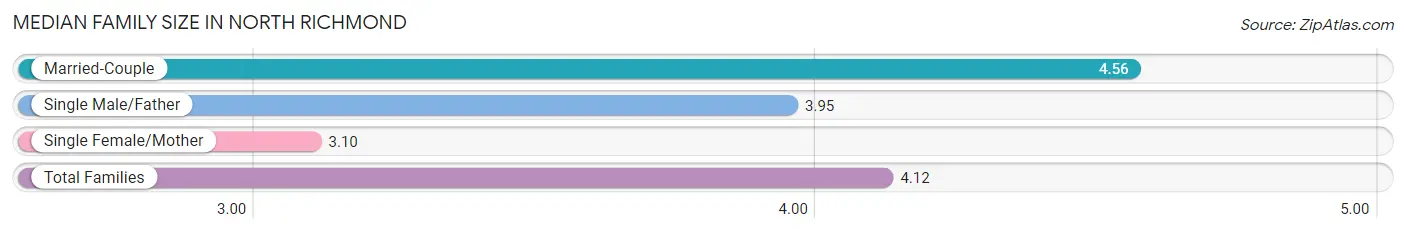
| Family Type | # Families | Family Size |
| Married-Couple | 517 (64.2%) | 4.56 |
| Single Male/Father | 80 (9.9%) | 3.95 |
| Single Female/Mother | 208 (25.8%) | 3.10 |
| Total Families | 805 (100.0%) | 4.12 |
Median Household Size in North Richmond
The median household size in North Richmond is 3.55 persons per household, with married-couple households (517 | 49.1%) accounting for the largest median household size of 4.56 persons per household. non-family households (248 | 23.5%) represent the smallest median household size with 1.25 persons per household.
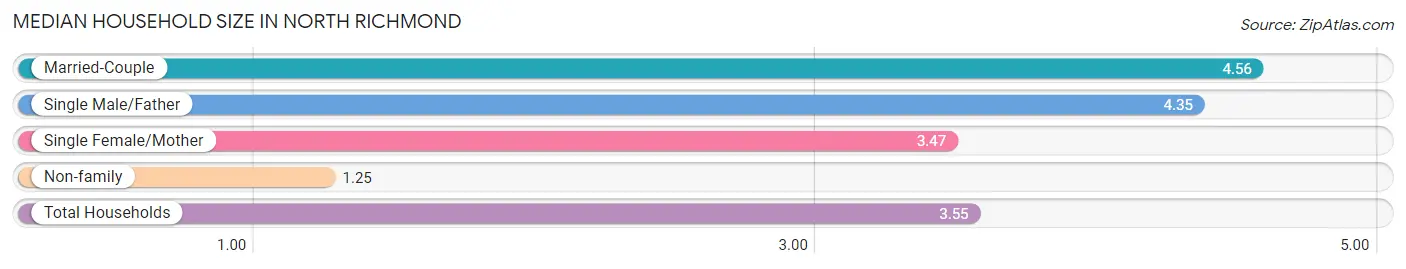
| Household Type | # Households | Household Size |
| Married-Couple | 517 (49.1%) | 4.56 |
| Single Male/Father | 80 (7.6%) | 4.35 |
| Single Female/Mother | 208 (19.8%) | 3.47 |
| Non-family | 248 (23.5%) | 1.25 |
| Total Households | 1,053 (100.0%) | 3.55 |
Household Size by Marriage Status in North Richmond
Out of a total of 1,053 households in North Richmond, 805 (76.4%) are family households, while 248 (23.5%) are nonfamily households. The most numerous type of family households are 4-person households, comprising 231, and the most common type of nonfamily households are 1-person households, comprising 200.
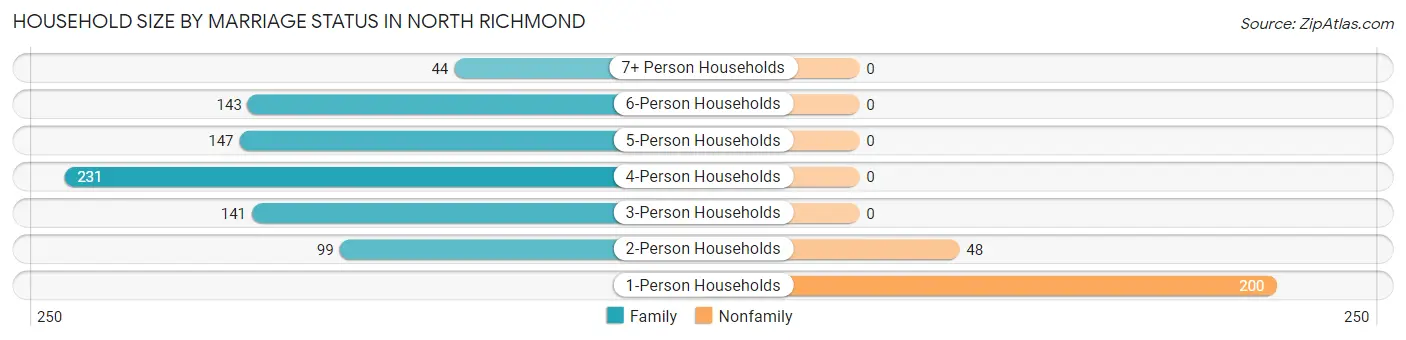
| Household Size | Family Households | Nonfamily Households |
| 1-Person Households | - | 200 (19.0%) |
| 2-Person Households | 99 (9.4%) | 48 (4.6%) |
| 3-Person Households | 141 (13.4%) | 0 (0.0%) |
| 4-Person Households | 231 (21.9%) | 0 (0.0%) |
| 5-Person Households | 147 (14.0%) | 0 (0.0%) |
| 6-Person Households | 143 (13.6%) | 0 (0.0%) |
| 7+ Person Households | 44 (4.2%) | 0 (0.0%) |
| Total | 805 (76.4%) | 248 (23.5%) |
Female Fertility in North Richmond
Fertility by Age in North Richmond
Average fertility rate in North Richmond is 57.0 births per 1,000 women. Women in the age bracket of 20 to 34 years have the highest fertility rate with 90.0 births per 1,000 women. Women in the age bracket of 20 to 34 years acount for 54.0% of all women with births.
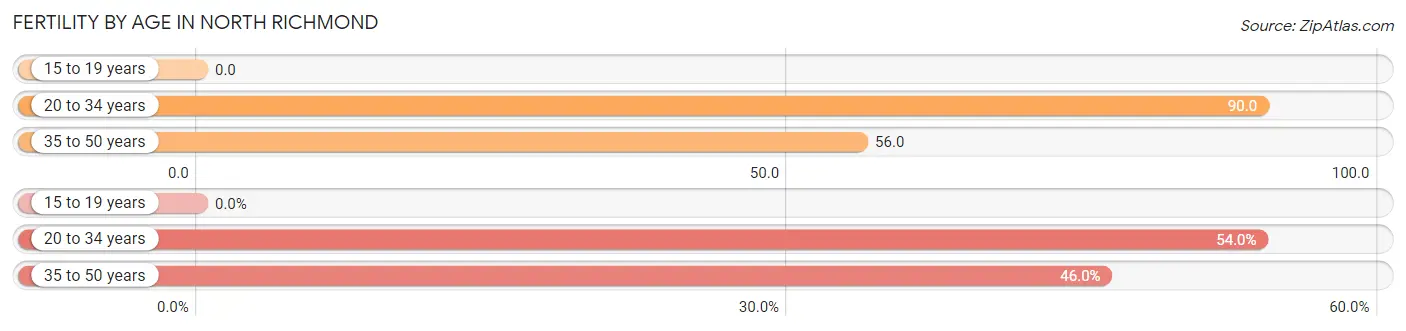
| Age Bracket | Women with Births | Births / 1,000 Women |
| 15 to 19 years | 0 (0.0%) | 0.0 |
| 20 to 34 years | 34 (54.0%) | 90.0 |
| 35 to 50 years | 29 (46.0%) | 56.0 |
| Total | 63 (100.0%) | 57.0 |
Fertility by Age by Marriage Status in North Richmond
74.6% of women with births (63) in North Richmond are married. The highest percentage of unmarried women with births falls into 20 to 34 years age bracket with 47.1% of them unmarried at the time of birth, while the lowest percentage of unmarried women with births belong to 35 to 50 years age bracket with 0.0% of them unmarried.
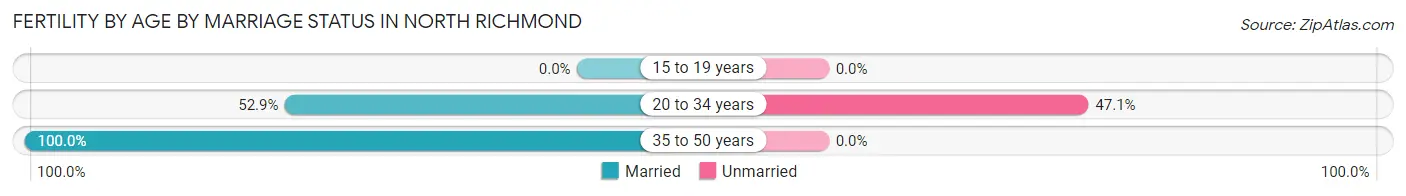
| Age Bracket | Married | Unmarried |
| 15 to 19 years | 0 (0.0%) | 0 (0.0%) |
| 20 to 34 years | 18 (52.9%) | 16 (47.1%) |
| 35 to 50 years | 29 (100.0%) | 0 (0.0%) |
| Total | 47 (74.6%) | 16 (25.4%) |
Fertility by Education in North Richmond
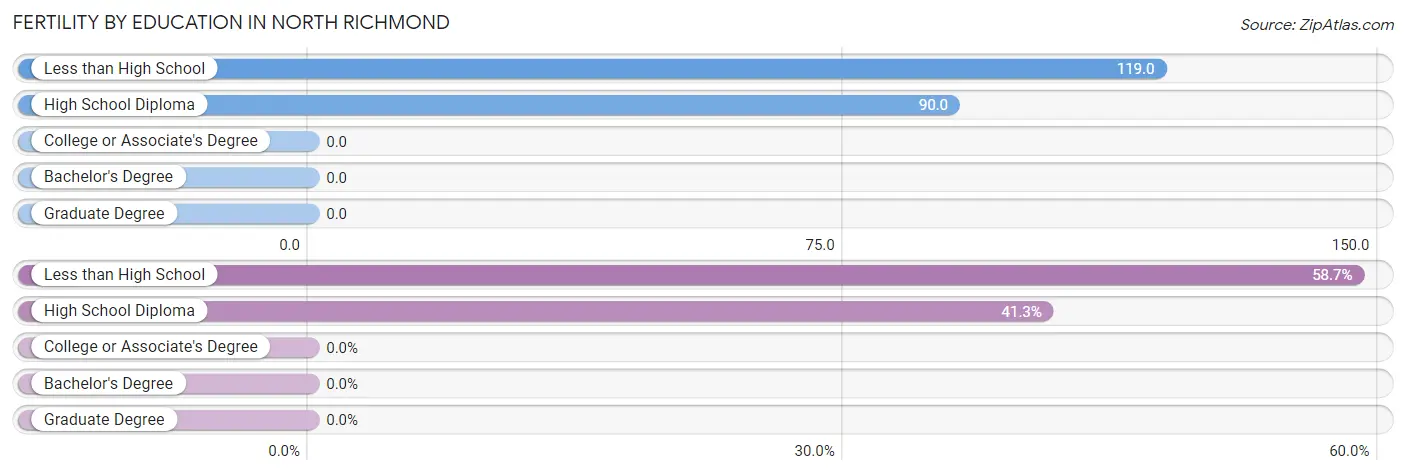
| Educational Attainment | Women with Births | Births / 1,000 Women |
| Less than High School | 37 (58.7%) | 119.0 |
| High School Diploma | 26 (41.3%) | 90.0 |
| College or Associate's Degree | 0 (0.0%) | 0.0 |
| Bachelor's Degree | 0 (0.0%) | 0.0 |
| Graduate Degree | 0 (0.0%) | 0.0 |
| Total | 63 (100.0%) | 57.0 |
Fertility by Education by Marriage Status in North Richmond
25.4% of women with births in North Richmond are unmarried. Women with the educational attainment of high school diploma are most likely to be married with 100.0% of them married at childbirth, while women with the educational attainment of less than high school are least likely to be married with 43.2% of them unmarried at childbirth.
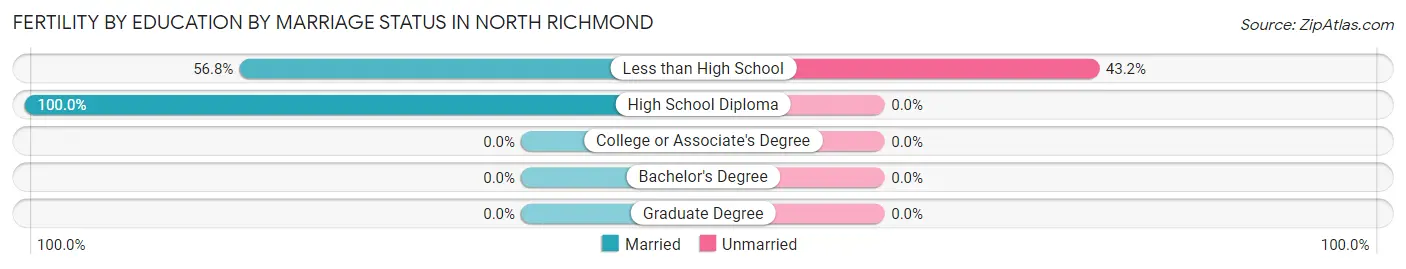
| Educational Attainment | Married | Unmarried |
| Less than High School | 21 (56.8%) | 16 (43.2%) |
| High School Diploma | 26 (100.0%) | 0 (0.0%) |
| College or Associate's Degree | 0 (0.0%) | 0 (0.0%) |
| Bachelor's Degree | 0 (0.0%) | 0 (0.0%) |
| Graduate Degree | 0 (0.0%) | 0 (0.0%) |
| Total | 47 (74.6%) | 16 (25.4%) |
Employment Characteristics in North Richmond
Employment by Class of Employer in North Richmond
Among the 1,842 employed individuals in North Richmond, private company employees (1,089 | 59.1%), local government employees (303 | 16.5%), and not-for-profit organizations (179 | 9.7%) make up the most common classes of employment.
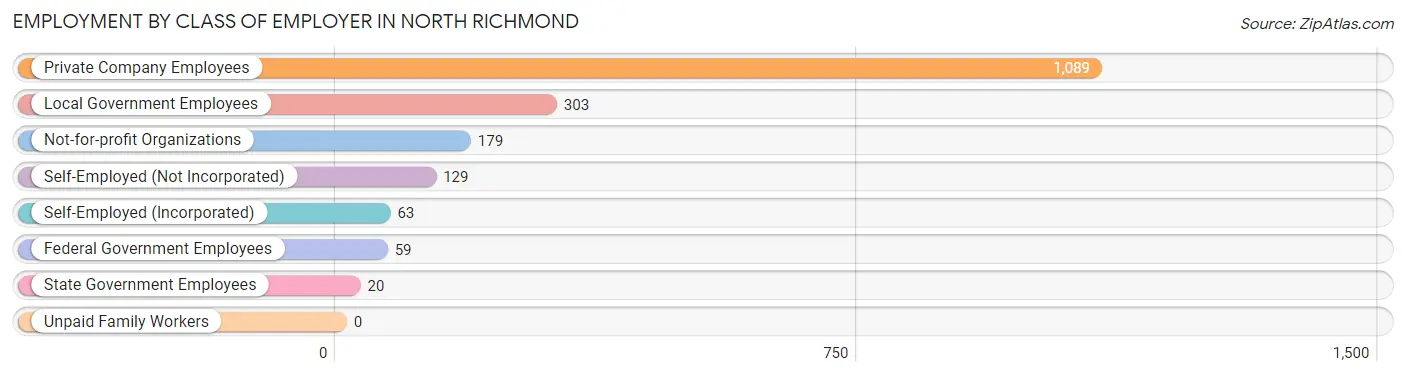
| Employer Class | # Employees | % Employees |
| Private Company Employees | 1,089 | 59.1% |
| Self-Employed (Incorporated) | 63 | 3.4% |
| Self-Employed (Not Incorporated) | 129 | 7.0% |
| Not-for-profit Organizations | 179 | 9.7% |
| Local Government Employees | 303 | 16.5% |
| State Government Employees | 20 | 1.1% |
| Federal Government Employees | 59 | 3.2% |
| Unpaid Family Workers | 0 | 0.0% |
| Total | 1,842 | 100.0% |
Employment Status by Age in North Richmond
According to the labor force statistics for North Richmond, out of the total population over 16 years of age (2,809), 69.9% or 1,963 individuals are in the labor force, with 3.1% or 61 of them unemployed. The age group with the highest labor force participation rate is 45 to 54 years, with 95.7% or 450 individuals in the labor force. Within the labor force, the 65 to 74 years age range has the highest percentage of unemployed individuals, with 20.0% or 10 of them being unemployed.
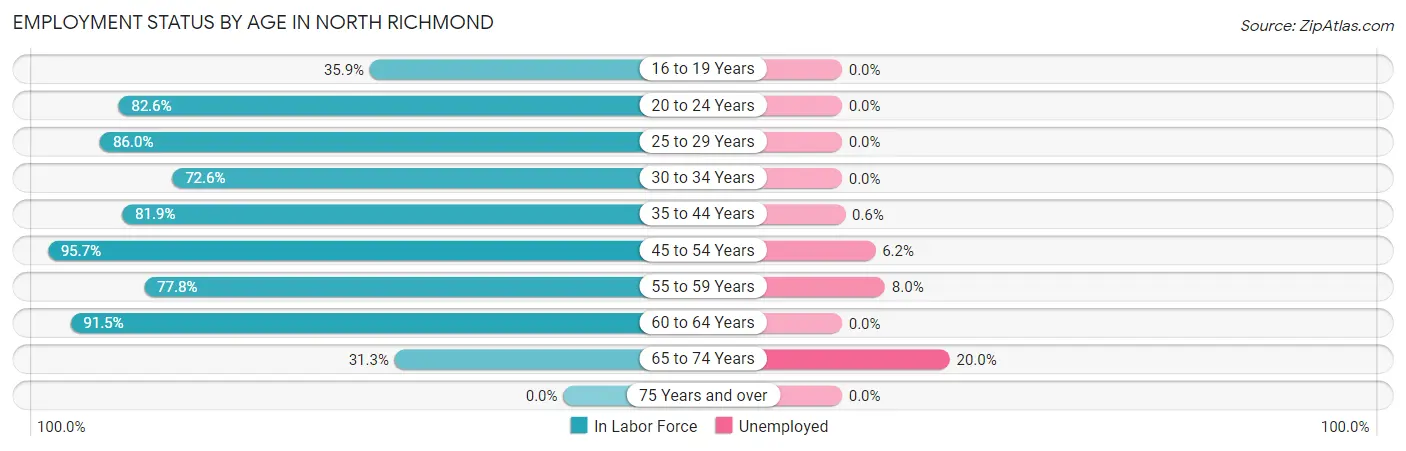
| Age Bracket | In Labor Force | Unemployed |
| 16 to 19 Years | 101 (35.9%) | 0 (0.0%) |
| 20 to 24 Years | 237 (82.6%) | 0 (0.0%) |
| 25 to 29 Years | 202 (86.0%) | 0 (0.0%) |
| 30 to 34 Years | 98 (72.6%) | 0 (0.0%) |
| 35 to 44 Years | 502 (81.9%) | 3 (0.6%) |
| 45 to 54 Years | 450 (95.7%) | 28 (6.2%) |
| 55 to 59 Years | 238 (77.8%) | 19 (8.0%) |
| 60 to 64 Years | 86 (91.5%) | 0 (0.0%) |
| 65 to 74 Years | 50 (31.3%) | 10 (20.0%) |
| 75 Years and over | 0 (0.0%) | 0 (0.0%) |
| Total | 1,963 (69.9%) | 61 (3.1%) |
Employment Status by Educational Attainment in North Richmond
According to labor force statistics for North Richmond, 85.1% of individuals (1,577) out of the total population between 25 and 64 years of age (1,853) are in the labor force, with 3.2% or 50 of them being unemployed. The group with the highest labor force participation rate are those with the educational attainment of bachelor's degree or higher, with 94.4% or 185 individuals in the labor force. Within the labor force, individuals with college / associate degree education have the highest percentage of unemployment, with 7.4% or 29 of them being unemployed.
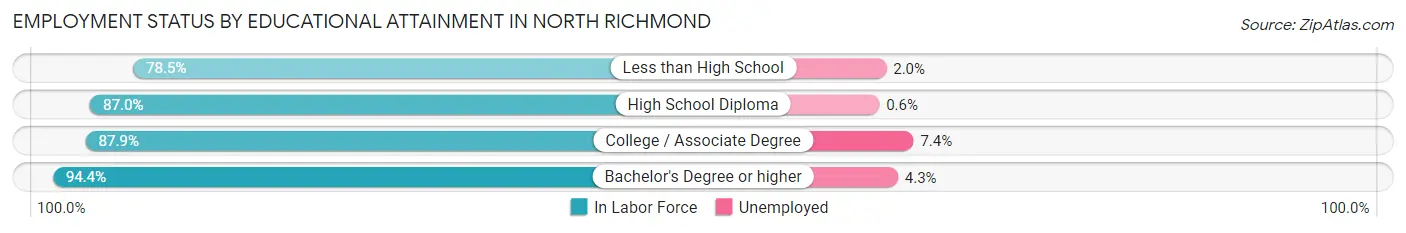
| Educational Attainment | In Labor Force | Unemployed |
| Less than High School | 508 (78.5%) | 13 (2.0%) |
| High School Diploma | 489 (87.0%) | 3 (0.6%) |
| College / Associate Degree | 394 (87.9%) | 33 (7.4%) |
| Bachelor's Degree or higher | 185 (94.4%) | 8 (4.3%) |
| Total | 1,577 (85.1%) | 59 (3.2%) |
Employment Occupations by Sex in North Richmond
Management, Business, Science and Arts Occupations
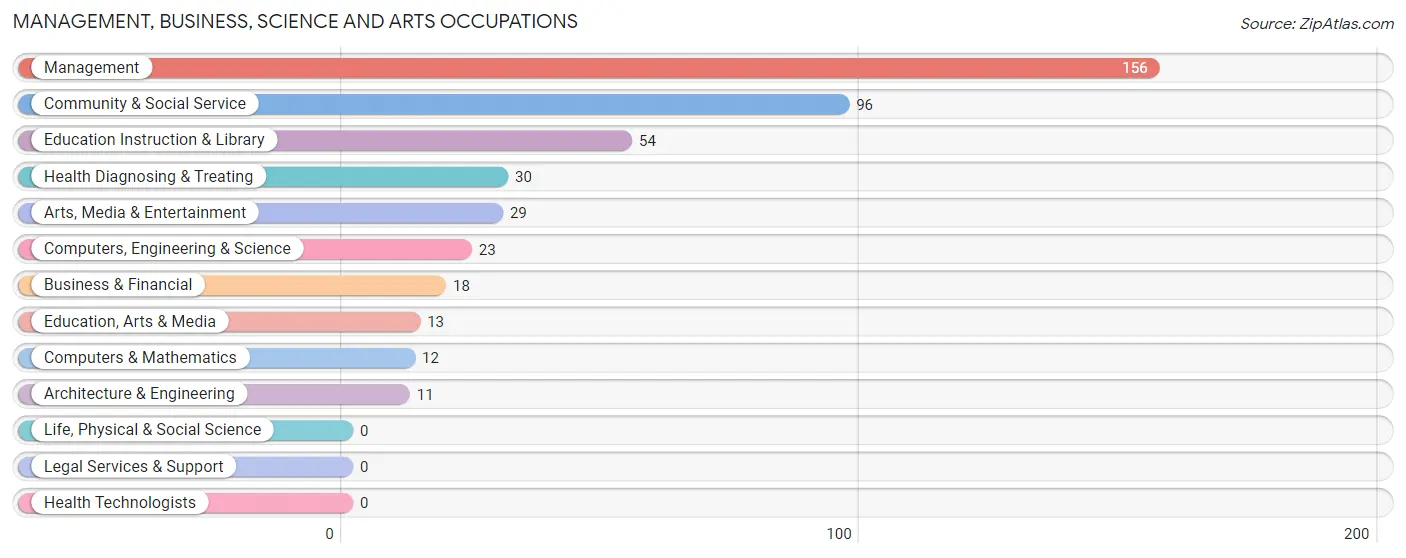
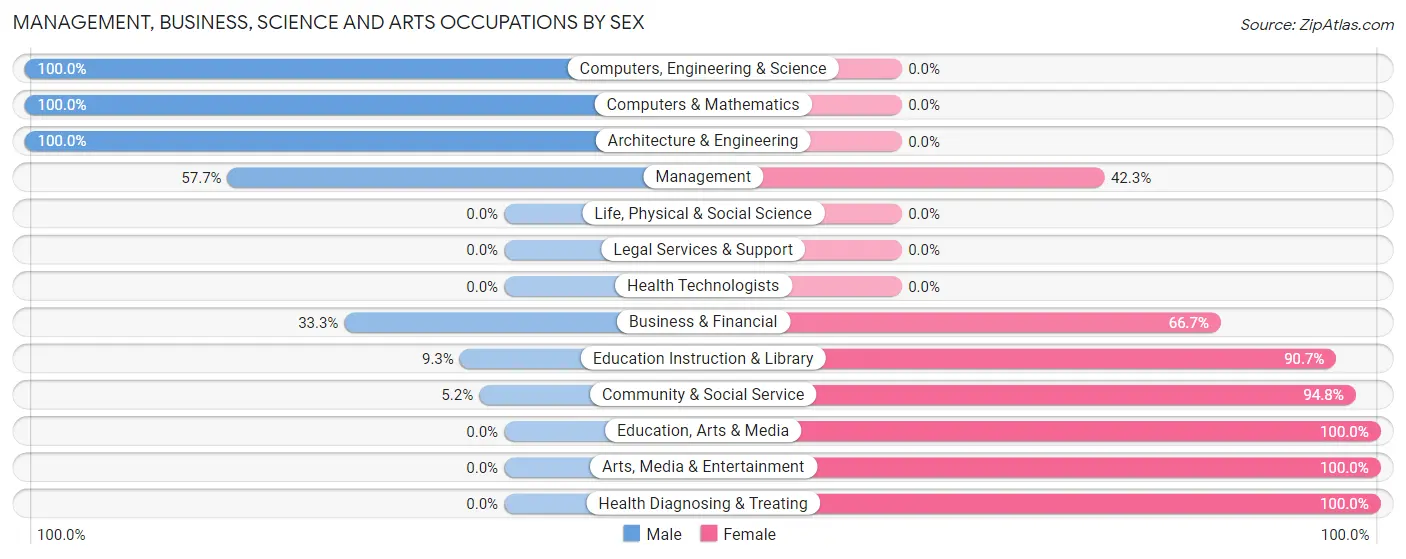
The most common Management, Business, Science and Arts occupations in North Richmond are Management (156 | 8.2%), Community & Social Service (96 | 5.0%), Education Instruction & Library (54 | 2.8%), Health Diagnosing & Treating (30 | 1.6%), and Arts, Media & Entertainment (29 | 1.5%).
Management, Business, Science and Arts Occupations by Sex
Within the Management, Business, Science and Arts occupations in North Richmond, the most male-oriented occupations are Computers, Engineering & Science (100.0%), Computers & Mathematics (100.0%), and Architecture & Engineering (100.0%), while the most female-oriented occupations are Education, Arts & Media (100.0%), Arts, Media & Entertainment (100.0%), and Health Diagnosing & Treating (100.0%).
| Occupation | Male | Female |
| Management | 90 (57.7%) | 66 (42.3%) |
| Business & Financial | 6 (33.3%) | 12 (66.7%) |
| Computers, Engineering & Science | 23 (100.0%) | 0 (0.0%) |
| Computers & Mathematics | 12 (100.0%) | 0 (0.0%) |
| Architecture & Engineering | 11 (100.0%) | 0 (0.0%) |
| Life, Physical & Social Science | 0 (0.0%) | 0 (0.0%) |
| Community & Social Service | 5 (5.2%) | 91 (94.8%) |
| Education, Arts & Media | 0 (0.0%) | 13 (100.0%) |
| Legal Services & Support | 0 (0.0%) | 0 (0.0%) |
| Education Instruction & Library | 5 (9.3%) | 49 (90.7%) |
| Arts, Media & Entertainment | 0 (0.0%) | 29 (100.0%) |
| Health Diagnosing & Treating | 0 (0.0%) | 30 (100.0%) |
| Health Technologists | 0 (0.0%) | 0 (0.0%) |
| Total (Category) | 124 (38.4%) | 199 (61.6%) |
| Total (Overall) | 904 (47.5%) | 1,000 (52.5%) |
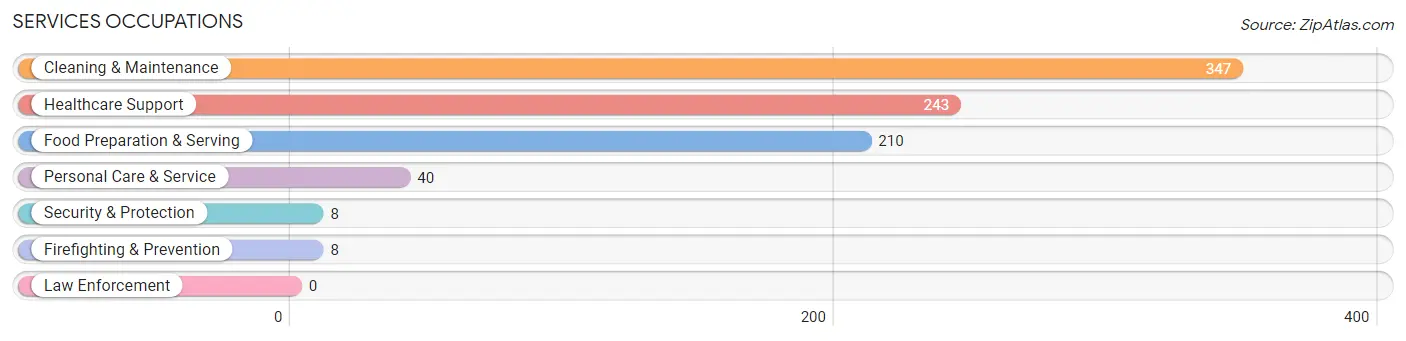
Services Occupations
The most common Services occupations in North Richmond are Cleaning & Maintenance (347 | 18.2%), Healthcare Support (243 | 12.8%), Food Preparation & Serving (210 | 11.0%), Personal Care & Service (40 | 2.1%), and Security & Protection (8 | 0.4%).
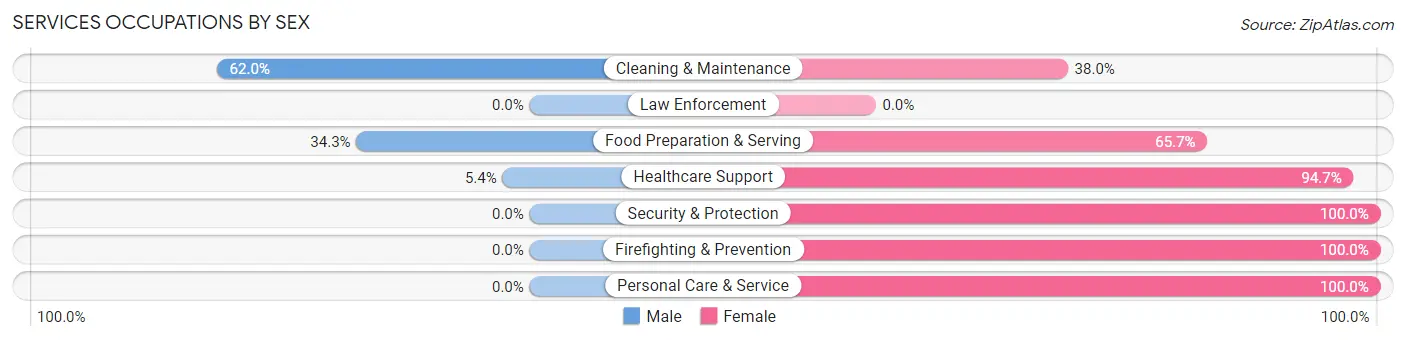
Services Occupations by Sex
Within the Services occupations in North Richmond, the most male-oriented occupations are Cleaning & Maintenance (62.0%), Food Preparation & Serving (34.3%), and Healthcare Support (5.3%), while the most female-oriented occupations are Security & Protection (100.0%), Firefighting & Prevention (100.0%), and Personal Care & Service (100.0%).
| Occupation | Male | Female |
| Healthcare Support | 13 (5.3%) | 230 (94.7%) |
| Security & Protection | 0 (0.0%) | 8 (100.0%) |
| Firefighting & Prevention | 0 (0.0%) | 8 (100.0%) |
| Law Enforcement | 0 (0.0%) | 0 (0.0%) |
| Food Preparation & Serving | 72 (34.3%) | 138 (65.7%) |
| Cleaning & Maintenance | 215 (62.0%) | 132 (38.0%) |
| Personal Care & Service | 0 (0.0%) | 40 (100.0%) |
| Total (Category) | 300 (35.4%) | 548 (64.6%) |
| Total (Overall) | 904 (47.5%) | 1,000 (52.5%) |
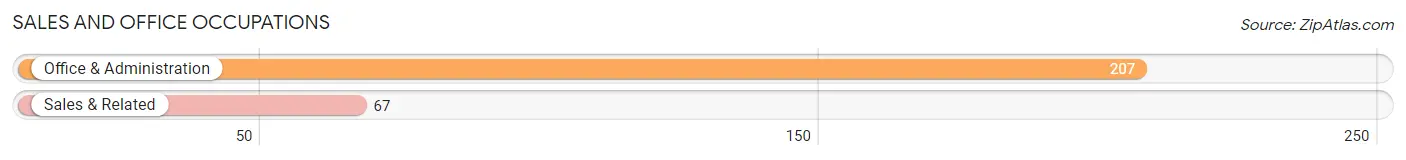
Sales and Office Occupations
The most common Sales and Office occupations in North Richmond are Office & Administration (207 | 10.9%), and Sales & Related (67 | 3.5%).
Sales and Office Occupations by Sex
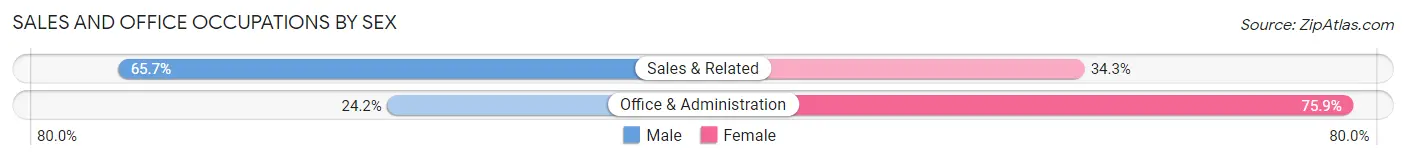
| Occupation | Male | Female |
| Sales & Related | 44 (65.7%) | 23 (34.3%) |
| Office & Administration | 50 (24.1%) | 157 (75.8%) |
| Total (Category) | 94 (34.3%) | 180 (65.7%) |
| Total (Overall) | 904 (47.5%) | 1,000 (52.5%) |
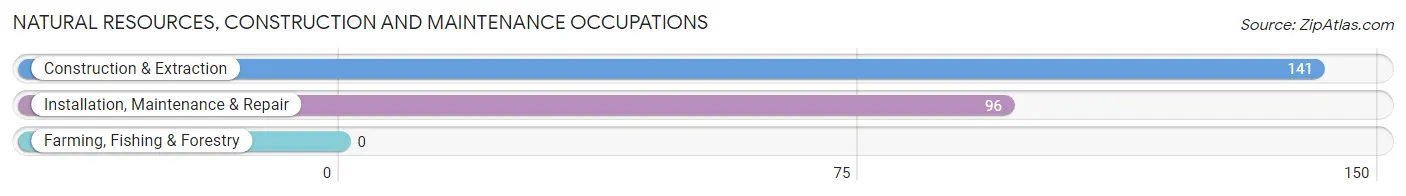
Natural Resources, Construction and Maintenance Occupations
The most common Natural Resources, Construction and Maintenance occupations in North Richmond are Construction & Extraction (141 | 7.4%), and Installation, Maintenance & Repair (96 | 5.0%).
Natural Resources, Construction and Maintenance Occupations by Sex
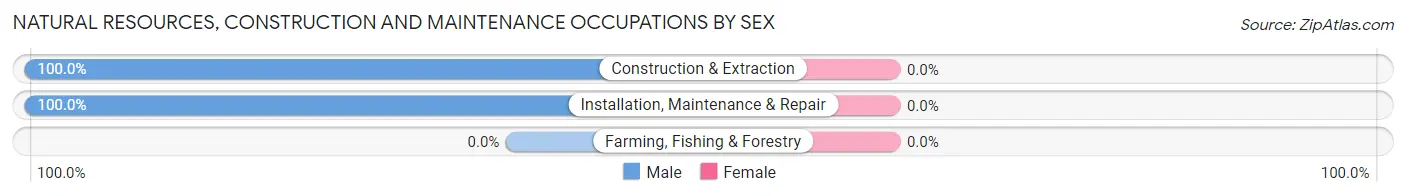
| Occupation | Male | Female |
| Farming, Fishing & Forestry | 0 (0.0%) | 0 (0.0%) |
| Construction & Extraction | 141 (100.0%) | 0 (0.0%) |
| Installation, Maintenance & Repair | 96 (100.0%) | 0 (0.0%) |
| Total (Category) | 237 (100.0%) | 0 (0.0%) |
| Total (Overall) | 904 (47.5%) | 1,000 (52.5%) |
Production, Transportation and Moving Occupations
The most common Production, Transportation and Moving occupations in North Richmond are Material Moving (89 | 4.7%), Transportation (85 | 4.5%), and Production (48 | 2.5%).
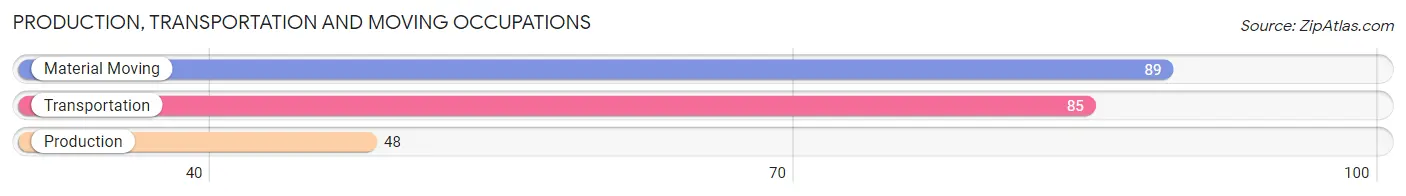
Production, Transportation and Moving Occupations by Sex
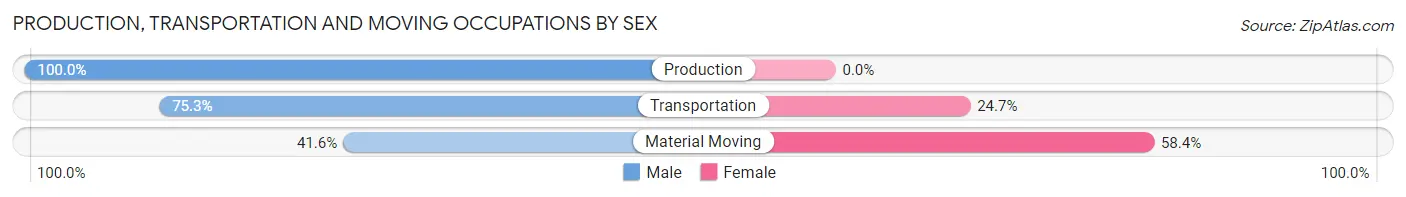
| Occupation | Male | Female |
| Production | 48 (100.0%) | 0 (0.0%) |
| Transportation | 64 (75.3%) | 21 (24.7%) |
| Material Moving | 37 (41.6%) | 52 (58.4%) |
| Total (Category) | 149 (67.1%) | 73 (32.9%) |
| Total (Overall) | 904 (47.5%) | 1,000 (52.5%) |
Employment Industries by Sex in North Richmond
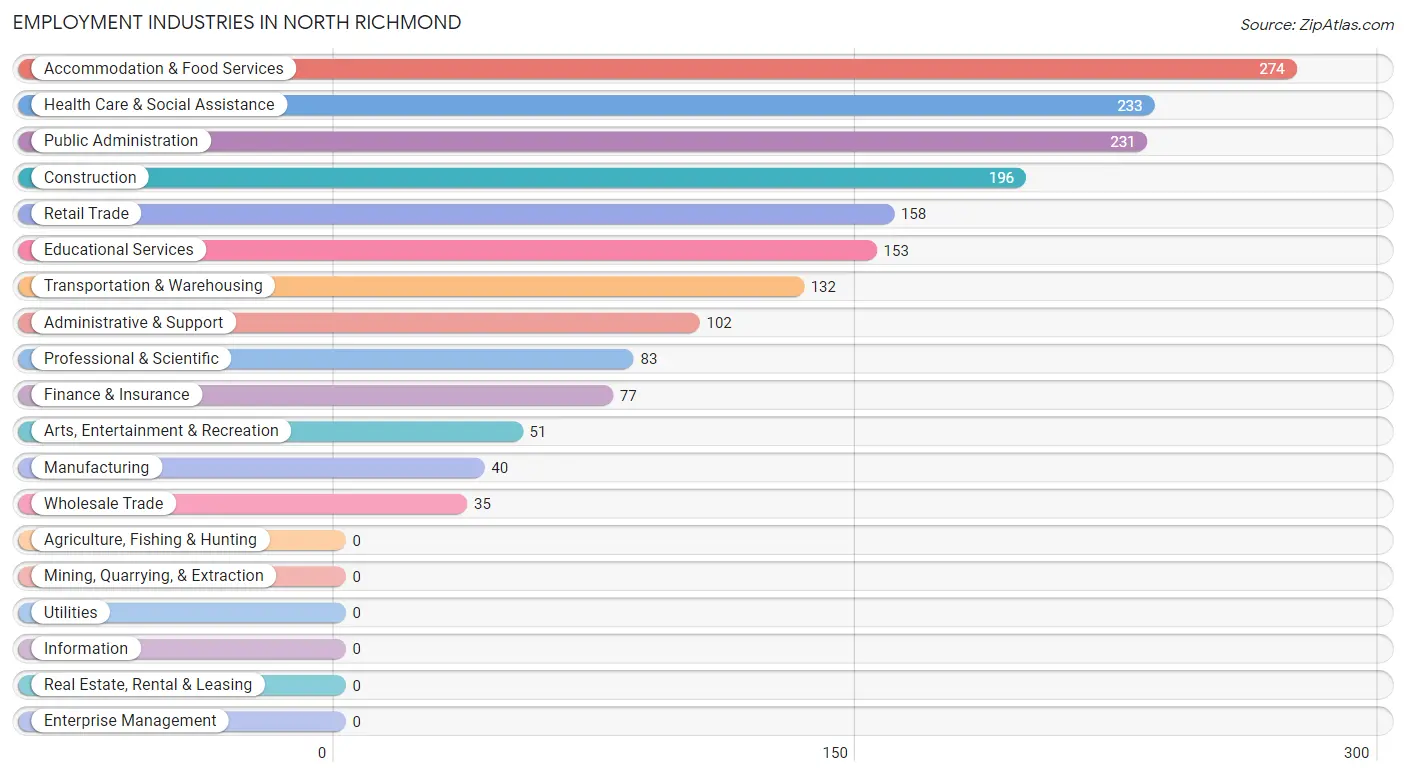
Employment Industries in North Richmond
The major employment industries in North Richmond include Accommodation & Food Services (274 | 14.4%), Health Care & Social Assistance (233 | 12.2%), Public Administration (231 | 12.1%), Construction (196 | 10.3%), and Retail Trade (158 | 8.3%).
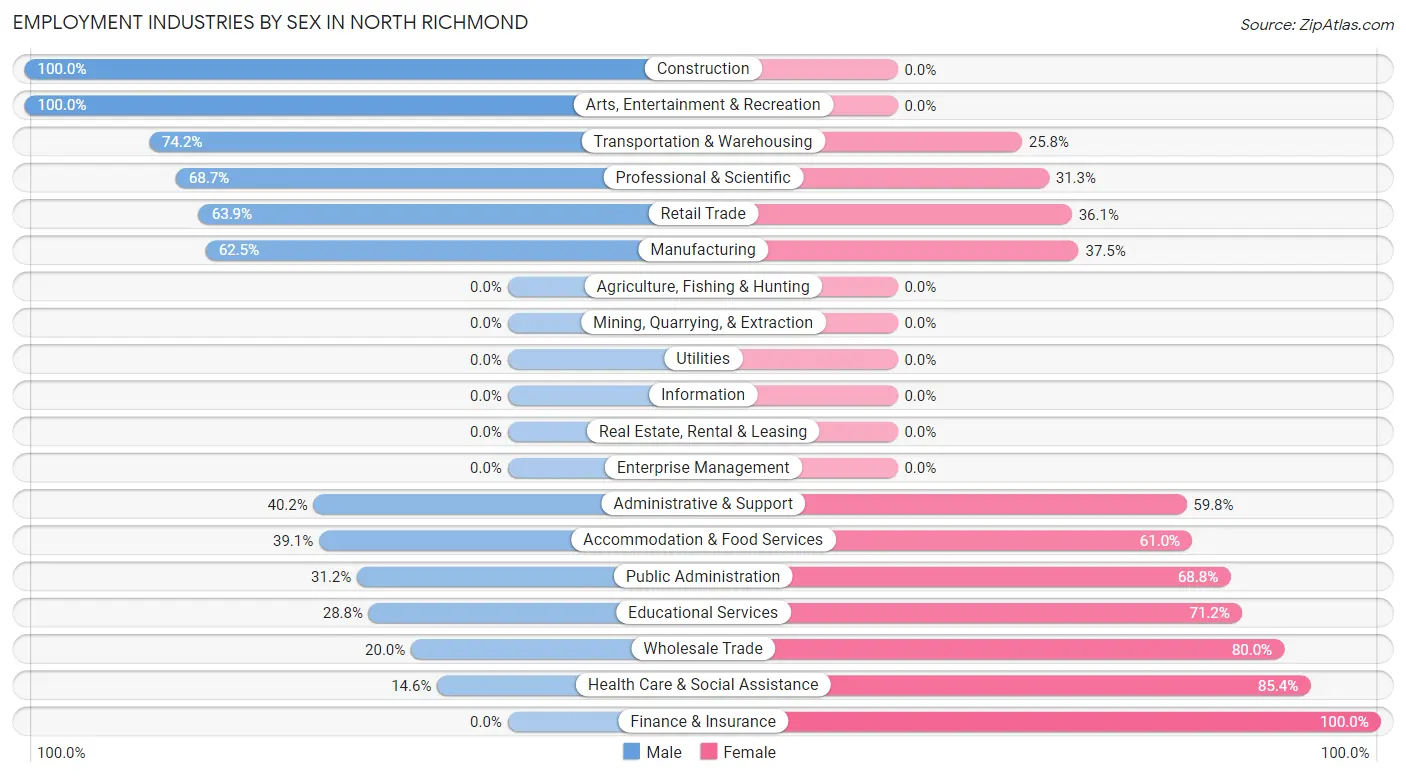
Employment Industries by Sex in North Richmond
The North Richmond industries that see more men than women are Construction (100.0%), Arts, Entertainment & Recreation (100.0%), and Transportation & Warehousing (74.2%), whereas the industries that tend to have a higher number of women are Finance & Insurance (100.0%), Health Care & Social Assistance (85.4%), and Wholesale Trade (80.0%).
| Industry | Male | Female |
| Agriculture, Fishing & Hunting | 0 (0.0%) | 0 (0.0%) |
| Mining, Quarrying, & Extraction | 0 (0.0%) | 0 (0.0%) |
| Construction | 196 (100.0%) | 0 (0.0%) |
| Manufacturing | 25 (62.5%) | 15 (37.5%) |
| Wholesale Trade | 7 (20.0%) | 28 (80.0%) |
| Retail Trade | 101 (63.9%) | 57 (36.1%) |
| Transportation & Warehousing | 98 (74.2%) | 34 (25.8%) |
| Utilities | 0 (0.0%) | 0 (0.0%) |
| Information | 0 (0.0%) | 0 (0.0%) |
| Finance & Insurance | 0 (0.0%) | 77 (100.0%) |
| Real Estate, Rental & Leasing | 0 (0.0%) | 0 (0.0%) |
| Professional & Scientific | 57 (68.7%) | 26 (31.3%) |
| Enterprise Management | 0 (0.0%) | 0 (0.0%) |
| Administrative & Support | 41 (40.2%) | 61 (59.8%) |
| Educational Services | 44 (28.8%) | 109 (71.2%) |
| Health Care & Social Assistance | 34 (14.6%) | 199 (85.4%) |
| Arts, Entertainment & Recreation | 51 (100.0%) | 0 (0.0%) |
| Accommodation & Food Services | 107 (39.1%) | 167 (61.0%) |
| Public Administration | 72 (31.2%) | 159 (68.8%) |
| Total | 904 (47.5%) | 1,000 (52.5%) |
Education in North Richmond
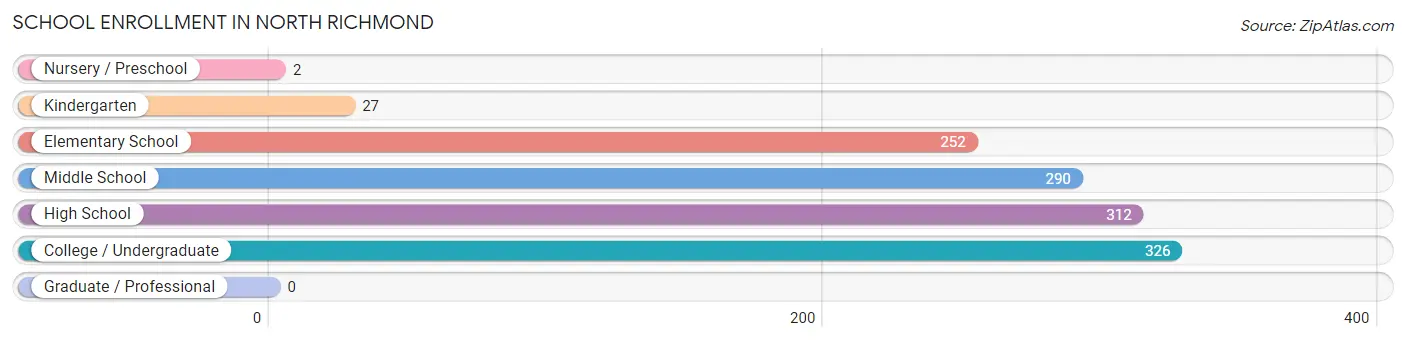
School Enrollment in North Richmond
The most common levels of schooling among the 1,209 students in North Richmond are college / undergraduate (326 | 27.0%), high school (312 | 25.8%), and middle school (290 | 24.0%).
| School Level | # Students | % Students |
| Nursery / Preschool | 2 | 0.2% |
| Kindergarten | 27 | 2.2% |
| Elementary School | 252 | 20.8% |
| Middle School | 290 | 24.0% |
| High School | 312 | 25.8% |
| College / Undergraduate | 326 | 27.0% |
| Graduate / Professional | 0 | 0.0% |
| Total | 1,209 | 100.0% |
School Enrollment by Age by Funding Source in North Richmond
Out of a total of 1,209 students who are enrolled in schools in North Richmond, 23 (1.9%) attend a private institution, while the remaining 1,186 (98.1%) are enrolled in public schools. The age group of 25 to 34 year olds has the highest likelihood of being enrolled in private schools, with 12 (19.1% in the age bracket) enrolled. Conversely, the age group of 10 to 14 year olds has the lowest likelihood of being enrolled in a private school, with 392 (100.0% in the age bracket) attending a public institution.
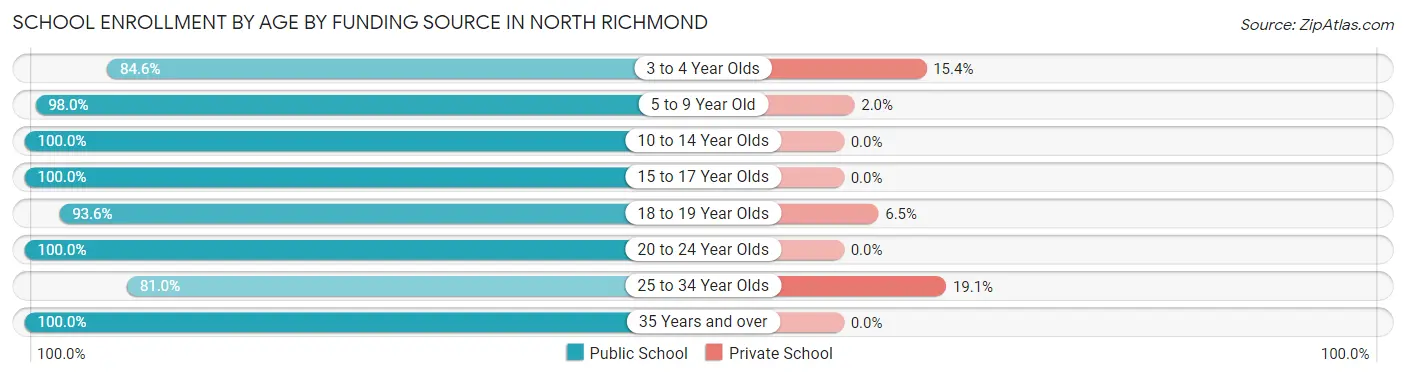
| Age Bracket | Public School | Private School |
| 3 to 4 Year Olds | 11 (84.6%) | 2 (15.4%) |
| 5 to 9 Year Old | 248 (98.0%) | 5 (2.0%) |
| 10 to 14 Year Olds | 392 (100.0%) | 0 (0.0%) |
| 15 to 17 Year Olds | 205 (100.0%) | 0 (0.0%) |
| 18 to 19 Year Olds | 58 (93.5%) | 4 (6.5%) |
| 20 to 24 Year Olds | 164 (100.0%) | 0 (0.0%) |
| 25 to 34 Year Olds | 51 (80.9%) | 12 (19.1%) |
| 35 Years and over | 57 (100.0%) | 0 (0.0%) |
| Total | 1,186 (98.1%) | 23 (1.9%) |
Educational Attainment by Field of Study in North Richmond
Business (130 | 44.4%), social sciences (51 | 17.4%), communications (23 | 7.9%), arts & humanities (23 | 7.9%), and science & technology (19 | 6.5%) are the most common fields of study among 293 individuals in North Richmond who have obtained a bachelor's degree or higher.
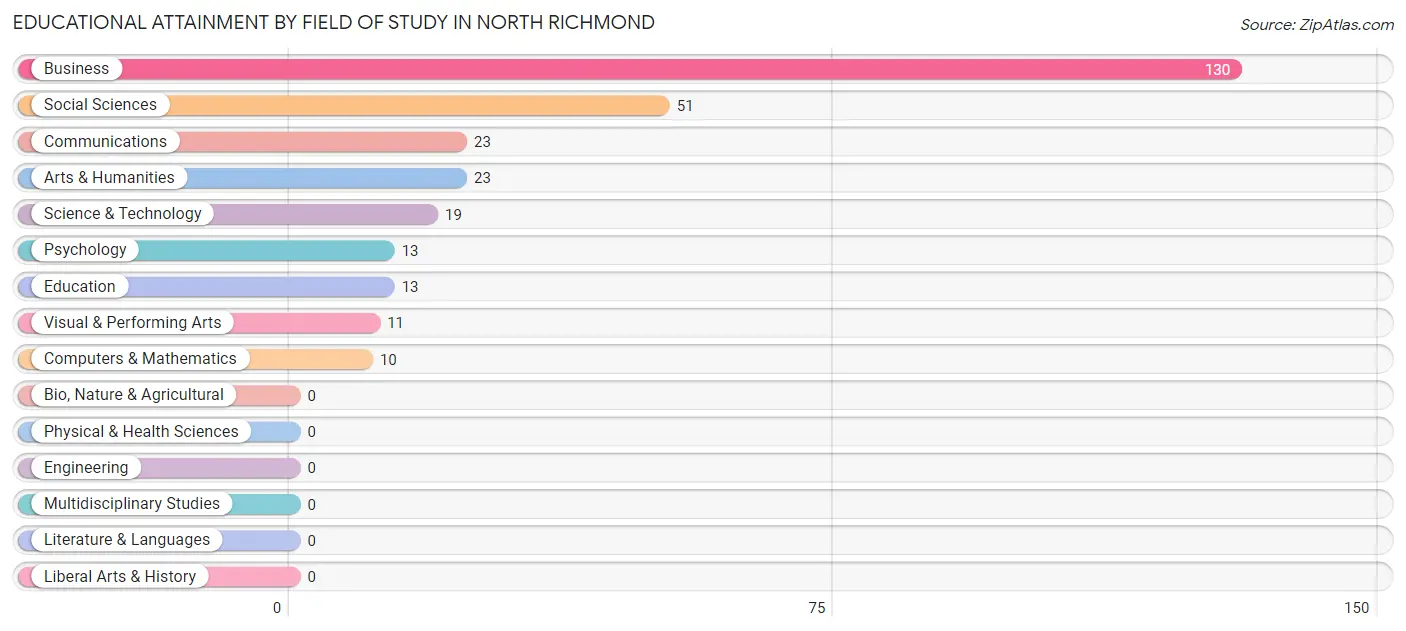
| Field of Study | # Graduates | % Graduates |
| Computers & Mathematics | 10 | 3.4% |
| Bio, Nature & Agricultural | 0 | 0.0% |
| Physical & Health Sciences | 0 | 0.0% |
| Psychology | 13 | 4.4% |
| Social Sciences | 51 | 17.4% |
| Engineering | 0 | 0.0% |
| Multidisciplinary Studies | 0 | 0.0% |
| Science & Technology | 19 | 6.5% |
| Business | 130 | 44.4% |
| Education | 13 | 4.4% |
| Literature & Languages | 0 | 0.0% |
| Liberal Arts & History | 0 | 0.0% |
| Visual & Performing Arts | 11 | 3.7% |
| Communications | 23 | 7.9% |
| Arts & Humanities | 23 | 7.9% |
| Total | 293 | 100.0% |
Transportation & Commute in North Richmond
Vehicle Availability by Sex in North Richmond
The most prevalent vehicle ownership categories in North Richmond are males with 3 vehicles (283, accounting for 33.3%) and females with 3 vehicles (467, making up 28.5%).
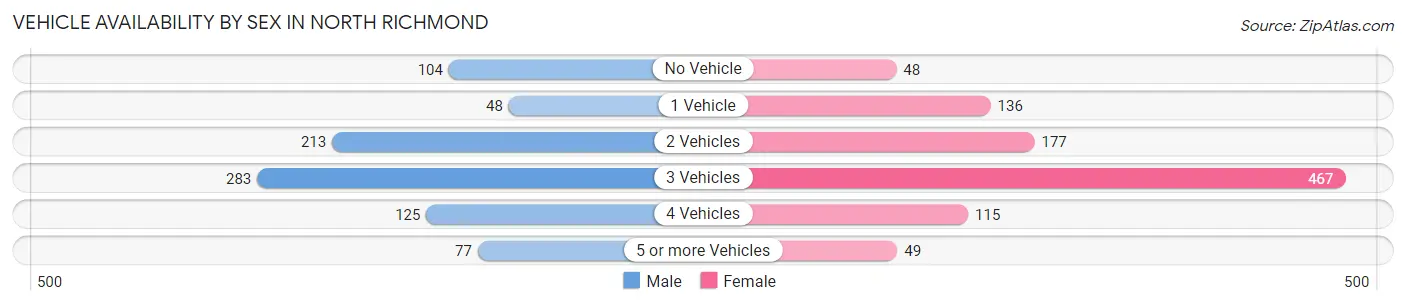
| Vehicles Available | Male | Female |
| No Vehicle | 104 (12.2%) | 48 (4.8%) |
| 1 Vehicle | 48 (5.7%) | 136 (13.7%) |
| 2 Vehicles | 213 (25.1%) | 177 (17.8%) |
| 3 Vehicles | 283 (33.3%) | 467 (47.1%) |
| 4 Vehicles | 125 (14.7%) | 115 (11.6%) |
| 5 or more Vehicles | 77 (9.1%) | 49 (4.9%) |
| Total | 850 (100.0%) | 992 (100.0%) |
Commute Time in North Richmond
The most frequently occuring commute durations in North Richmond are 30 to 34 minutes (301 commuters, 18.9%), 20 to 24 minutes (257 commuters, 16.2%), and 45 to 59 minutes (206 commuters, 13.0%).
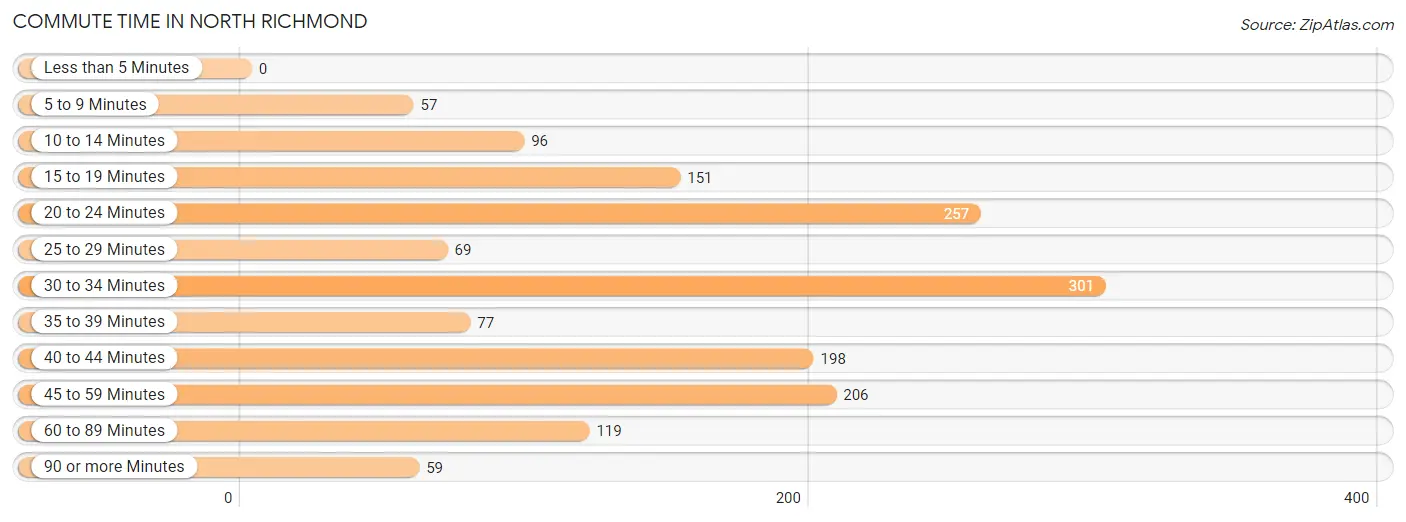
| Commute Time | # Commuters | % Commuters |
| Less than 5 Minutes | 0 | 0.0% |
| 5 to 9 Minutes | 57 | 3.6% |
| 10 to 14 Minutes | 96 | 6.0% |
| 15 to 19 Minutes | 151 | 9.5% |
| 20 to 24 Minutes | 257 | 16.2% |
| 25 to 29 Minutes | 69 | 4.3% |
| 30 to 34 Minutes | 301 | 18.9% |
| 35 to 39 Minutes | 77 | 4.8% |
| 40 to 44 Minutes | 198 | 12.4% |
| 45 to 59 Minutes | 206 | 13.0% |
| 60 to 89 Minutes | 119 | 7.5% |
| 90 or more Minutes | 59 | 3.7% |
Commute Time by Sex in North Richmond
The most common commute times in North Richmond are 30 to 34 minutes (115 commuters, 16.7%) for males and 30 to 34 minutes (186 commuters, 20.6%) for females.
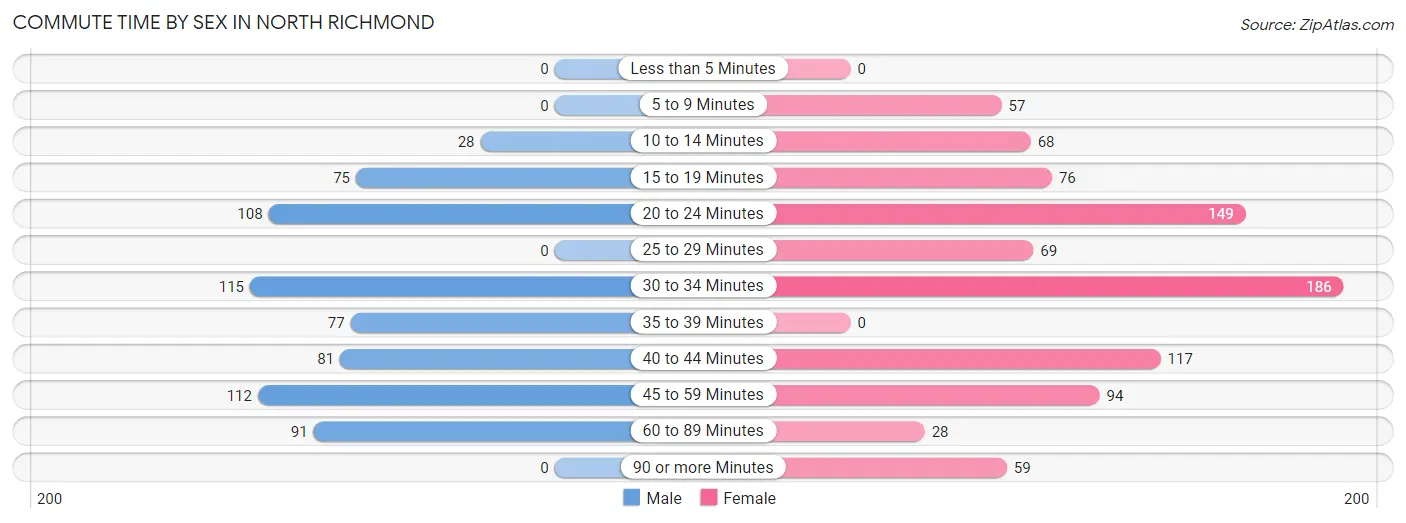
| Commute Time | Male | Female |
| Less than 5 Minutes | 0 (0.0%) | 0 (0.0%) |
| 5 to 9 Minutes | 0 (0.0%) | 57 (6.3%) |
| 10 to 14 Minutes | 28 (4.1%) | 68 (7.5%) |
| 15 to 19 Minutes | 75 (10.9%) | 76 (8.4%) |
| 20 to 24 Minutes | 108 (15.7%) | 149 (16.5%) |
| 25 to 29 Minutes | 0 (0.0%) | 69 (7.6%) |
| 30 to 34 Minutes | 115 (16.7%) | 186 (20.6%) |
| 35 to 39 Minutes | 77 (11.2%) | 0 (0.0%) |
| 40 to 44 Minutes | 81 (11.8%) | 117 (13.0%) |
| 45 to 59 Minutes | 112 (16.3%) | 94 (10.4%) |
| 60 to 89 Minutes | 91 (13.3%) | 28 (3.1%) |
| 90 or more Minutes | 0 (0.0%) | 59 (6.5%) |
Time of Departure to Work by Sex in North Richmond
The most frequent times of departure to work in North Richmond are 6:00 AM to 6:29 AM (128, 18.6%) for males and 7:00 AM to 7:29 AM (197, 21.8%) for females.
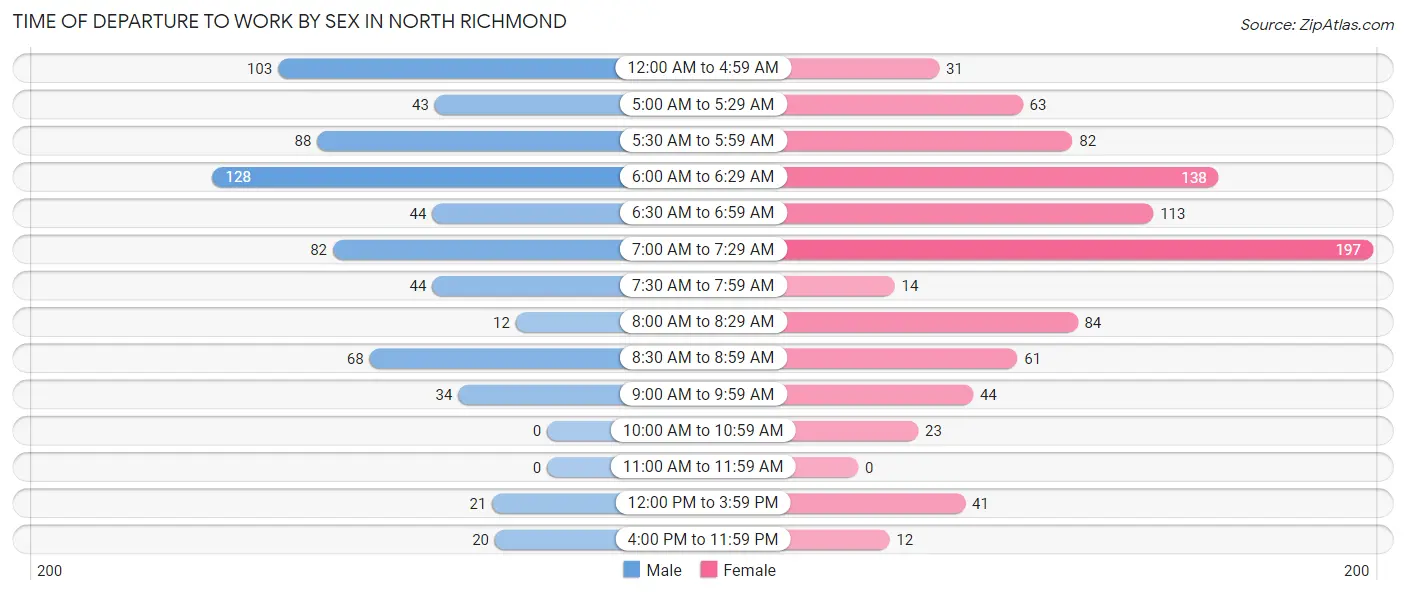
| Time of Departure | Male | Female |
| 12:00 AM to 4:59 AM | 103 (15.0%) | 31 (3.4%) |
| 5:00 AM to 5:29 AM | 43 (6.3%) | 63 (7.0%) |
| 5:30 AM to 5:59 AM | 88 (12.8%) | 82 (9.1%) |
| 6:00 AM to 6:29 AM | 128 (18.6%) | 138 (15.3%) |
| 6:30 AM to 6:59 AM | 44 (6.4%) | 113 (12.5%) |
| 7:00 AM to 7:29 AM | 82 (11.9%) | 197 (21.8%) |
| 7:30 AM to 7:59 AM | 44 (6.4%) | 14 (1.5%) |
| 8:00 AM to 8:29 AM | 12 (1.8%) | 84 (9.3%) |
| 8:30 AM to 8:59 AM | 68 (9.9%) | 61 (6.8%) |
| 9:00 AM to 9:59 AM | 34 (5.0%) | 44 (4.9%) |
| 10:00 AM to 10:59 AM | 0 (0.0%) | 23 (2.5%) |
| 11:00 AM to 11:59 AM | 0 (0.0%) | 0 (0.0%) |
| 12:00 PM to 3:59 PM | 21 (3.1%) | 41 (4.5%) |
| 4:00 PM to 11:59 PM | 20 (2.9%) | 12 (1.3%) |
| Total | 687 (100.0%) | 903 (100.0%) |
Housing Occupancy in North Richmond
Occupancy by Ownership in North Richmond
Of the total 1,053 dwellings in North Richmond, owner-occupied units account for 699 (66.4%), while renter-occupied units make up 354 (33.6%).
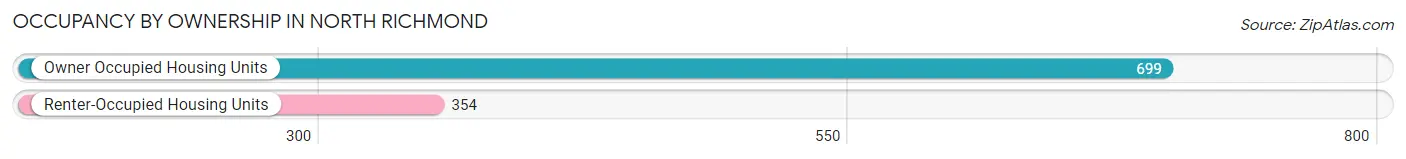
| Occupancy | # Housing Units | % Housing Units |
| Owner Occupied Housing Units | 699 | 66.4% |
| Renter-Occupied Housing Units | 354 | 33.6% |
| Total Occupied Housing Units | 1,053 | 100.0% |
Occupancy by Household Size in North Richmond
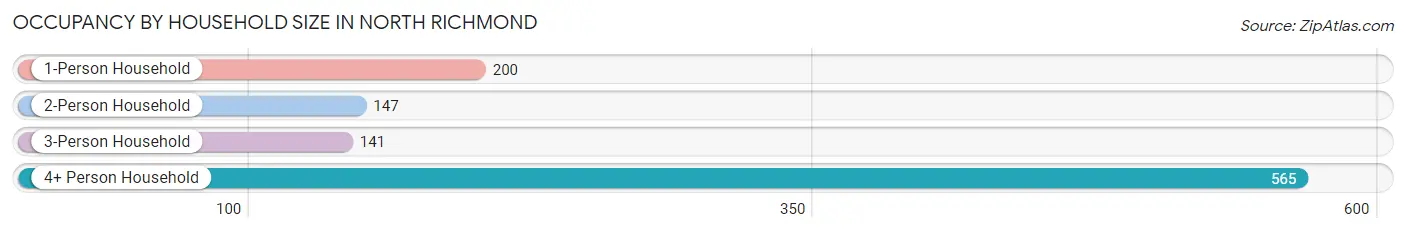
| Household Size | # Housing Units | % Housing Units |
| 1-Person Household | 200 | 19.0% |
| 2-Person Household | 147 | 14.0% |
| 3-Person Household | 141 | 13.4% |
| 4+ Person Household | 565 | 53.7% |
| Total Housing Units | 1,053 | 100.0% |
Occupancy by Ownership by Household Size in North Richmond
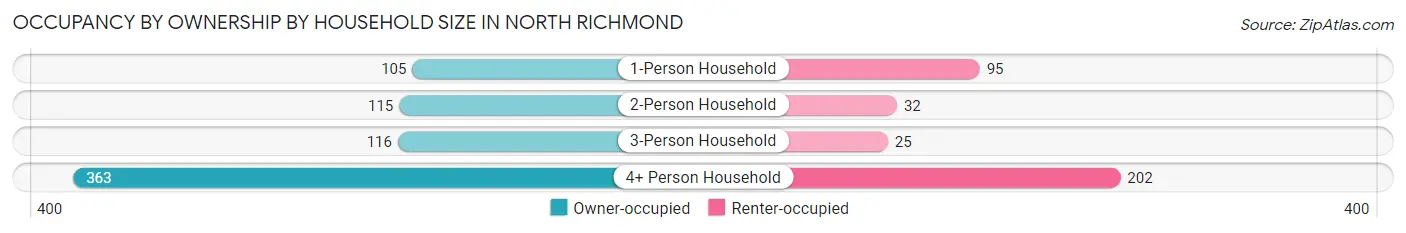
| Household Size | Owner-occupied | Renter-occupied |
| 1-Person Household | 105 (52.5%) | 95 (47.5%) |
| 2-Person Household | 115 (78.2%) | 32 (21.8%) |
| 3-Person Household | 116 (82.3%) | 25 (17.7%) |
| 4+ Person Household | 363 (64.2%) | 202 (35.7%) |
| Total Housing Units | 699 (66.4%) | 354 (33.6%) |
Occupancy by Educational Attainment in North Richmond
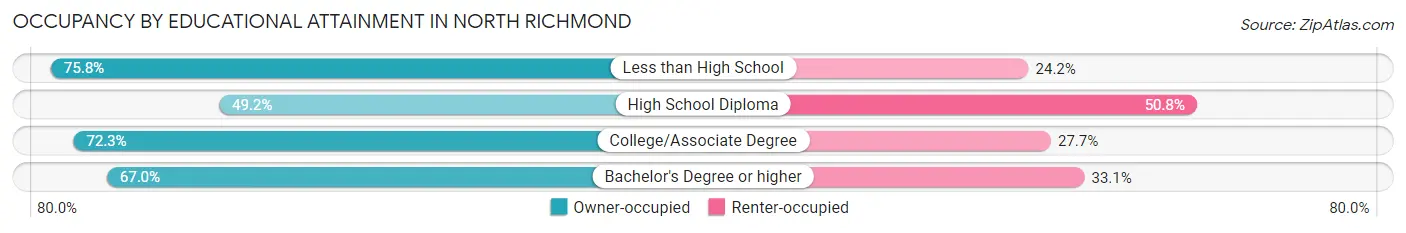
| Household Size | Owner-occupied | Renter-occupied |
| Less than High School | 276 (75.8%) | 88 (24.2%) |
| High School Diploma | 146 (49.2%) | 151 (50.8%) |
| College/Associate Degree | 198 (72.3%) | 76 (27.7%) |
| Bachelor's Degree or higher | 79 (66.9%) | 39 (33.1%) |
Occupancy by Age of Householder in North Richmond
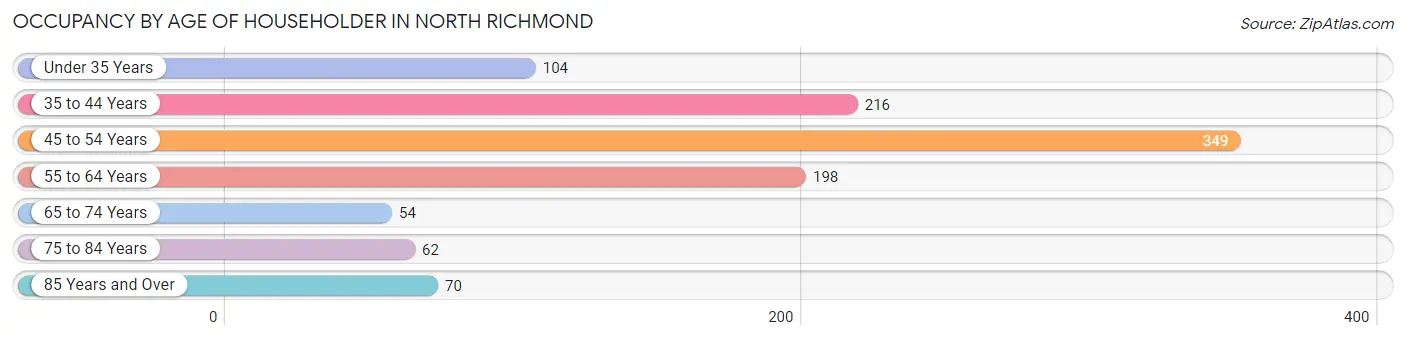
| Age Bracket | # Households | % Households |
| Under 35 Years | 104 | 9.9% |
| 35 to 44 Years | 216 | 20.5% |
| 45 to 54 Years | 349 | 33.1% |
| 55 to 64 Years | 198 | 18.8% |
| 65 to 74 Years | 54 | 5.1% |
| 75 to 84 Years | 62 | 5.9% |
| 85 Years and Over | 70 | 6.7% |
| Total | 1,053 | 100.0% |
Housing Finances in North Richmond
Median Income by Occupancy in North Richmond
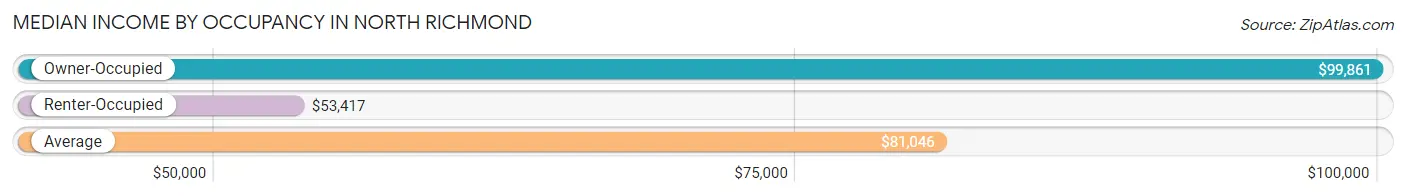
| Occupancy Type | # Households | Median Income |
| Owner-Occupied | 699 (66.4%) | $99,861 |
| Renter-Occupied | 354 (33.6%) | $53,417 |
| Average | 1,053 (100.0%) | $81,046 |
Occupancy by Householder Income Bracket in North Richmond
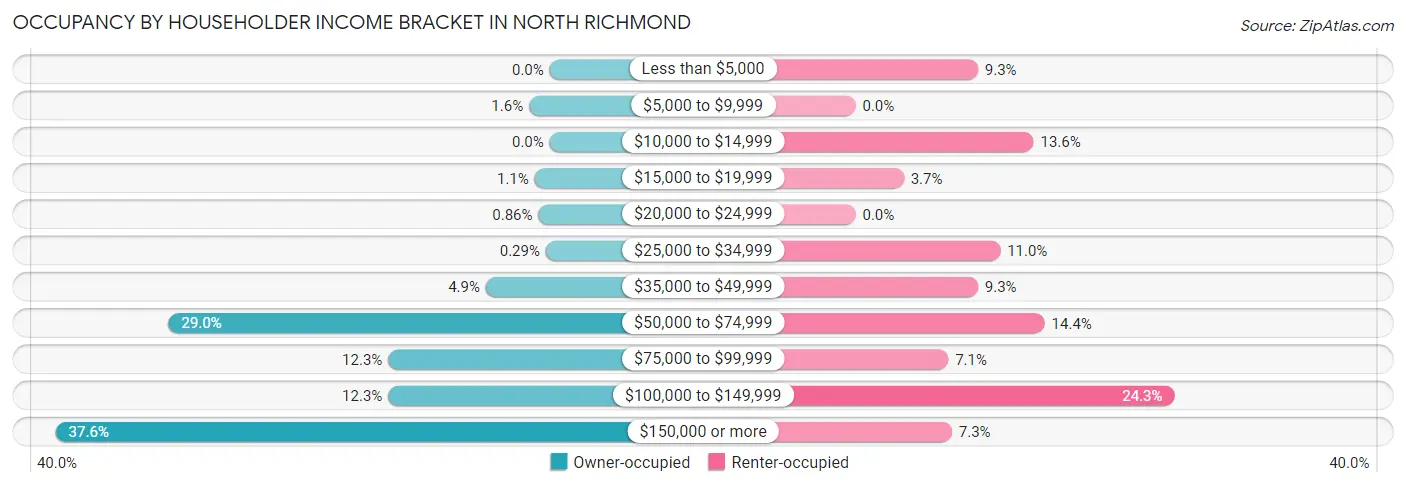
| Income Bracket | Owner-occupied | Renter-occupied |
| Less than $5,000 | 0 (0.0%) | 33 (9.3%) |
| $5,000 to $9,999 | 11 (1.6%) | 0 (0.0%) |
| $10,000 to $14,999 | 0 (0.0%) | 48 (13.6%) |
| $15,000 to $19,999 | 8 (1.1%) | 13 (3.7%) |
| $20,000 to $24,999 | 6 (0.9%) | 0 (0.0%) |
| $25,000 to $34,999 | 2 (0.3%) | 39 (11.0%) |
| $35,000 to $49,999 | 34 (4.9%) | 33 (9.3%) |
| $50,000 to $74,999 | 203 (29.0%) | 51 (14.4%) |
| $75,000 to $99,999 | 86 (12.3%) | 25 (7.1%) |
| $100,000 to $149,999 | 86 (12.3%) | 86 (24.3%) |
| $150,000 or more | 263 (37.6%) | 26 (7.3%) |
| Total | 699 (100.0%) | 354 (100.0%) |
Monthly Housing Cost Tiers in North Richmond
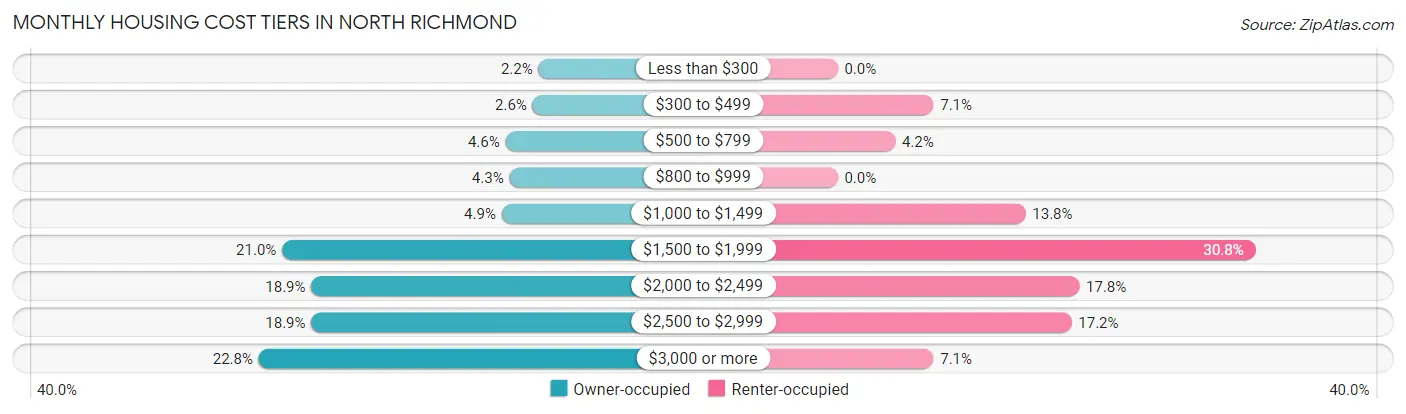
| Monthly Cost | Owner-occupied | Renter-occupied |
| Less than $300 | 15 (2.1%) | 0 (0.0%) |
| $300 to $499 | 18 (2.6%) | 25 (7.1%) |
| $500 to $799 | 32 (4.6%) | 15 (4.2%) |
| $800 to $999 | 30 (4.3%) | 0 (0.0%) |
| $1,000 to $1,499 | 34 (4.9%) | 49 (13.8%) |
| $1,500 to $1,999 | 147 (21.0%) | 109 (30.8%) |
| $2,000 to $2,499 | 132 (18.9%) | 63 (17.8%) |
| $2,500 to $2,999 | 132 (18.9%) | 61 (17.2%) |
| $3,000 or more | 159 (22.8%) | 25 (7.1%) |
| Total | 699 (100.0%) | 354 (100.0%) |
Physical Housing Characteristics in North Richmond
Housing Structures in North Richmond
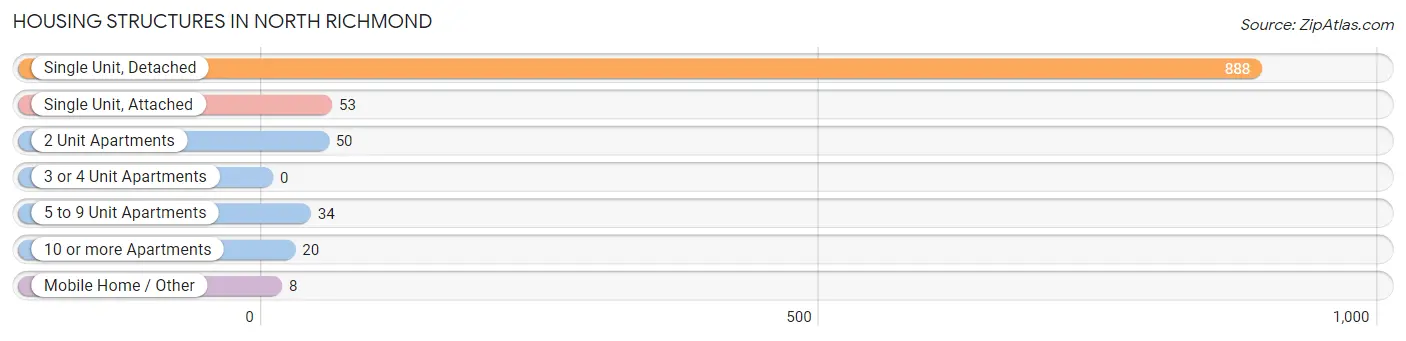
| Structure Type | # Housing Units | % Housing Units |
| Single Unit, Detached | 888 | 84.3% |
| Single Unit, Attached | 53 | 5.0% |
| 2 Unit Apartments | 50 | 4.8% |
| 3 or 4 Unit Apartments | 0 | 0.0% |
| 5 to 9 Unit Apartments | 34 | 3.2% |
| 10 or more Apartments | 20 | 1.9% |
| Mobile Home / Other | 8 | 0.8% |
| Total | 1,053 | 100.0% |
Housing Structures by Occupancy in North Richmond
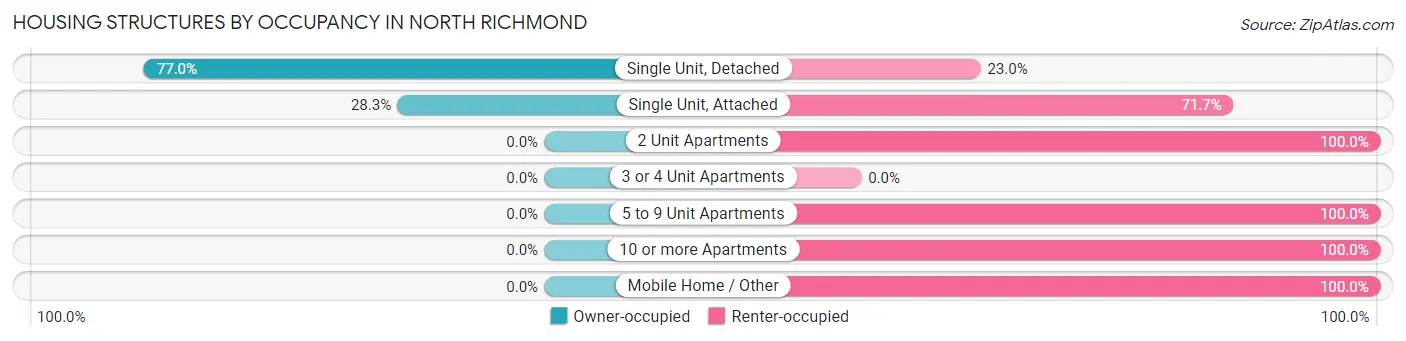
| Structure Type | Owner-occupied | Renter-occupied |
| Single Unit, Detached | 684 (77.0%) | 204 (23.0%) |
| Single Unit, Attached | 15 (28.3%) | 38 (71.7%) |
| 2 Unit Apartments | 0 (0.0%) | 50 (100.0%) |
| 3 or 4 Unit Apartments | 0 (0.0%) | 0 (0.0%) |
| 5 to 9 Unit Apartments | 0 (0.0%) | 34 (100.0%) |
| 10 or more Apartments | 0 (0.0%) | 20 (100.0%) |
| Mobile Home / Other | 0 (0.0%) | 8 (100.0%) |
| Total | 699 (66.4%) | 354 (33.6%) |
Housing Structures by Number of Rooms in North Richmond
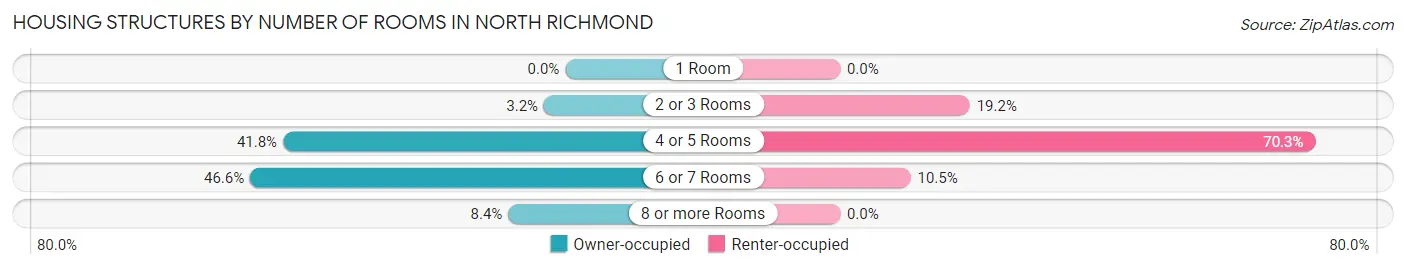
| Number of Rooms | Owner-occupied | Renter-occupied |
| 1 Room | 0 (0.0%) | 0 (0.0%) |
| 2 or 3 Rooms | 22 (3.2%) | 68 (19.2%) |
| 4 or 5 Rooms | 292 (41.8%) | 249 (70.3%) |
| 6 or 7 Rooms | 326 (46.6%) | 37 (10.4%) |
| 8 or more Rooms | 59 (8.4%) | 0 (0.0%) |
| Total | 699 (100.0%) | 354 (100.0%) |
Housing Structure by Heating Type in North Richmond
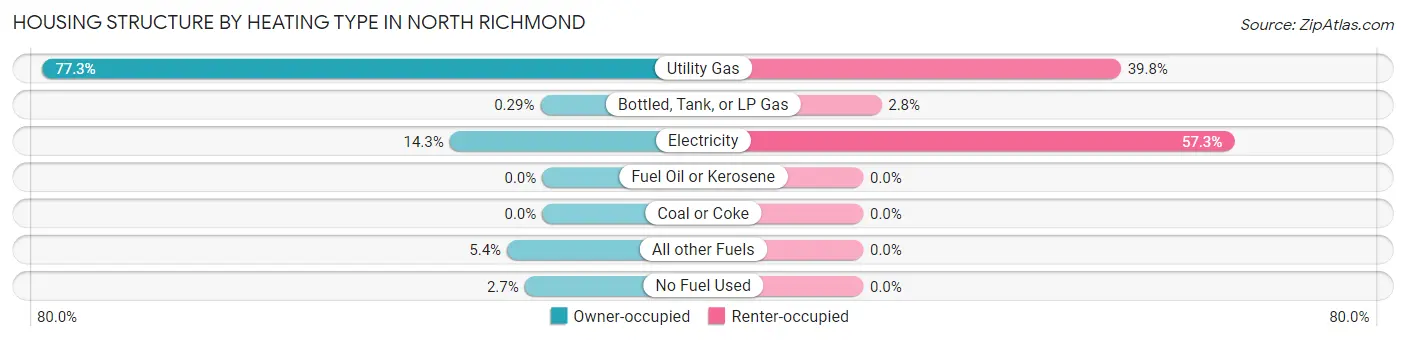
| Heating Type | Owner-occupied | Renter-occupied |
| Utility Gas | 540 (77.2%) | 141 (39.8%) |
| Bottled, Tank, or LP Gas | 2 (0.3%) | 10 (2.8%) |
| Electricity | 100 (14.3%) | 203 (57.3%) |
| Fuel Oil or Kerosene | 0 (0.0%) | 0 (0.0%) |
| Coal or Coke | 0 (0.0%) | 0 (0.0%) |
| All other Fuels | 38 (5.4%) | 0 (0.0%) |
| No Fuel Used | 19 (2.7%) | 0 (0.0%) |
| Total | 699 (100.0%) | 354 (100.0%) |
Household Vehicle Usage in North Richmond
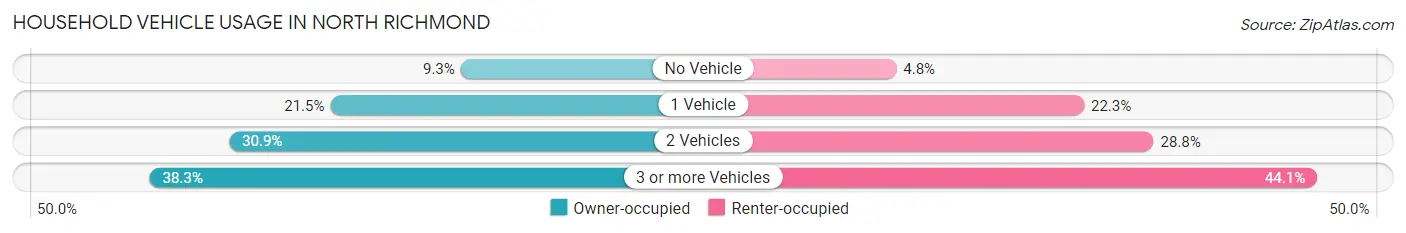
| Vehicles per Household | Owner-occupied | Renter-occupied |
| No Vehicle | 65 (9.3%) | 17 (4.8%) |
| 1 Vehicle | 150 (21.5%) | 79 (22.3%) |
| 2 Vehicles | 216 (30.9%) | 102 (28.8%) |
| 3 or more Vehicles | 268 (38.3%) | 156 (44.1%) |
| Total | 699 (100.0%) | 354 (100.0%) |
Real Estate & Mortgages in North Richmond
Real Estate and Mortgage Overview in North Richmond
| Characteristic | Without Mortgage | With Mortgage |
| Housing Units | 84 | 615 |
| Median Property Value | $500,000 | $497,700 |
| Median Household Income | $121,563 | $234 |
| Monthly Housing Costs | $833 | $159 |
| Real Estate Taxes | $5,804 | $0 |
Property Value by Mortgage Status in North Richmond
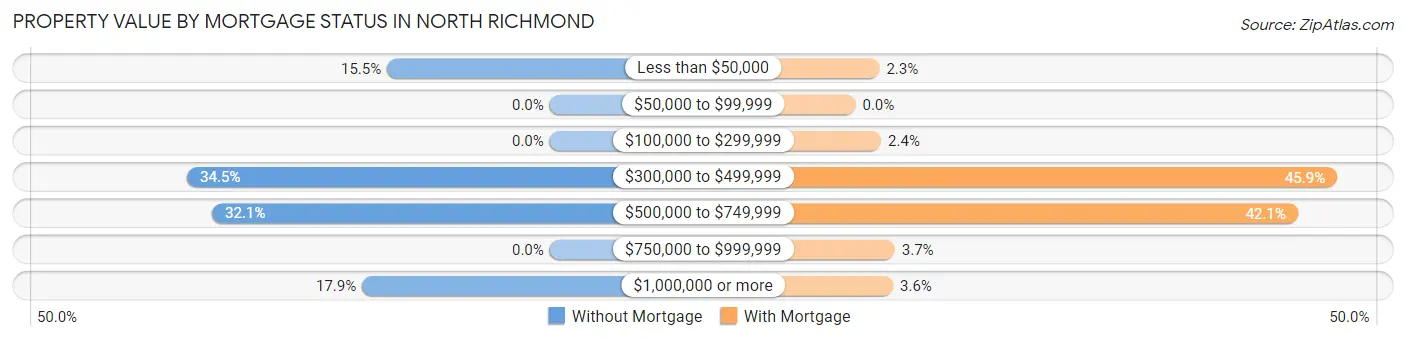
| Property Value | Without Mortgage | With Mortgage |
| Less than $50,000 | 13 (15.5%) | 14 (2.3%) |
| $50,000 to $99,999 | 0 (0.0%) | 0 (0.0%) |
| $100,000 to $299,999 | 0 (0.0%) | 15 (2.4%) |
| $300,000 to $499,999 | 29 (34.5%) | 282 (45.9%) |
| $500,000 to $749,999 | 27 (32.1%) | 259 (42.1%) |
| $750,000 to $999,999 | 0 (0.0%) | 23 (3.7%) |
| $1,000,000 or more | 15 (17.9%) | 22 (3.6%) |
| Total | 84 (100.0%) | 615 (100.0%) |
Household Income by Mortgage Status in North Richmond
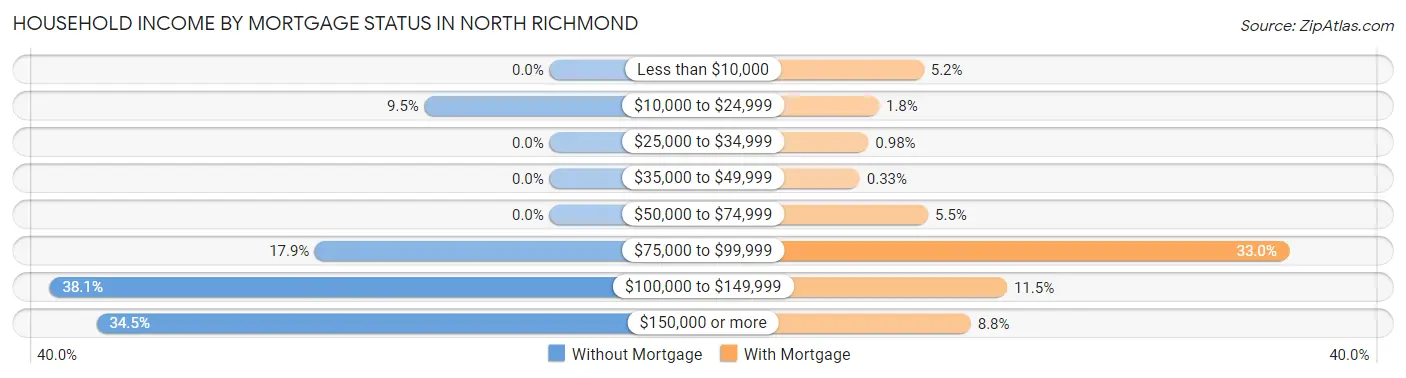
| Household Income | Without Mortgage | With Mortgage |
| Less than $10,000 | 0 (0.0%) | 32 (5.2%) |
| $10,000 to $24,999 | 8 (9.5%) | 11 (1.8%) |
| $25,000 to $34,999 | 0 (0.0%) | 6 (1.0%) |
| $35,000 to $49,999 | 0 (0.0%) | 2 (0.3%) |
| $50,000 to $74,999 | 0 (0.0%) | 34 (5.5%) |
| $75,000 to $99,999 | 15 (17.9%) | 203 (33.0%) |
| $100,000 to $149,999 | 32 (38.1%) | 71 (11.5%) |
| $150,000 or more | 29 (34.5%) | 54 (8.8%) |
| Total | 84 (100.0%) | 615 (100.0%) |
Property Value to Household Income Ratio in North Richmond
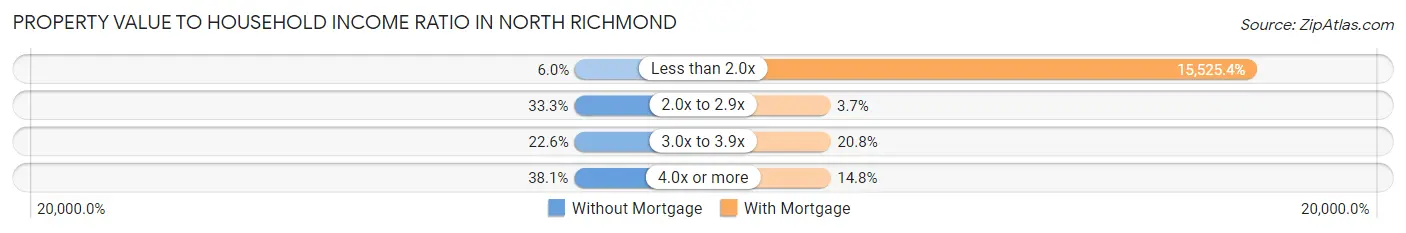
| Value-to-Income Ratio | Without Mortgage | With Mortgage |
| Less than 2.0x | 5 (5.9%) | 95,481 (15,525.4%) |
| 2.0x to 2.9x | 28 (33.3%) | 23 (3.7%) |
| 3.0x to 3.9x | 19 (22.6%) | 128 (20.8%) |
| 4.0x or more | 32 (38.1%) | 91 (14.8%) |
| Total | 84 (100.0%) | 615 (100.0%) |
Real Estate Taxes by Mortgage Status in North Richmond
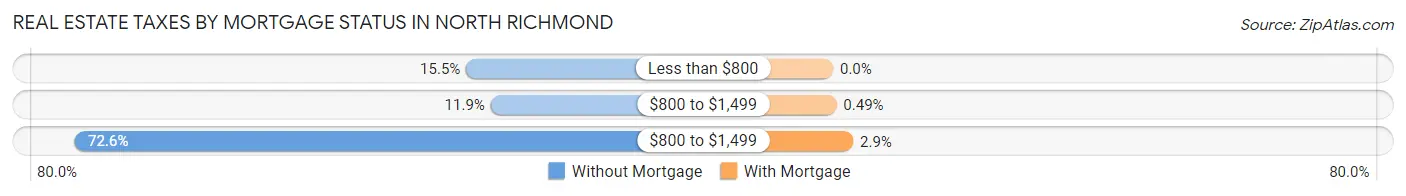
| Property Taxes | Without Mortgage | With Mortgage |
| Less than $800 | 13 (15.5%) | 0 (0.0%) |
| $800 to $1,499 | 10 (11.9%) | 3 (0.5%) |
| $800 to $1,499 | 61 (72.6%) | 18 (2.9%) |
| Total | 84 (100.0%) | 615 (100.0%) |
Health & Disability in North Richmond
Health Insurance Coverage by Age in North Richmond
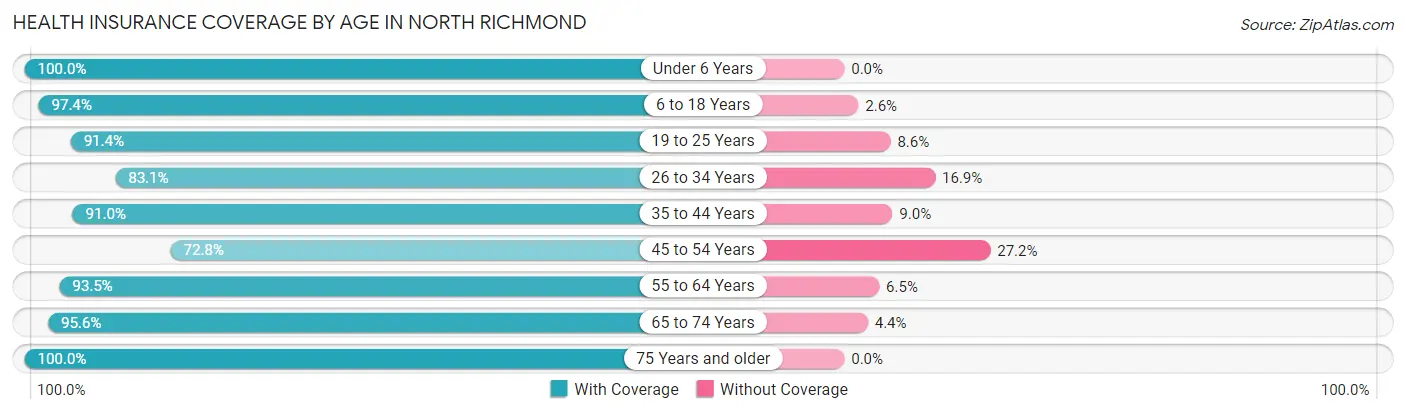
| Age Bracket | With Coverage | Without Coverage |
| Under 6 Years | 259 (100.0%) | 0 (0.0%) |
| 6 to 18 Years | 855 (97.4%) | 23 (2.6%) |
| 19 to 25 Years | 361 (91.4%) | 34 (8.6%) |
| 26 to 34 Years | 275 (83.1%) | 56 (16.9%) |
| 35 to 44 Years | 558 (91.0%) | 55 (9.0%) |
| 45 to 54 Years | 342 (72.8%) | 128 (27.2%) |
| 55 to 64 Years | 374 (93.5%) | 26 (6.5%) |
| 65 to 74 Years | 153 (95.6%) | 7 (4.4%) |
| 75 Years and older | 228 (100.0%) | 0 (0.0%) |
| Total | 3,405 (91.2%) | 329 (8.8%) |
Health Insurance Coverage by Citizenship Status in North Richmond
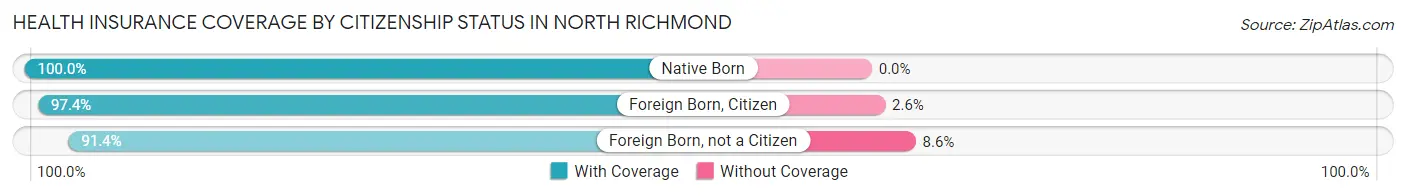
| Citizenship Status | With Coverage | Without Coverage |
| Native Born | 259 (100.0%) | 0 (0.0%) |
| Foreign Born, Citizen | 855 (97.4%) | 23 (2.6%) |
| Foreign Born, not a Citizen | 361 (91.4%) | 34 (8.6%) |
Health Insurance Coverage by Household Income in North Richmond
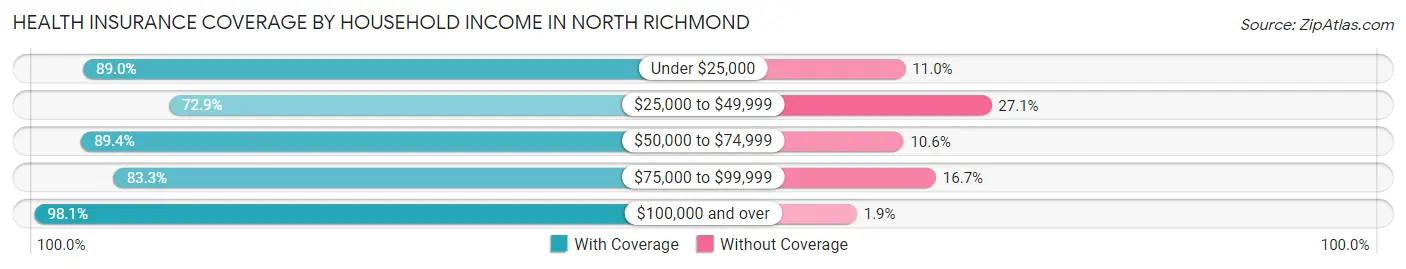
| Household Income | With Coverage | Without Coverage |
| Under $25,000 | 146 (89.0%) | 18 (11.0%) |
| $25,000 to $49,999 | 323 (72.9%) | 120 (27.1%) |
| $50,000 to $74,999 | 673 (89.4%) | 80 (10.6%) |
| $75,000 to $99,999 | 374 (83.3%) | 75 (16.7%) |
| $100,000 and over | 1,889 (98.1%) | 36 (1.9%) |
Public vs Private Health Insurance Coverage by Age in North Richmond
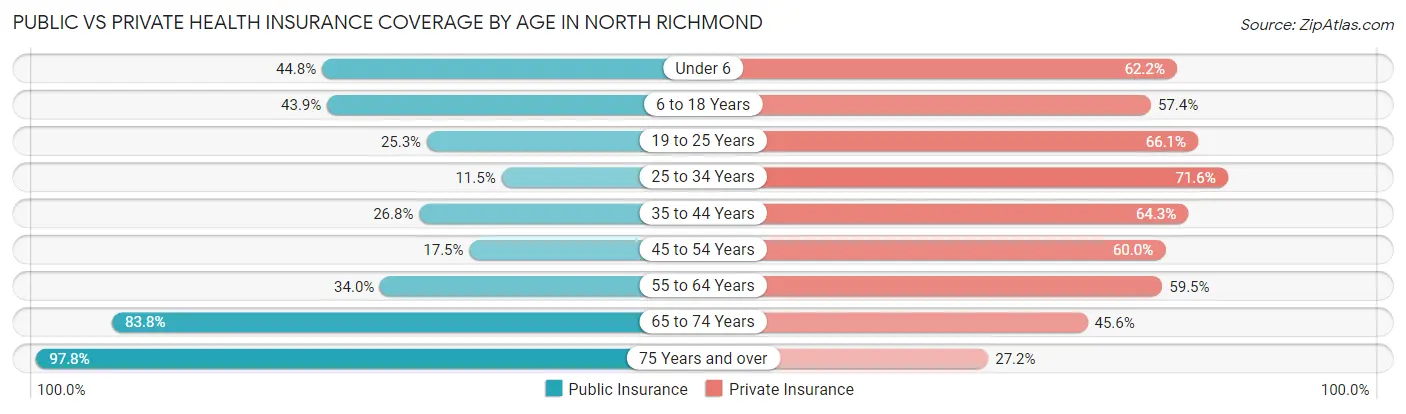
| Age Bracket | Public Insurance | Private Insurance |
| Under 6 | 116 (44.8%) | 161 (62.2%) |
| 6 to 18 Years | 385 (43.9%) | 504 (57.4%) |
| 19 to 25 Years | 100 (25.3%) | 261 (66.1%) |
| 25 to 34 Years | 38 (11.5%) | 237 (71.6%) |
| 35 to 44 Years | 164 (26.8%) | 394 (64.3%) |
| 45 to 54 Years | 82 (17.4%) | 282 (60.0%) |
| 55 to 64 Years | 136 (34.0%) | 238 (59.5%) |
| 65 to 74 Years | 134 (83.8%) | 73 (45.6%) |
| 75 Years and over | 223 (97.8%) | 62 (27.2%) |
| Total | 1,378 (36.9%) | 2,212 (59.2%) |
Disability Status by Sex by Age in North Richmond
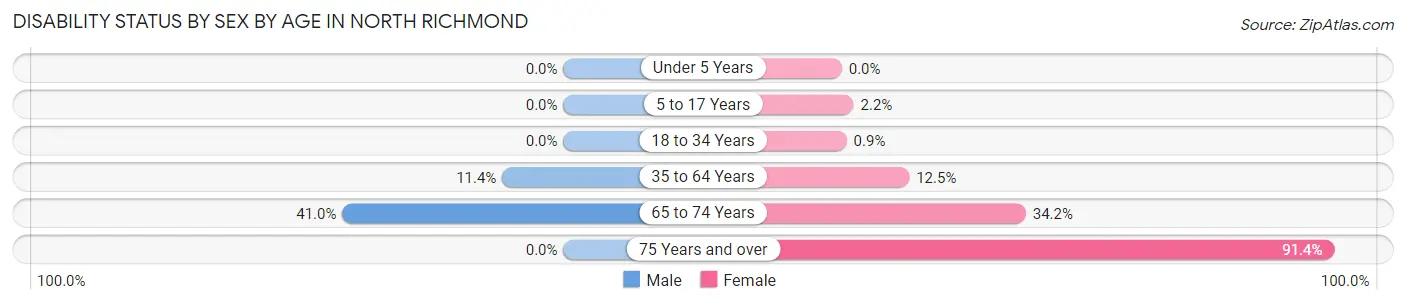
| Age Bracket | Male | Female |
| Under 5 Years | 0 (0.0%) | 0 (0.0%) |
| 5 to 17 Years | 0 (0.0%) | 12 (2.2%) |
| 18 to 34 Years | 0 (0.0%) | 4 (0.9%) |
| 35 to 64 Years | 74 (11.4%) | 104 (12.5%) |
| 65 to 74 Years | 32 (41.0%) | 28 (34.2%) |
| 75 Years and over | 0 (0.0%) | 149 (91.4%) |
Disability Class by Sex by Age in North Richmond
Disability Class: Hearing Difficulty
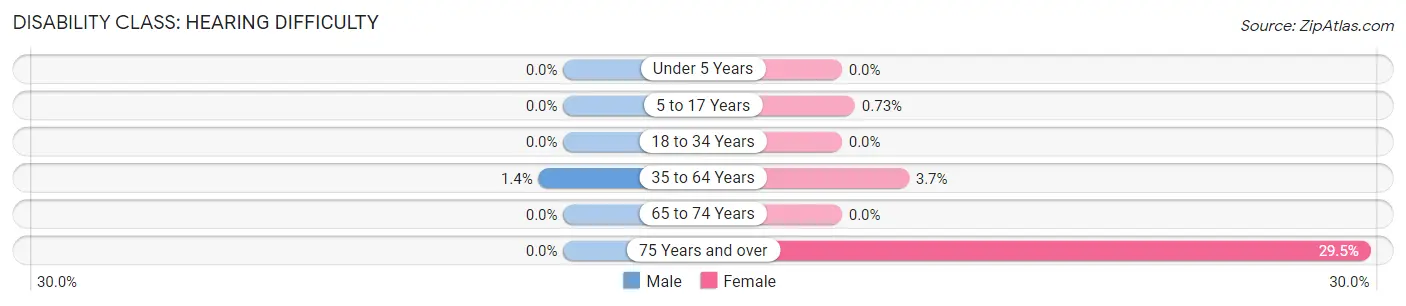
| Age Bracket | Male | Female |
| Under 5 Years | 0 (0.0%) | 0 (0.0%) |
| 5 to 17 Years | 0 (0.0%) | 4 (0.7%) |
| 18 to 34 Years | 0 (0.0%) | 0 (0.0%) |
| 35 to 64 Years | 9 (1.4%) | 31 (3.7%) |
| 65 to 74 Years | 0 (0.0%) | 0 (0.0%) |
| 75 Years and over | 0 (0.0%) | 48 (29.4%) |
Disability Class: Vision Difficulty
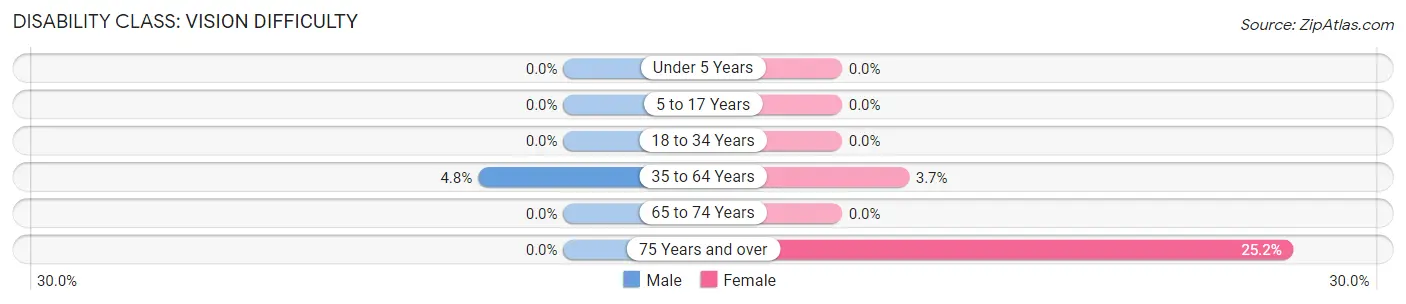
| Age Bracket | Male | Female |
| Under 5 Years | 0 (0.0%) | 0 (0.0%) |
| 5 to 17 Years | 0 (0.0%) | 0 (0.0%) |
| 18 to 34 Years | 0 (0.0%) | 0 (0.0%) |
| 35 to 64 Years | 31 (4.8%) | 31 (3.7%) |
| 65 to 74 Years | 0 (0.0%) | 0 (0.0%) |
| 75 Years and over | 0 (0.0%) | 41 (25.2%) |
Disability Class: Cognitive Difficulty
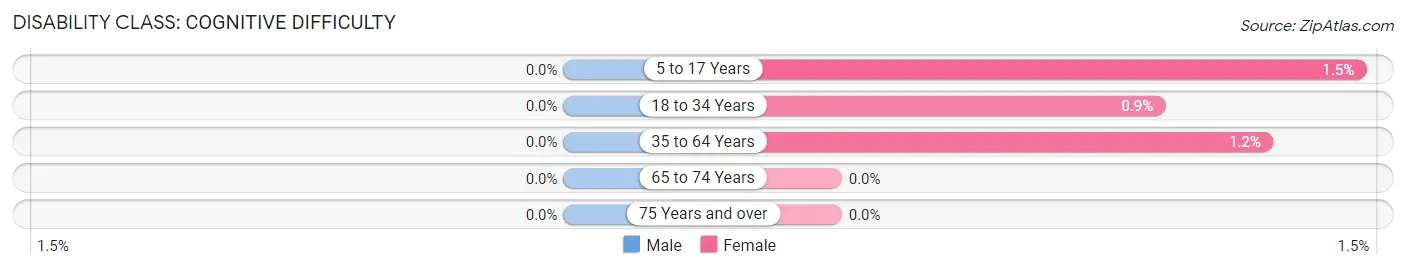
| Age Bracket | Male | Female |
| 5 to 17 Years | 0 (0.0%) | 8 (1.5%) |
| 18 to 34 Years | 0 (0.0%) | 4 (0.9%) |
| 35 to 64 Years | 0 (0.0%) | 10 (1.2%) |
| 65 to 74 Years | 0 (0.0%) | 0 (0.0%) |
| 75 Years and over | 0 (0.0%) | 0 (0.0%) |
Disability Class: Ambulatory Difficulty
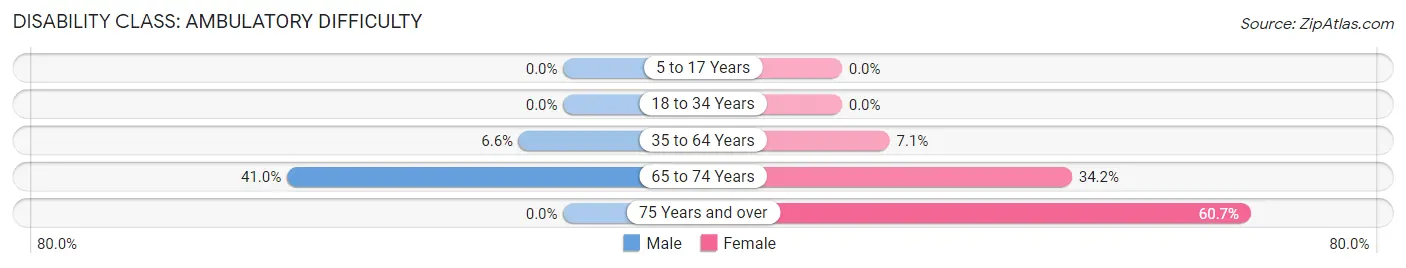
| Age Bracket | Male | Female |
| 5 to 17 Years | 0 (0.0%) | 0 (0.0%) |
| 18 to 34 Years | 0 (0.0%) | 0 (0.0%) |
| 35 to 64 Years | 43 (6.6%) | 59 (7.1%) |
| 65 to 74 Years | 32 (41.0%) | 28 (34.2%) |
| 75 Years and over | 0 (0.0%) | 99 (60.7%) |
Disability Class: Self-Care Difficulty
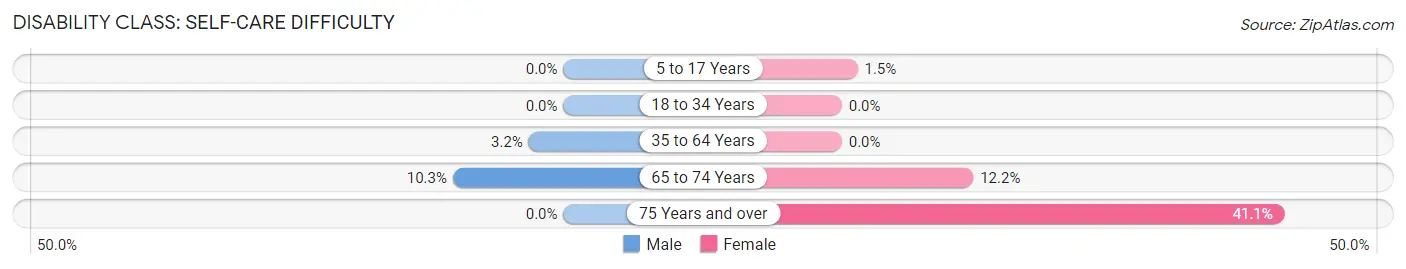
| Age Bracket | Male | Female |
| 5 to 17 Years | 0 (0.0%) | 8 (1.5%) |
| 18 to 34 Years | 0 (0.0%) | 0 (0.0%) |
| 35 to 64 Years | 21 (3.2%) | 0 (0.0%) |
| 65 to 74 Years | 8 (10.3%) | 10 (12.2%) |
| 75 Years and over | 0 (0.0%) | 67 (41.1%) |
Technology Access in North Richmond
Computing Device Access in North Richmond
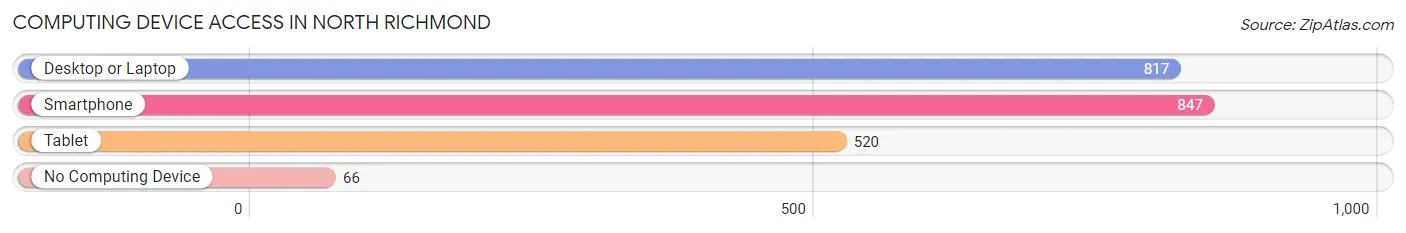
| Device Type | # Households | % Households |
| Desktop or Laptop | 817 | 77.6% |
| Smartphone | 847 | 80.4% |
| Tablet | 520 | 49.4% |
| No Computing Device | 66 | 6.3% |
| Total | 1,053 | 100.0% |
Internet Access in North Richmond
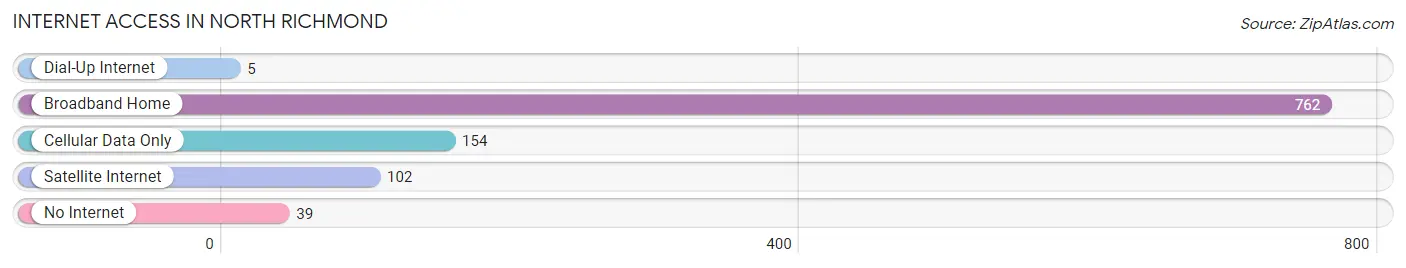
| Internet Type | # Households | % Households |
| Dial-Up Internet | 5 | 0.5% |
| Broadband Home | 762 | 72.4% |
| Cellular Data Only | 154 | 14.6% |
| Satellite Internet | 102 | 9.7% |
| No Internet | 39 | 3.7% |
| Total | 1,053 | 100.0% |
North Richmond Summary
Richmond, California is a city located in the San Francisco Bay Area in Contra Costa County. It is the largest city in the county and is home to a population of over 100,000 people. Richmond is a diverse city with a rich history, unique geography, and a vibrant economy. This paper will explore the history, geography, economy, and demographics of Richmond in 2000 words.
History
The history of Richmond, California dates back to the early 1800s when the area was inhabited by the Ohlone people. In 1822, the area was claimed by the Mexican government and was used for ranching and farming. In 1835, the area was granted to John Marsh, a former Mexican soldier, and was named Rancho San Pablo. In 1846, the area was annexed by the United States and was used for military purposes. In 1849, the area was incorporated as the town of Richmond.
In the late 1800s, Richmond experienced a period of rapid growth due to the construction of the Santa Fe Railroad and the development of the Port of Richmond. The city was also a major center for shipbuilding during World War II. After the war, the city experienced a period of decline due to the closure of the shipyards and the decline of the railroad industry.
In the late 20th century, Richmond experienced a period of revitalization due to the development of the Chevron Richmond Refinery and the construction of the Richmond-San Rafael Bridge. The city also experienced a period of population growth due to the influx of immigrants from Latin America and Asia.
Geography
Richmond is located in the San Francisco Bay Area in Contra Costa County. The city is situated on the eastern shore of San Francisco Bay and is bordered by the cities of San Pablo, El Cerrito, and Pinole. The city has a total area of 52.5 square miles and is located at an elevation of 30 feet above sea level.
The city is divided into two distinct geographic regions: the hills to the east and the flatlands to the west. The hills are characterized by steep slopes and are home to the city’s highest point, Wildcat Peak, which has an elevation of 1,845 feet. The flatlands are characterized by rolling hills and are home to the city’s lowest point, which is located at sea level.
The city is home to several parks and open spaces, including Point Pinole Regional Shoreline, Miller/Knox Regional Shoreline, and Point Isabel Regional Shoreline. The city is also home to several creeks, including Wildcat Creek, San Pablo Creek, and Rodeo Creek.
Economy
Richmond’s economy is largely driven by the Chevron Richmond Refinery, which is the largest refinery in the United States. The refinery is responsible for producing over 15 percent of the gasoline used in California. The city is also home to several other industries, including shipbuilding, manufacturing, and retail.
The city’s unemployment rate is higher than the national average, but the city’s median household income is higher than the national average. The city’s poverty rate is also higher than the national average.
Demographics
As of the 2010 census, Richmond had a population of 103,701 people. The city is racially and ethnically diverse, with the largest racial/ethnic groups being White (37.2%), African American (25.2%), Asian (17.3%), and Hispanic/Latino (14.2%).
The city’s median age is 33.7 years, and the median household income is $60,945. The city’s poverty rate is 19.2%, and the city’s homeownership rate is 44.3%.
Conclusion
Richmond, California is a diverse city with a rich history, unique geography, and a vibrant economy. The city is home to a population of over 100,000 people and is characterized by its diverse population, high median household income, and high poverty rate. The city’s economy is largely driven by the Chevron Richmond Refinery, and the city is home to several other industries, including shipbuilding, manufacturing, and retail.
Common Questions
What is Per Capita Income in North Richmond?
Per Capita income in North Richmond is $28,393.
What is the Median Family Income in North Richmond?
Median Family Income in North Richmond is $81,464.
What is the Median Household income in North Richmond?
Median Household Income in North Richmond is $81,046.
What is Income or Wage Gap in North Richmond?
Income or Wage Gap in North Richmond is 41.9%.
Women in North Richmond earn 58.1 cents for every dollar earned by a man.
What is Inequality or Gini Index in North Richmond?
Inequality or Gini Index in North Richmond is 0.37.
What is the Total Population of North Richmond?
Total Population of North Richmond is 3,734.
What is the Total Male Population of North Richmond?
Total Male Population of North Richmond is 1,582.
What is the Total Female Population of North Richmond?
Total Female Population of North Richmond is 2,152.
What is the Ratio of Males per 100 Females in North Richmond?
There are 73.51 Males per 100 Females in North Richmond.
What is the Ratio of Females per 100 Males in North Richmond?
There are 136.03 Females per 100 Males in North Richmond.
What is the Median Population Age in North Richmond?
Median Population Age in North Richmond is 35.1 Years.
What is the Average Family Size in North Richmond
Average Family Size in North Richmond is 4.1 People.
What is the Average Household Size in North Richmond
Average Household Size in North Richmond is 3.5 People.
How Large is the Labor Force in North Richmond?
There are 1,963 People in the Labor Forcein in North Richmond.
What is the Percentage of People in the Labor Force in North Richmond?
69.9% of People are in the Labor Force in North Richmond.
What is the Unemployment Rate in North Richmond?
Unemployment Rate in North Richmond is 3.1%.