Cities with the Lowest Poverty Level Among Seniors Over the Age of 75 in Arkansas
RELATED REPORTS & OPTIONS
Lowest Poverty | Seniors 75+
Arkansas
Compare Cities
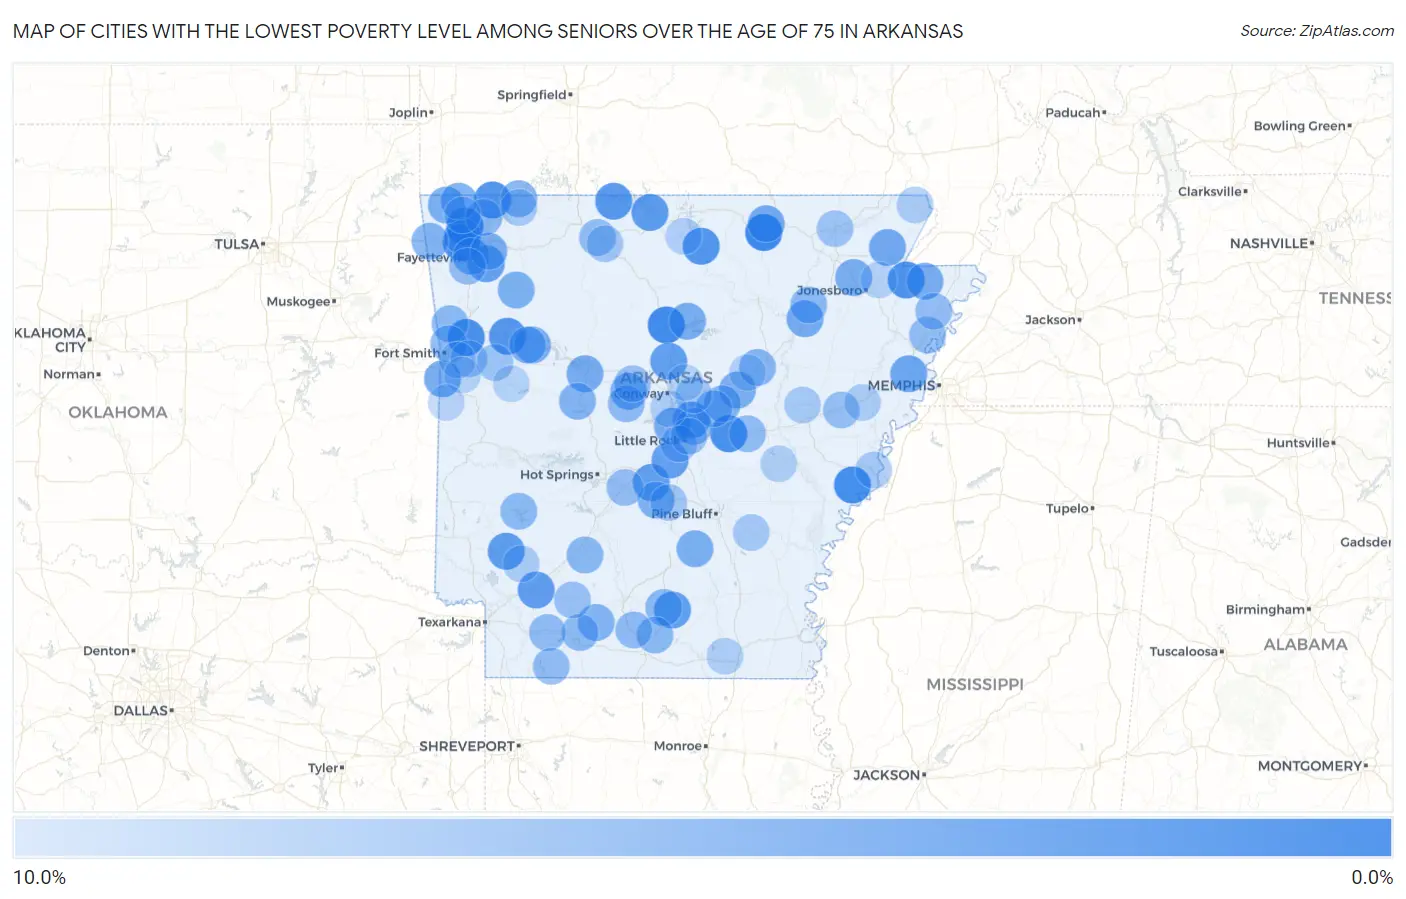
Map of Cities with the Lowest Poverty Level Among Seniors Over the Age of 75 in Arkansas
10.0%
0.0%
Cities with the Lowest Poverty Level Among Seniors Over the Age of 75 in Arkansas
| City | Senior Poverty | vs State | vs National | |
| 1. | Cave Springs | 0.56% | 11.1%(-10.5)#1 | 11.1%(-10.5)#62 |
| 2. | Ash Flat | 0.96% | 11.1%(-10.1)#2 | 11.1%(-10.1)#135 |
| 3. | Clinton | 1.2% | 11.1%(-9.85)#3 | 11.1%(-9.85)#187 |
| 4. | Lake View | 1.4% | 11.1%(-9.61)#4 | 11.1%(-9.62)#275 |
| 5. | Tontitown | 1.8% | 11.1%(-9.28)#5 | 11.1%(-9.28)#414 |
| 6. | Lonoke | 1.9% | 11.1%(-9.21)#6 | 11.1%(-9.22)#446 |
| 7. | Alma | 1.9% | 11.1%(-9.18)#7 | 11.1%(-9.19)#465 |
| 8. | Monette | 2.0% | 11.1%(-9.06)#8 | 11.1%(-9.07)#517 |
| 9. | Garfield | 2.1% | 11.1%(-8.97)#9 | 11.1%(-8.98)#580 |
| 10. | Calico Rock | 2.4% | 11.1%(-8.65)#10 | 11.1%(-8.66)#784 |
| 11. | Ozark | 2.5% | 11.1%(-8.51)#11 | 11.1%(-8.52)#887 |
| 12. | Diamond City | 2.7% | 11.1%(-8.33)#12 | 11.1%(-8.34)#1,032 |
| 13. | Bull Shoals | 3.1% | 11.1%(-7.97)#13 | 11.1%(-7.98)#1,313 |
| 14. | Nashville | 3.1% | 11.1%(-7.94)#14 | 11.1%(-7.95)#1,333 |
| 15. | Hope | 3.2% | 11.1%(-7.84)#15 | 11.1%(-7.85)#1,414 |
| 16. | Harrell | 3.3% | 11.1%(-7.72)#16 | 11.1%(-7.73)#1,534 |
| 17. | Tull | 3.4% | 11.1%(-7.61)#17 | 11.1%(-7.62)#1,642 |
| 18. | Twin Groves | 3.4% | 11.1%(-7.61)#18 | 11.1%(-7.62)#1,646 |
| 19. | Shannon Hills | 3.6% | 11.1%(-7.50)#19 | 11.1%(-7.51)#1,722 |
| 20. | Elkins | 3.7% | 11.1%(-7.39)#20 | 11.1%(-7.40)#1,832 |
| 21. | Gibson | 3.7% | 11.1%(-7.35)#21 | 11.1%(-7.36)#1,863 |
| 22. | Crawfordsville | 4.2% | 11.1%(-6.89)#22 | 11.1%(-6.90)#2,348 |
| 23. | Oak Grove Heights | 4.3% | 11.1%(-6.71)#23 | 11.1%(-6.72)#2,521 |
| 24. | Hackett | 4.4% | 11.1%(-6.61)#24 | 11.1%(-6.62)#2,631 |
| 25. | Cherokee Village | 4.6% | 11.1%(-6.47)#25 | 11.1%(-6.48)#2,792 |
| 26. | Newport | 4.7% | 11.1%(-6.38)#26 | 11.1%(-6.39)#2,881 |
| 27. | Manila | 4.8% | 11.1%(-6.30)#27 | 11.1%(-6.31)#2,928 |
| 28. | Dardanelle | 4.8% | 11.1%(-6.27)#28 | 11.1%(-6.28)#2,987 |
| 29. | Maumelle | 4.8% | 11.1%(-6.23)#29 | 11.1%(-6.24)#3,022 |
| 30. | Elm Springs | 4.9% | 11.1%(-6.20)#30 | 11.1%(-6.21)#3,052 |
| 31. | Oppelo | 4.9% | 11.1%(-6.18)#31 | 11.1%(-6.19)#3,065 |
| 32. | Hartman | 4.9% | 11.1%(-6.18)#32 | 11.1%(-6.19)#3,069 |
| 33. | Fairfield Bay | 4.9% | 11.1%(-6.13)#33 | 11.1%(-6.14)#3,120 |
| 34. | Fayetteville | 5.0% | 11.1%(-6.07)#34 | 11.1%(-6.08)#3,180 |
| 35. | Goshen | 5.0% | 11.1%(-6.06)#35 | 11.1%(-6.07)#3,187 |
| 36. | Bono | 5.0% | 11.1%(-6.06)#36 | 11.1%(-6.07)#3,189 |
| 37. | Mcrae | 5.0% | 11.1%(-6.06)#37 | 11.1%(-6.07)#3,198 |
| 38. | Rison | 5.1% | 11.1%(-6.01)#38 | 11.1%(-6.02)#3,265 |
| 39. | Gravette | 5.1% | 11.1%(-5.94)#39 | 11.1%(-5.95)#3,320 |
| 40. | Bella Vista | 5.2% | 11.1%(-5.88)#40 | 11.1%(-5.89)#3,386 |
| 41. | Prattsville | 5.3% | 11.1%(-5.79)#41 | 11.1%(-5.80)#3,487 |
| 42. | St Paul | 5.3% | 11.1%(-5.79)#42 | 11.1%(-5.80)#3,501 |
| 43. | Holiday Island | 5.5% | 11.1%(-5.58)#43 | 11.1%(-5.59)#3,673 |
| 44. | Ward | 5.5% | 11.1%(-5.56)#44 | 11.1%(-5.57)#3,688 |
| 45. | Siloam Springs | 5.6% | 11.1%(-5.43)#45 | 11.1%(-5.44)#3,852 |
| 46. | Ola | 5.7% | 11.1%(-5.40)#46 | 11.1%(-5.41)#3,888 |
| 47. | Coal Hill | 5.7% | 11.1%(-5.38)#47 | 11.1%(-5.39)#3,913 |
| 48. | Stephens | 5.7% | 11.1%(-5.31)#48 | 11.1%(-5.32)#3,976 |
| 49. | Judsonia | 5.9% | 11.1%(-5.17)#49 | 11.1%(-5.18)#4,104 |
| 50. | Cedarville | 6.1% | 11.1%(-5.00)#50 | 11.1%(-5.01)#4,314 |
| 51. | Hampton | 6.1% | 11.1%(-4.96)#51 | 11.1%(-4.97)#4,364 |
| 52. | Cabot | 6.1% | 11.1%(-4.94)#52 | 11.1%(-4.95)#4,378 |
| 53. | Gurdon | 6.1% | 11.1%(-4.93)#53 | 11.1%(-4.94)#4,388 |
| 54. | Van Buren | 6.2% | 11.1%(-4.81)#54 | 11.1%(-4.82)#4,495 |
| 55. | Sherwood | 6.2% | 11.1%(-4.81)#55 | 11.1%(-4.82)#4,497 |
| 56. | Tuckerman | 6.2% | 11.1%(-4.81)#56 | 11.1%(-4.82)#4,512 |
| 57. | Mcneil | 6.2% | 11.1%(-4.81)#57 | 11.1%(-4.82)#4,545 |
| 58. | Calion | 6.2% | 11.1%(-4.81)#58 | 11.1%(-4.82)#4,553 |
| 59. | Daisy | 6.2% | 11.1%(-4.81)#59 | 11.1%(-4.82)#4,572 |
| 60. | Perryville | 6.5% | 11.1%(-4.61)#60 | 11.1%(-4.62)#4,749 |
| 61. | Prairie Creek | 6.5% | 11.1%(-4.56)#61 | 11.1%(-4.57)#4,820 |
| 62. | Smackover | 6.5% | 11.1%(-4.54)#62 | 11.1%(-4.55)#4,835 |
| 63. | Stamps | 6.5% | 11.1%(-4.54)#63 | 11.1%(-4.55)#4,836 |
| 64. | Taylor | 6.7% | 11.1%(-4.39)#64 | 11.1%(-4.40)#4,974 |
| 65. | Bellefonte | 6.7% | 11.1%(-4.39)#65 | 11.1%(-4.40)#4,983 |
| 66. | Joiner | 6.7% | 11.1%(-4.39)#66 | 11.1%(-4.40)#4,988 |
| 67. | Carlisle | 6.7% | 11.1%(-4.37)#67 | 11.1%(-4.38)#5,032 |
| 68. | Keiser | 6.8% | 11.1%(-4.30)#68 | 11.1%(-4.31)#5,080 |
| 69. | Greenland | 6.8% | 11.1%(-4.24)#69 | 11.1%(-4.25)#5,133 |
| 70. | Rockport | 6.8% | 11.1%(-4.24)#70 | 11.1%(-4.25)#5,135 |
| 71. | Palestine | 6.9% | 11.1%(-4.16)#71 | 11.1%(-4.17)#5,216 |
| 72. | Lavaca | 7.1% | 11.1%(-3.91)#72 | 11.1%(-3.92)#5,444 |
| 73. | Rosston | 7.1% | 11.1%(-3.91)#73 | 11.1%(-3.92)#5,466 |
| 74. | Morrilton | 7.2% | 11.1%(-3.90)#74 | 11.1%(-3.91)#5,498 |
| 75. | Branch | 7.3% | 11.1%(-3.74)#75 | 11.1%(-3.75)#5,642 |
| 76. | Vilonia | 7.4% | 11.1%(-3.62)#76 | 11.1%(-3.63)#5,762 |
| 77. | Pocahontas | 7.4% | 11.1%(-3.62)#77 | 11.1%(-3.63)#5,767 |
| 78. | Little Rock | 7.5% | 11.1%(-3.55)#78 | 11.1%(-3.56)#5,828 |
| 79. | North Little Rock | 7.6% | 11.1%(-3.47)#79 | 11.1%(-3.48)#5,886 |
| 80. | Sheridan | 7.7% | 11.1%(-3.38)#80 | 11.1%(-3.39)#5,946 |
| 81. | Valley Springs | 7.7% | 11.1%(-3.36)#81 | 11.1%(-3.37)#6,021 |
| 82. | Helena West Helena | 7.9% | 11.1%(-3.16)#82 | 11.1%(-3.17)#6,171 |
| 83. | Grady | 7.9% | 11.1%(-3.16)#83 | 11.1%(-3.17)#6,188 |
| 84. | Cotton Plant | 8.1% | 11.1%(-2.99)#84 | 11.1%(-3.00)#6,349 |
| 85. | Eureka Springs | 8.1% | 11.1%(-2.97)#85 | 11.1%(-2.98)#6,369 |
| 86. | Bentonville | 8.3% | 11.1%(-2.78)#86 | 11.1%(-2.79)#6,533 |
| 87. | Madison | 8.3% | 11.1%(-2.72)#87 | 11.1%(-2.73)#6,595 |
| 88. | Pollard | 8.3% | 11.1%(-2.72)#88 | 11.1%(-2.73)#6,650 |
| 89. | Ozan | 8.3% | 11.1%(-2.72)#89 | 11.1%(-2.73)#6,663 |
| 90. | Mayflower | 8.5% | 11.1%(-2.58)#90 | 11.1%(-2.59)#6,757 |
| 91. | Ulm | 8.6% | 11.1%(-2.49)#91 | 11.1%(-2.50)#6,857 |
| 92. | North Crossett | 8.6% | 11.1%(-2.47)#92 | 11.1%(-2.48)#6,874 |
| 93. | Barling | 8.6% | 11.1%(-2.44)#93 | 11.1%(-2.45)#6,897 |
| 94. | Norfork | 8.8% | 11.1%(-2.29)#94 | 11.1%(-2.29)#7,046 |
| 95. | Searcy | 8.8% | 11.1%(-2.25)#95 | 11.1%(-2.26)#7,073 |
| 96. | Magazine | 8.9% | 11.1%(-2.13)#96 | 11.1%(-2.14)#7,185 |
| 97. | Greenwood | 9.0% | 11.1%(-2.08)#97 | 11.1%(-2.09)#7,228 |
| 98. | Brookland | 9.0% | 11.1%(-2.05)#98 | 11.1%(-2.06)#7,249 |
| 99. | Holland | 9.1% | 11.1%(-1.97)#99 | 11.1%(-1.98)#7,331 |
| 100. | Hartford | 9.1% | 11.1%(-1.97)#100 | 11.1%(-1.98)#7,346 |
Common Questions
What are the Top 10 Cities with the Lowest Poverty Level Among Seniors Over the Age of 75 in Arkansas?
Top 10 Cities with the Lowest Poverty Level Among Seniors Over the Age of 75 in Arkansas are:
#1
0.56%
#2
0.96%
#3
1.2%
#4
1.4%
#5
1.8%
#6
1.9%
#7
1.9%
#8
2.0%
#9
2.1%
#10
2.4%
What city has the Lowest Poverty Level Among Seniors Over the Age of 75 in Arkansas?
Cave Springs has the Lowest Poverty Level Among Seniors Over the Age of 75 in Arkansas with 0.56%.
What is the Poverty Level Among Seniors Over the Age of 75 in the State of Arkansas?
Poverty Level Among Seniors Over the Age of 75 in Arkansas is 11.1%.
What is the Poverty Level Among Seniors Over the Age of 75 in the United States?
Poverty Level Among Seniors Over the Age of 75 in the United States is 11.1%.