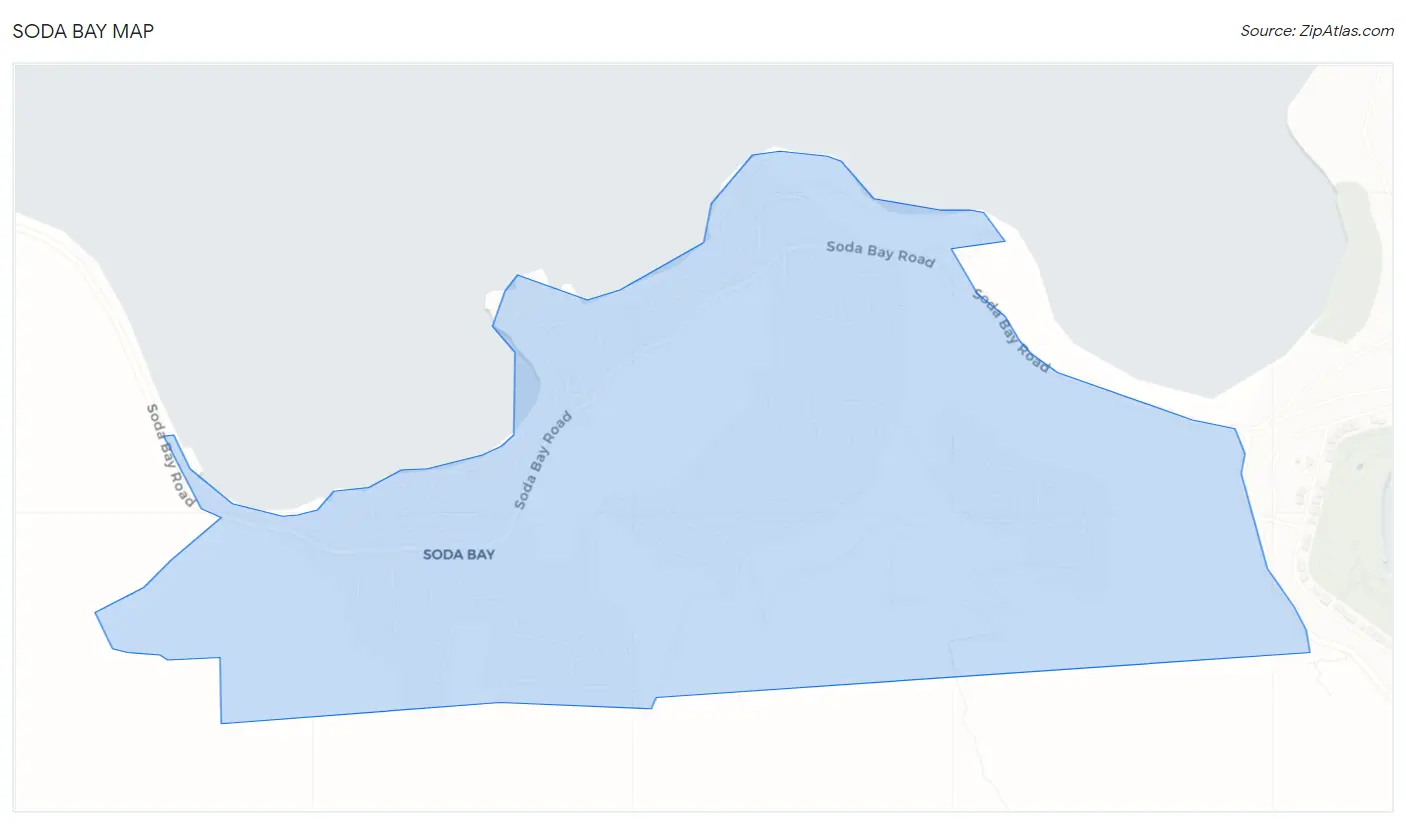
Soda Bay, CA Map & Demographics
Soda Bay Map
Soda Bay Overview
$52,844
PER CAPITA INCOME
$97,260
AVG FAMILY INCOME
$87,443
AVG HOUSEHOLD INCOME
0.45
INEQUALITY / GINI INDEX
759
TOTAL POPULATION
350
MALE POPULATION
409
FEMALE POPULATION
85.57
MALES / 100 FEMALES
116.86
FEMALES / 100 MALES
61.4
MEDIAN AGE
2.5
AVG FAMILY SIZE
2.1
AVG HOUSEHOLD SIZE
464
LABOR FORCE [ PEOPLE ]
61.1%
PERCENT IN LABOR FORCE
3.4%
UNEMPLOYMENT RATE
Income in Soda Bay
Income Overview in Soda Bay
Per Capita Income in Soda Bay is $52,844, while median incomes of families and households are $97,260 and $87,443 respectively.
| Characteristic | Number | Measure |
| Per Capita Income | 759 | $52,844 |
| Median Family Income | 243 | $97,260 |
| Mean Family Income | 243 | $145,623 |
| Median Household Income | 359 | $87,443 |
| Mean Household Income | 359 | $110,336 |
| Income Deficit | 243 | $0 |
| Wage / Income Gap (%) | 759 | 0.00% |
| Wage / Income Gap ($) | 759 | 100.00¢ per $1 |
| Gini / Inequality Index | 759 | 0.45 |
Earnings by Sex in Soda Bay
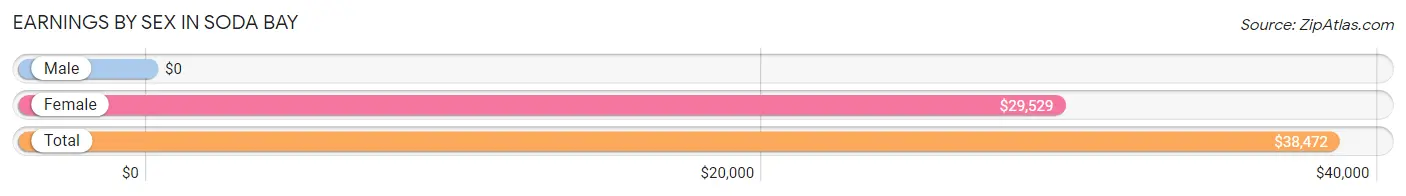
| Sex | Number | Average Earnings |
| Male | 205 (45.8%) | $0 |
| Female | 243 (54.2%) | $29,529 |
| Total | 448 (100.0%) | $38,472 |
Earnings by Sex by Income Bracket in Soda Bay
The most common earnings brackets in Soda Bay are $100,000+ for men (76 | 37.1%) and $25,000 to $29,999 for women (77 | 31.7%).
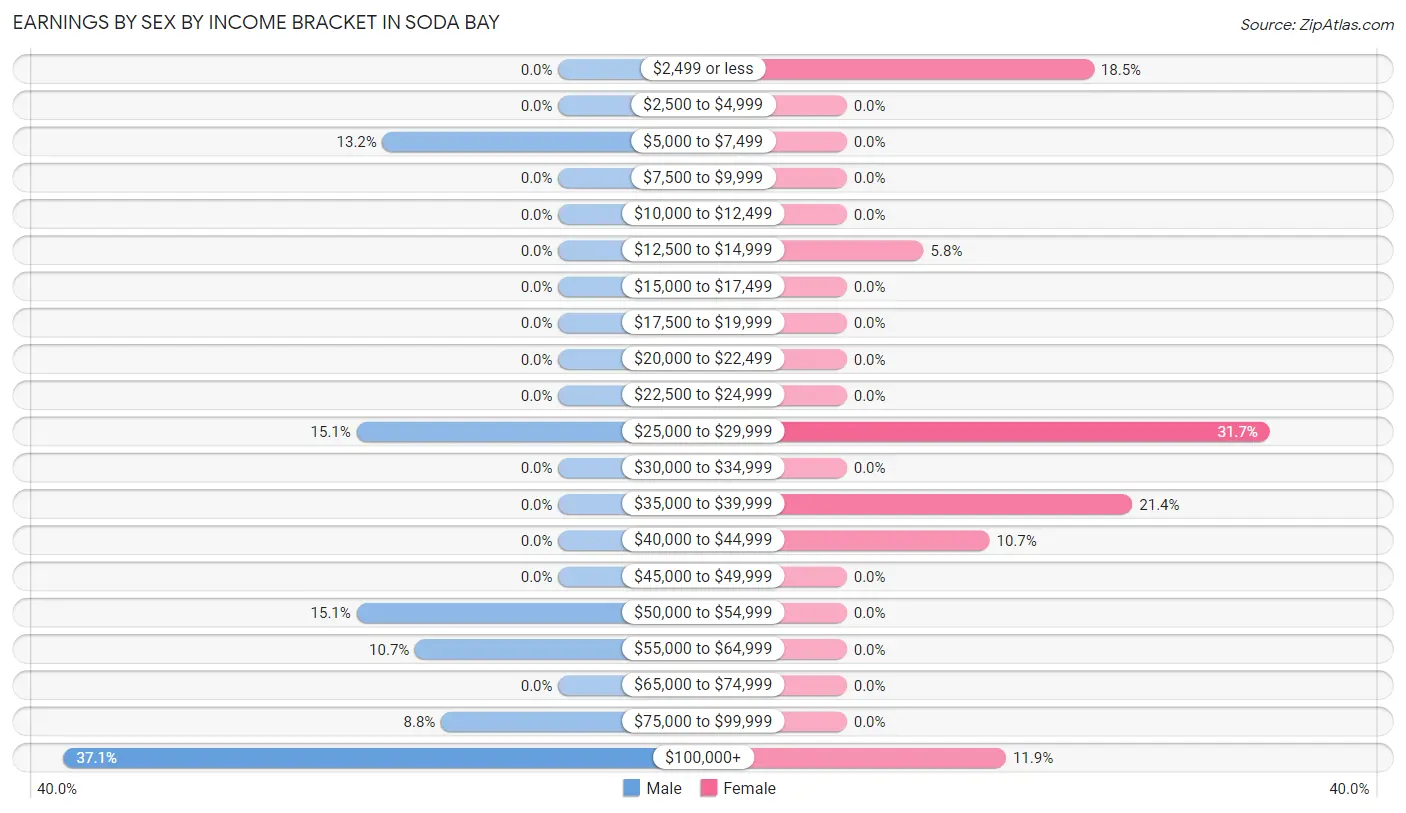
| Income | Male | Female |
| $2,499 or less | 0 (0.0%) | 45 (18.5%) |
| $2,500 to $4,999 | 0 (0.0%) | 0 (0.0%) |
| $5,000 to $7,499 | 27 (13.2%) | 0 (0.0%) |
| $7,500 to $9,999 | 0 (0.0%) | 0 (0.0%) |
| $10,000 to $12,499 | 0 (0.0%) | 0 (0.0%) |
| $12,500 to $14,999 | 0 (0.0%) | 14 (5.8%) |
| $15,000 to $17,499 | 0 (0.0%) | 0 (0.0%) |
| $17,500 to $19,999 | 0 (0.0%) | 0 (0.0%) |
| $20,000 to $22,499 | 0 (0.0%) | 0 (0.0%) |
| $22,500 to $24,999 | 0 (0.0%) | 0 (0.0%) |
| $25,000 to $29,999 | 31 (15.1%) | 77 (31.7%) |
| $30,000 to $34,999 | 0 (0.0%) | 0 (0.0%) |
| $35,000 to $39,999 | 0 (0.0%) | 52 (21.4%) |
| $40,000 to $44,999 | 0 (0.0%) | 26 (10.7%) |
| $45,000 to $49,999 | 0 (0.0%) | 0 (0.0%) |
| $50,000 to $54,999 | 31 (15.1%) | 0 (0.0%) |
| $55,000 to $64,999 | 22 (10.7%) | 0 (0.0%) |
| $65,000 to $74,999 | 0 (0.0%) | 0 (0.0%) |
| $75,000 to $99,999 | 18 (8.8%) | 0 (0.0%) |
| $100,000+ | 76 (37.1%) | 29 (11.9%) |
| Total | 205 (100.0%) | 243 (100.0%) |
Earnings by Sex by Educational Attainment in Soda Bay
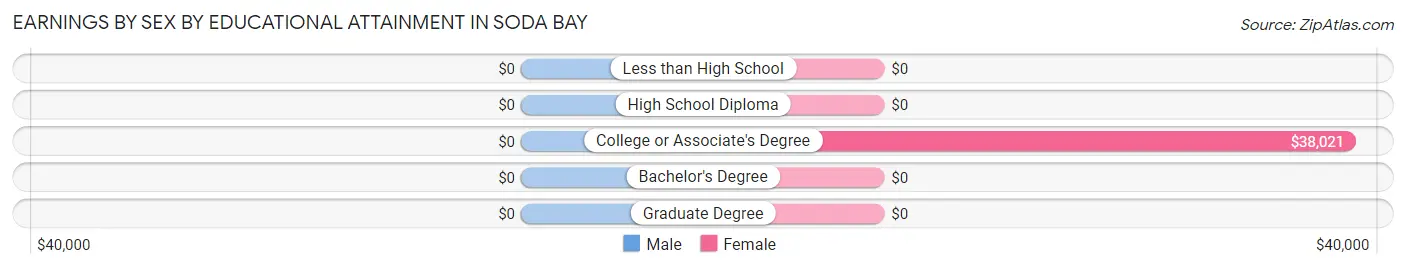
| Educational Attainment | Male Income | Female Income |
| Less than High School | - | - |
| High School Diploma | - | - |
| College or Associate's Degree | - | - |
| Bachelor's Degree | - | - |
| Graduate Degree | - | - |
| Total | $100,221 | $29,935 |
Family Income in Soda Bay
Family Income Brackets in Soda Bay
According to the Soda Bay family income data, there are 75 families falling into the $75,000 to $99,999 income range, which is the most common income bracket and makes up 30.9% of all families.
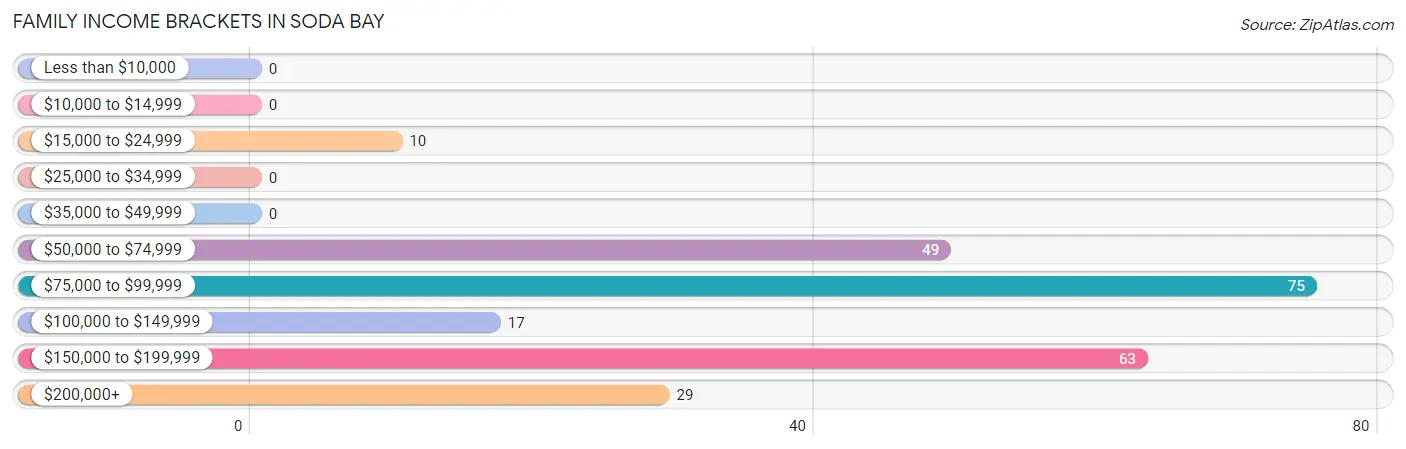
| Income Bracket | # Families | % Families |
| Less than $10,000 | 0 | 0.0% |
| $10,000 to $14,999 | 0 | 0.0% |
| $15,000 to $24,999 | 10 | 4.1% |
| $25,000 to $34,999 | 0 | 0.0% |
| $35,000 to $49,999 | 0 | 0.0% |
| $50,000 to $74,999 | 49 | 20.2% |
| $75,000 to $99,999 | 75 | 30.9% |
| $100,000 to $149,999 | 17 | 7.0% |
| $150,000 to $199,999 | 63 | 25.9% |
| $200,000+ | 29 | 11.9% |
Family Income by Famaliy Size in Soda Bay
2-person families (174 | 71.6%) account for the highest median family income in Soda Bay with $98,250 per family, while 2-person families (174 | 71.6%) have the highest median income of $49,125 per family member.
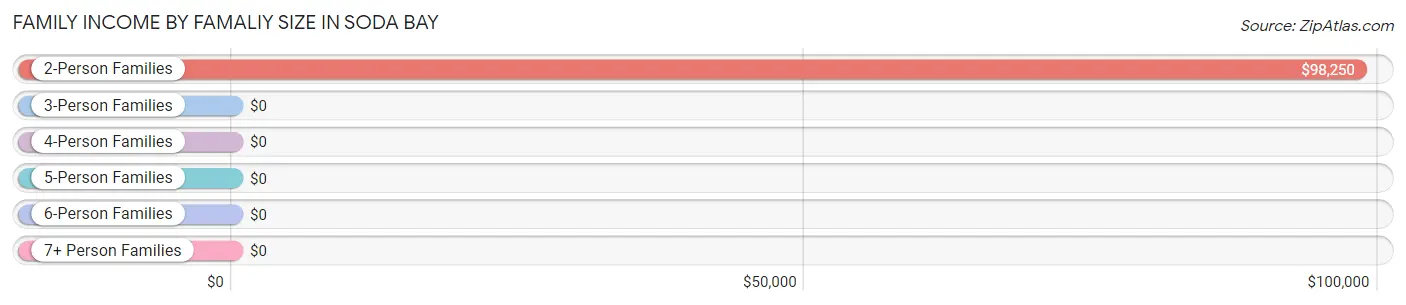
| Income Bracket | # Families | Median Income |
| 2-Person Families | 174 (71.6%) | $98,250 |
| 3-Person Families | 40 (16.5%) | $0 |
| 4-Person Families | 29 (11.9%) | $0 |
| 5-Person Families | 0 (0.0%) | $0 |
| 6-Person Families | 0 (0.0%) | $0 |
| 7+ Person Families | 0 (0.0%) | $0 |
| Total | 243 (100.0%) | $97,260 |
Family Income by Number of Earners in Soda Bay
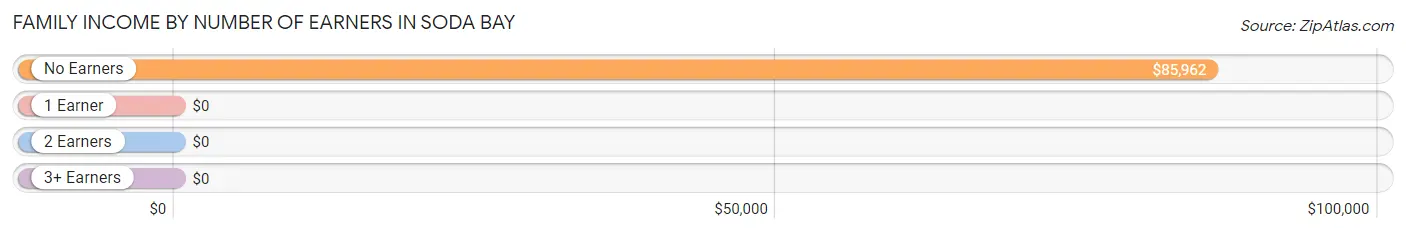
| Number of Earners | # Families | Median Income |
| No Earners | 84 (34.6%) | $85,962 |
| 1 Earner | 17 (7.0%) | $0 |
| 2 Earners | 73 (30.0%) | $0 |
| 3+ Earners | 69 (28.4%) | $0 |
| Total | 243 (100.0%) | $97,260 |
Household Income in Soda Bay
Household Income Brackets in Soda Bay
With 84 households falling in the category, the $75,000 to $99,999 income range is the most frequent in Soda Bay, accounting for 23.4% of all households.
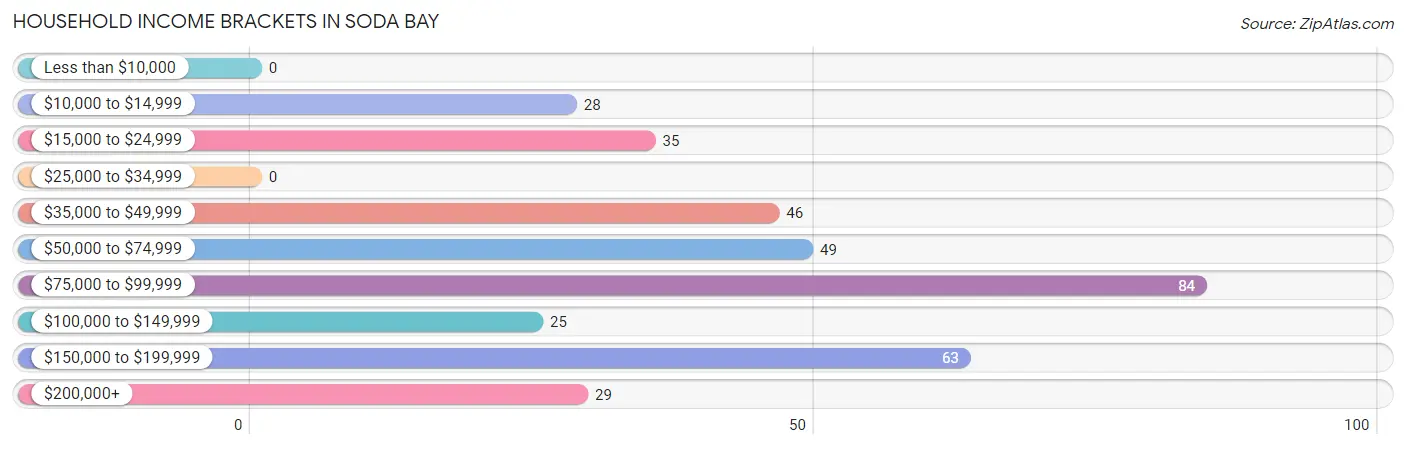
| Income Bracket | # Households | % Households |
| Less than $10,000 | 0 | 0.0% |
| $10,000 to $14,999 | 28 | 7.8% |
| $15,000 to $24,999 | 35 | 9.7% |
| $25,000 to $34,999 | 0 | 0.0% |
| $35,000 to $49,999 | 46 | 12.8% |
| $50,000 to $74,999 | 49 | 13.6% |
| $75,000 to $99,999 | 84 | 23.4% |
| $100,000 to $149,999 | 25 | 7.0% |
| $150,000 to $199,999 | 63 | 17.5% |
| $200,000+ | 29 | 8.1% |
Household Income by Householder Age in Soda Bay
The median household income in Soda Bay is $87,443, with the highest median household income of $98,625 found in the 65+ years age bracket for the primary householder. A total of 171 households (47.6%) fall into this category.
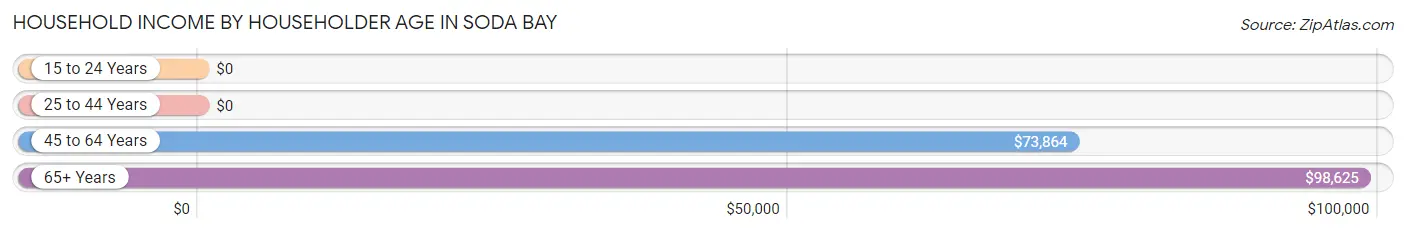
| Income Bracket | # Households | Median Income |
| 15 to 24 Years | 0 (0.0%) | $0 |
| 25 to 44 Years | 22 (6.1%) | $0 |
| 45 to 64 Years | 166 (46.2%) | $73,864 |
| 65+ Years | 171 (47.6%) | $98,625 |
| Total | 359 (100.0%) | $87,443 |
Poverty in Soda Bay
Income Below Poverty by Sex and Age in Soda Bay
With 0.6% poverty level for males and 12.2% for females among the residents of Soda Bay, 25 to 34 year old males and 25 to 34 year old females are the most vulnerable to poverty, with 1 males (3.6%) and 14 females (31.8%) in their respective age groups living below the poverty level.
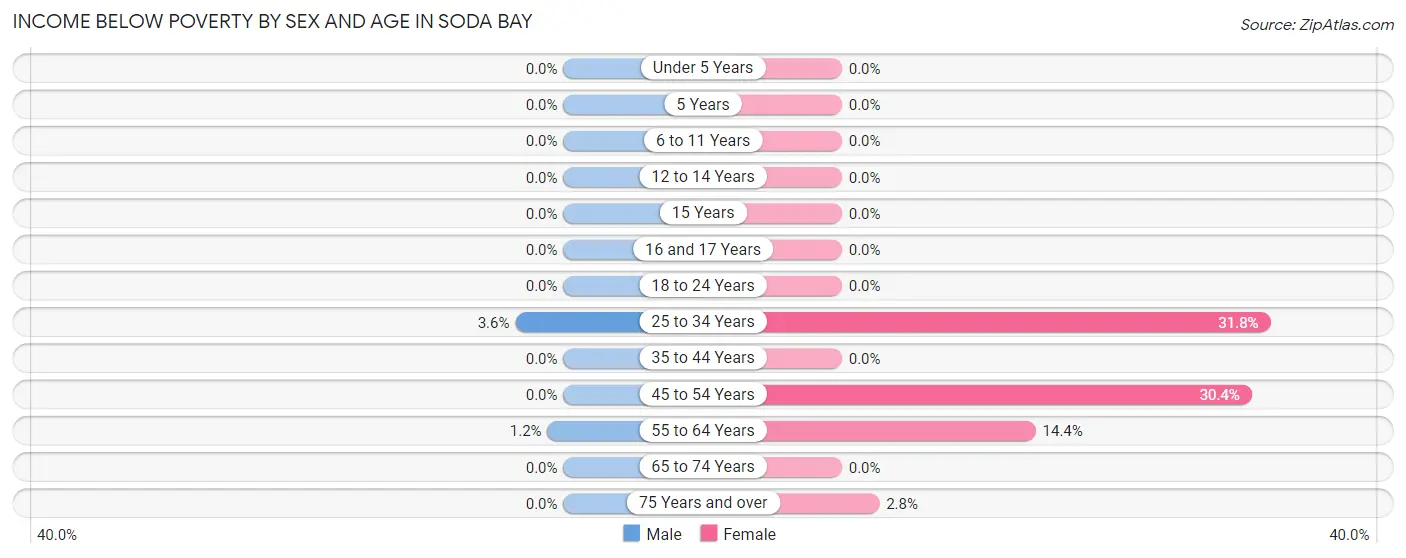
| Age Bracket | Male | Female |
| Under 5 Years | 0 (0.0%) | 0 (0.0%) |
| 5 Years | 0 (0.0%) | 0 (0.0%) |
| 6 to 11 Years | 0 (0.0%) | 0 (0.0%) |
| 12 to 14 Years | 0 (0.0%) | 0 (0.0%) |
| 15 Years | 0 (0.0%) | 0 (0.0%) |
| 16 and 17 Years | 0 (0.0%) | 0 (0.0%) |
| 18 to 24 Years | 0 (0.0%) | 0 (0.0%) |
| 25 to 34 Years | 1 (3.6%) | 14 (31.8%) |
| 35 to 44 Years | 0 (0.0%) | 0 (0.0%) |
| 45 to 54 Years | 0 (0.0%) | 14 (30.4%) |
| 55 to 64 Years | 1 (1.2%) | 20 (14.4%) |
| 65 to 74 Years | 0 (0.0%) | 0 (0.0%) |
| 75 Years and over | 0 (0.0%) | 2 (2.8%) |
| Total | 2 (0.6%) | 50 (12.2%) |
Income Above Poverty by Sex and Age in Soda Bay
According to the poverty statistics in Soda Bay, males aged 18 to 24 years and females aged 18 to 24 years are the age groups that are most secure financially, with 100.0% of males and 100.0% of females in these age groups living above the poverty line.
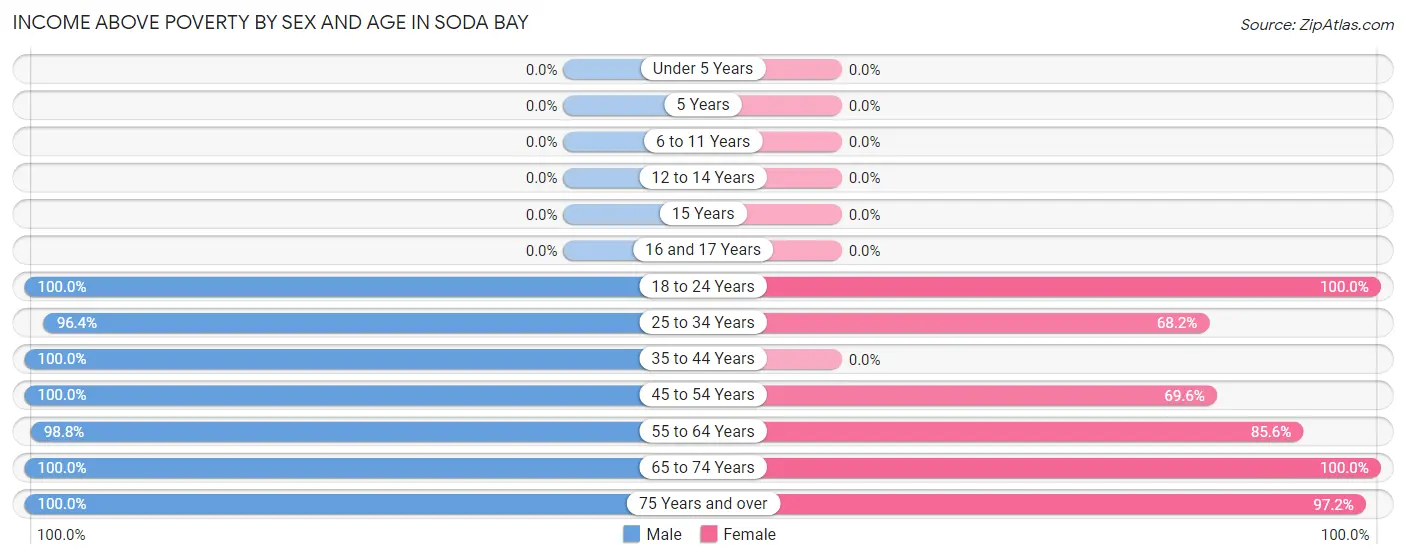
| Age Bracket | Male | Female |
| Under 5 Years | 0 (0.0%) | 0 (0.0%) |
| 5 Years | 0 (0.0%) | 0 (0.0%) |
| 6 to 11 Years | 0 (0.0%) | 0 (0.0%) |
| 12 to 14 Years | 0 (0.0%) | 0 (0.0%) |
| 15 Years | 0 (0.0%) | 0 (0.0%) |
| 16 and 17 Years | 0 (0.0%) | 0 (0.0%) |
| 18 to 24 Years | 62 (100.0%) | 25 (100.0%) |
| 25 to 34 Years | 27 (96.4%) | 30 (68.2%) |
| 35 to 44 Years | 8 (100.0%) | 0 (0.0%) |
| 45 to 54 Years | 47 (100.0%) | 32 (69.6%) |
| 55 to 64 Years | 84 (98.8%) | 119 (85.6%) |
| 65 to 74 Years | 80 (100.0%) | 83 (100.0%) |
| 75 Years and over | 40 (100.0%) | 70 (97.2%) |
| Total | 348 (99.4%) | 359 (87.8%) |
Income Below Poverty Among Married-Couple Families in Soda Bay
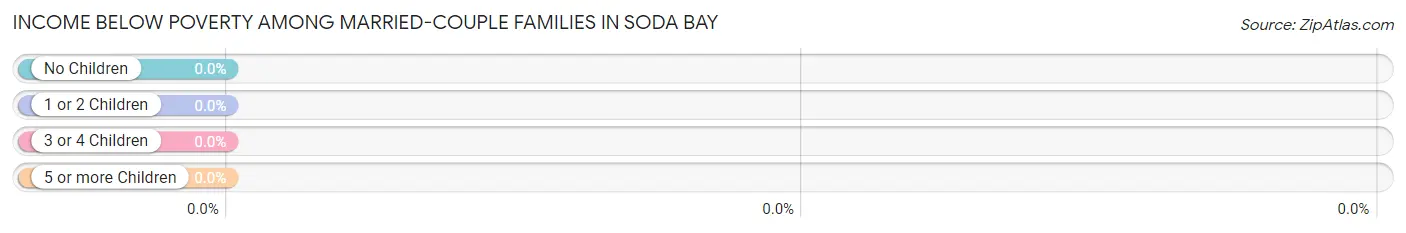
| Children | Above Poverty | Below Poverty |
| No Children | 221 (100.0%) | 0 (0.0%) |
| 1 or 2 Children | 0 (0.0%) | 0 (0.0%) |
| 3 or 4 Children | 0 (0.0%) | 0 (0.0%) |
| 5 or more Children | 0 (0.0%) | 0 (0.0%) |
| Total | 221 (100.0%) | 0 (0.0%) |
Income Below Poverty Among Single-Parent Households in Soda Bay
| Children | Single Father | Single Mother |
| No Children | 0 (0.0%) | 0 (0.0%) |
| 1 or 2 Children | 0 (0.0%) | 0 (0.0%) |
| 3 or 4 Children | 0 (0.0%) | 0 (0.0%) |
| 5 or more Children | 0 (0.0%) | 0 (0.0%) |
| Total | 0 (0.0%) | 0 (0.0%) |
Income Below Poverty Among Married-Couple vs Single-Parent Households in Soda Bay
| Children | Married-Couple Families | Single-Parent Households |
| No Children | 0 (0.0%) | 0 (0.0%) |
| 1 or 2 Children | 0 (0.0%) | 0 (0.0%) |
| 3 or 4 Children | 0 (0.0%) | 0 (0.0%) |
| 5 or more Children | 0 (0.0%) | 0 (0.0%) |
| Total | 0 (0.0%) | 0 (0.0%) |
Race in Soda Bay
The most populous races in Soda Bay are White / Caucasian (548 | 72.2%), Hispanic or Latino (145 | 19.1%), and Hawaiian / Pacific (87 | 11.5%).
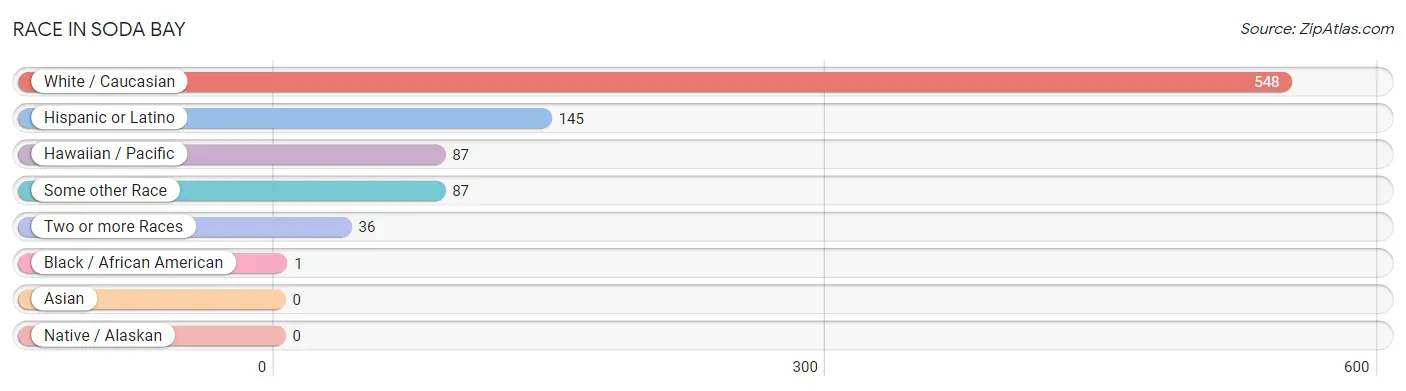
| Race | # Population | % Population |
| Asian | 0 | 0.0% |
| Black / African American | 1 | 0.1% |
| Hawaiian / Pacific | 87 | 11.5% |
| Hispanic or Latino | 145 | 19.1% |
| Native / Alaskan | 0 | 0.0% |
| White / Caucasian | 548 | 72.2% |
| Two or more Races | 36 | 4.7% |
| Some other Race | 87 | 11.5% |
| Total | 759 | 100.0% |
Ancestry in Soda Bay
The most populous ancestries reported in Soda Bay are English (174 | 22.9%), Irish (124 | 16.3%), German (113 | 14.9%), Mexican (97 | 12.8%), and Samoan (87 | 11.5%), together accounting for 78.4% of all Soda Bay residents.
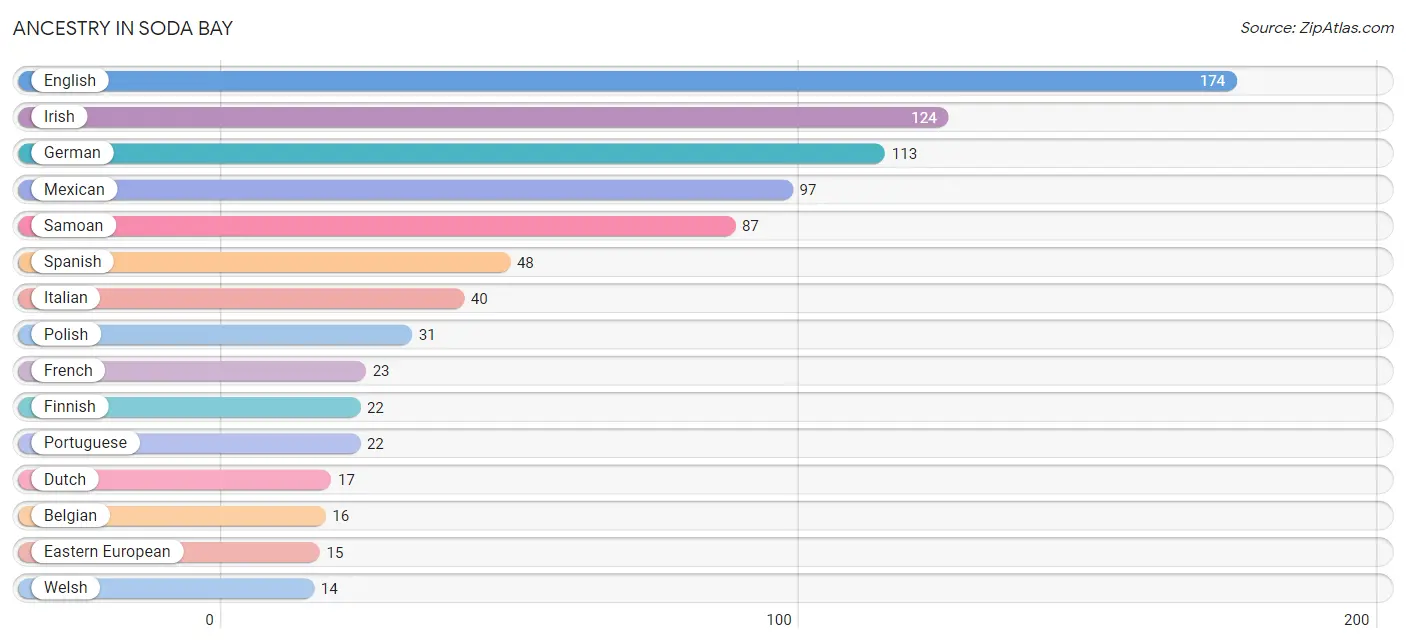
| Ancestry | # Population | % Population |
| African | 1 | 0.1% |
| Austrian | 13 | 1.7% |
| Belgian | 16 | 2.1% |
| Dutch | 17 | 2.2% |
| Eastern European | 15 | 2.0% |
| English | 174 | 22.9% |
| Finnish | 22 | 2.9% |
| French | 23 | 3.0% |
| German | 113 | 14.9% |
| Irish | 124 | 16.3% |
| Italian | 40 | 5.3% |
| Mexican | 97 | 12.8% |
| Polish | 31 | 4.1% |
| Portuguese | 22 | 2.9% |
| Samoan | 87 | 11.5% |
| Spanish | 48 | 6.3% |
| Subsaharan African | 1 | 0.1% |
| Welsh | 14 | 1.8% | View All 18 Rows |
Immigrants in Soda Bay
The most numerous immigrant groups reported in Soda Bay came from Central America (36 | 4.7%), Latin America (36 | 4.7%), Mexico (36 | 4.7%), Europe (20 | 2.6%), and Northern Europe (20 | 2.6%), together accounting for 19.5% of all Soda Bay residents.
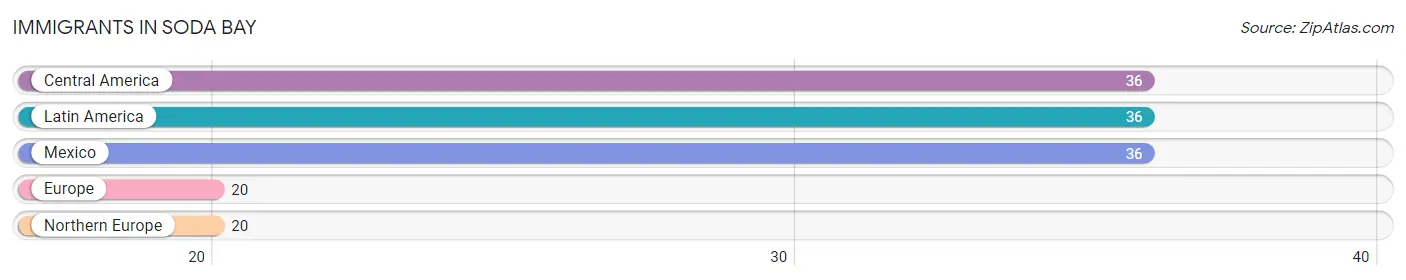
| Immigration Origin | # Population | % Population |
| Central America | 36 | 4.7% |
| Europe | 20 | 2.6% |
| Latin America | 36 | 4.7% |
| Mexico | 36 | 4.7% |
| Northern Europe | 20 | 2.6% | View All 5 Rows |
Sex and Age in Soda Bay
Sex and Age in Soda Bay
The most populous age groups in Soda Bay are 60 to 64 Years (67 | 19.1%) for men and 55 to 59 Years (71 | 17.4%) for women.
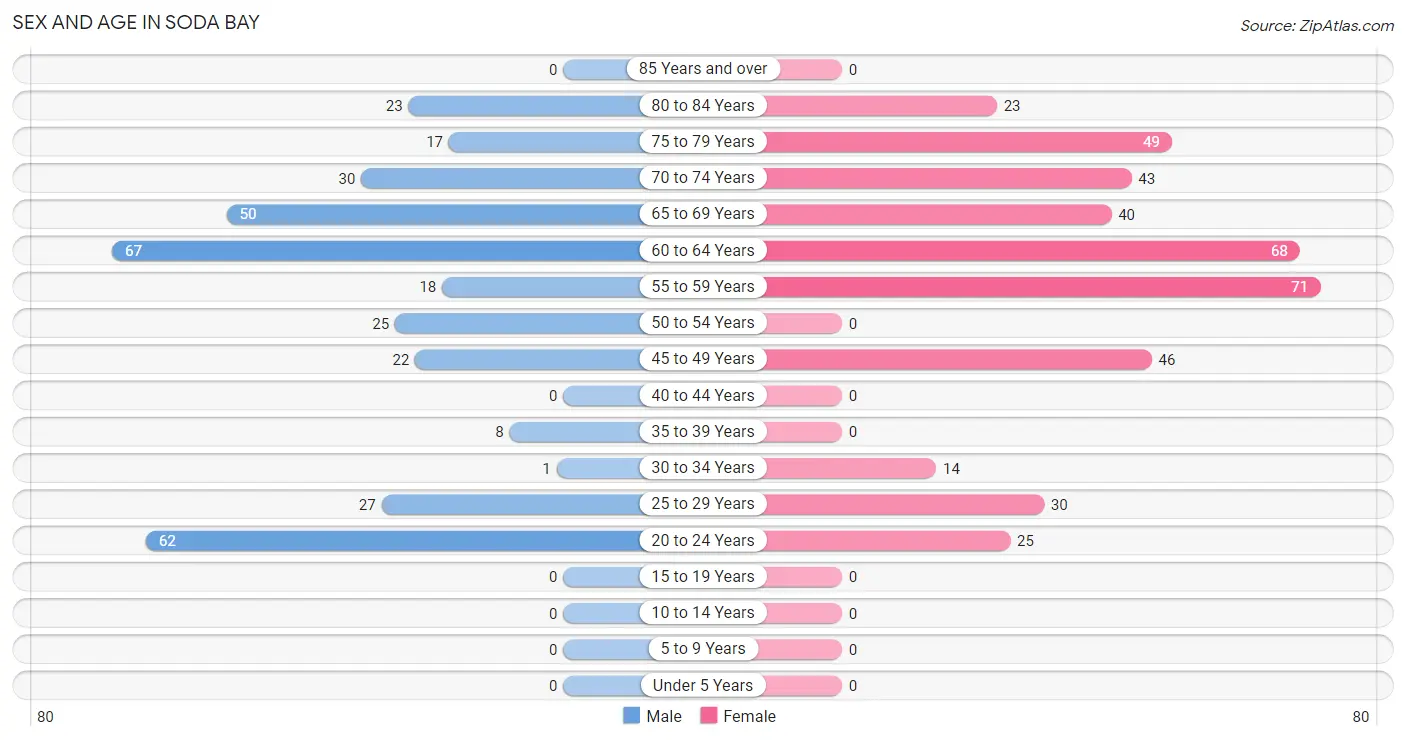
| Age Bracket | Male | Female |
| Under 5 Years | 0 (0.0%) | 0 (0.0%) |
| 5 to 9 Years | 0 (0.0%) | 0 (0.0%) |
| 10 to 14 Years | 0 (0.0%) | 0 (0.0%) |
| 15 to 19 Years | 0 (0.0%) | 0 (0.0%) |
| 20 to 24 Years | 62 (17.7%) | 25 (6.1%) |
| 25 to 29 Years | 27 (7.7%) | 30 (7.3%) |
| 30 to 34 Years | 1 (0.3%) | 14 (3.4%) |
| 35 to 39 Years | 8 (2.3%) | 0 (0.0%) |
| 40 to 44 Years | 0 (0.0%) | 0 (0.0%) |
| 45 to 49 Years | 22 (6.3%) | 46 (11.3%) |
| 50 to 54 Years | 25 (7.1%) | 0 (0.0%) |
| 55 to 59 Years | 18 (5.1%) | 71 (17.4%) |
| 60 to 64 Years | 67 (19.1%) | 68 (16.6%) |
| 65 to 69 Years | 50 (14.3%) | 40 (9.8%) |
| 70 to 74 Years | 30 (8.6%) | 43 (10.5%) |
| 75 to 79 Years | 17 (4.9%) | 49 (12.0%) |
| 80 to 84 Years | 23 (6.6%) | 23 (5.6%) |
| 85 Years and over | 0 (0.0%) | 0 (0.0%) |
| Total | 350 (100.0%) | 409 (100.0%) |
Families and Households in Soda Bay
Median Family Size in Soda Bay
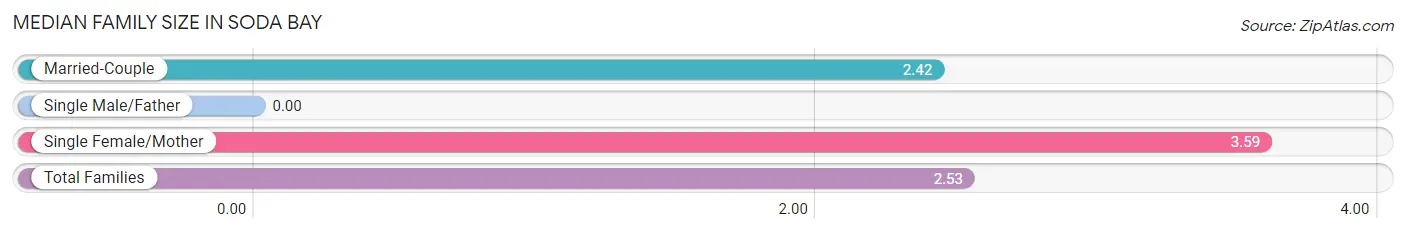
| Family Type | # Families | Family Size |
| Married-Couple | 221 (90.9%) | 2.42 |
| Single Male/Father | 0 (0.0%) | - |
| Single Female/Mother | 22 (9.0%) | 3.59 |
| Total Families | 243 (100.0%) | 2.53 |
Median Household Size in Soda Bay
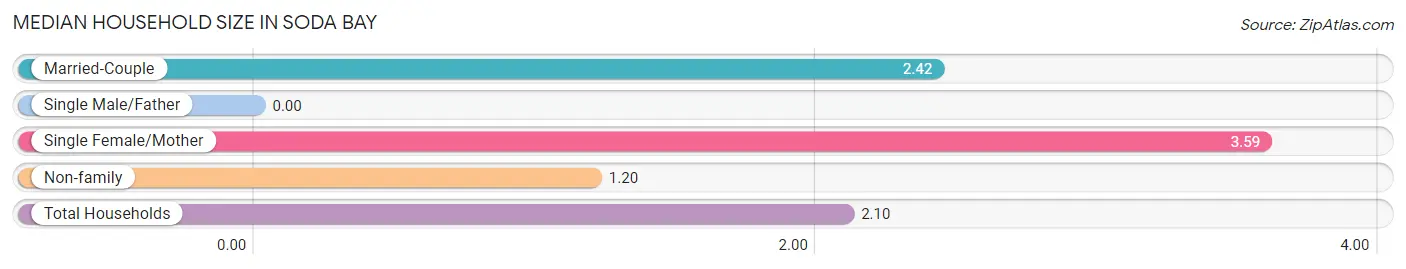
| Household Type | # Households | Household Size |
| Married-Couple | 221 (61.6%) | 2.42 |
| Single Male/Father | 0 (0.0%) | - |
| Single Female/Mother | 22 (6.1%) | 3.59 |
| Non-family | 116 (32.3%) | 1.20 |
| Total Households | 359 (100.0%) | 2.10 |
Household Size by Marriage Status in Soda Bay
Out of a total of 359 households in Soda Bay, 243 (67.7%) are family households, while 116 (32.3%) are nonfamily households. The most numerous type of family households are 2-person households, comprising 174, and the most common type of nonfamily households are 1-person households, comprising 98.
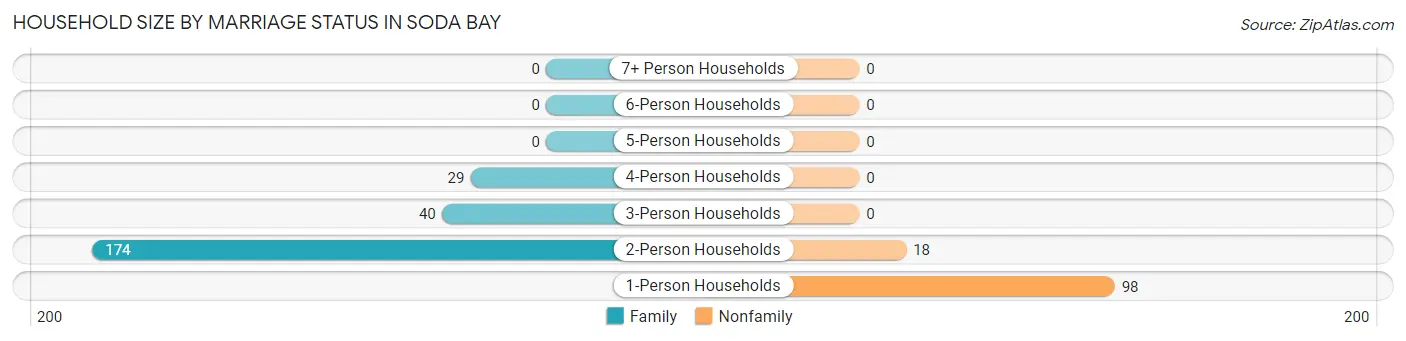
| Household Size | Family Households | Nonfamily Households |
| 1-Person Households | - | 98 (27.3%) |
| 2-Person Households | 174 (48.5%) | 18 (5.0%) |
| 3-Person Households | 40 (11.1%) | 0 (0.0%) |
| 4-Person Households | 29 (8.1%) | 0 (0.0%) |
| 5-Person Households | 0 (0.0%) | 0 (0.0%) |
| 6-Person Households | 0 (0.0%) | 0 (0.0%) |
| 7+ Person Households | 0 (0.0%) | 0 (0.0%) |
| Total | 243 (67.7%) | 116 (32.3%) |
Female Fertility in Soda Bay
Fertility by Age in Soda Bay
| Age Bracket | Women with Births | Births / 1,000 Women |
| 15 to 19 years | 0 (0.0%) | 0.0 |
| 20 to 34 years | 0 (0.0%) | 0.0 |
| 35 to 50 years | 0 (0.0%) | 0.0 |
| Total | 0 (0.0%) | 0.0 |
Fertility by Age by Marriage Status in Soda Bay
| Age Bracket | Married | Unmarried |
| 15 to 19 years | 0 (0.0%) | 0 (0.0%) |
| 20 to 34 years | 0 (0.0%) | 0 (0.0%) |
| 35 to 50 years | 0 (0.0%) | 0 (0.0%) |
| Total | 0 (0.0%) | 0 (0.0%) |
Fertility by Education in Soda Bay
| Educational Attainment | Women with Births | Births / 1,000 Women |
| Less than High School | 0 (0.0%) | 0.0 |
| High School Diploma | 0 (0.0%) | 0.0 |
| College or Associate's Degree | 0 (0.0%) | 0.0 |
| Bachelor's Degree | 0 (0.0%) | 0.0 |
| Graduate Degree | 0 (0.0%) | 0.0 |
| Total | 0 (0.0%) | 0.0 |
Fertility by Education by Marriage Status in Soda Bay
| Educational Attainment | Married | Unmarried |
| Less than High School | 0 (0.0%) | 0 (0.0%) |
| High School Diploma | 0 (0.0%) | 0 (0.0%) |
| College or Associate's Degree | 0 (0.0%) | 0 (0.0%) |
| Bachelor's Degree | 0 (0.0%) | 0 (0.0%) |
| Graduate Degree | 0 (0.0%) | 0 (0.0%) |
| Total | 0 (0.0%) | 0 (0.0%) |
Employment Characteristics in Soda Bay
Employment by Class of Employer in Soda Bay
Among the 448 employed individuals in Soda Bay, private company employees (333 | 74.3%), local government employees (69 | 15.4%), and self-employed (not incorporated) (22 | 4.9%) make up the most common classes of employment.
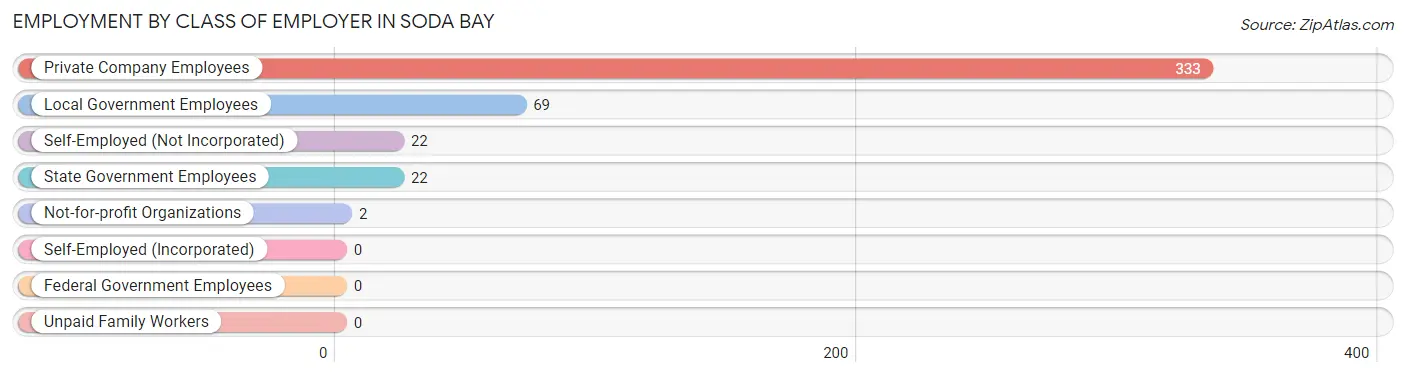
| Employer Class | # Employees | % Employees |
| Private Company Employees | 333 | 74.3% |
| Self-Employed (Incorporated) | 0 | 0.0% |
| Self-Employed (Not Incorporated) | 22 | 4.9% |
| Not-for-profit Organizations | 2 | 0.4% |
| Local Government Employees | 69 | 15.4% |
| State Government Employees | 22 | 4.9% |
| Federal Government Employees | 0 | 0.0% |
| Unpaid Family Workers | 0 | 0.0% |
| Total | 448 | 100.0% |
Employment Status by Age in Soda Bay
According to the labor force statistics for Soda Bay, out of the total population over 16 years of age (759), 61.1% or 464 individuals are in the labor force, with 3.4% or 16 of them unemployed. The age group with the highest labor force participation rate is 20 to 24 years, with 100.0% or 87 individuals in the labor force. Within the labor force, the 60 to 64 years age range has the highest percentage of unemployed individuals, with 17.9% or 15 of them being unemployed.
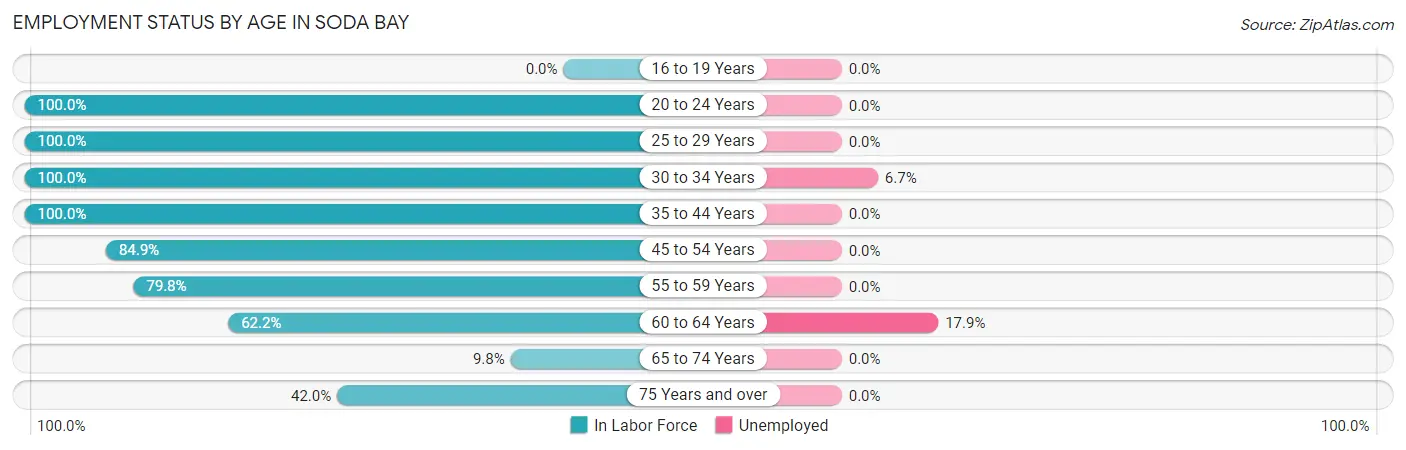
| Age Bracket | In Labor Force | Unemployed |
| 16 to 19 Years | 0 (0.0%) | 0 (0.0%) |
| 20 to 24 Years | 87 (100.0%) | 0 (0.0%) |
| 25 to 29 Years | 57 (100.0%) | 0 (0.0%) |
| 30 to 34 Years | 15 (100.0%) | 1 (6.7%) |
| 35 to 44 Years | 8 (100.0%) | 0 (0.0%) |
| 45 to 54 Years | 79 (84.9%) | 0 (0.0%) |
| 55 to 59 Years | 71 (79.8%) | 0 (0.0%) |
| 60 to 64 Years | 84 (62.2%) | 15 (17.9%) |
| 65 to 74 Years | 16 (9.8%) | 0 (0.0%) |
| 75 Years and over | 47 (42.0%) | 0 (0.0%) |
| Total | 464 (61.1%) | 16 (3.4%) |
Employment Status by Educational Attainment in Soda Bay
According to labor force statistics for Soda Bay, 79.1% of individuals (314) out of the total population between 25 and 64 years of age (397) are in the labor force, with 5.1% or 16 of them being unemployed. The group with the highest labor force participation rate are those with the educational attainment of less than high school, with 97.5% or 39 individuals in the labor force. Within the labor force, individuals with college / associate degree education have the highest percentage of unemployment, with 11.9% or 15 of them being unemployed.
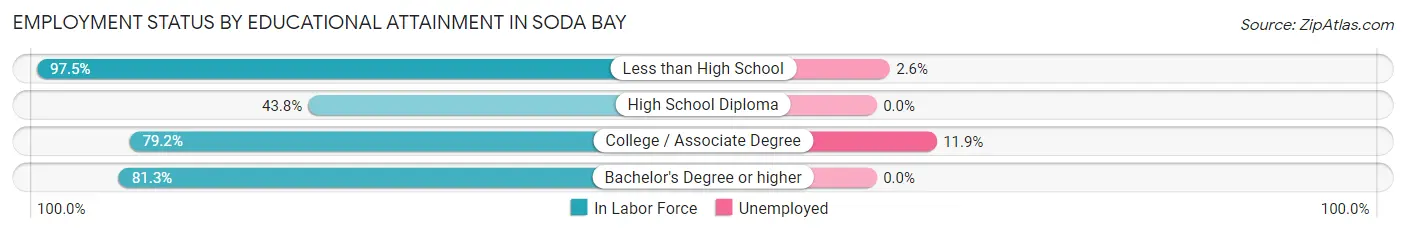
| Educational Attainment | In Labor Force | Unemployed |
| Less than High School | 39 (97.5%) | 1 (2.6%) |
| High School Diploma | 14 (43.8%) | 0 (0.0%) |
| College / Associate Degree | 126 (79.2%) | 19 (11.9%) |
| Bachelor's Degree or higher | 135 (81.3%) | 0 (0.0%) |
| Total | 314 (79.1%) | 20 (5.1%) |
Employment Occupations by Sex in Soda Bay
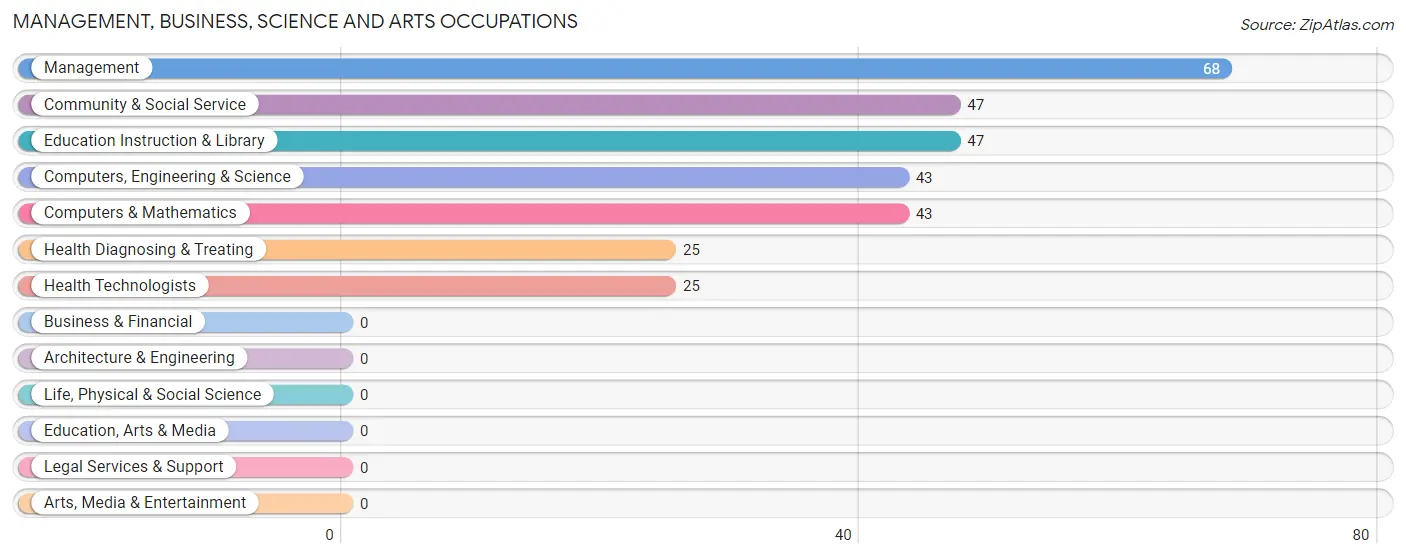
Management, Business, Science and Arts Occupations
The most common Management, Business, Science and Arts occupations in Soda Bay are Management (68 | 15.2%), Community & Social Service (47 | 10.5%), Education Instruction & Library (47 | 10.5%), Computers, Engineering & Science (43 | 9.6%), and Computers & Mathematics (43 | 9.6%).
Management, Business, Science and Arts Occupations by Sex
Within the Management, Business, Science and Arts occupations in Soda Bay, the most male-oriented occupations are Computers, Engineering & Science (100.0%), Computers & Mathematics (100.0%), and Health Diagnosing & Treating (100.0%), while the most female-oriented occupations are Community & Social Service (100.0%), Education Instruction & Library (100.0%), and Management (42.6%).
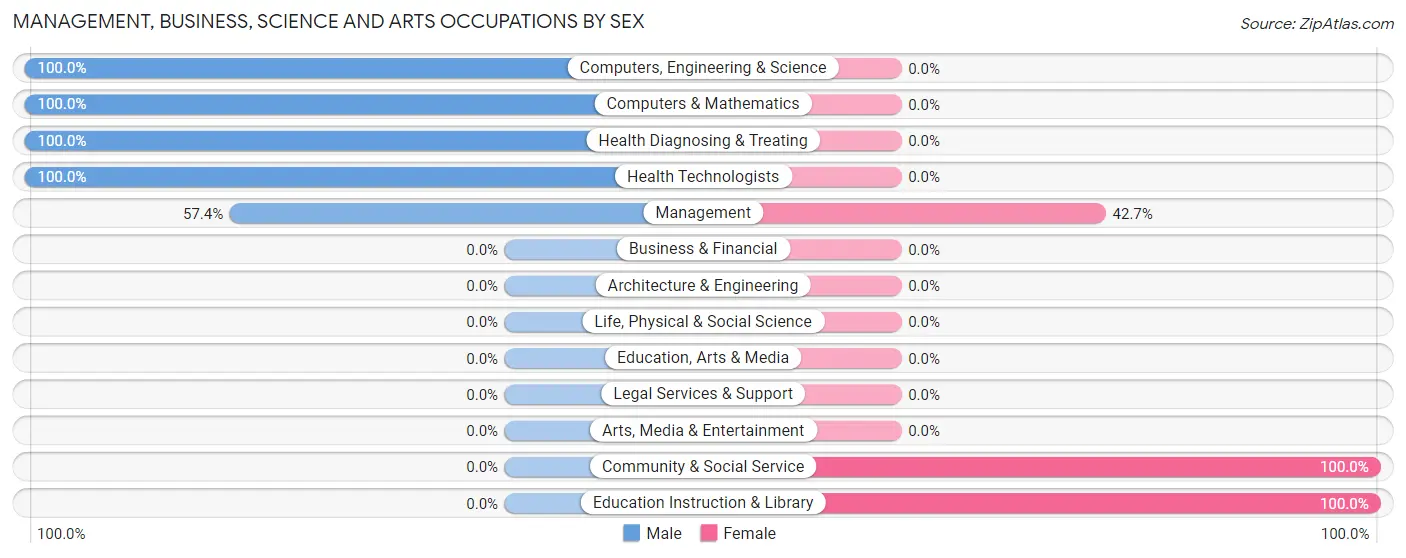
| Occupation | Male | Female |
| Management | 39 (57.4%) | 29 (42.6%) |
| Business & Financial | 0 (0.0%) | 0 (0.0%) |
| Computers, Engineering & Science | 43 (100.0%) | 0 (0.0%) |
| Computers & Mathematics | 43 (100.0%) | 0 (0.0%) |
| Architecture & Engineering | 0 (0.0%) | 0 (0.0%) |
| Life, Physical & Social Science | 0 (0.0%) | 0 (0.0%) |
| Community & Social Service | 0 (0.0%) | 47 (100.0%) |
| Education, Arts & Media | 0 (0.0%) | 0 (0.0%) |
| Legal Services & Support | 0 (0.0%) | 0 (0.0%) |
| Education Instruction & Library | 0 (0.0%) | 47 (100.0%) |
| Arts, Media & Entertainment | 0 (0.0%) | 0 (0.0%) |
| Health Diagnosing & Treating | 25 (100.0%) | 0 (0.0%) |
| Health Technologists | 25 (100.0%) | 0 (0.0%) |
| Total (Category) | 107 (58.5%) | 76 (41.5%) |
| Total (Overall) | 205 (45.8%) | 243 (54.2%) |
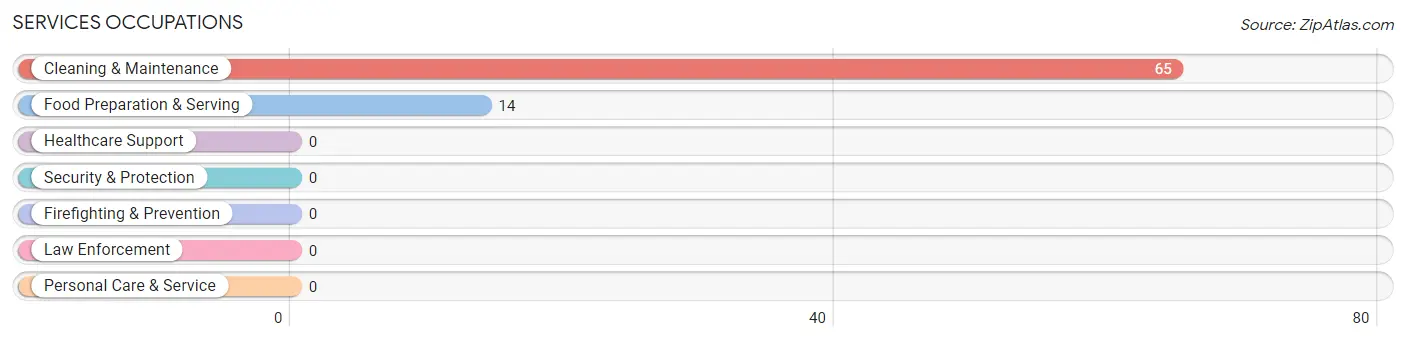
Services Occupations
The most common Services occupations in Soda Bay are Cleaning & Maintenance (65 | 14.5%), and Food Preparation & Serving (14 | 3.1%).
Services Occupations by Sex
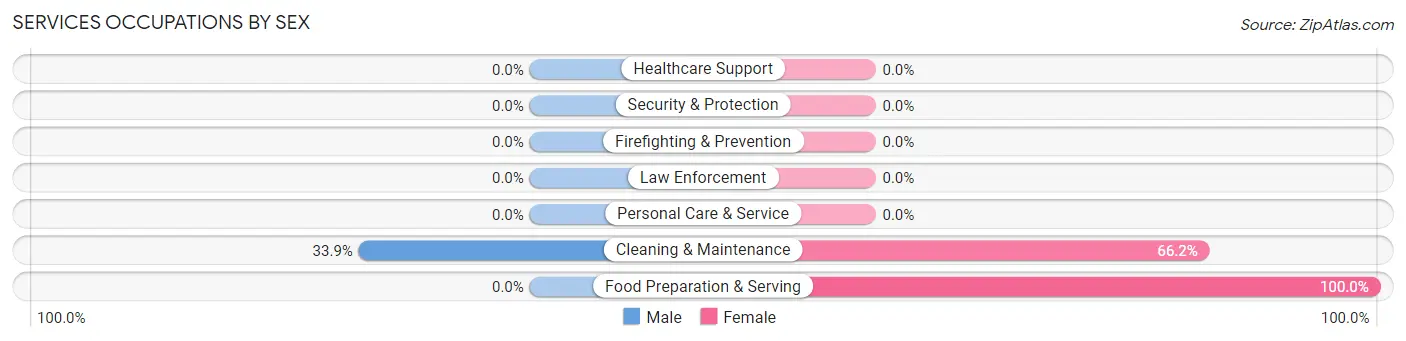
| Occupation | Male | Female |
| Healthcare Support | 0 (0.0%) | 0 (0.0%) |
| Security & Protection | 0 (0.0%) | 0 (0.0%) |
| Firefighting & Prevention | 0 (0.0%) | 0 (0.0%) |
| Law Enforcement | 0 (0.0%) | 0 (0.0%) |
| Food Preparation & Serving | 0 (0.0%) | 14 (100.0%) |
| Cleaning & Maintenance | 22 (33.9%) | 43 (66.1%) |
| Personal Care & Service | 0 (0.0%) | 0 (0.0%) |
| Total (Category) | 22 (27.9%) | 57 (72.2%) |
| Total (Overall) | 205 (45.8%) | 243 (54.2%) |
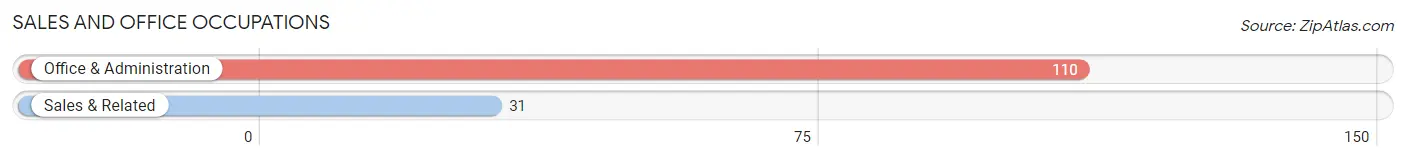
Sales and Office Occupations
The most common Sales and Office occupations in Soda Bay are Office & Administration (110 | 24.5%), and Sales & Related (31 | 6.9%).
Sales and Office Occupations by Sex
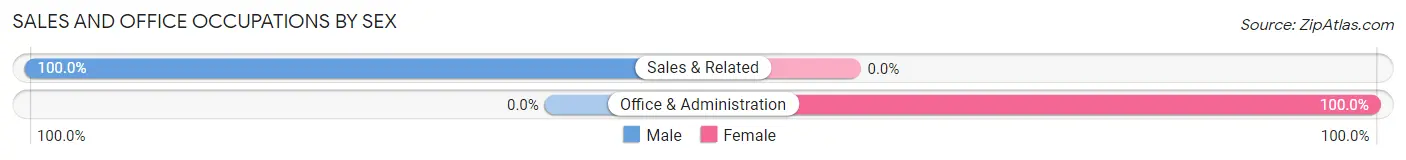
| Occupation | Male | Female |
| Sales & Related | 31 (100.0%) | 0 (0.0%) |
| Office & Administration | 0 (0.0%) | 110 (100.0%) |
| Total (Category) | 31 (22.0%) | 110 (78.0%) |
| Total (Overall) | 205 (45.8%) | 243 (54.2%) |
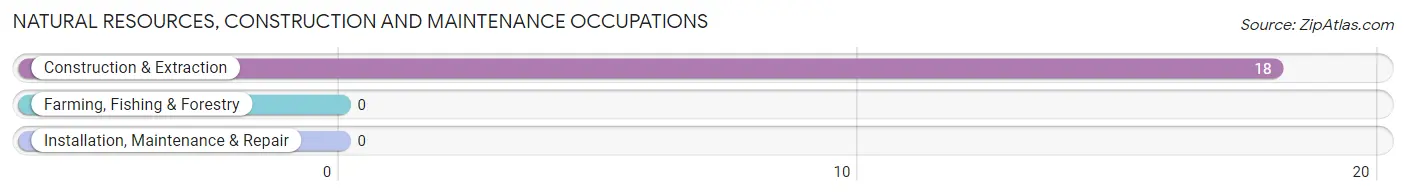
Natural Resources, Construction and Maintenance Occupations
The most common Natural Resources, Construction and Maintenance occupations in Soda Bay are , and Construction & Extraction (18 | 4.0%).
Natural Resources, Construction and Maintenance Occupations by Sex
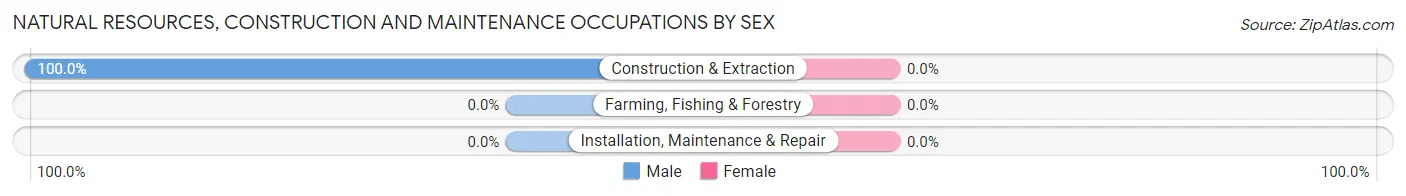
| Occupation | Male | Female |
| Farming, Fishing & Forestry | 0 (0.0%) | 0 (0.0%) |
| Construction & Extraction | 18 (100.0%) | 0 (0.0%) |
| Installation, Maintenance & Repair | 0 (0.0%) | 0 (0.0%) |
| Total (Category) | 18 (100.0%) | 0 (0.0%) |
| Total (Overall) | 205 (45.8%) | 243 (54.2%) |
Production, Transportation and Moving Occupations
The most common Production, Transportation and Moving occupations in Soda Bay are , and Material Moving (27 | 6.0%).
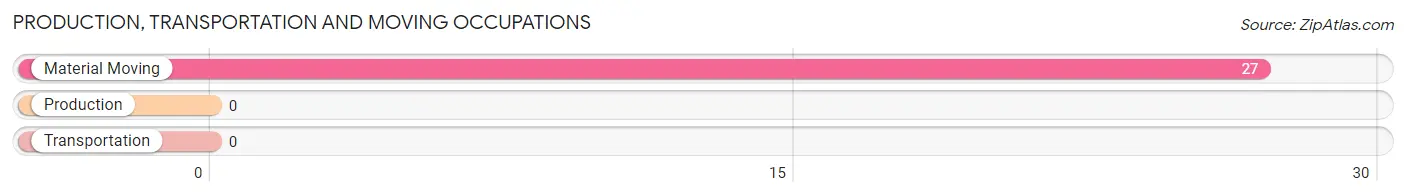
Production, Transportation and Moving Occupations by Sex
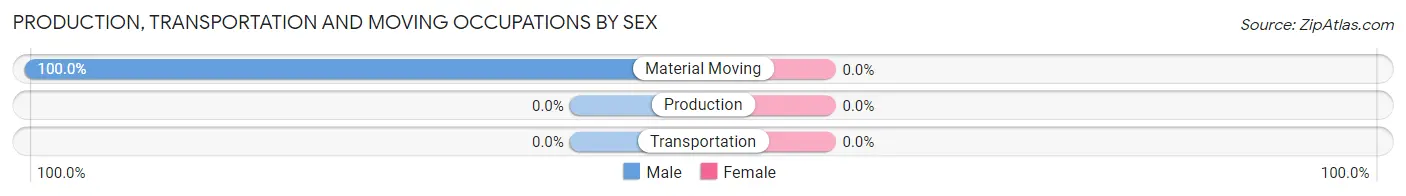
| Occupation | Male | Female |
| Production | 0 (0.0%) | 0 (0.0%) |
| Transportation | 0 (0.0%) | 0 (0.0%) |
| Material Moving | 27 (100.0%) | 0 (0.0%) |
| Total (Category) | 27 (100.0%) | 0 (0.0%) |
| Total (Overall) | 205 (45.8%) | 243 (54.2%) |
Employment Industries by Sex in Soda Bay
Employment Industries in Soda Bay
The major employment industries in Soda Bay include Professional & Scientific (124 | 27.7%), Retail Trade (76 | 17.0%), Educational Services (55 | 12.3%), Administrative & Support (43 | 9.6%), and Accommodation & Food Services (40 | 8.9%).
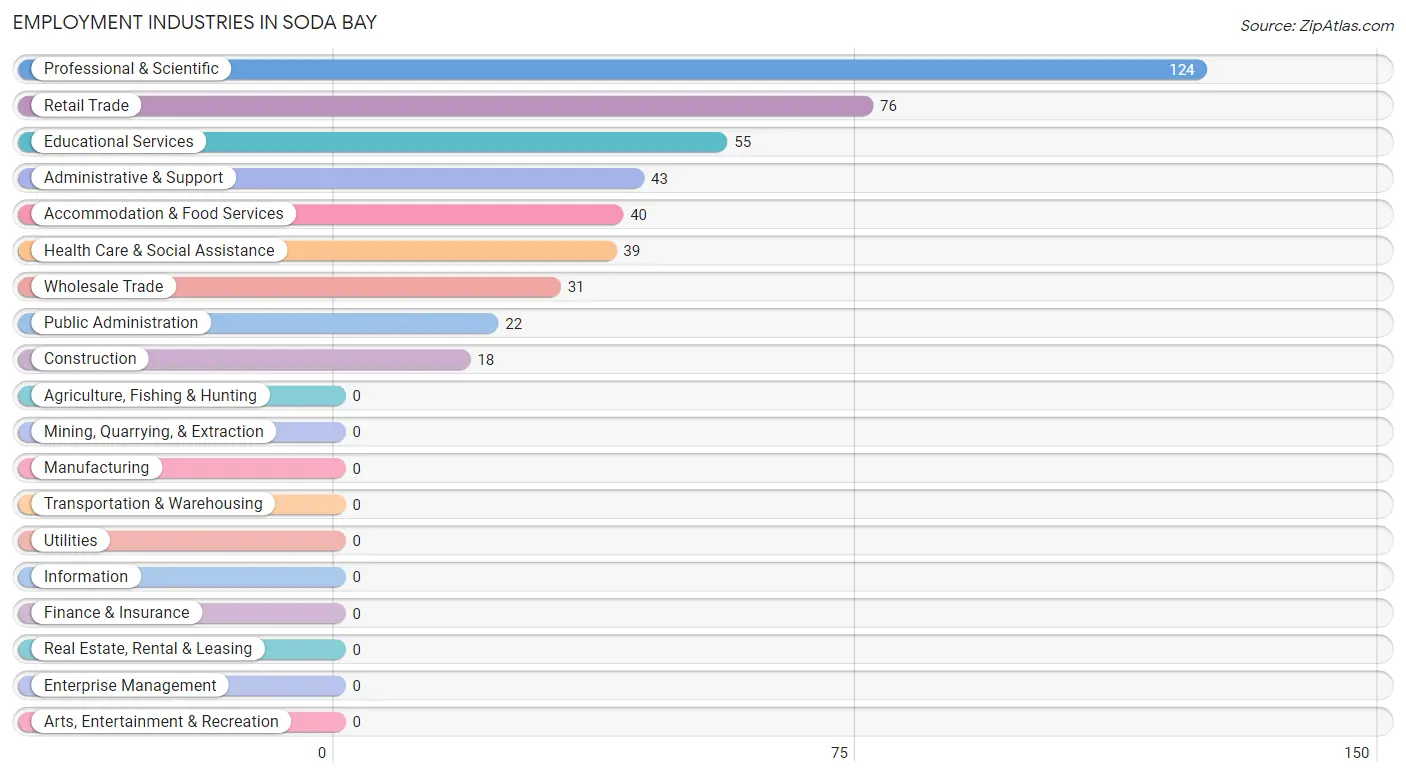
Employment Industries by Sex in Soda Bay
The Soda Bay industries that see more men than women are Construction (100.0%), Wholesale Trade (100.0%), and Public Administration (100.0%), whereas the industries that tend to have a higher number of women are Administrative & Support (100.0%), Accommodation & Food Services (100.0%), and Educational Services (85.5%).
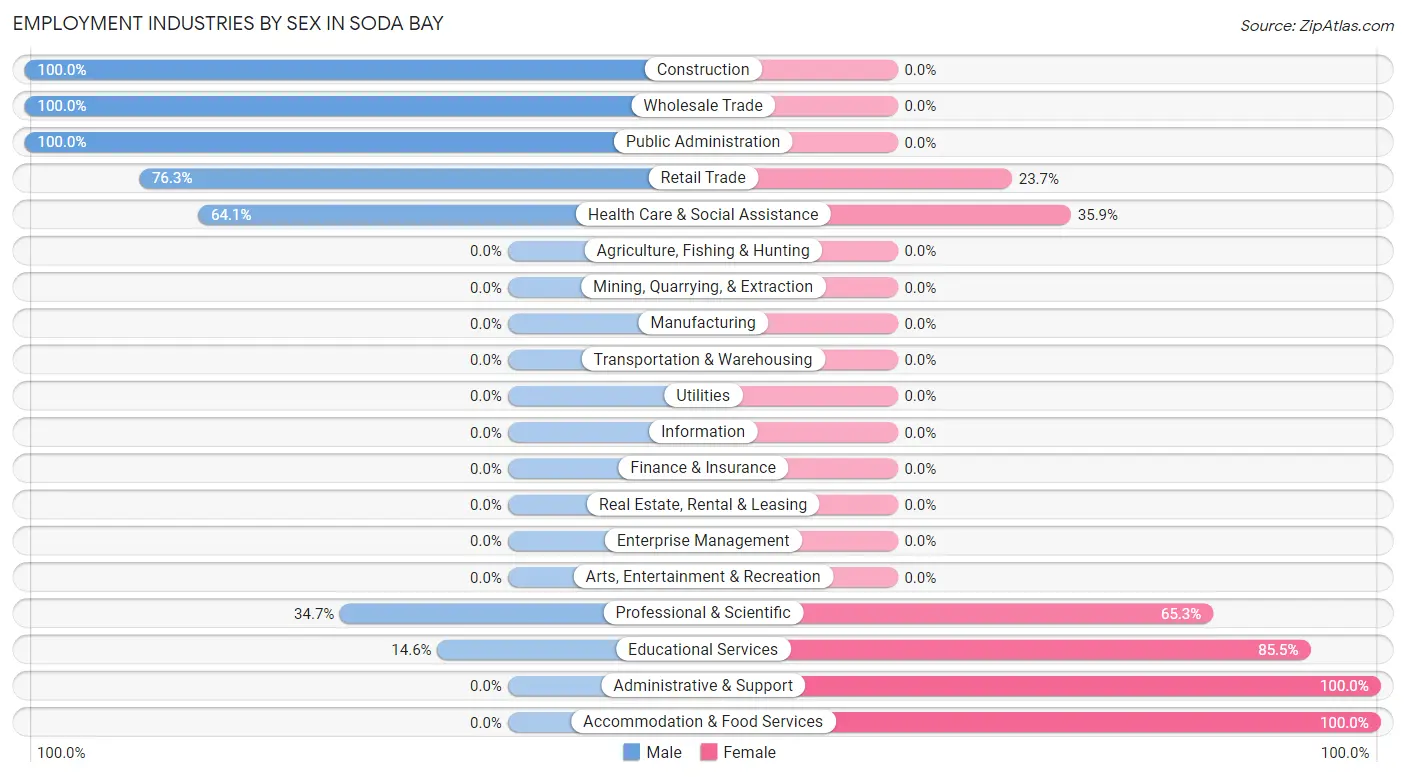
| Industry | Male | Female |
| Agriculture, Fishing & Hunting | 0 (0.0%) | 0 (0.0%) |
| Mining, Quarrying, & Extraction | 0 (0.0%) | 0 (0.0%) |
| Construction | 18 (100.0%) | 0 (0.0%) |
| Manufacturing | 0 (0.0%) | 0 (0.0%) |
| Wholesale Trade | 31 (100.0%) | 0 (0.0%) |
| Retail Trade | 58 (76.3%) | 18 (23.7%) |
| Transportation & Warehousing | 0 (0.0%) | 0 (0.0%) |
| Utilities | 0 (0.0%) | 0 (0.0%) |
| Information | 0 (0.0%) | 0 (0.0%) |
| Finance & Insurance | 0 (0.0%) | 0 (0.0%) |
| Real Estate, Rental & Leasing | 0 (0.0%) | 0 (0.0%) |
| Professional & Scientific | 43 (34.7%) | 81 (65.3%) |
| Enterprise Management | 0 (0.0%) | 0 (0.0%) |
| Administrative & Support | 0 (0.0%) | 43 (100.0%) |
| Educational Services | 8 (14.5%) | 47 (85.5%) |
| Health Care & Social Assistance | 25 (64.1%) | 14 (35.9%) |
| Arts, Entertainment & Recreation | 0 (0.0%) | 0 (0.0%) |
| Accommodation & Food Services | 0 (0.0%) | 40 (100.0%) |
| Public Administration | 22 (100.0%) | 0 (0.0%) |
| Total | 205 (45.8%) | 243 (54.2%) |
Education in Soda Bay
School Enrollment in Soda Bay
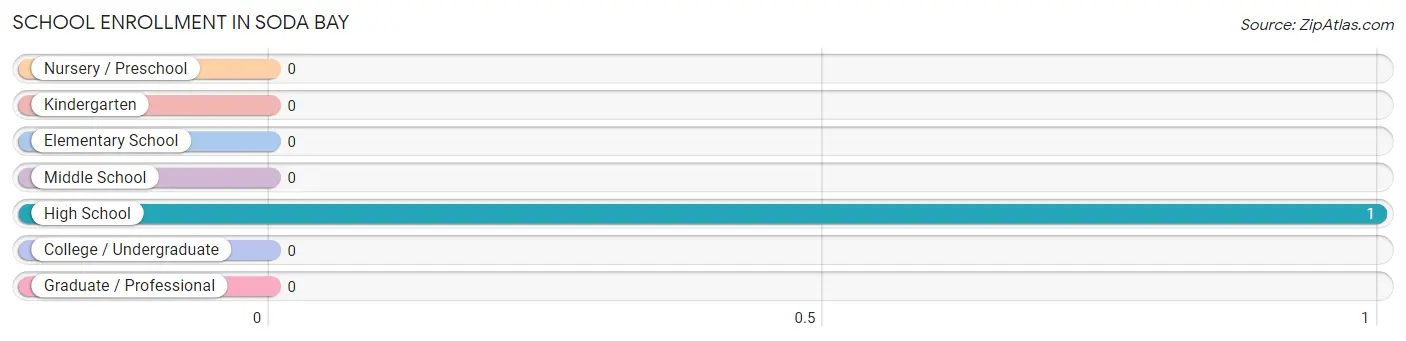
| School Level | # Students | % Students |
| Nursery / Preschool | 0 | 0.0% |
| Kindergarten | 0 | 0.0% |
| Elementary School | 0 | 0.0% |
| Middle School | 0 | 0.0% |
| High School | 1 | 100.0% |
| College / Undergraduate | 0 | 0.0% |
| Graduate / Professional | 0 | 0.0% |
| Total | 1 | 100.0% |
School Enrollment by Age by Funding Source in Soda Bay
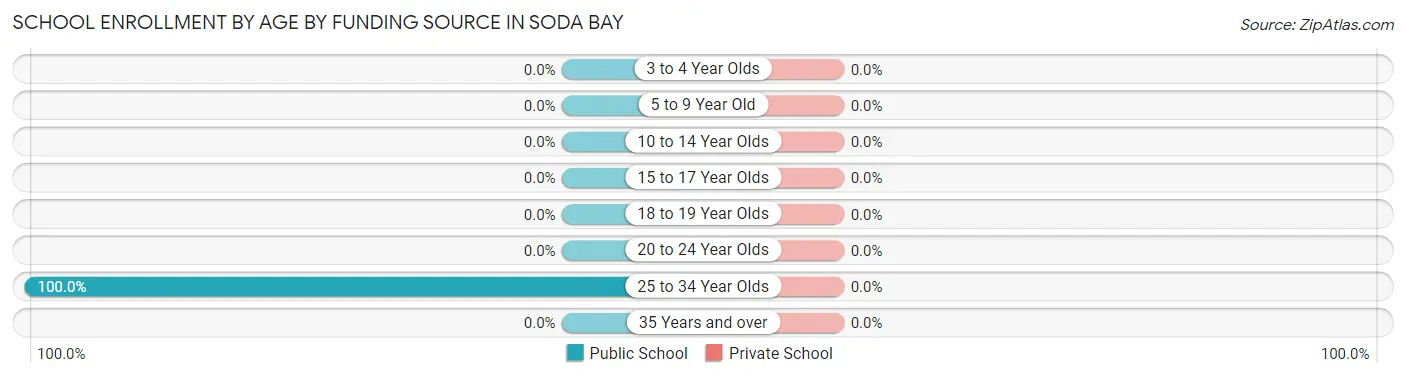
| Age Bracket | Public School | Private School |
| 3 to 4 Year Olds | 0 (0.0%) | 0 (0.0%) |
| 5 to 9 Year Old | 0 (0.0%) | 0 (0.0%) |
| 10 to 14 Year Olds | 0 (0.0%) | 0 (0.0%) |
| 15 to 17 Year Olds | 0 (0.0%) | 0 (0.0%) |
| 18 to 19 Year Olds | 0 (0.0%) | 0 (0.0%) |
| 20 to 24 Year Olds | 0 (0.0%) | 0 (0.0%) |
| 25 to 34 Year Olds | 1 (100.0%) | 0 (0.0%) |
| 35 Years and over | 0 (0.0%) | 0 (0.0%) |
| Total | 1 (100.0%) | 0 (0.0%) |
Educational Attainment by Field of Study in Soda Bay
Education (59 | 25.1%), psychology (51 | 21.7%), literature & languages (44 | 18.7%), social sciences (39 | 16.6%), and engineering (16 | 6.8%) are the most common fields of study among 235 individuals in Soda Bay who have obtained a bachelor's degree or higher.
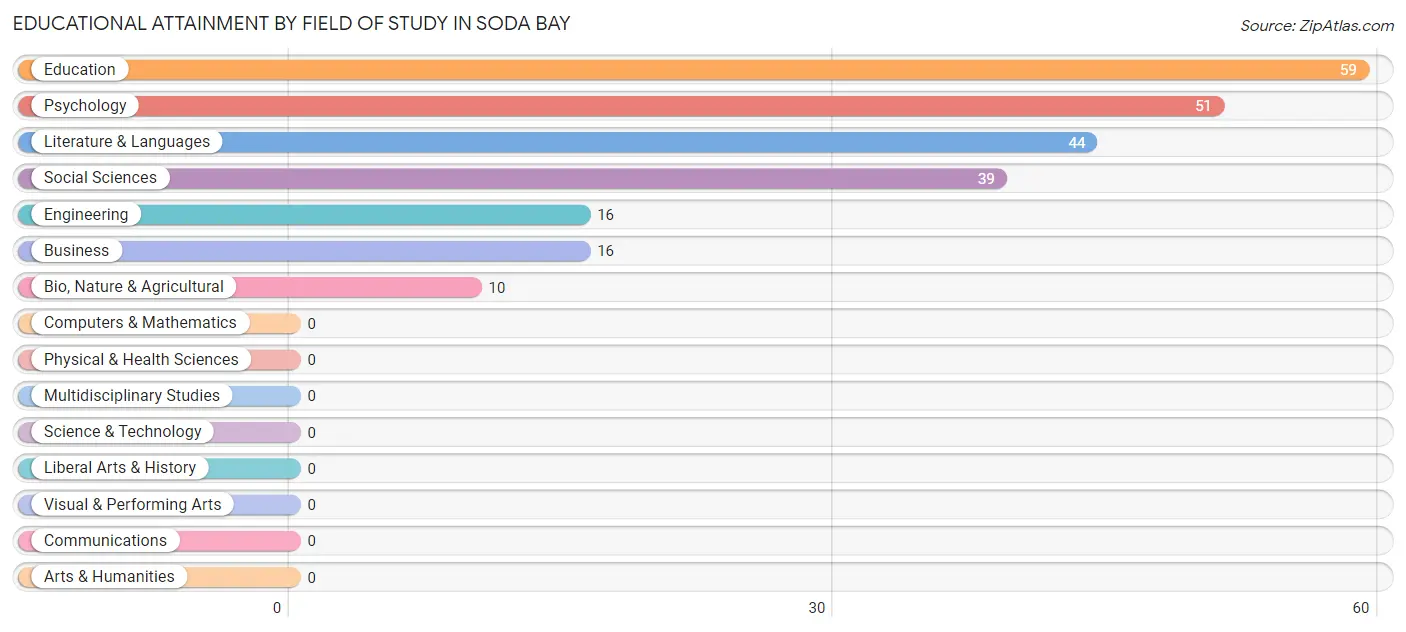
| Field of Study | # Graduates | % Graduates |
| Computers & Mathematics | 0 | 0.0% |
| Bio, Nature & Agricultural | 10 | 4.3% |
| Physical & Health Sciences | 0 | 0.0% |
| Psychology | 51 | 21.7% |
| Social Sciences | 39 | 16.6% |
| Engineering | 16 | 6.8% |
| Multidisciplinary Studies | 0 | 0.0% |
| Science & Technology | 0 | 0.0% |
| Business | 16 | 6.8% |
| Education | 59 | 25.1% |
| Literature & Languages | 44 | 18.7% |
| Liberal Arts & History | 0 | 0.0% |
| Visual & Performing Arts | 0 | 0.0% |
| Communications | 0 | 0.0% |
| Arts & Humanities | 0 | 0.0% |
| Total | 235 | 100.0% |
Transportation & Commute in Soda Bay
Vehicle Availability by Sex in Soda Bay
The most prevalent vehicle ownership categories in Soda Bay are males with 5 or more vehicles (87, accounting for 42.4%) and females with 5 or more vehicles (29, making up 36.1%).
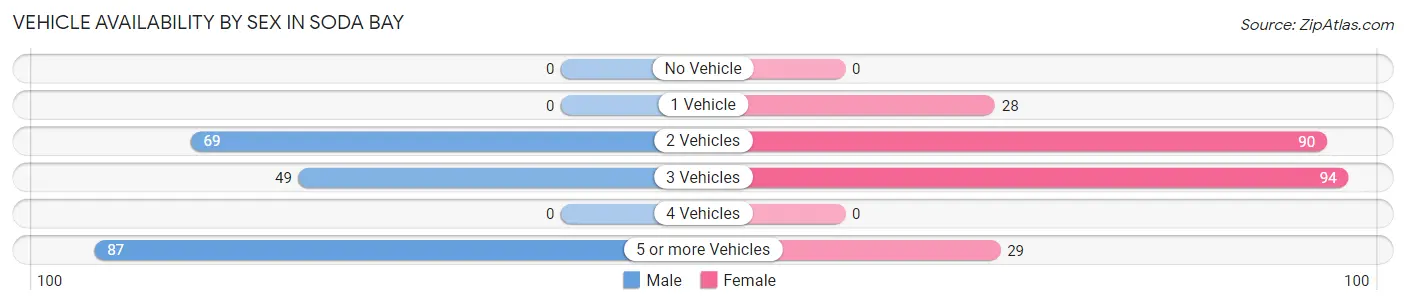
| Vehicles Available | Male | Female |
| No Vehicle | 0 (0.0%) | 0 (0.0%) |
| 1 Vehicle | 0 (0.0%) | 28 (11.6%) |
| 2 Vehicles | 69 (33.7%) | 90 (37.3%) |
| 3 Vehicles | 49 (23.9%) | 94 (39.0%) |
| 4 Vehicles | 0 (0.0%) | 0 (0.0%) |
| 5 or more Vehicles | 87 (42.4%) | 29 (12.0%) |
| Total | 205 (100.0%) | 241 (100.0%) |
Commute Time in Soda Bay
The most frequently occuring commute durations in Soda Bay are 15 to 19 minutes (97 commuters, 23.5%), 25 to 29 minutes (93 commuters, 22.6%), and 35 to 39 minutes (74 commuters, 18.0%).
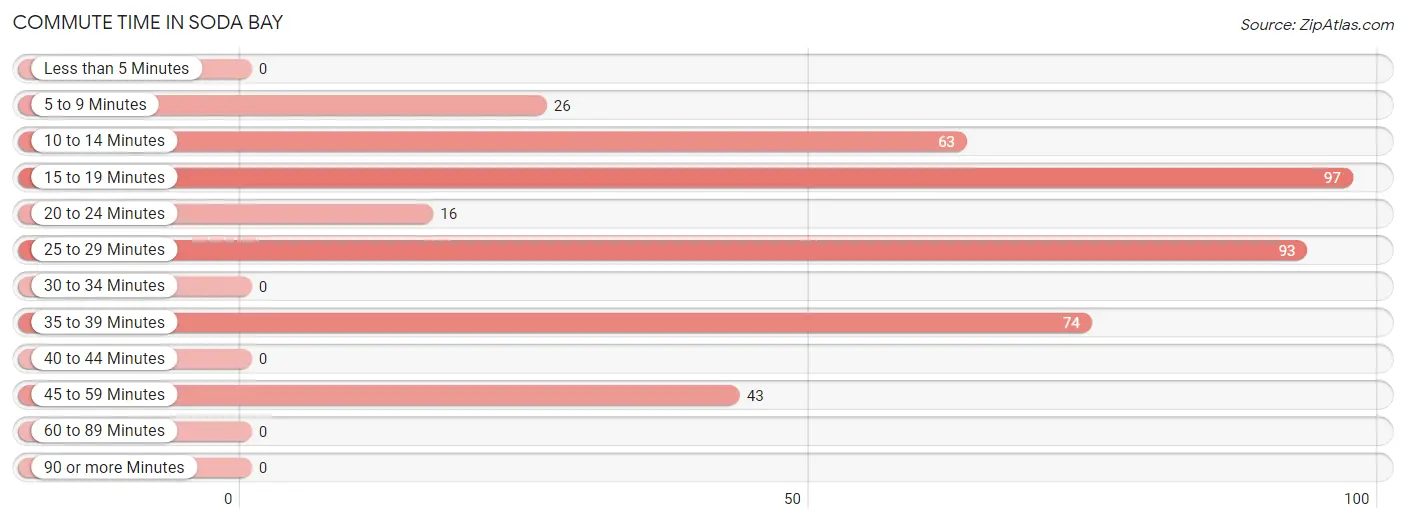
| Commute Time | # Commuters | % Commuters |
| Less than 5 Minutes | 0 | 0.0% |
| 5 to 9 Minutes | 26 | 6.3% |
| 10 to 14 Minutes | 63 | 15.3% |
| 15 to 19 Minutes | 97 | 23.5% |
| 20 to 24 Minutes | 16 | 3.9% |
| 25 to 29 Minutes | 93 | 22.6% |
| 30 to 34 Minutes | 0 | 0.0% |
| 35 to 39 Minutes | 74 | 18.0% |
| 40 to 44 Minutes | 0 | 0.0% |
| 45 to 59 Minutes | 43 | 10.4% |
| 60 to 89 Minutes | 0 | 0.0% |
| 90 or more Minutes | 0 | 0.0% |
Commute Time by Sex in Soda Bay
The most common commute times in Soda Bay are 15 to 19 minutes (67 commuters, 32.7%) for males and 10 to 14 minutes (63 commuters, 30.4%) for females.
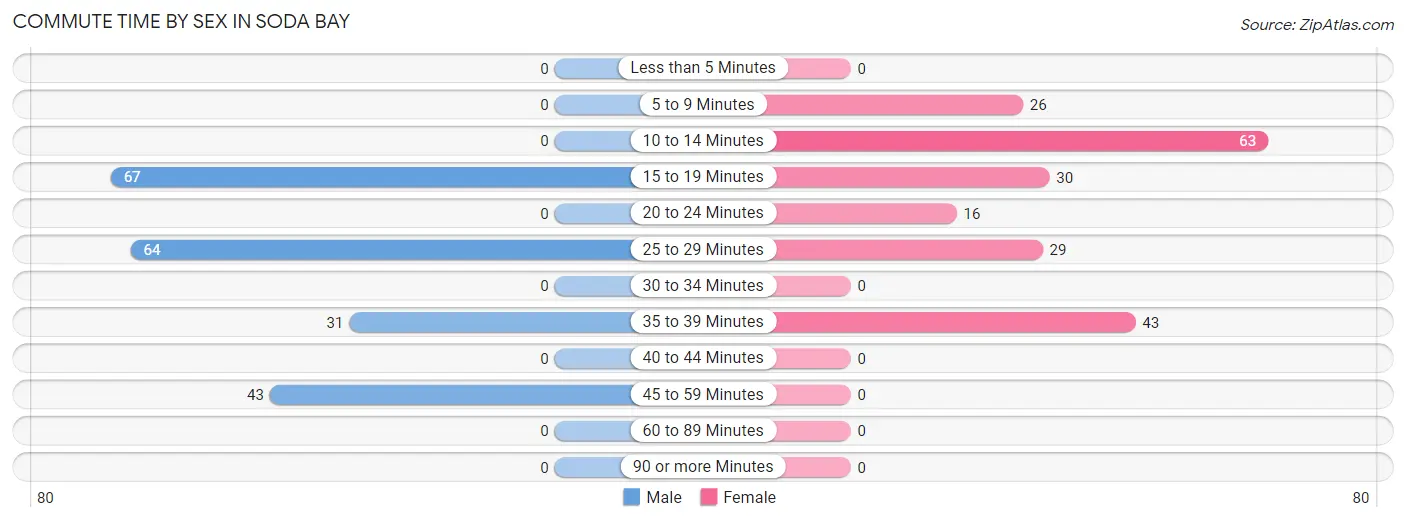
| Commute Time | Male | Female |
| Less than 5 Minutes | 0 (0.0%) | 0 (0.0%) |
| 5 to 9 Minutes | 0 (0.0%) | 26 (12.6%) |
| 10 to 14 Minutes | 0 (0.0%) | 63 (30.4%) |
| 15 to 19 Minutes | 67 (32.7%) | 30 (14.5%) |
| 20 to 24 Minutes | 0 (0.0%) | 16 (7.7%) |
| 25 to 29 Minutes | 64 (31.2%) | 29 (14.0%) |
| 30 to 34 Minutes | 0 (0.0%) | 0 (0.0%) |
| 35 to 39 Minutes | 31 (15.1%) | 43 (20.8%) |
| 40 to 44 Minutes | 0 (0.0%) | 0 (0.0%) |
| 45 to 59 Minutes | 43 (21.0%) | 0 (0.0%) |
| 60 to 89 Minutes | 0 (0.0%) | 0 (0.0%) |
| 90 or more Minutes | 0 (0.0%) | 0 (0.0%) |
Time of Departure to Work by Sex in Soda Bay
The most frequent times of departure to work in Soda Bay are 7:00 AM to 7:29 AM (64, 31.2%) for males and 5:30 AM to 5:59 AM (63, 30.4%) for females.
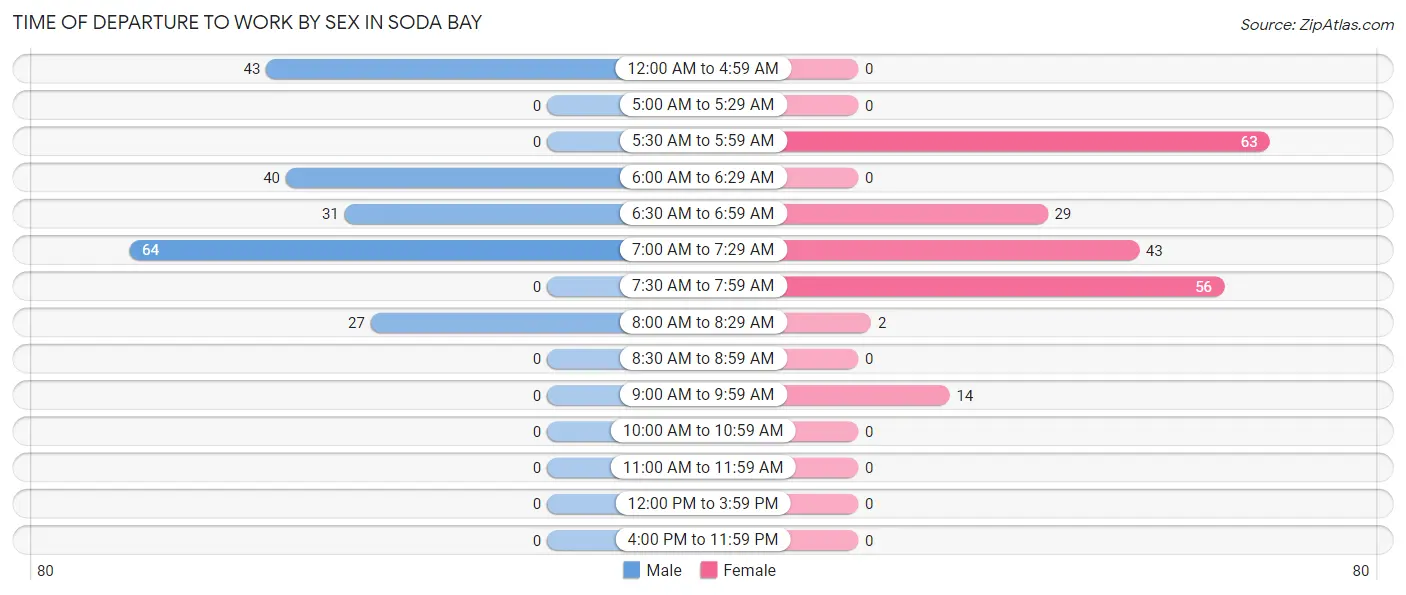
| Time of Departure | Male | Female |
| 12:00 AM to 4:59 AM | 43 (21.0%) | 0 (0.0%) |
| 5:00 AM to 5:29 AM | 0 (0.0%) | 0 (0.0%) |
| 5:30 AM to 5:59 AM | 0 (0.0%) | 63 (30.4%) |
| 6:00 AM to 6:29 AM | 40 (19.5%) | 0 (0.0%) |
| 6:30 AM to 6:59 AM | 31 (15.1%) | 29 (14.0%) |
| 7:00 AM to 7:29 AM | 64 (31.2%) | 43 (20.8%) |
| 7:30 AM to 7:59 AM | 0 (0.0%) | 56 (27.1%) |
| 8:00 AM to 8:29 AM | 27 (13.2%) | 2 (1.0%) |
| 8:30 AM to 8:59 AM | 0 (0.0%) | 0 (0.0%) |
| 9:00 AM to 9:59 AM | 0 (0.0%) | 14 (6.8%) |
| 10:00 AM to 10:59 AM | 0 (0.0%) | 0 (0.0%) |
| 11:00 AM to 11:59 AM | 0 (0.0%) | 0 (0.0%) |
| 12:00 PM to 3:59 PM | 0 (0.0%) | 0 (0.0%) |
| 4:00 PM to 11:59 PM | 0 (0.0%) | 0 (0.0%) |
| Total | 205 (100.0%) | 207 (100.0%) |
Housing Occupancy in Soda Bay
Occupancy by Ownership in Soda Bay
Of the total 359 dwellings in Soda Bay, owner-occupied units account for 327 (91.1%), while renter-occupied units make up 32 (8.9%).
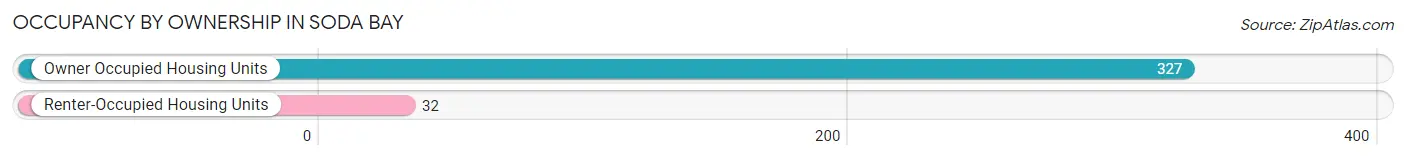
| Occupancy | # Housing Units | % Housing Units |
| Owner Occupied Housing Units | 327 | 91.1% |
| Renter-Occupied Housing Units | 32 | 8.9% |
| Total Occupied Housing Units | 359 | 100.0% |
Occupancy by Household Size in Soda Bay
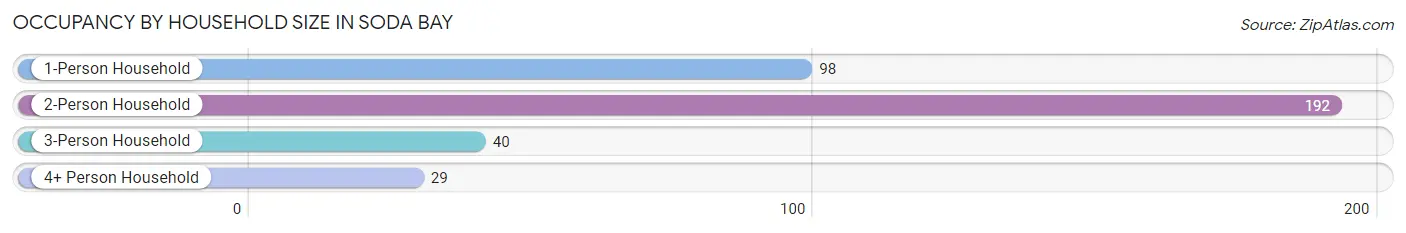
| Household Size | # Housing Units | % Housing Units |
| 1-Person Household | 98 | 27.3% |
| 2-Person Household | 192 | 53.5% |
| 3-Person Household | 40 | 11.1% |
| 4+ Person Household | 29 | 8.1% |
| Total Housing Units | 359 | 100.0% |
Occupancy by Ownership by Household Size in Soda Bay
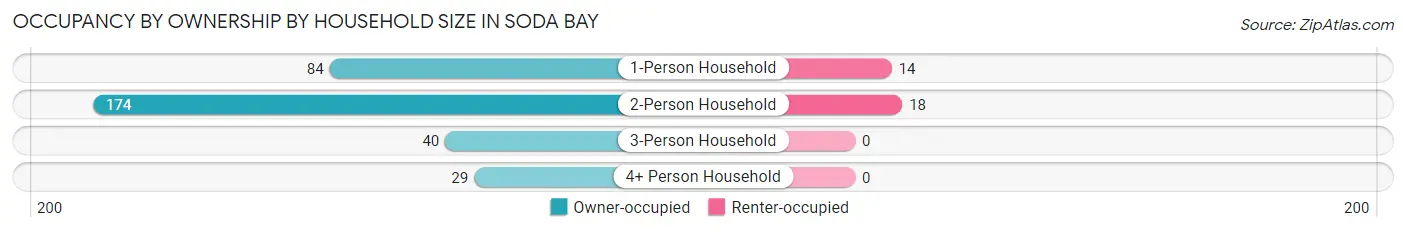
| Household Size | Owner-occupied | Renter-occupied |
| 1-Person Household | 84 (85.7%) | 14 (14.3%) |
| 2-Person Household | 174 (90.6%) | 18 (9.4%) |
| 3-Person Household | 40 (100.0%) | 0 (0.0%) |
| 4+ Person Household | 29 (100.0%) | 0 (0.0%) |
| Total Housing Units | 327 (91.1%) | 32 (8.9%) |
Occupancy by Educational Attainment in Soda Bay
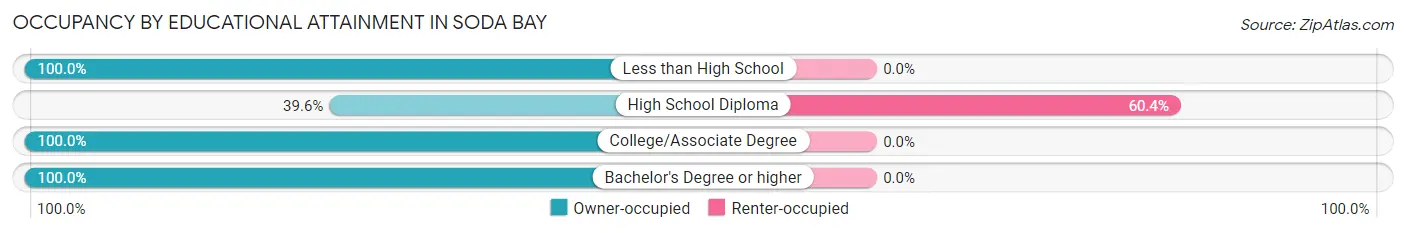
| Household Size | Owner-occupied | Renter-occupied |
| Less than High School | 18 (100.0%) | 0 (0.0%) |
| High School Diploma | 21 (39.6%) | 32 (60.4%) |
| College/Associate Degree | 197 (100.0%) | 0 (0.0%) |
| Bachelor's Degree or higher | 91 (100.0%) | 0 (0.0%) |
Occupancy by Age of Householder in Soda Bay
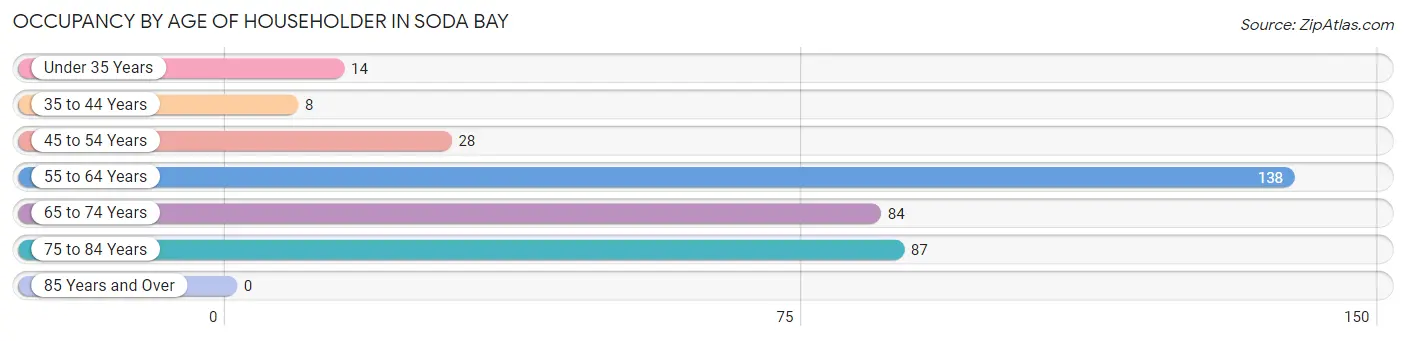
| Age Bracket | # Households | % Households |
| Under 35 Years | 14 | 3.9% |
| 35 to 44 Years | 8 | 2.2% |
| 45 to 54 Years | 28 | 7.8% |
| 55 to 64 Years | 138 | 38.4% |
| 65 to 74 Years | 84 | 23.4% |
| 75 to 84 Years | 87 | 24.2% |
| 85 Years and Over | 0 | 0.0% |
| Total | 359 | 100.0% |
Housing Finances in Soda Bay
Median Income by Occupancy in Soda Bay
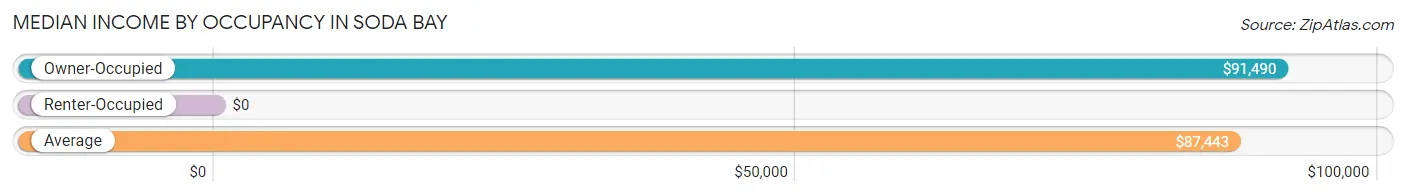
| Occupancy Type | # Households | Median Income |
| Owner-Occupied | 327 (91.1%) | $91,490 |
| Renter-Occupied | 32 (8.9%) | $0 |
| Average | 359 (100.0%) | $87,443 |
Occupancy by Householder Income Bracket in Soda Bay
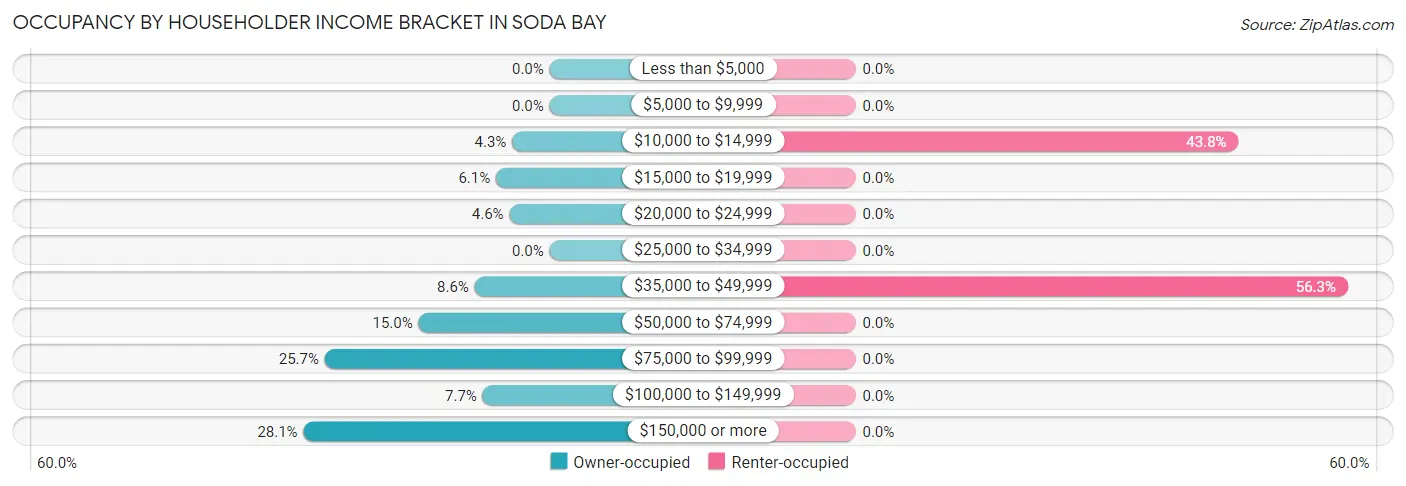
| Income Bracket | Owner-occupied | Renter-occupied |
| Less than $5,000 | 0 (0.0%) | 0 (0.0%) |
| $5,000 to $9,999 | 0 (0.0%) | 0 (0.0%) |
| $10,000 to $14,999 | 14 (4.3%) | 14 (43.8%) |
| $15,000 to $19,999 | 20 (6.1%) | 0 (0.0%) |
| $20,000 to $24,999 | 15 (4.6%) | 0 (0.0%) |
| $25,000 to $34,999 | 0 (0.0%) | 0 (0.0%) |
| $35,000 to $49,999 | 28 (8.6%) | 18 (56.2%) |
| $50,000 to $74,999 | 49 (15.0%) | 0 (0.0%) |
| $75,000 to $99,999 | 84 (25.7%) | 0 (0.0%) |
| $100,000 to $149,999 | 25 (7.6%) | 0 (0.0%) |
| $150,000 or more | 92 (28.1%) | 0 (0.0%) |
| Total | 327 (100.0%) | 32 (100.0%) |
Monthly Housing Cost Tiers in Soda Bay
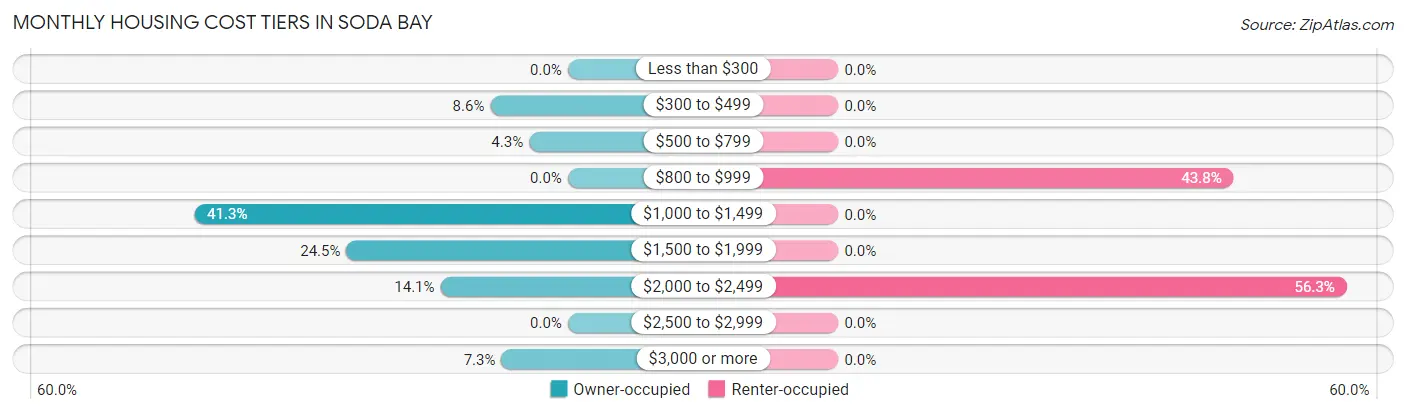
| Monthly Cost | Owner-occupied | Renter-occupied |
| Less than $300 | 0 (0.0%) | 0 (0.0%) |
| $300 to $499 | 28 (8.6%) | 0 (0.0%) |
| $500 to $799 | 14 (4.3%) | 0 (0.0%) |
| $800 to $999 | 0 (0.0%) | 14 (43.8%) |
| $1,000 to $1,499 | 135 (41.3%) | 0 (0.0%) |
| $1,500 to $1,999 | 80 (24.5%) | 0 (0.0%) |
| $2,000 to $2,499 | 46 (14.1%) | 18 (56.2%) |
| $2,500 to $2,999 | 0 (0.0%) | 0 (0.0%) |
| $3,000 or more | 24 (7.3%) | 0 (0.0%) |
| Total | 327 (100.0%) | 32 (100.0%) |
Physical Housing Characteristics in Soda Bay
Housing Structures in Soda Bay
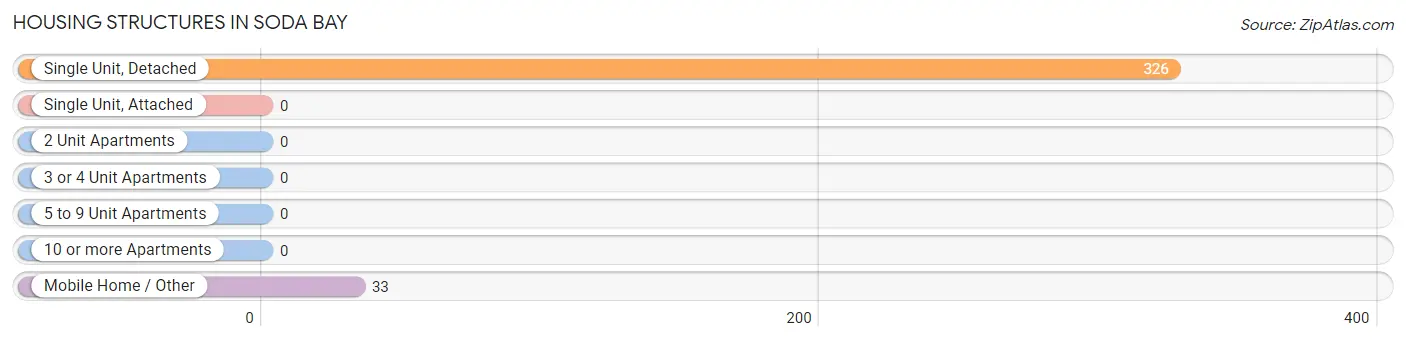
| Structure Type | # Housing Units | % Housing Units |
| Single Unit, Detached | 326 | 90.8% |
| Single Unit, Attached | 0 | 0.0% |
| 2 Unit Apartments | 0 | 0.0% |
| 3 or 4 Unit Apartments | 0 | 0.0% |
| 5 to 9 Unit Apartments | 0 | 0.0% |
| 10 or more Apartments | 0 | 0.0% |
| Mobile Home / Other | 33 | 9.2% |
| Total | 359 | 100.0% |
Housing Structures by Occupancy in Soda Bay
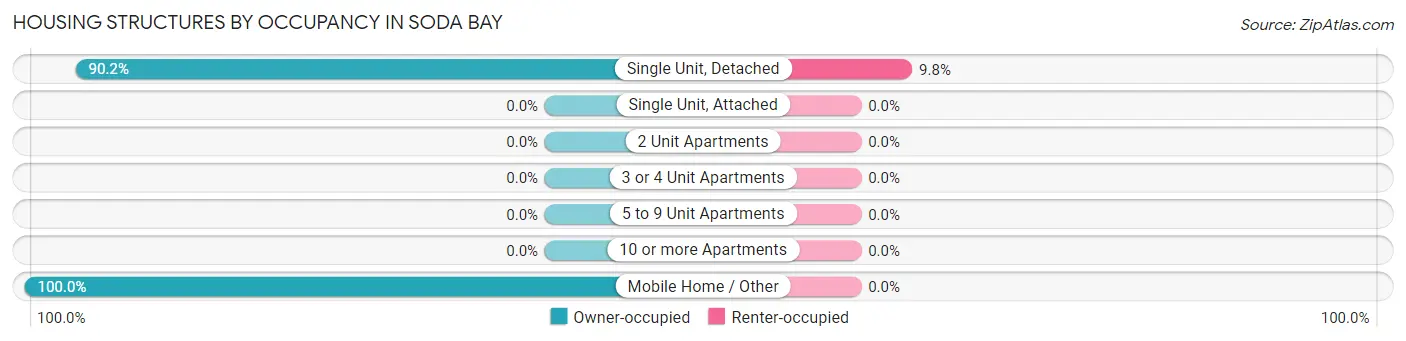
| Structure Type | Owner-occupied | Renter-occupied |
| Single Unit, Detached | 294 (90.2%) | 32 (9.8%) |
| Single Unit, Attached | 0 (0.0%) | 0 (0.0%) |
| 2 Unit Apartments | 0 (0.0%) | 0 (0.0%) |
| 3 or 4 Unit Apartments | 0 (0.0%) | 0 (0.0%) |
| 5 to 9 Unit Apartments | 0 (0.0%) | 0 (0.0%) |
| 10 or more Apartments | 0 (0.0%) | 0 (0.0%) |
| Mobile Home / Other | 33 (100.0%) | 0 (0.0%) |
| Total | 327 (91.1%) | 32 (8.9%) |
Housing Structures by Number of Rooms in Soda Bay
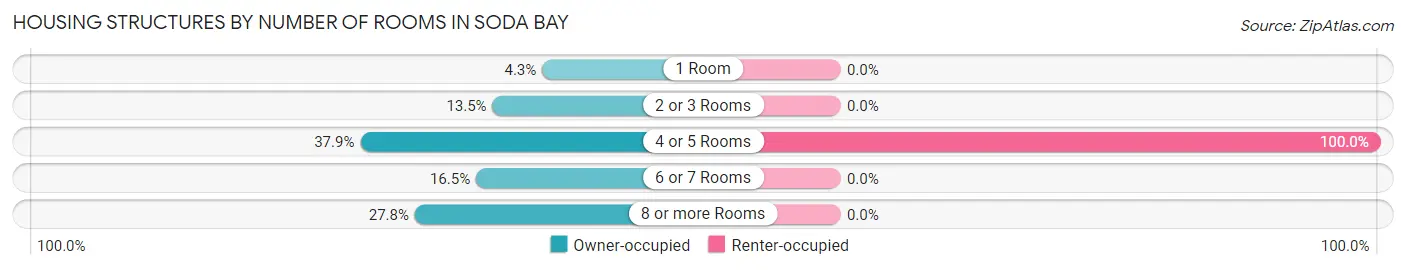
| Number of Rooms | Owner-occupied | Renter-occupied |
| 1 Room | 14 (4.3%) | 0 (0.0%) |
| 2 or 3 Rooms | 44 (13.5%) | 0 (0.0%) |
| 4 or 5 Rooms | 124 (37.9%) | 32 (100.0%) |
| 6 or 7 Rooms | 54 (16.5%) | 0 (0.0%) |
| 8 or more Rooms | 91 (27.8%) | 0 (0.0%) |
| Total | 327 (100.0%) | 32 (100.0%) |
Housing Structure by Heating Type in Soda Bay
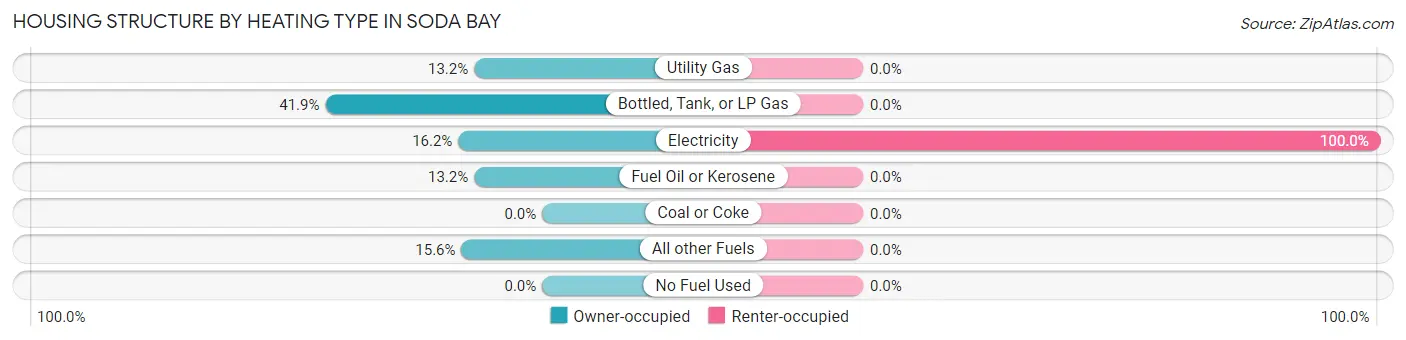
| Heating Type | Owner-occupied | Renter-occupied |
| Utility Gas | 43 (13.2%) | 0 (0.0%) |
| Bottled, Tank, or LP Gas | 137 (41.9%) | 0 (0.0%) |
| Electricity | 53 (16.2%) | 32 (100.0%) |
| Fuel Oil or Kerosene | 43 (13.2%) | 0 (0.0%) |
| Coal or Coke | 0 (0.0%) | 0 (0.0%) |
| All other Fuels | 51 (15.6%) | 0 (0.0%) |
| No Fuel Used | 0 (0.0%) | 0 (0.0%) |
| Total | 327 (100.0%) | 32 (100.0%) |
Household Vehicle Usage in Soda Bay
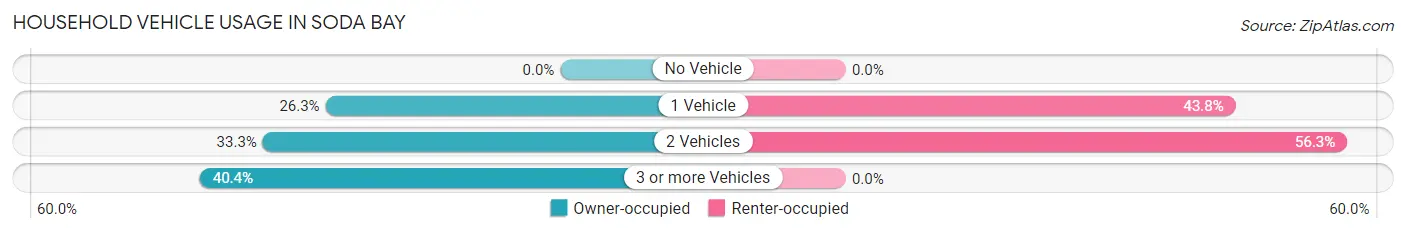
| Vehicles per Household | Owner-occupied | Renter-occupied |
| No Vehicle | 0 (0.0%) | 0 (0.0%) |
| 1 Vehicle | 86 (26.3%) | 14 (43.8%) |
| 2 Vehicles | 109 (33.3%) | 18 (56.2%) |
| 3 or more Vehicles | 132 (40.4%) | 0 (0.0%) |
| Total | 327 (100.0%) | 32 (100.0%) |
Real Estate & Mortgages in Soda Bay
Real Estate and Mortgage Overview in Soda Bay
| Characteristic | Without Mortgage | With Mortgage |
| Housing Units | 138 | 189 |
| Median Property Value | $225,000 | $390,000 |
| Median Household Income | $90,385 | $45 |
| Monthly Housing Costs | $1,135 | $24 |
| Real Estate Taxes | $2,311 | $0 |
Property Value by Mortgage Status in Soda Bay
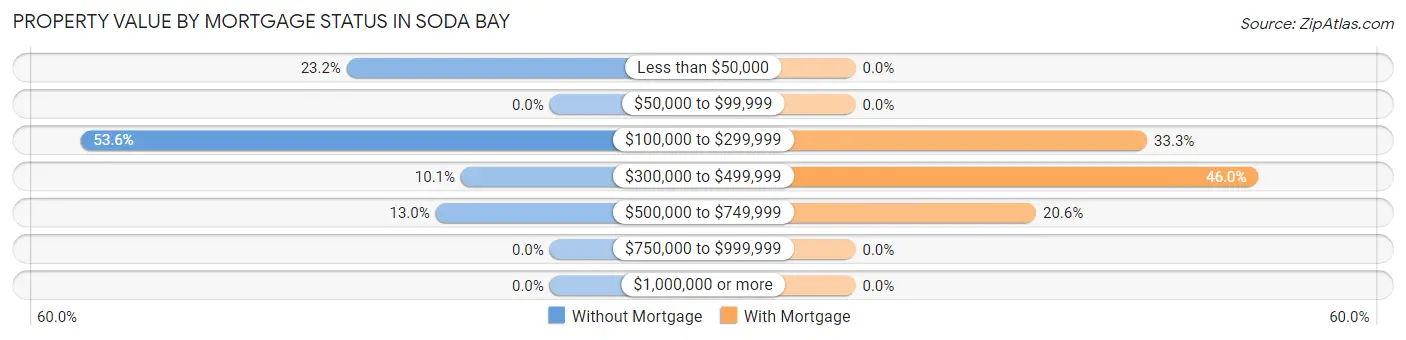
| Property Value | Without Mortgage | With Mortgage |
| Less than $50,000 | 32 (23.2%) | 0 (0.0%) |
| $50,000 to $99,999 | 0 (0.0%) | 0 (0.0%) |
| $100,000 to $299,999 | 74 (53.6%) | 63 (33.3%) |
| $300,000 to $499,999 | 14 (10.1%) | 87 (46.0%) |
| $500,000 to $749,999 | 18 (13.0%) | 39 (20.6%) |
| $750,000 to $999,999 | 0 (0.0%) | 0 (0.0%) |
| $1,000,000 or more | 0 (0.0%) | 0 (0.0%) |
| Total | 138 (100.0%) | 189 (100.0%) |
Household Income by Mortgage Status in Soda Bay
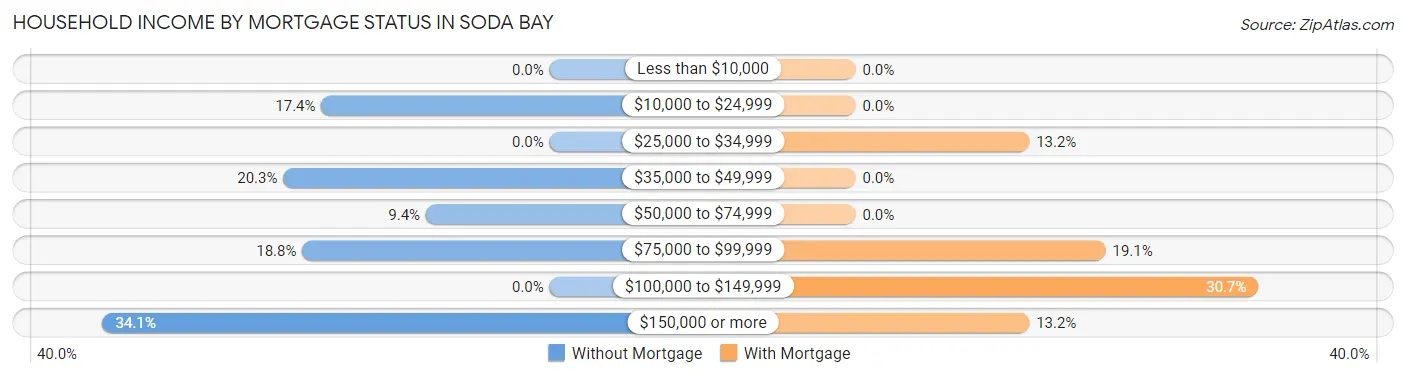
| Household Income | Without Mortgage | With Mortgage |
| Less than $10,000 | 0 (0.0%) | 0 (0.0%) |
| $10,000 to $24,999 | 24 (17.4%) | 0 (0.0%) |
| $25,000 to $34,999 | 0 (0.0%) | 25 (13.2%) |
| $35,000 to $49,999 | 28 (20.3%) | 0 (0.0%) |
| $50,000 to $74,999 | 13 (9.4%) | 0 (0.0%) |
| $75,000 to $99,999 | 26 (18.8%) | 36 (19.1%) |
| $100,000 to $149,999 | 0 (0.0%) | 58 (30.7%) |
| $150,000 or more | 47 (34.1%) | 25 (13.2%) |
| Total | 138 (100.0%) | 189 (100.0%) |
Property Value to Household Income Ratio in Soda Bay
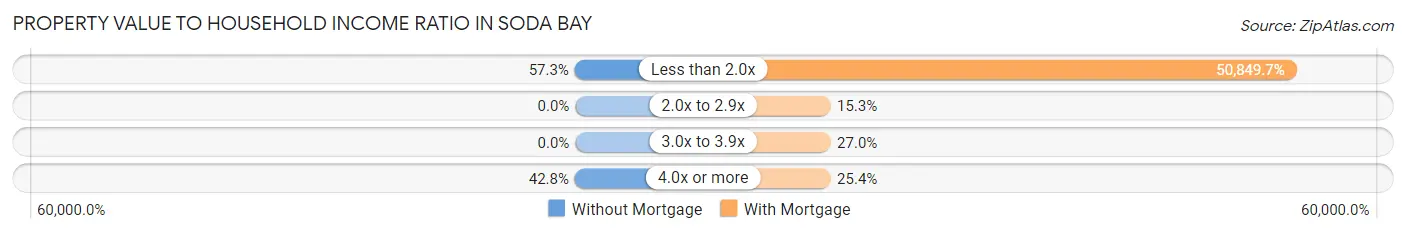
| Value-to-Income Ratio | Without Mortgage | With Mortgage |
| Less than 2.0x | 79 (57.3%) | 96,106 (50,849.7%) |
| 2.0x to 2.9x | 0 (0.0%) | 29 (15.3%) |
| 3.0x to 3.9x | 0 (0.0%) | 51 (27.0%) |
| 4.0x or more | 59 (42.7%) | 48 (25.4%) |
| Total | 138 (100.0%) | 189 (100.0%) |
Real Estate Taxes by Mortgage Status in Soda Bay
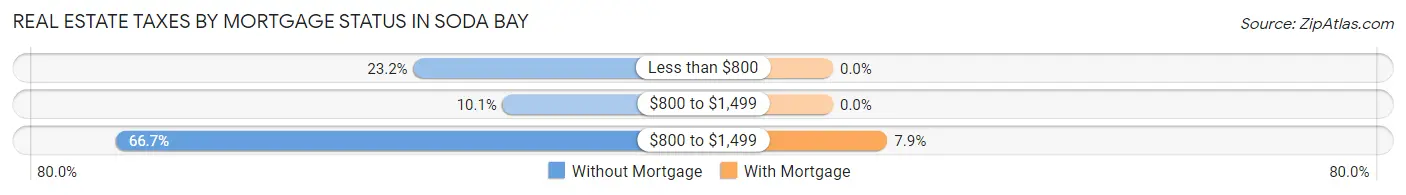
| Property Taxes | Without Mortgage | With Mortgage |
| Less than $800 | 32 (23.2%) | 0 (0.0%) |
| $800 to $1,499 | 14 (10.1%) | 0 (0.0%) |
| $800 to $1,499 | 92 (66.7%) | 15 (7.9%) |
| Total | 138 (100.0%) | 189 (100.0%) |
Health & Disability in Soda Bay
Health Insurance Coverage by Age in Soda Bay
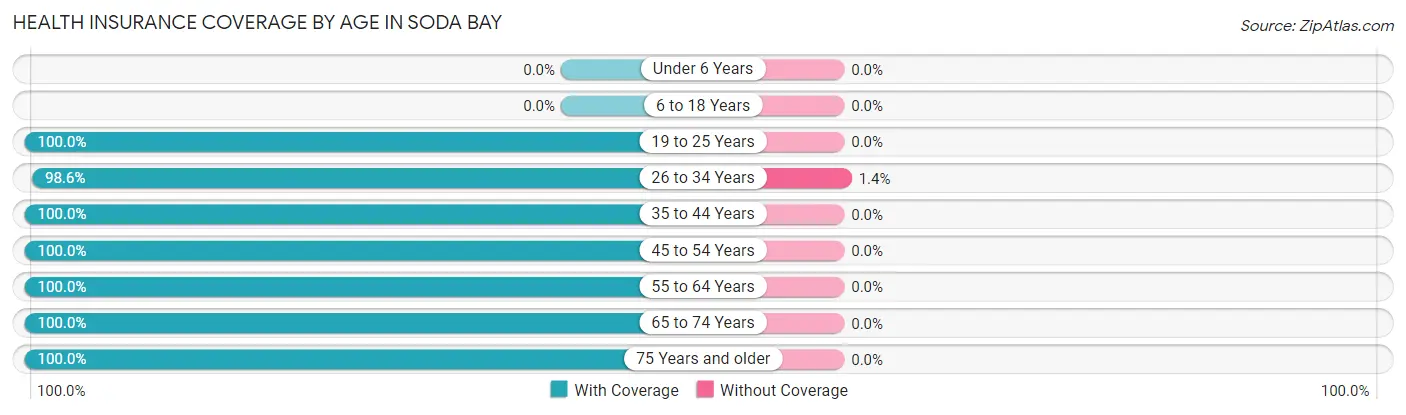
| Age Bracket | With Coverage | Without Coverage |
| Under 6 Years | 0 (0.0%) | 0 (0.0%) |
| 6 to 18 Years | 0 (0.0%) | 0 (0.0%) |
| 19 to 25 Years | 87 (100.0%) | 0 (0.0%) |
| 26 to 34 Years | 71 (98.6%) | 1 (1.4%) |
| 35 to 44 Years | 8 (100.0%) | 0 (0.0%) |
| 45 to 54 Years | 93 (100.0%) | 0 (0.0%) |
| 55 to 64 Years | 224 (100.0%) | 0 (0.0%) |
| 65 to 74 Years | 163 (100.0%) | 0 (0.0%) |
| 75 Years and older | 112 (100.0%) | 0 (0.0%) |
| Total | 758 (99.9%) | 1 (0.1%) |
Health Insurance Coverage by Citizenship Status in Soda Bay
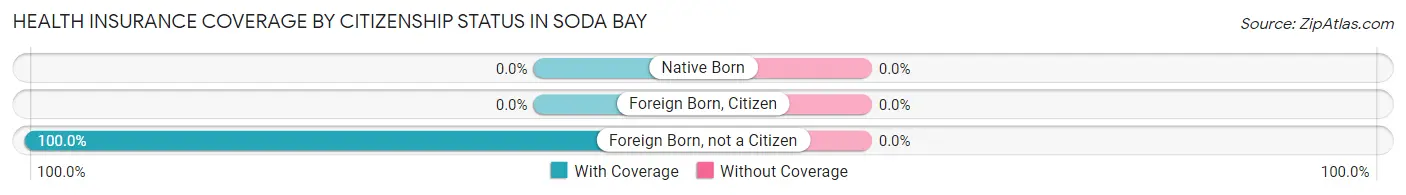
| Citizenship Status | With Coverage | Without Coverage |
| Native Born | 0 (0.0%) | 0 (0.0%) |
| Foreign Born, Citizen | 0 (0.0%) | 0 (0.0%) |
| Foreign Born, not a Citizen | 87 (100.0%) | 0 (0.0%) |
Health Insurance Coverage by Household Income in Soda Bay
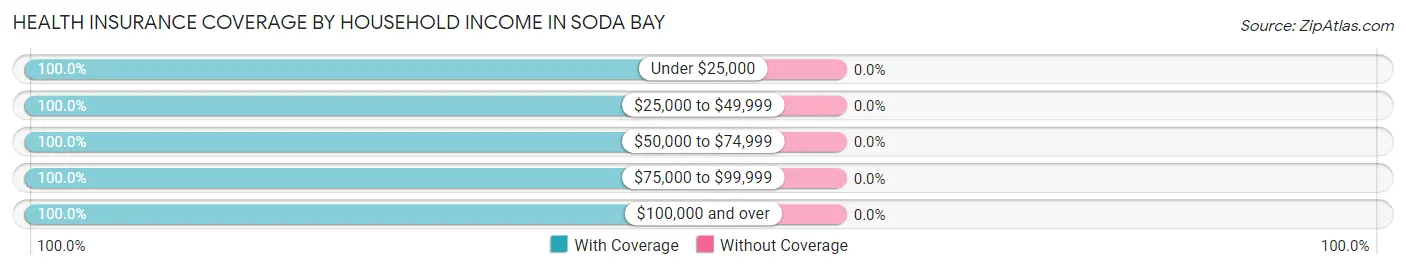
| Household Income | With Coverage | Without Coverage |
| Under $25,000 | 73 (100.0%) | 0 (0.0%) |
| $25,000 to $49,999 | 69 (100.0%) | 0 (0.0%) |
| $50,000 to $74,999 | 132 (100.0%) | 0 (0.0%) |
| $75,000 to $99,999 | 199 (100.0%) | 0 (0.0%) |
| $100,000 and over | 280 (100.0%) | 0 (0.0%) |
Public vs Private Health Insurance Coverage by Age in Soda Bay
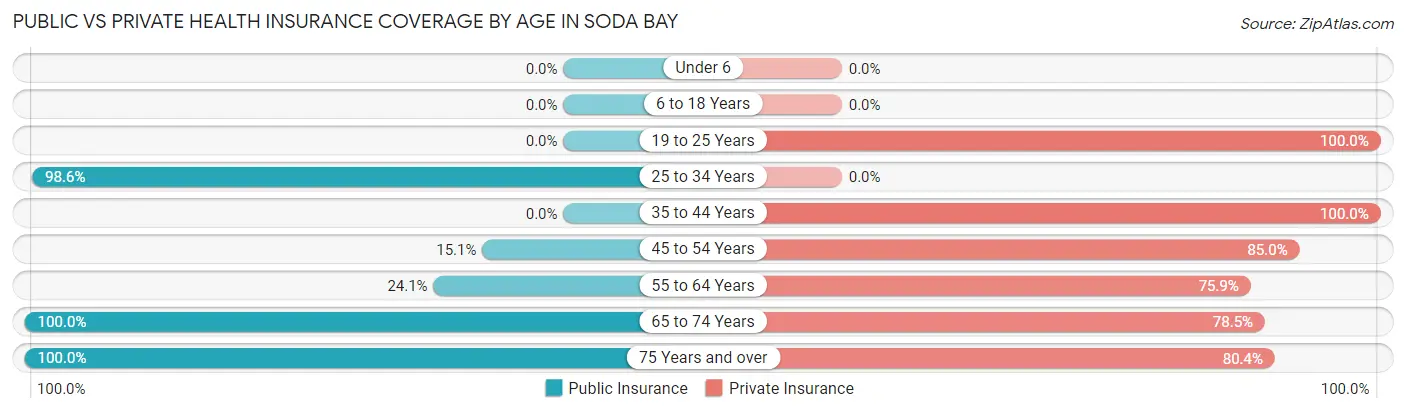
| Age Bracket | Public Insurance | Private Insurance |
| Under 6 | 0 (0.0%) | 0 (0.0%) |
| 6 to 18 Years | 0 (0.0%) | 0 (0.0%) |
| 19 to 25 Years | 0 (0.0%) | 87 (100.0%) |
| 25 to 34 Years | 71 (98.6%) | 0 (0.0%) |
| 35 to 44 Years | 0 (0.0%) | 8 (100.0%) |
| 45 to 54 Years | 14 (15.0%) | 79 (85.0%) |
| 55 to 64 Years | 54 (24.1%) | 170 (75.9%) |
| 65 to 74 Years | 163 (100.0%) | 128 (78.5%) |
| 75 Years and over | 112 (100.0%) | 90 (80.4%) |
| Total | 414 (54.5%) | 562 (74.0%) |
Disability Status by Sex by Age in Soda Bay
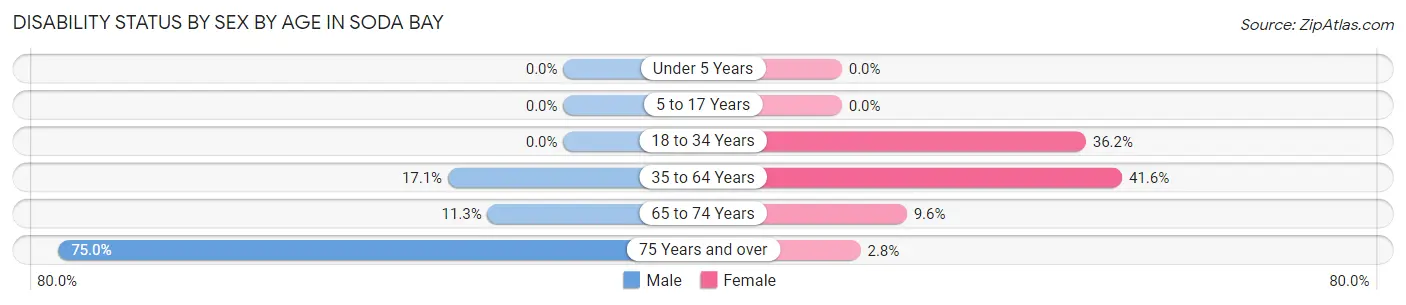
| Age Bracket | Male | Female |
| Under 5 Years | 0 (0.0%) | 0 (0.0%) |
| 5 to 17 Years | 0 (0.0%) | 0 (0.0%) |
| 18 to 34 Years | 0 (0.0%) | 25 (36.2%) |
| 35 to 64 Years | 24 (17.1%) | 77 (41.6%) |
| 65 to 74 Years | 9 (11.3%) | 8 (9.6%) |
| 75 Years and over | 30 (75.0%) | 2 (2.8%) |
Disability Class by Sex by Age in Soda Bay
Disability Class: Hearing Difficulty
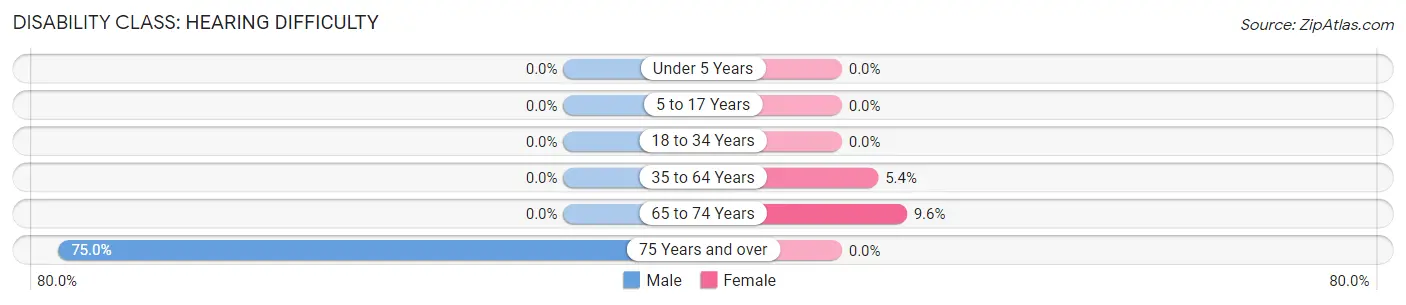
| Age Bracket | Male | Female |
| Under 5 Years | 0 (0.0%) | 0 (0.0%) |
| 5 to 17 Years | 0 (0.0%) | 0 (0.0%) |
| 18 to 34 Years | 0 (0.0%) | 0 (0.0%) |
| 35 to 64 Years | 0 (0.0%) | 10 (5.4%) |
| 65 to 74 Years | 0 (0.0%) | 8 (9.6%) |
| 75 Years and over | 30 (75.0%) | 0 (0.0%) |
Disability Class: Vision Difficulty
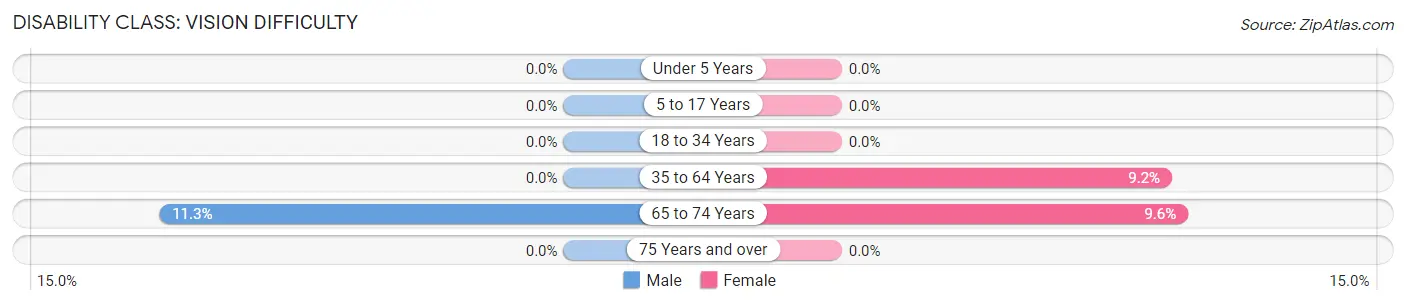
| Age Bracket | Male | Female |
| Under 5 Years | 0 (0.0%) | 0 (0.0%) |
| 5 to 17 Years | 0 (0.0%) | 0 (0.0%) |
| 18 to 34 Years | 0 (0.0%) | 0 (0.0%) |
| 35 to 64 Years | 0 (0.0%) | 17 (9.2%) |
| 65 to 74 Years | 9 (11.3%) | 8 (9.6%) |
| 75 Years and over | 0 (0.0%) | 0 (0.0%) |
Disability Class: Cognitive Difficulty
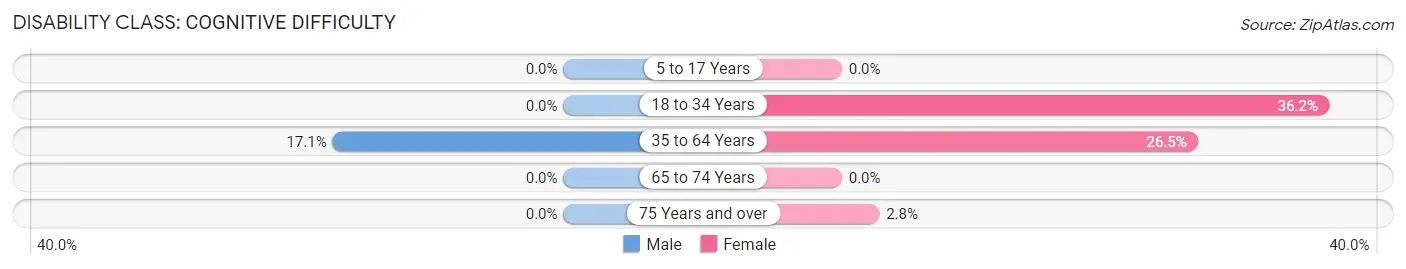
| Age Bracket | Male | Female |
| 5 to 17 Years | 0 (0.0%) | 0 (0.0%) |
| 18 to 34 Years | 0 (0.0%) | 25 (36.2%) |
| 35 to 64 Years | 24 (17.1%) | 49 (26.5%) |
| 65 to 74 Years | 0 (0.0%) | 0 (0.0%) |
| 75 Years and over | 0 (0.0%) | 2 (2.8%) |
Disability Class: Ambulatory Difficulty
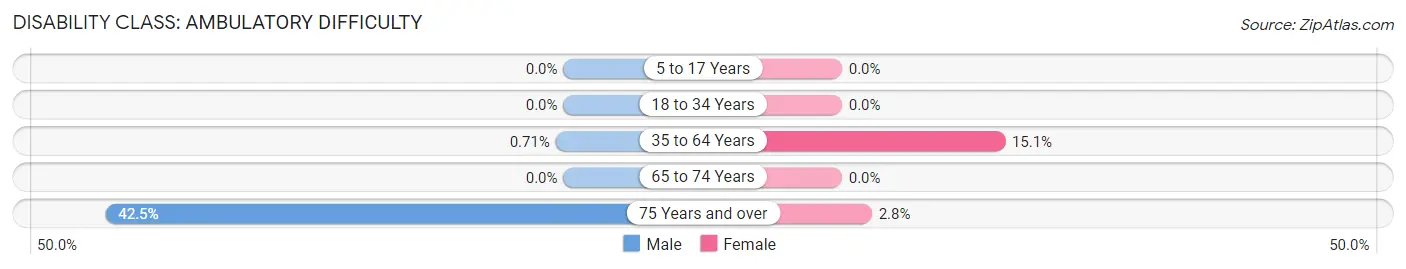
| Age Bracket | Male | Female |
| 5 to 17 Years | 0 (0.0%) | 0 (0.0%) |
| 18 to 34 Years | 0 (0.0%) | 0 (0.0%) |
| 35 to 64 Years | 1 (0.7%) | 28 (15.1%) |
| 65 to 74 Years | 0 (0.0%) | 0 (0.0%) |
| 75 Years and over | 17 (42.5%) | 2 (2.8%) |
Disability Class: Self-Care Difficulty
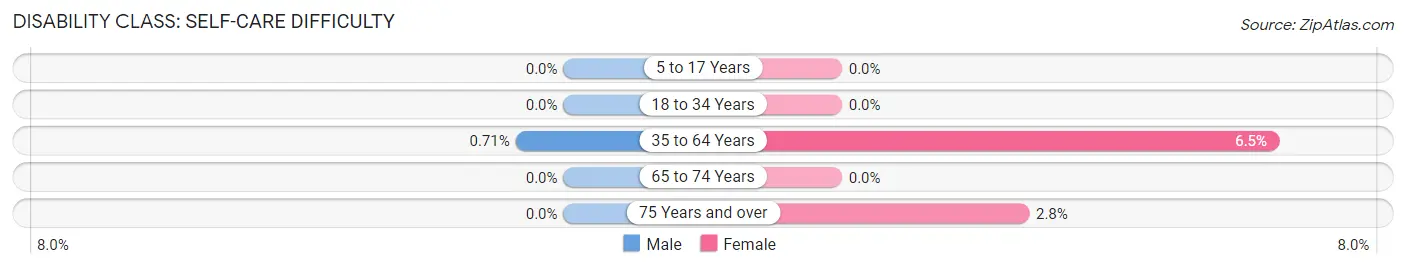
| Age Bracket | Male | Female |
| 5 to 17 Years | 0 (0.0%) | 0 (0.0%) |
| 18 to 34 Years | 0 (0.0%) | 0 (0.0%) |
| 35 to 64 Years | 1 (0.7%) | 12 (6.5%) |
| 65 to 74 Years | 0 (0.0%) | 0 (0.0%) |
| 75 Years and over | 0 (0.0%) | 2 (2.8%) |
Technology Access in Soda Bay
Computing Device Access in Soda Bay
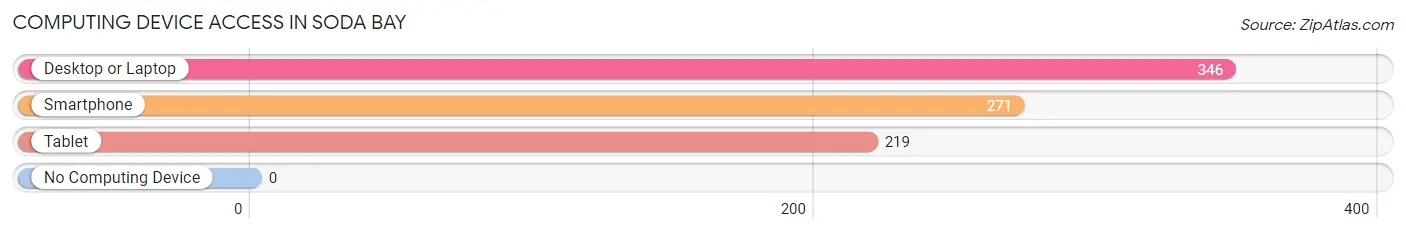
| Device Type | # Households | % Households |
| Desktop or Laptop | 346 | 96.4% |
| Smartphone | 271 | 75.5% |
| Tablet | 219 | 61.0% |
| No Computing Device | 0 | 0.0% |
| Total | 359 | 100.0% |
Internet Access in Soda Bay
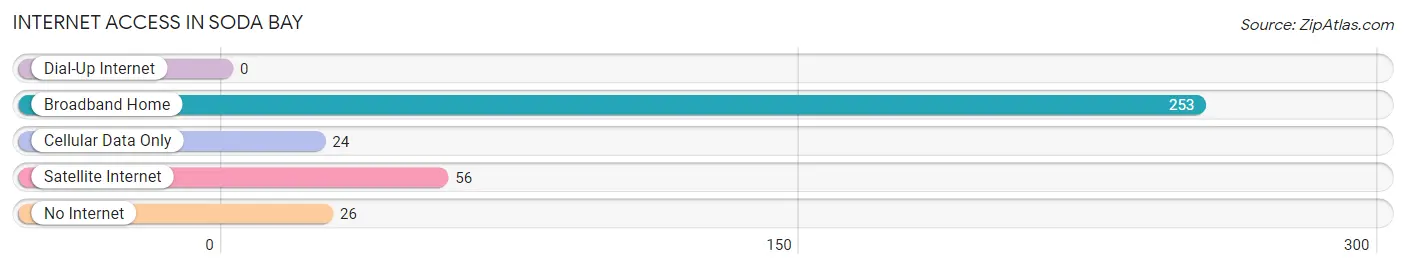
| Internet Type | # Households | % Households |
| Dial-Up Internet | 0 | 0.0% |
| Broadband Home | 253 | 70.5% |
| Cellular Data Only | 24 | 6.7% |
| Satellite Internet | 56 | 15.6% |
| No Internet | 26 | 7.2% |
| Total | 359 | 100.0% |
Soda Bay Summary
Soda Bay is a small town located in the northern part of California, in Sonoma County. It is situated on the western shore of the San Pablo Bay, and is part of the San Francisco Bay Area. The town has a population of approximately 2,000 people, and is known for its picturesque views of the bay and its surrounding hills.
History
Soda Bay was first settled in the late 1800s by Italian immigrants who were drawn to the area by its abundant fishing and farming opportunities. The town was originally called “Soda Springs” due to the presence of natural springs in the area. The name was later changed to “Soda Bay” in the early 1900s.
In the early 1900s, Soda Bay was a popular destination for tourists, who came to enjoy the area’s natural beauty and recreational activities. The town was also home to a number of resorts, including the famous Soda Bay Hotel.
In the 1950s, the town began to experience a decline in tourism, and many of the resorts closed. However, the town has since experienced a resurgence in popularity, and is now a popular destination for tourists and locals alike.
Geography
Soda Bay is located on the western shore of the San Pablo Bay, and is part of the San Francisco Bay Area. The town is situated on a small peninsula, and is surrounded by hills and mountains. The town is located approximately 30 miles north of San Francisco, and is accessible by car or boat.
The climate in Soda Bay is mild and temperate, with temperatures rarely reaching extreme highs or lows. The area receives an average of 20 inches of rain per year, and is known for its foggy mornings and sunny afternoons.
Economy
Soda Bay’s economy is largely based on tourism and recreation. The town is home to a number of resorts, restaurants, and other businesses that cater to tourists. The town is also home to a number of wineries, which produce some of the finest wines in the region.
In addition to tourism, Soda Bay is also home to a number of small businesses, including a number of shops and galleries. The town is also home to a number of artists, who often display their work in the town’s galleries.
Demographics
As of the 2010 census, the population of Soda Bay was 2,000 people. The town is predominantly white, with approximately 75% of the population identifying as Caucasian. The remaining 25% of the population is made up of African Americans, Asians, and Hispanics.
The median household income in Soda Bay is approximately $60,000, and the median home value is approximately $400,000. The town has a low unemployment rate, and the majority of the population is employed in the tourism and hospitality industry.
Conclusion
Soda Bay is a small town located in the northern part of California, in Sonoma County. The town has a population of approximately 2,000 people, and is known for its picturesque views of the bay and its surrounding hills. The town’s economy is largely based on tourism and recreation, and the town is home to a number of resorts, restaurants, and other businesses that cater to tourists. The town is predominantly white, with approximately 75% of the population identifying as Caucasian. The median household income in Soda Bay is approximately $60,000, and the median home value is approximately $400,000.
Common Questions
What is Per Capita Income in Soda Bay?
Per Capita income in Soda Bay is $52,844.
What is the Median Family Income in Soda Bay?
Median Family Income in Soda Bay is $97,260.
What is the Median Household income in Soda Bay?
Median Household Income in Soda Bay is $87,443.
What is Inequality or Gini Index in Soda Bay?
Inequality or Gini Index in Soda Bay is 0.45.
What is the Total Population of Soda Bay?
Total Population of Soda Bay is 759.
What is the Total Male Population of Soda Bay?
Total Male Population of Soda Bay is 350.
What is the Total Female Population of Soda Bay?
Total Female Population of Soda Bay is 409.
What is the Ratio of Males per 100 Females in Soda Bay?
There are 85.57 Males per 100 Females in Soda Bay.
What is the Ratio of Females per 100 Males in Soda Bay?
There are 116.86 Females per 100 Males in Soda Bay.
What is the Median Population Age in Soda Bay?
Median Population Age in Soda Bay is 61.4 Years.
What is the Average Family Size in Soda Bay
Average Family Size in Soda Bay is 2.5 People.
What is the Average Household Size in Soda Bay
Average Household Size in Soda Bay is 2.1 People.
How Large is the Labor Force in Soda Bay?
There are 464 People in the Labor Forcein in Soda Bay.
What is the Percentage of People in the Labor Force in Soda Bay?
61.1% of People are in the Labor Force in Soda Bay.
What is the Unemployment Rate in Soda Bay?
Unemployment Rate in Soda Bay is 3.4%.