Lake of the Pines, CA Map & Demographics
Lake of the Pines Map
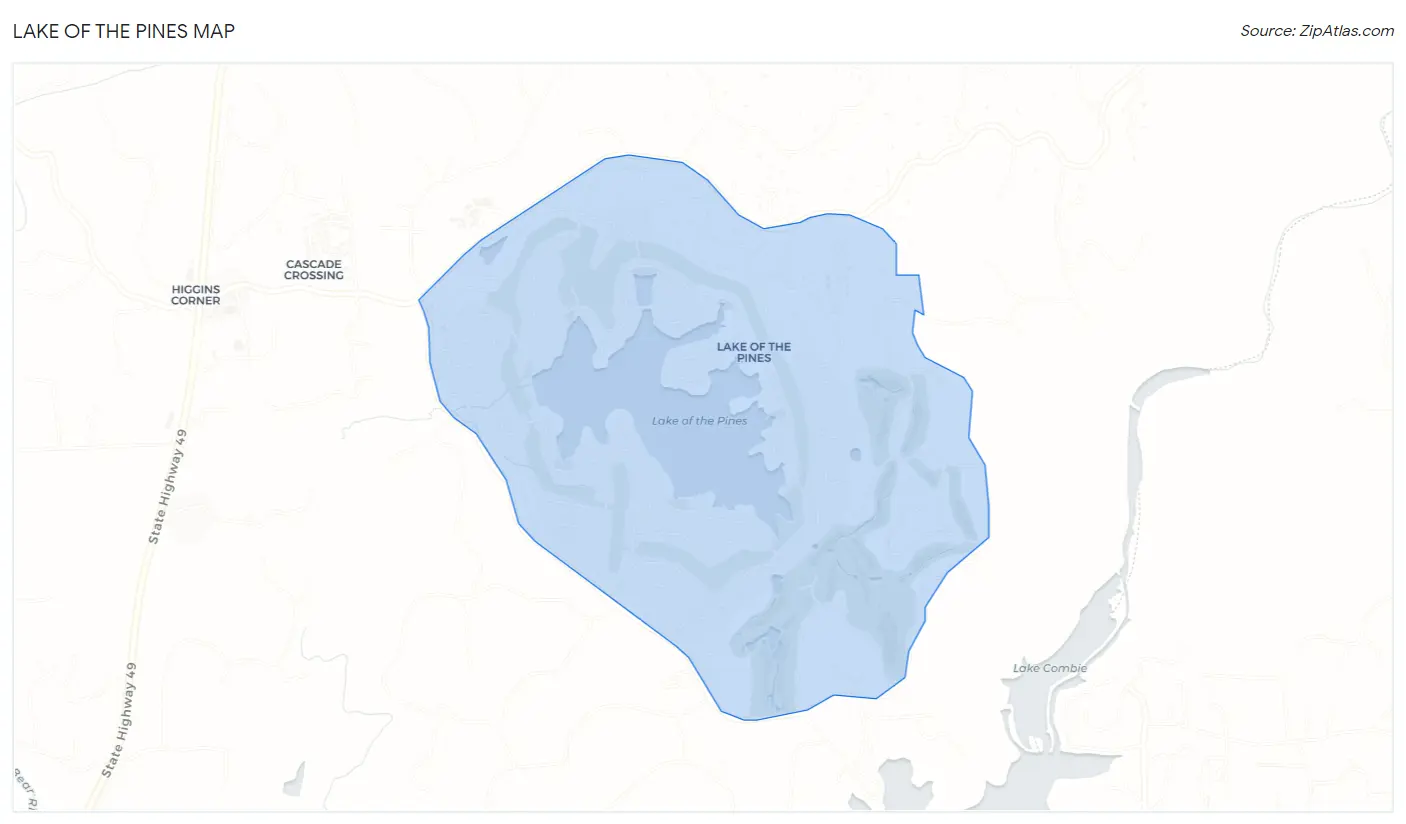
Lake of the Pines Overview
$56,260
PER CAPITA INCOME
$113,257
AVG FAMILY INCOME
$110,688
AVG HOUSEHOLD INCOME
32.5%
WAGE / INCOME GAP [ % ]
67.5¢/ $1
WAGE / INCOME GAP [ $ ]
0.39
INEQUALITY / GINI INDEX
4,703
TOTAL POPULATION
2,346
MALE POPULATION
2,357
FEMALE POPULATION
99.53
MALES / 100 FEMALES
100.47
FEMALES / 100 MALES
54.5
MEDIAN AGE
2.6
AVG FAMILY SIZE
2.5
AVG HOUSEHOLD SIZE
2,017
LABOR FORCE [ PEOPLE ]
50.3%
PERCENT IN LABOR FORCE
3.4%
UNEMPLOYMENT RATE
Income in Lake of the Pines
Income Overview in Lake of the Pines
Per Capita Income in Lake of the Pines is $56,260, while median incomes of families and households are $113,257 and $110,688 respectively.
| Characteristic | Number | Measure |
| Per Capita Income | 4,703 | $56,260 |
| Median Family Income | 1,467 | $113,257 |
| Mean Family Income | 1,467 | $134,055 |
| Median Household Income | 1,916 | $110,688 |
| Mean Household Income | 1,916 | $133,682 |
| Income Deficit | 1,467 | $0 |
| Wage / Income Gap (%) | 4,703 | 32.53% |
| Wage / Income Gap ($) | 4,703 | 67.47¢ per $1 |
| Gini / Inequality Index | 4,703 | 0.39 |
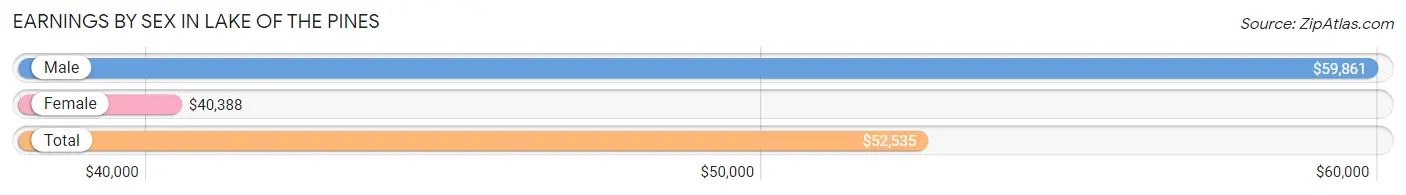
Earnings by Sex in Lake of the Pines
Average Earnings in Lake of the Pines are $52,535, $59,861 for men and $40,388 for women, a difference of 32.5%.
| Sex | Number | Average Earnings |
| Male | 1,276 (56.1%) | $59,861 |
| Female | 999 (43.9%) | $40,388 |
| Total | 2,275 (100.0%) | $52,535 |
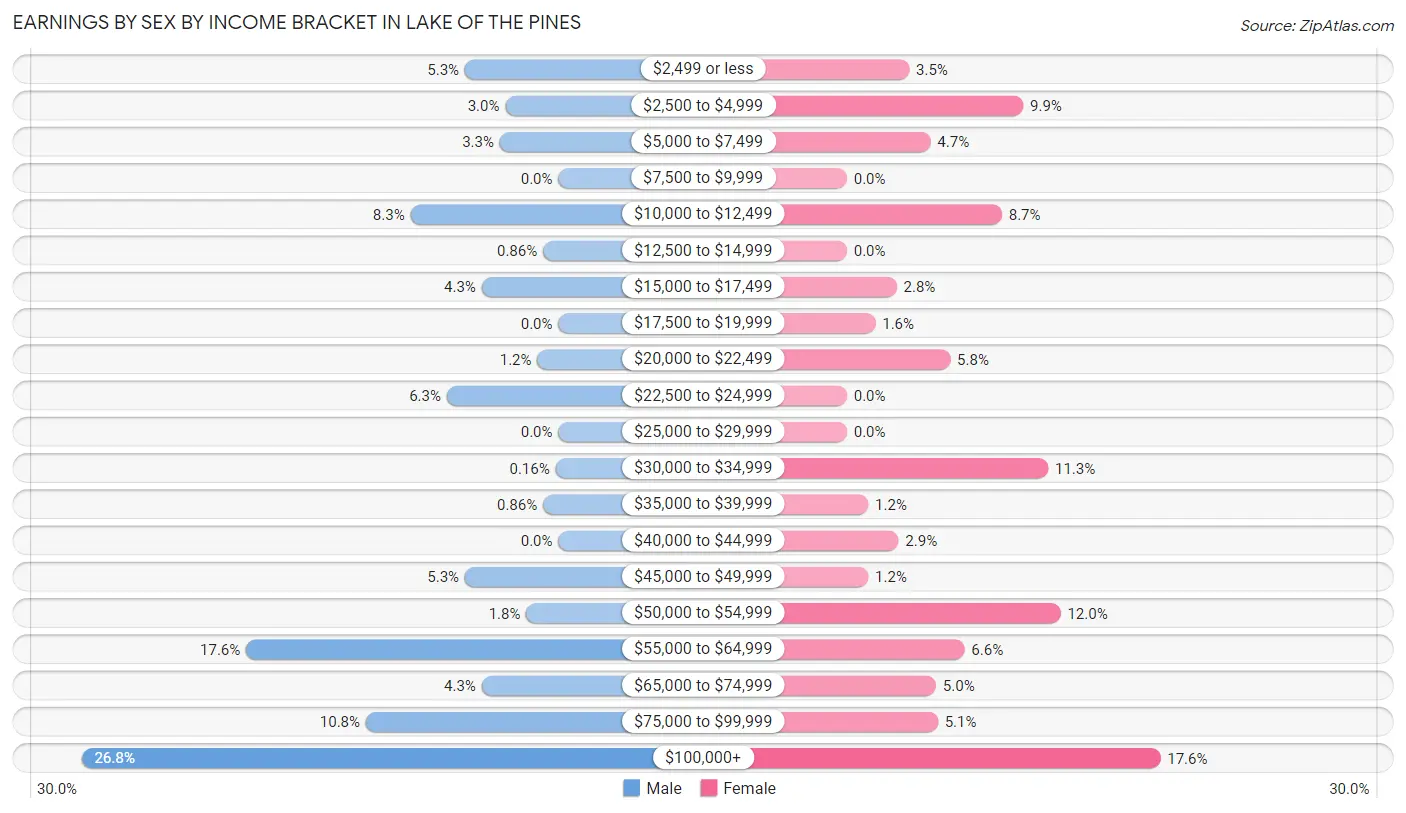
Earnings by Sex by Income Bracket in Lake of the Pines
The most common earnings brackets in Lake of the Pines are $100,000+ for men (342 | 26.8%) and $100,000+ for women (176 | 17.6%).
| Income | Male | Female |
| $2,499 or less | 67 (5.2%) | 35 (3.5%) |
| $2,500 to $4,999 | 38 (3.0%) | 99 (9.9%) |
| $5,000 to $7,499 | 42 (3.3%) | 47 (4.7%) |
| $7,500 to $9,999 | 0 (0.0%) | 0 (0.0%) |
| $10,000 to $12,499 | 106 (8.3%) | 87 (8.7%) |
| $12,500 to $14,999 | 11 (0.9%) | 0 (0.0%) |
| $15,000 to $17,499 | 55 (4.3%) | 28 (2.8%) |
| $17,500 to $19,999 | 0 (0.0%) | 16 (1.6%) |
| $20,000 to $22,499 | 15 (1.2%) | 58 (5.8%) |
| $22,500 to $24,999 | 80 (6.3%) | 0 (0.0%) |
| $25,000 to $29,999 | 0 (0.0%) | 0 (0.0%) |
| $30,000 to $34,999 | 2 (0.2%) | 113 (11.3%) |
| $35,000 to $39,999 | 11 (0.9%) | 12 (1.2%) |
| $40,000 to $44,999 | 0 (0.0%) | 29 (2.9%) |
| $45,000 to $49,999 | 67 (5.2%) | 12 (1.2%) |
| $50,000 to $54,999 | 23 (1.8%) | 120 (12.0%) |
| $55,000 to $64,999 | 224 (17.5%) | 66 (6.6%) |
| $65,000 to $74,999 | 55 (4.3%) | 50 (5.0%) |
| $75,000 to $99,999 | 138 (10.8%) | 51 (5.1%) |
| $100,000+ | 342 (26.8%) | 176 (17.6%) |
| Total | 1,276 (100.0%) | 999 (100.0%) |
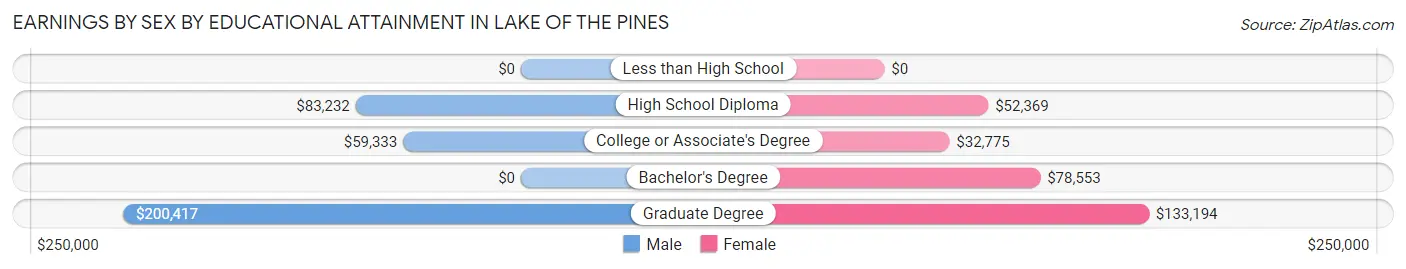
Earnings by Sex by Educational Attainment in Lake of the Pines
Average earnings in Lake of the Pines are $62,068 for men and $50,908 for women, a difference of 18.0%. Men with an educational attainment of graduate degree enjoy the highest average annual earnings of $200,417, while those with college or associate's degree education earn the least with $59,333. Women with an educational attainment of graduate degree earn the most with the average annual earnings of $133,194, while those with college or associate's degree education have the smallest earnings of $32,775.
| Educational Attainment | Male Income | Female Income |
| Less than High School | - | - |
| High School Diploma | $83,232 | $52,369 |
| College or Associate's Degree | $59,333 | $32,775 |
| Bachelor's Degree | - | - |
| Graduate Degree | $200,417 | $133,194 |
| Total | $62,068 | $50,908 |
Family Income in Lake of the Pines
Family Income Brackets in Lake of the Pines
According to the Lake of the Pines family income data, there are 503 families falling into the $100,000 to $149,999 income range, which is the most common income bracket and makes up 34.3% of all families.
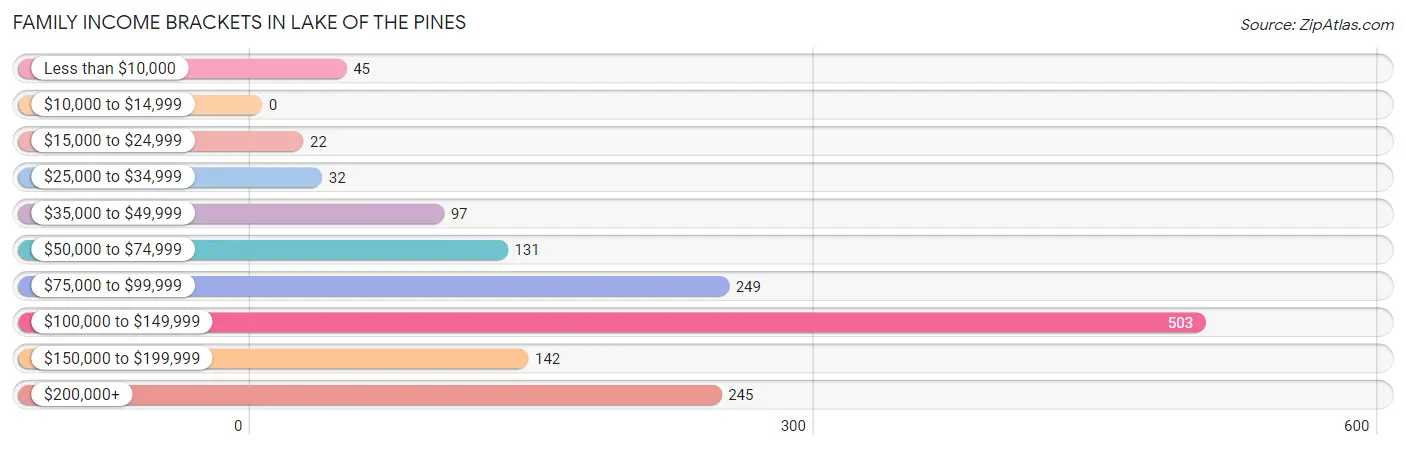
| Income Bracket | # Families | % Families |
| Less than $10,000 | 45 | 3.1% |
| $10,000 to $14,999 | 0 | 0.0% |
| $15,000 to $24,999 | 22 | 1.5% |
| $25,000 to $34,999 | 32 | 2.2% |
| $35,000 to $49,999 | 97 | 6.6% |
| $50,000 to $74,999 | 131 | 8.9% |
| $75,000 to $99,999 | 249 | 17.0% |
| $100,000 to $149,999 | 503 | 34.3% |
| $150,000 to $199,999 | 142 | 9.7% |
| $200,000+ | 245 | 16.7% |
Family Income by Famaliy Size in Lake of the Pines
5-person families (46 | 3.1%) account for the highest median family income in Lake of the Pines with $250,001 per family, while 2-person families (873 | 59.5%) have the highest median income of $56,278 per family member.
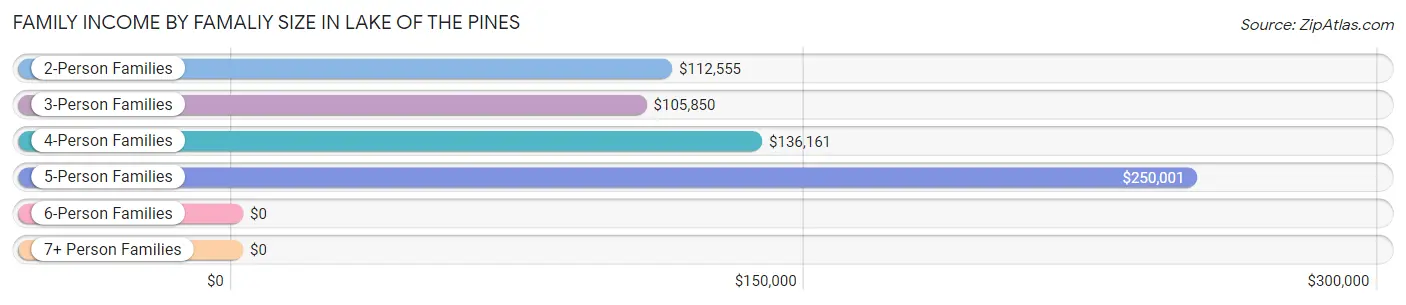
| Income Bracket | # Families | Median Income |
| 2-Person Families | 873 (59.5%) | $112,555 |
| 3-Person Families | 437 (29.8%) | $105,850 |
| 4-Person Families | 111 (7.6%) | $136,161 |
| 5-Person Families | 46 (3.1%) | $250,001 |
| 6-Person Families | 0 (0.0%) | $0 |
| 7+ Person Families | 0 (0.0%) | $0 |
| Total | 1,467 (100.0%) | $113,257 |
Family Income by Number of Earners in Lake of the Pines
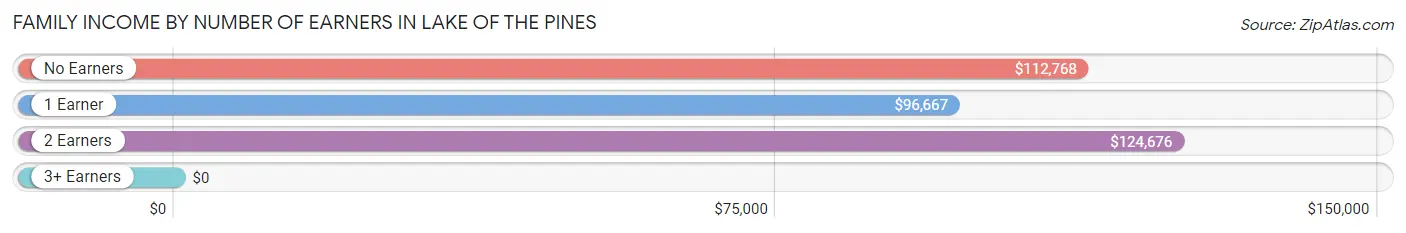
| Number of Earners | # Families | Median Income |
| No Earners | 372 (25.4%) | $112,768 |
| 1 Earner | 450 (30.7%) | $96,667 |
| 2 Earners | 629 (42.9%) | $124,676 |
| 3+ Earners | 16 (1.1%) | $0 |
| Total | 1,467 (100.0%) | $113,257 |
Household Income in Lake of the Pines
Household Income Brackets in Lake of the Pines
With 550 households falling in the category, the $100,000 to $149,999 income range is the most frequent in Lake of the Pines, accounting for 28.7% of all households. In contrast, only 44 households (2.3%) fall into the less than $10,000 income bracket, making it the least populous group.
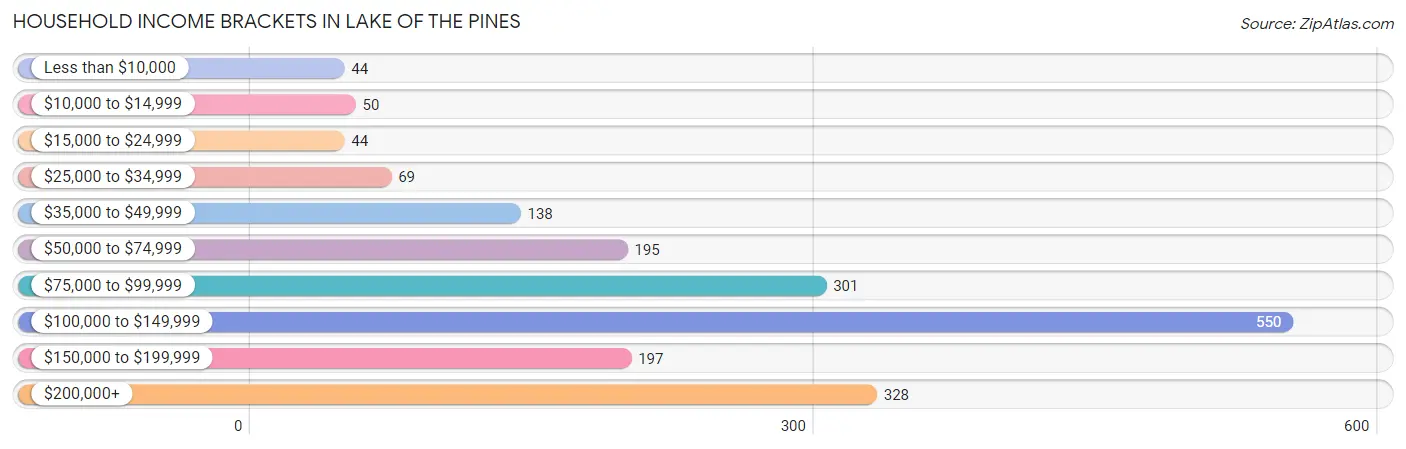
| Income Bracket | # Households | % Households |
| Less than $10,000 | 44 | 2.3% |
| $10,000 to $14,999 | 50 | 2.6% |
| $15,000 to $24,999 | 44 | 2.3% |
| $25,000 to $34,999 | 69 | 3.6% |
| $35,000 to $49,999 | 138 | 7.2% |
| $50,000 to $74,999 | 195 | 10.2% |
| $75,000 to $99,999 | 301 | 15.7% |
| $100,000 to $149,999 | 550 | 28.7% |
| $150,000 to $199,999 | 197 | 10.3% |
| $200,000+ | 328 | 17.1% |
Household Income by Householder Age in Lake of the Pines
The median household income in Lake of the Pines is $110,688, with the highest median household income of $135,714 found in the 25 to 44 years age bracket for the primary householder. A total of 340 households (17.7%) fall into this category.
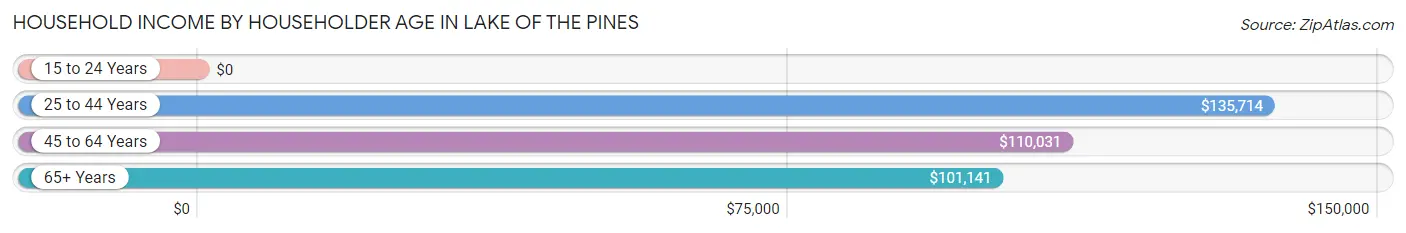
| Income Bracket | # Households | Median Income |
| 15 to 24 Years | 0 (0.0%) | $0 |
| 25 to 44 Years | 340 (17.7%) | $135,714 |
| 45 to 64 Years | 753 (39.3%) | $110,031 |
| 65+ Years | 823 (42.9%) | $101,141 |
| Total | 1,916 (100.0%) | $110,688 |
Poverty in Lake of the Pines
Income Below Poverty by Sex and Age in Lake of the Pines
With 4.0% poverty level for males and 9.7% for females among the residents of Lake of the Pines, 45 to 54 year old males and 18 to 24 year old females are the most vulnerable to poverty, with 40 males (16.3%) and 75 females (52.4%) in their respective age groups living below the poverty level.
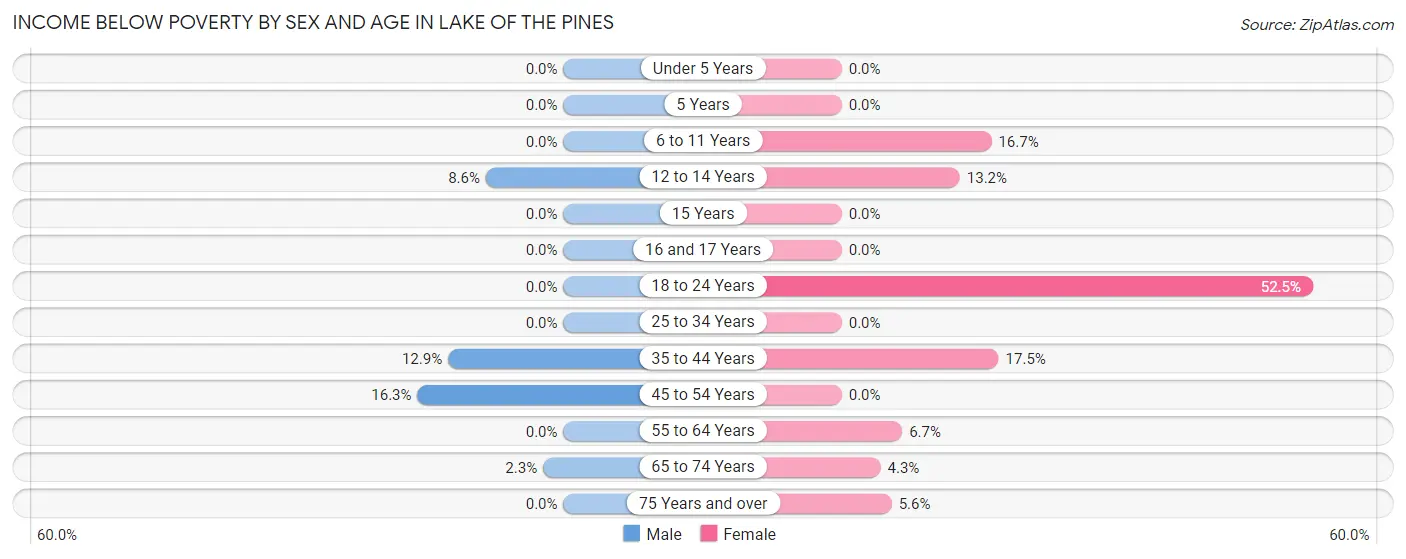
| Age Bracket | Male | Female |
| Under 5 Years | 0 (0.0%) | 0 (0.0%) |
| 5 Years | 0 (0.0%) | 0 (0.0%) |
| 6 to 11 Years | 0 (0.0%) | 28 (16.7%) |
| 12 to 14 Years | 7 (8.6%) | 28 (13.2%) |
| 15 Years | 0 (0.0%) | 0 (0.0%) |
| 16 and 17 Years | 0 (0.0%) | 0 (0.0%) |
| 18 to 24 Years | 0 (0.0%) | 75 (52.4%) |
| 25 to 34 Years | 0 (0.0%) | 0 (0.0%) |
| 35 to 44 Years | 37 (12.9%) | 29 (17.5%) |
| 45 to 54 Years | 40 (16.3%) | 0 (0.0%) |
| 55 to 64 Years | 0 (0.0%) | 34 (6.7%) |
| 65 to 74 Years | 10 (2.3%) | 20 (4.3%) |
| 75 Years and over | 0 (0.0%) | 14 (5.6%) |
| Total | 94 (4.0%) | 228 (9.7%) |
Income Above Poverty by Sex and Age in Lake of the Pines
According to the poverty statistics in Lake of the Pines, males aged 6 to 11 years and females aged under 5 years are the age groups that are most secure financially, with 100.0% of males and 100.0% of females in these age groups living above the poverty line.
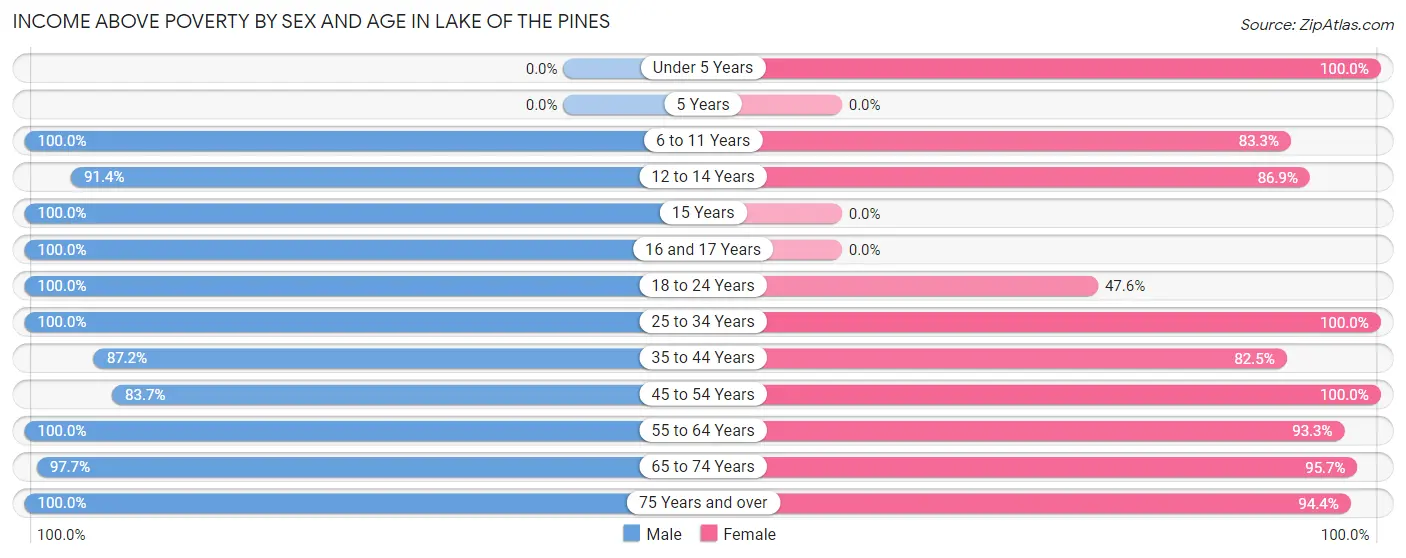
| Age Bracket | Male | Female |
| Under 5 Years | 0 (0.0%) | 60 (100.0%) |
| 5 Years | 0 (0.0%) | 0 (0.0%) |
| 6 to 11 Years | 64 (100.0%) | 140 (83.3%) |
| 12 to 14 Years | 74 (91.4%) | 185 (86.9%) |
| 15 Years | 108 (100.0%) | 0 (0.0%) |
| 16 and 17 Years | 35 (100.0%) | 0 (0.0%) |
| 18 to 24 Years | 188 (100.0%) | 68 (47.5%) |
| 25 to 34 Years | 269 (100.0%) | 179 (100.0%) |
| 35 to 44 Years | 251 (87.2%) | 137 (82.5%) |
| 45 to 54 Years | 206 (83.7%) | 208 (100.0%) |
| 55 to 64 Years | 346 (100.0%) | 471 (93.3%) |
| 65 to 74 Years | 431 (97.7%) | 443 (95.7%) |
| 75 Years and over | 280 (100.0%) | 238 (94.4%) |
| Total | 2,252 (96.0%) | 2,129 (90.3%) |
Income Below Poverty Among Married-Couple Families in Lake of the Pines
The poverty statistics for married-couple families in Lake of the Pines show that 0.9% or 10 of the total 1,135 families live below the poverty line. Families with no children have the highest poverty rate of 1.2%, comprising of 10 families. On the other hand, families with 1 or 2 children have the lowest poverty rate of 0.0%, which includes 0 families.
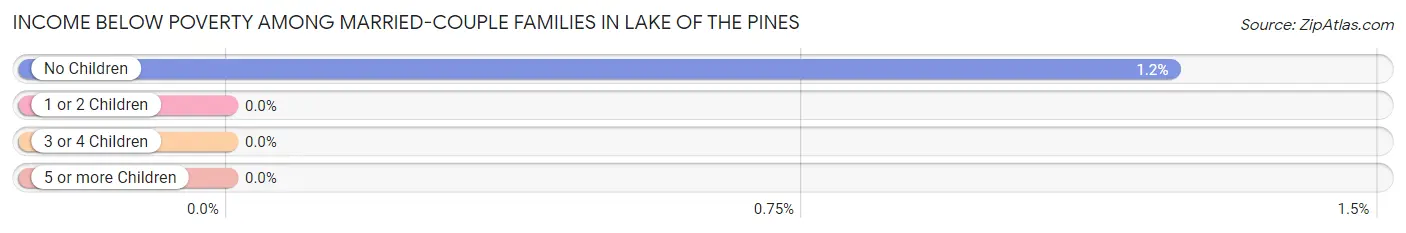
| Children | Above Poverty | Below Poverty |
| No Children | 801 (98.8%) | 10 (1.2%) |
| 1 or 2 Children | 298 (100.0%) | 0 (0.0%) |
| 3 or 4 Children | 26 (100.0%) | 0 (0.0%) |
| 5 or more Children | 0 (0.0%) | 0 (0.0%) |
| Total | 1,125 (99.1%) | 10 (0.9%) |
Income Below Poverty Among Single-Parent Households in Lake of the Pines
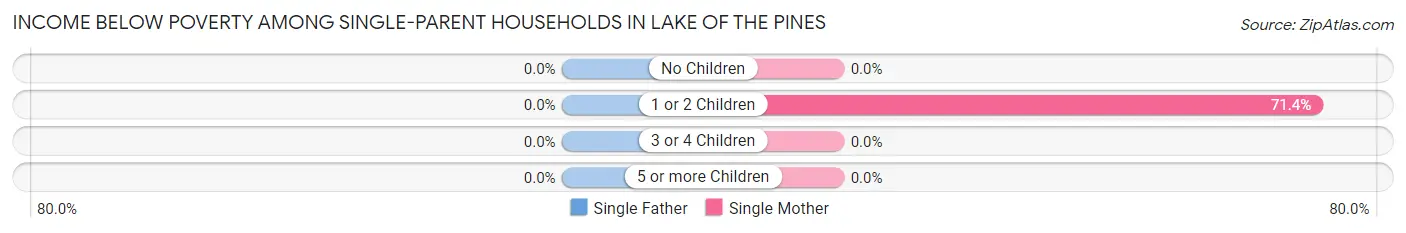
| Children | Single Father | Single Mother |
| No Children | 0 (0.0%) | 0 (0.0%) |
| 1 or 2 Children | 0 (0.0%) | 35 (71.4%) |
| 3 or 4 Children | 0 (0.0%) | 0 (0.0%) |
| 5 or more Children | 0 (0.0%) | 0 (0.0%) |
| Total | 0 (0.0%) | 35 (24.8%) |
Income Below Poverty Among Married-Couple vs Single-Parent Households in Lake of the Pines
The poverty data for Lake of the Pines shows that 10 of the married-couple family households (0.9%) and 35 of the single-parent households (10.5%) are living below the poverty level. Within the married-couple family households, those with no children have the highest poverty rate, with 10 households (1.2%) falling below the poverty line. Among the single-parent households, those with 1 or 2 children have the highest poverty rate, with 35 household (21.2%) living below poverty.
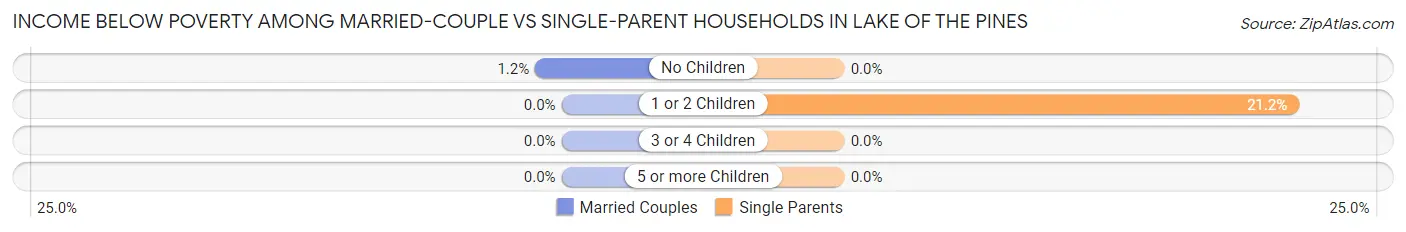
| Children | Married-Couple Families | Single-Parent Households |
| No Children | 10 (1.2%) | 0 (0.0%) |
| 1 or 2 Children | 0 (0.0%) | 35 (21.2%) |
| 3 or 4 Children | 0 (0.0%) | 0 (0.0%) |
| 5 or more Children | 0 (0.0%) | 0 (0.0%) |
| Total | 10 (0.9%) | 35 (10.5%) |
Race in Lake of the Pines
The most populous races in Lake of the Pines are White / Caucasian (4,158 | 88.4%), Hispanic or Latino (590 | 12.6%), and Two or more Races (277 | 5.9%).
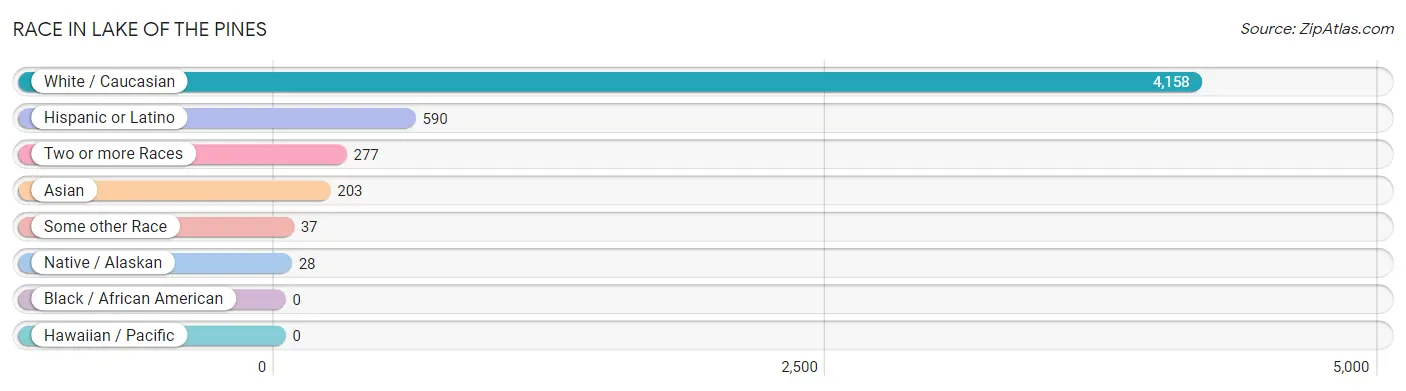
| Race | # Population | % Population |
| Asian | 203 | 4.3% |
| Black / African American | 0 | 0.0% |
| Hawaiian / Pacific | 0 | 0.0% |
| Hispanic or Latino | 590 | 12.6% |
| Native / Alaskan | 28 | 0.6% |
| White / Caucasian | 4,158 | 88.4% |
| Two or more Races | 277 | 5.9% |
| Some other Race | 37 | 0.8% |
| Total | 4,703 | 100.0% |
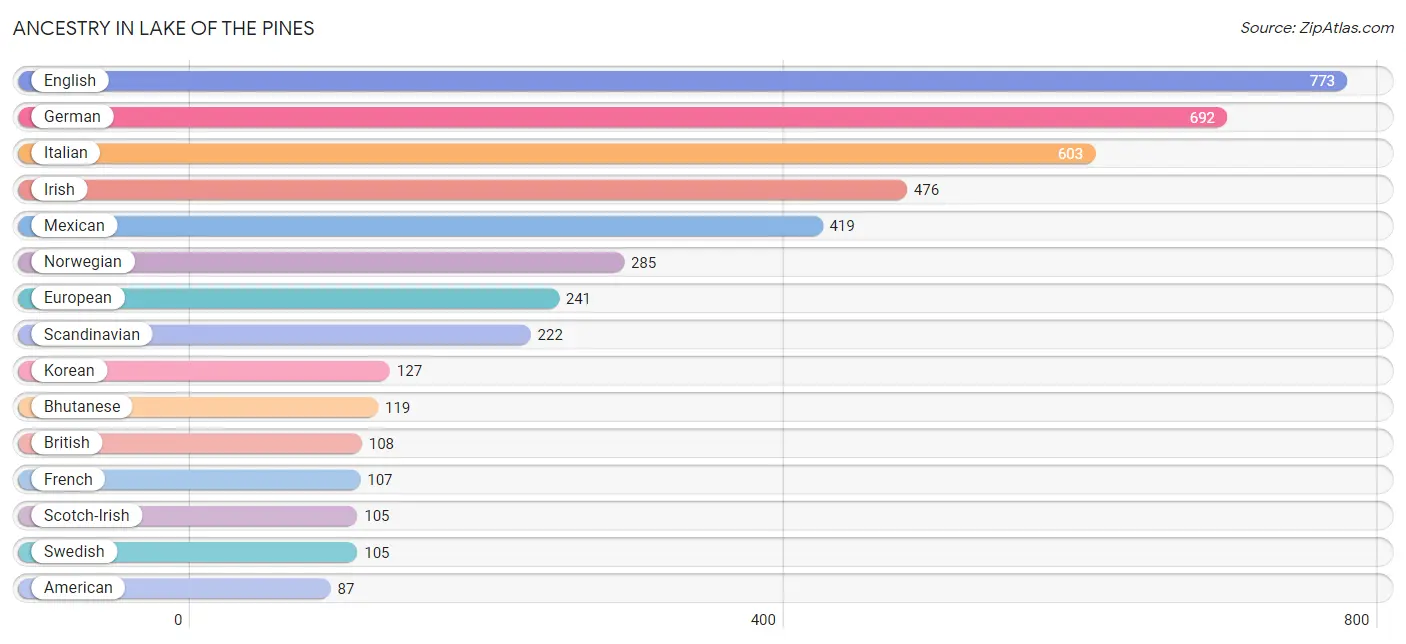
Ancestry in Lake of the Pines
The most populous ancestries reported in Lake of the Pines are English (773 | 16.4%), German (692 | 14.7%), Italian (603 | 12.8%), Irish (476 | 10.1%), and Mexican (419 | 8.9%), together accounting for 63.0% of all Lake of the Pines residents.
| Ancestry | # Population | % Population |
| American | 87 | 1.8% |
| Apache | 8 | 0.2% |
| Arab | 26 | 0.5% |
| Basque | 12 | 0.3% |
| Bhutanese | 119 | 2.5% |
| British | 108 | 2.3% |
| Cajun | 9 | 0.2% |
| Central American | 18 | 0.4% |
| Croatian | 30 | 0.6% |
| Cuban | 24 | 0.5% |
| Czech | 16 | 0.3% |
| Danish | 61 | 1.3% |
| Dutch | 47 | 1.0% |
| Eastern European | 13 | 0.3% |
| English | 773 | 16.4% |
| European | 241 | 5.1% |
| French | 107 | 2.3% |
| French Canadian | 22 | 0.5% |
| German | 692 | 14.7% |
| Greek | 35 | 0.7% |
| Hungarian | 4 | 0.1% |
| Indian (Asian) | 19 | 0.4% |
| Irish | 476 | 10.1% |
| Italian | 603 | 12.8% |
| Korean | 127 | 2.7% |
| Lebanese | 26 | 0.5% |
| Lithuanian | 20 | 0.4% |
| Malaysian | 60 | 1.3% |
| Mexican | 419 | 8.9% |
| Norwegian | 285 | 6.1% |
| Polish | 48 | 1.0% |
| Portuguese | 22 | 0.5% |
| Puerto Rican | 9 | 0.2% |
| Russian | 10 | 0.2% |
| Salvadoran | 18 | 0.4% |
| Scandinavian | 222 | 4.7% |
| Scotch-Irish | 105 | 2.2% |
| Scottish | 38 | 0.8% |
| Spaniard | 70 | 1.5% |
| Spanish | 50 | 1.1% |
| Swedish | 105 | 2.2% |
| Thai | 30 | 0.6% |
| Welsh | 9 | 0.2% | View All 43 Rows |
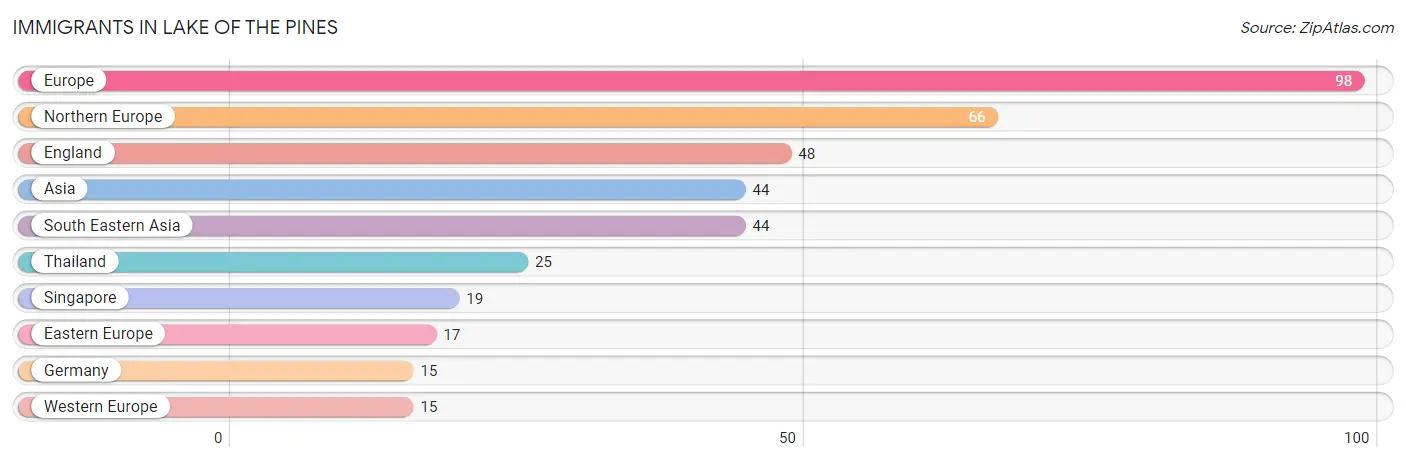
Immigrants in Lake of the Pines
The most numerous immigrant groups reported in Lake of the Pines came from Europe (98 | 2.1%), Northern Europe (66 | 1.4%), England (48 | 1.0%), Asia (44 | 0.9%), and South Eastern Asia (44 | 0.9%), together accounting for 6.4% of all Lake of the Pines residents.
| Immigration Origin | # Population | % Population |
| Asia | 44 | 0.9% |
| Eastern Europe | 17 | 0.4% |
| England | 48 | 1.0% |
| Europe | 98 | 2.1% |
| Germany | 15 | 0.3% |
| Northern Europe | 66 | 1.4% |
| Singapore | 19 | 0.4% |
| South Eastern Asia | 44 | 0.9% |
| Thailand | 25 | 0.5% |
| Western Europe | 15 | 0.3% | View All 10 Rows |
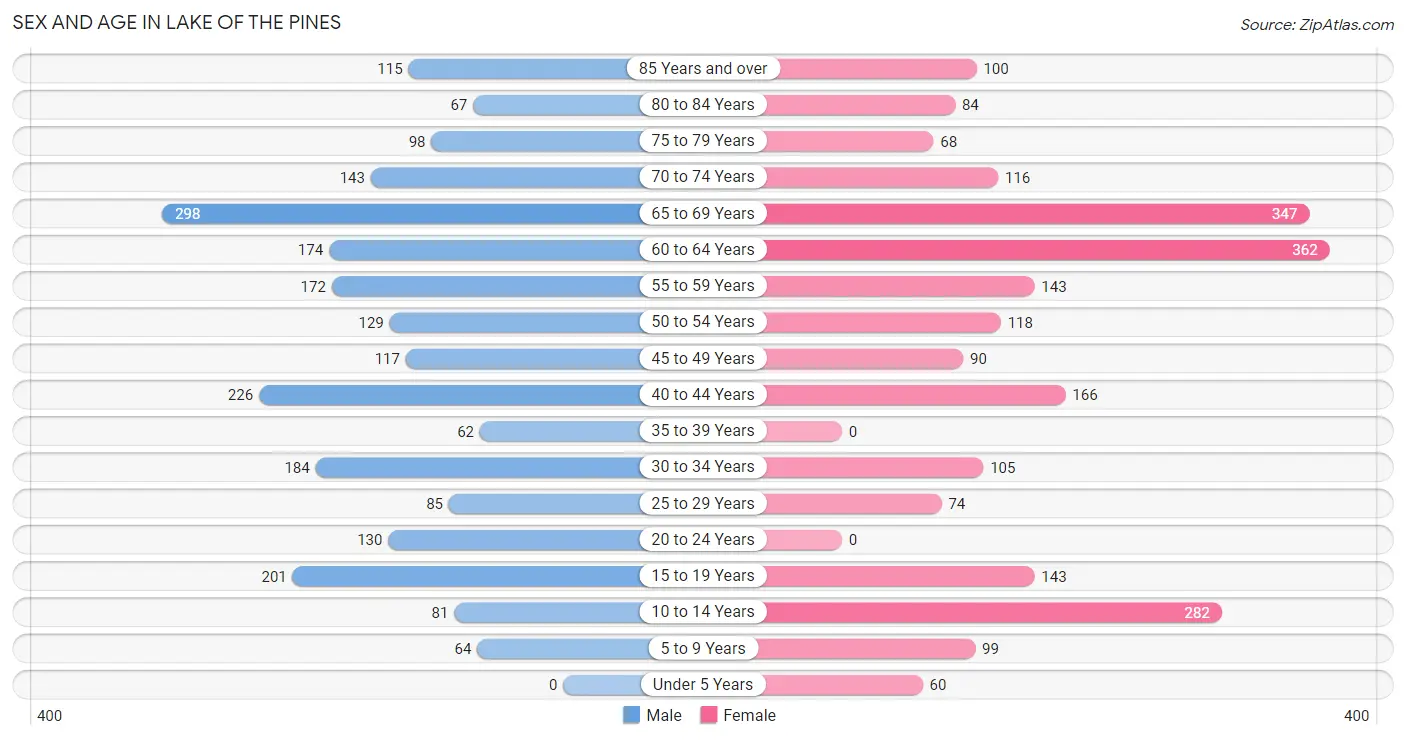
Sex and Age in Lake of the Pines
Sex and Age in Lake of the Pines
The most populous age groups in Lake of the Pines are 65 to 69 Years (298 | 12.7%) for men and 60 to 64 Years (362 | 15.4%) for women.
| Age Bracket | Male | Female |
| Under 5 Years | 0 (0.0%) | 60 (2.5%) |
| 5 to 9 Years | 64 (2.7%) | 99 (4.2%) |
| 10 to 14 Years | 81 (3.5%) | 282 (12.0%) |
| 15 to 19 Years | 201 (8.6%) | 143 (6.1%) |
| 20 to 24 Years | 130 (5.5%) | 0 (0.0%) |
| 25 to 29 Years | 85 (3.6%) | 74 (3.1%) |
| 30 to 34 Years | 184 (7.8%) | 105 (4.4%) |
| 35 to 39 Years | 62 (2.6%) | 0 (0.0%) |
| 40 to 44 Years | 226 (9.6%) | 166 (7.0%) |
| 45 to 49 Years | 117 (5.0%) | 90 (3.8%) |
| 50 to 54 Years | 129 (5.5%) | 118 (5.0%) |
| 55 to 59 Years | 172 (7.3%) | 143 (6.1%) |
| 60 to 64 Years | 174 (7.4%) | 362 (15.4%) |
| 65 to 69 Years | 298 (12.7%) | 347 (14.7%) |
| 70 to 74 Years | 143 (6.1%) | 116 (4.9%) |
| 75 to 79 Years | 98 (4.2%) | 68 (2.9%) |
| 80 to 84 Years | 67 (2.9%) | 84 (3.6%) |
| 85 Years and over | 115 (4.9%) | 100 (4.2%) |
| Total | 2,346 (100.0%) | 2,357 (100.0%) |
Families and Households in Lake of the Pines
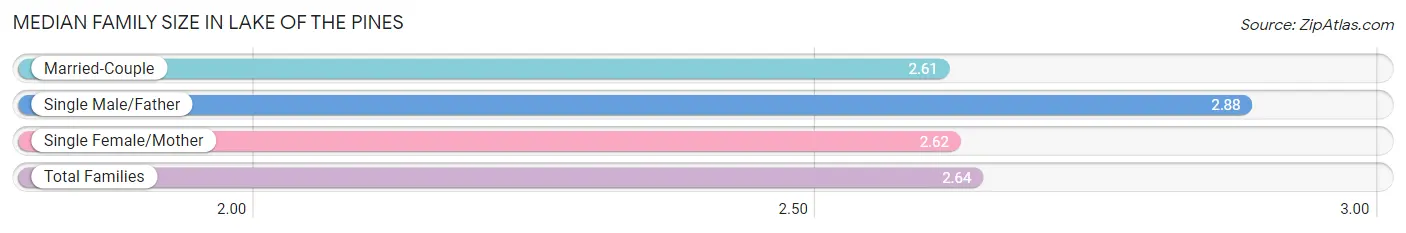
Median Family Size in Lake of the Pines
The median family size in Lake of the Pines is 2.64 persons per family, with single male/father families (191 | 13.0%) accounting for the largest median family size of 2.88 persons per family. On the other hand, married-couple families (1,135 | 77.4%) represent the smallest median family size with 2.61 persons per family.
| Family Type | # Families | Family Size |
| Married-Couple | 1,135 (77.4%) | 2.61 |
| Single Male/Father | 191 (13.0%) | 2.88 |
| Single Female/Mother | 141 (9.6%) | 2.62 |
| Total Families | 1,467 (100.0%) | 2.64 |
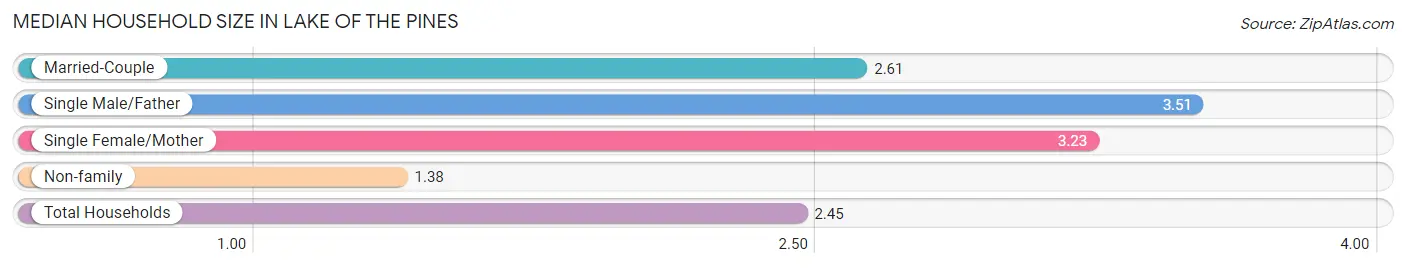
Median Household Size in Lake of the Pines
The median household size in Lake of the Pines is 2.45 persons per household, with single male/father households (191 | 10.0%) accounting for the largest median household size of 3.51 persons per household. non-family households (449 | 23.4%) represent the smallest median household size with 1.38 persons per household.
| Household Type | # Households | Household Size |
| Married-Couple | 1,135 (59.2%) | 2.61 |
| Single Male/Father | 191 (10.0%) | 3.51 |
| Single Female/Mother | 141 (7.4%) | 3.23 |
| Non-family | 449 (23.4%) | 1.38 |
| Total Households | 1,916 (100.0%) | 2.45 |
Household Size by Marriage Status in Lake of the Pines
Out of a total of 1,916 households in Lake of the Pines, 1,467 (76.6%) are family households, while 449 (23.4%) are nonfamily households. The most numerous type of family households are 2-person households, comprising 822, and the most common type of nonfamily households are 1-person households, comprising 355.
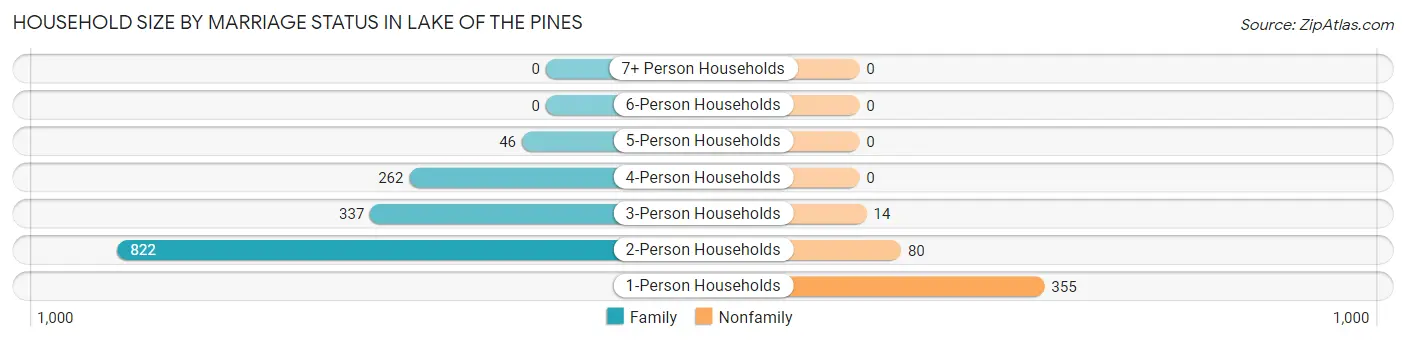
| Household Size | Family Households | Nonfamily Households |
| 1-Person Households | - | 355 (18.5%) |
| 2-Person Households | 822 (42.9%) | 80 (4.2%) |
| 3-Person Households | 337 (17.6%) | 14 (0.7%) |
| 4-Person Households | 262 (13.7%) | 0 (0.0%) |
| 5-Person Households | 46 (2.4%) | 0 (0.0%) |
| 6-Person Households | 0 (0.0%) | 0 (0.0%) |
| 7+ Person Households | 0 (0.0%) | 0 (0.0%) |
| Total | 1,467 (76.6%) | 449 (23.4%) |
Female Fertility in Lake of the Pines
Fertility by Age in Lake of the Pines
Average fertility rate in Lake of the Pines is 38.0 births per 1,000 women. Women in the age bracket of 20 to 34 years have the highest fertility rate with 123.0 births per 1,000 women. Women in the age bracket of 20 to 34 years acount for 100.0% of all women with births.
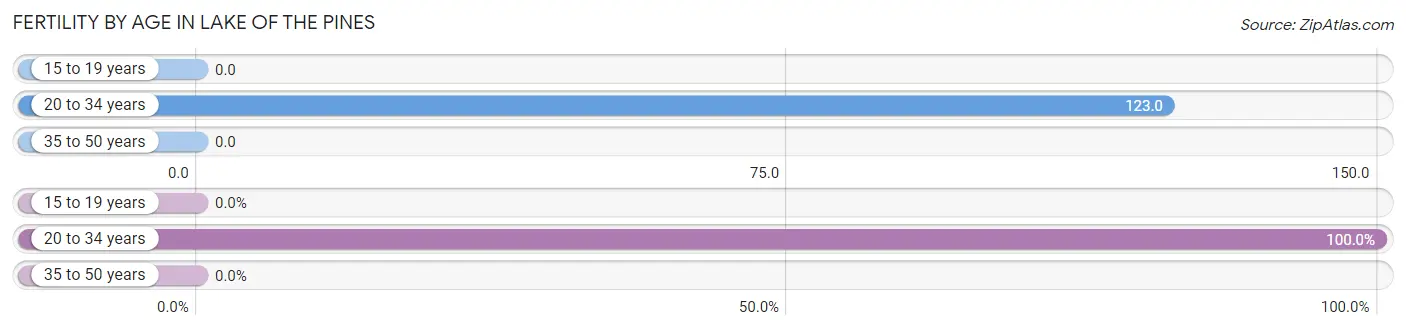
| Age Bracket | Women with Births | Births / 1,000 Women |
| 15 to 19 years | 0 (0.0%) | 0.0 |
| 20 to 34 years | 22 (100.0%) | 123.0 |
| 35 to 50 years | 0 (0.0%) | 0.0 |
| Total | 22 (100.0%) | 38.0 |
Fertility by Age by Marriage Status in Lake of the Pines
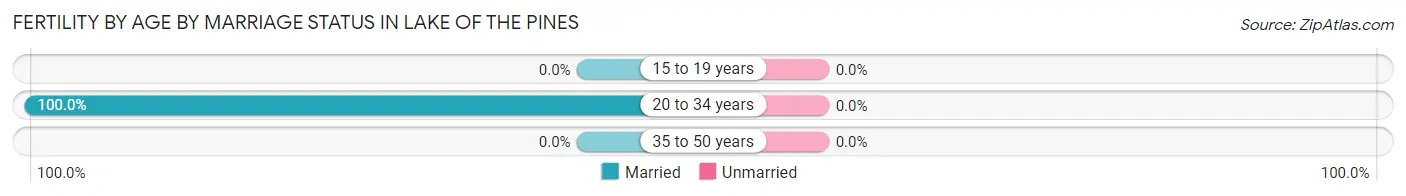
| Age Bracket | Married | Unmarried |
| 15 to 19 years | 0 (0.0%) | 0 (0.0%) |
| 20 to 34 years | 22 (100.0%) | 0 (0.0%) |
| 35 to 50 years | 0 (0.0%) | 0 (0.0%) |
| Total | 22 (100.0%) | 0 (0.0%) |
Fertility by Education in Lake of the Pines
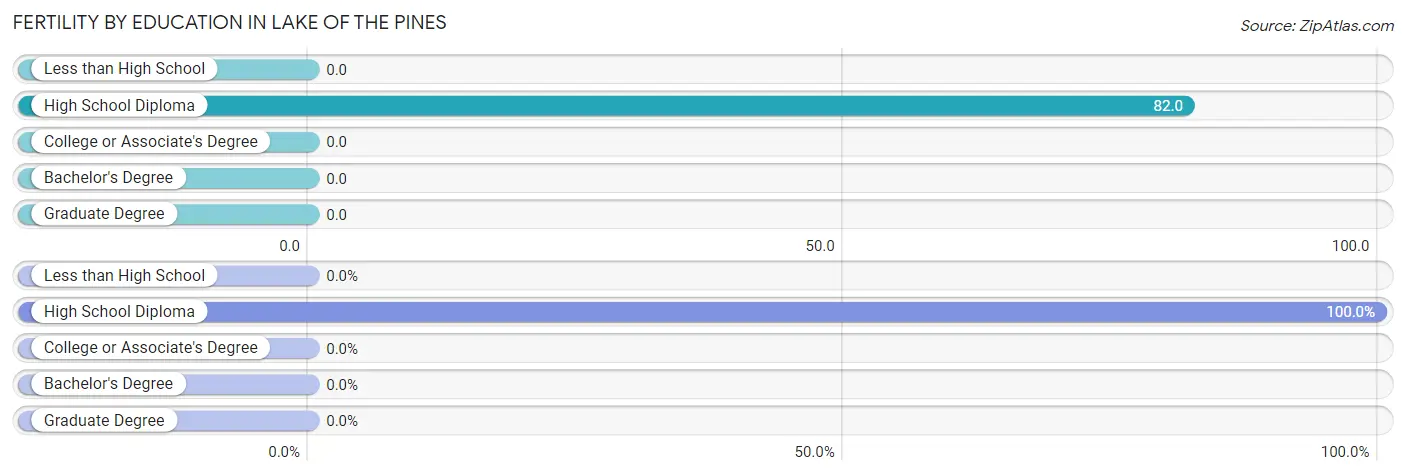
| Educational Attainment | Women with Births | Births / 1,000 Women |
| Less than High School | 0 (0.0%) | 0.0 |
| High School Diploma | 22 (100.0%) | 82.0 |
| College or Associate's Degree | 0 (0.0%) | 0.0 |
| Bachelor's Degree | 0 (0.0%) | 0.0 |
| Graduate Degree | 0 (0.0%) | 0.0 |
| Total | 22 (100.0%) | 38.0 |
Fertility by Education by Marriage Status in Lake of the Pines
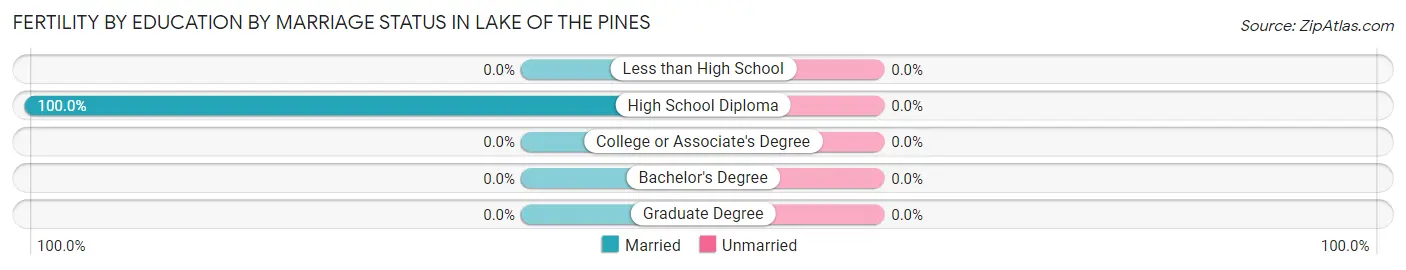
| Educational Attainment | Married | Unmarried |
| Less than High School | 0 (0.0%) | 0 (0.0%) |
| High School Diploma | 22 (100.0%) | 0 (0.0%) |
| College or Associate's Degree | 0 (0.0%) | 0 (0.0%) |
| Bachelor's Degree | 0 (0.0%) | 0 (0.0%) |
| Graduate Degree | 0 (0.0%) | 0 (0.0%) |
| Total | 22 (100.0%) | 0 (0.0%) |
Employment Characteristics in Lake of the Pines
Employment by Class of Employer in Lake of the Pines
Among the 1,860 employed individuals in Lake of the Pines, private company employees (1,346 | 72.4%), self-employed (not incorporated) (189 | 10.2%), and not-for-profit organizations (125 | 6.7%) make up the most common classes of employment.
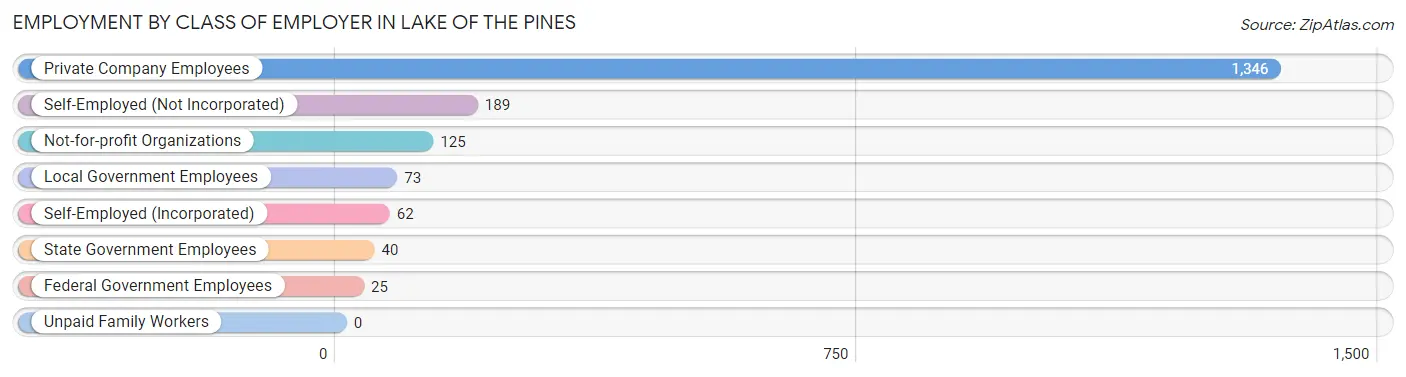
| Employer Class | # Employees | % Employees |
| Private Company Employees | 1,346 | 72.4% |
| Self-Employed (Incorporated) | 62 | 3.3% |
| Self-Employed (Not Incorporated) | 189 | 10.2% |
| Not-for-profit Organizations | 125 | 6.7% |
| Local Government Employees | 73 | 3.9% |
| State Government Employees | 40 | 2.1% |
| Federal Government Employees | 25 | 1.3% |
| Unpaid Family Workers | 0 | 0.0% |
| Total | 1,860 | 100.0% |
Employment Status by Age in Lake of the Pines
According to the labor force statistics for Lake of the Pines, out of the total population over 16 years of age (4,009), 50.3% or 2,017 individuals are in the labor force, with 3.4% or 69 of them unemployed. The age group with the highest labor force participation rate is 25 to 29 years, with 100.0% or 159 individuals in the labor force. Within the labor force, the 55 to 59 years age range has the highest percentage of unemployed individuals, with 12.1% or 29 of them being unemployed.
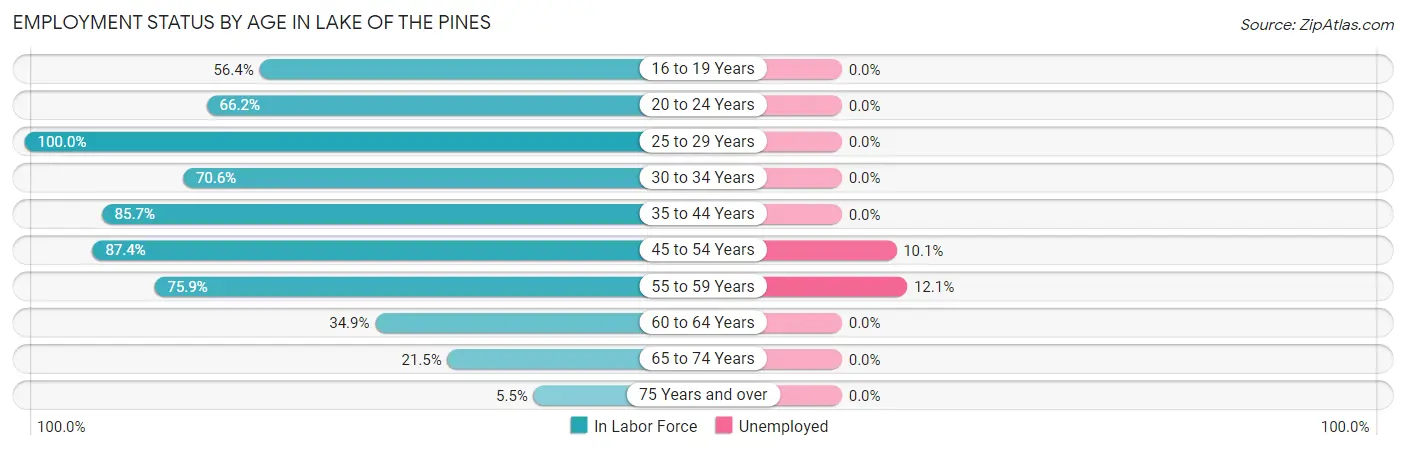
| Age Bracket | In Labor Force | Unemployed |
| 16 to 19 Years | 133 (56.4%) | 0 (0.0%) |
| 20 to 24 Years | 86 (66.2%) | 0 (0.0%) |
| 25 to 29 Years | 159 (100.0%) | 0 (0.0%) |
| 30 to 34 Years | 204 (70.6%) | 0 (0.0%) |
| 35 to 44 Years | 389 (85.7%) | 0 (0.0%) |
| 45 to 54 Years | 397 (87.4%) | 40 (10.1%) |
| 55 to 59 Years | 239 (75.9%) | 29 (12.1%) |
| 60 to 64 Years | 187 (34.9%) | 0 (0.0%) |
| 65 to 74 Years | 194 (21.5%) | 0 (0.0%) |
| 75 Years and over | 29 (5.5%) | 0 (0.0%) |
| Total | 2,017 (50.3%) | 69 (3.4%) |
Employment Status by Educational Attainment in Lake of the Pines
According to labor force statistics for Lake of the Pines, 71.4% of individuals (1,576) out of the total population between 25 and 64 years of age (2,207) are in the labor force, with 4.4% or 69 of them being unemployed. The group with the highest labor force participation rate are those with the educational attainment of high school diploma, with 80.0% or 447 individuals in the labor force. Within the labor force, individuals with college / associate degree education have the highest percentage of unemployment, with 7.6% or 40 of them being unemployed.
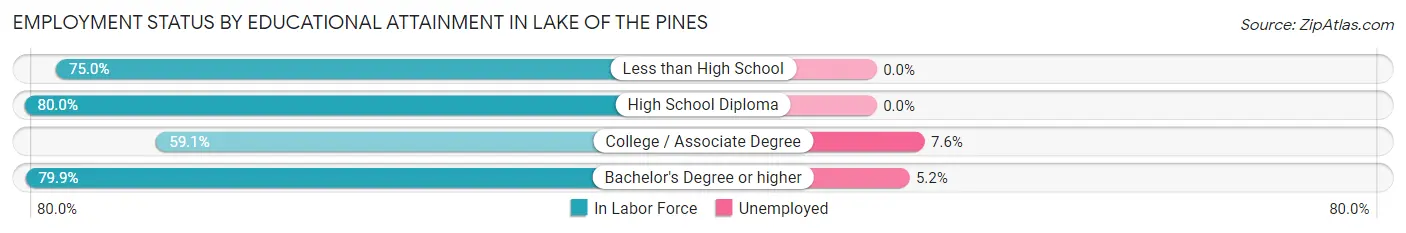
| Educational Attainment | In Labor Force | Unemployed |
| Less than High School | 39 (75.0%) | 0 (0.0%) |
| High School Diploma | 447 (80.0%) | 0 (0.0%) |
| College / Associate Degree | 529 (59.1%) | 68 (7.6%) |
| Bachelor's Degree or higher | 560 (79.9%) | 36 (5.2%) |
| Total | 1,576 (71.4%) | 97 (4.4%) |
Employment Occupations by Sex in Lake of the Pines
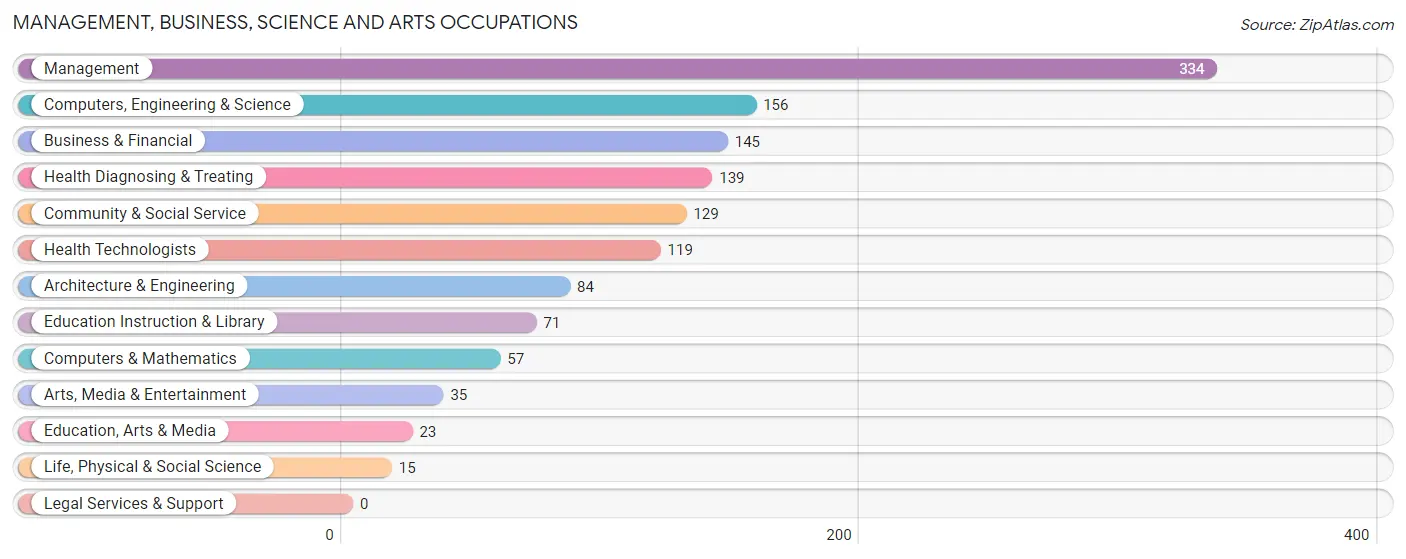
Management, Business, Science and Arts Occupations
The most common Management, Business, Science and Arts occupations in Lake of the Pines are Management (334 | 17.2%), Computers, Engineering & Science (156 | 8.0%), Business & Financial (145 | 7.4%), Health Diagnosing & Treating (139 | 7.1%), and Community & Social Service (129 | 6.6%).
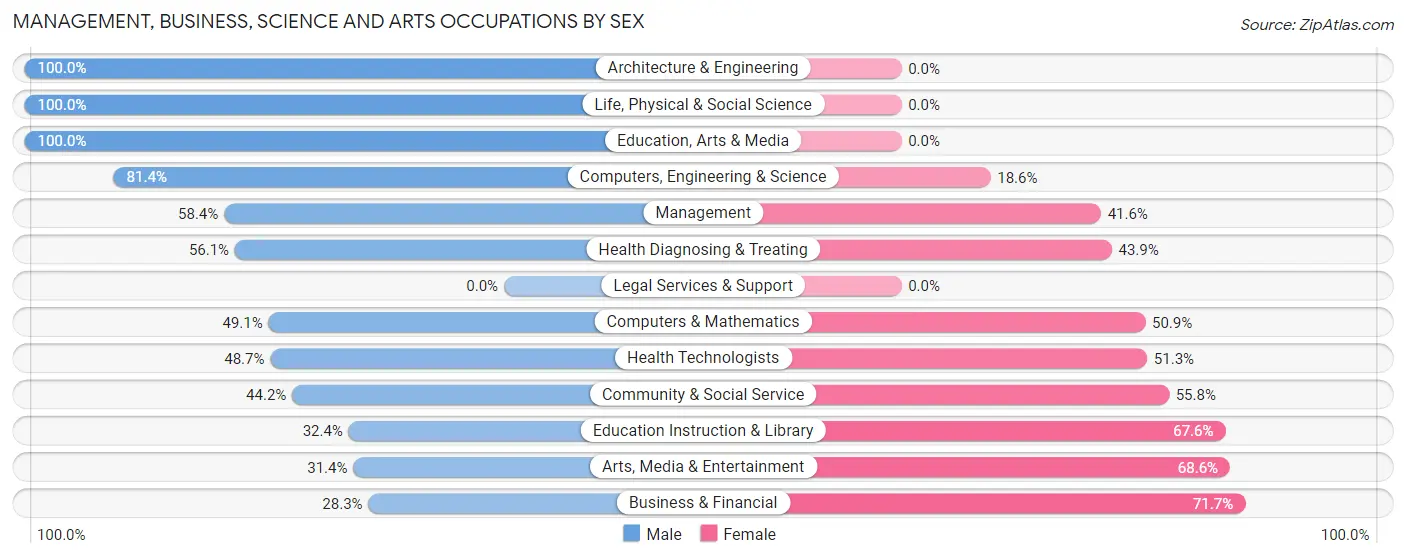
Management, Business, Science and Arts Occupations by Sex
Within the Management, Business, Science and Arts occupations in Lake of the Pines, the most male-oriented occupations are Architecture & Engineering (100.0%), Life, Physical & Social Science (100.0%), and Education, Arts & Media (100.0%), while the most female-oriented occupations are Business & Financial (71.7%), Arts, Media & Entertainment (68.6%), and Education Instruction & Library (67.6%).
| Occupation | Male | Female |
| Management | 195 (58.4%) | 139 (41.6%) |
| Business & Financial | 41 (28.3%) | 104 (71.7%) |
| Computers, Engineering & Science | 127 (81.4%) | 29 (18.6%) |
| Computers & Mathematics | 28 (49.1%) | 29 (50.9%) |
| Architecture & Engineering | 84 (100.0%) | 0 (0.0%) |
| Life, Physical & Social Science | 15 (100.0%) | 0 (0.0%) |
| Community & Social Service | 57 (44.2%) | 72 (55.8%) |
| Education, Arts & Media | 23 (100.0%) | 0 (0.0%) |
| Legal Services & Support | 0 (0.0%) | 0 (0.0%) |
| Education Instruction & Library | 23 (32.4%) | 48 (67.6%) |
| Arts, Media & Entertainment | 11 (31.4%) | 24 (68.6%) |
| Health Diagnosing & Treating | 78 (56.1%) | 61 (43.9%) |
| Health Technologists | 58 (48.7%) | 61 (51.3%) |
| Total (Category) | 498 (55.1%) | 405 (44.9%) |
| Total (Overall) | 1,093 (56.1%) | 855 (43.9%) |
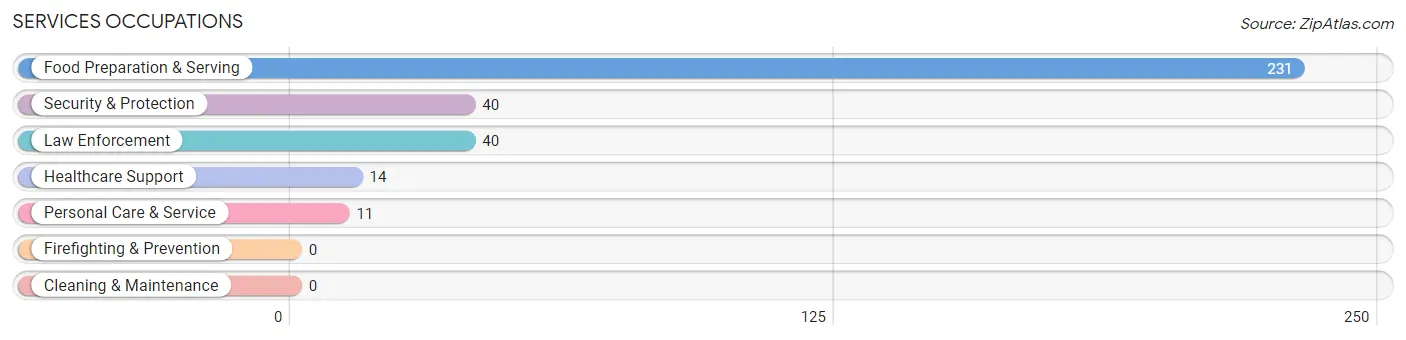
Services Occupations
The most common Services occupations in Lake of the Pines are Food Preparation & Serving (231 | 11.9%), Security & Protection (40 | 2.1%), Law Enforcement (40 | 2.1%), Healthcare Support (14 | 0.7%), and Personal Care & Service (11 | 0.6%).
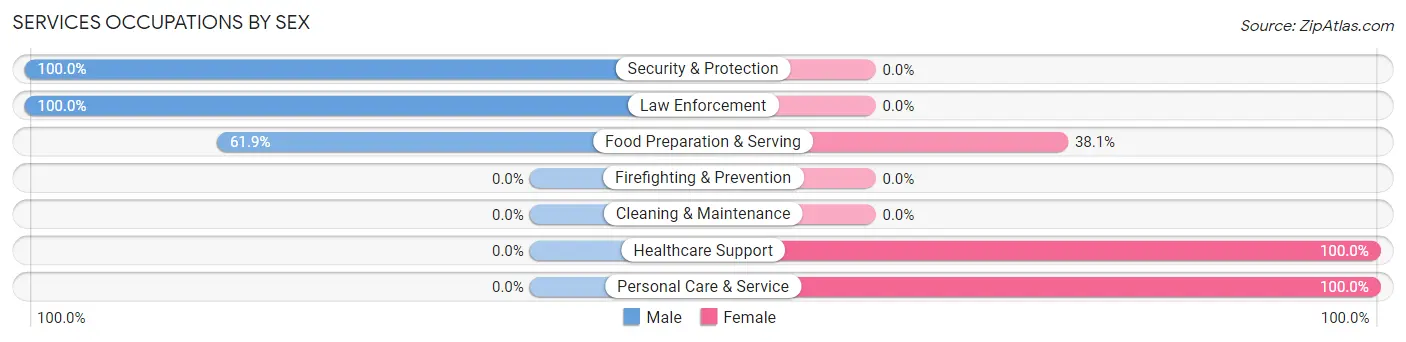
Services Occupations by Sex
Within the Services occupations in Lake of the Pines, the most male-oriented occupations are Security & Protection (100.0%), Law Enforcement (100.0%), and Food Preparation & Serving (61.9%), while the most female-oriented occupations are Healthcare Support (100.0%), Personal Care & Service (100.0%), and Food Preparation & Serving (38.1%).
| Occupation | Male | Female |
| Healthcare Support | 0 (0.0%) | 14 (100.0%) |
| Security & Protection | 40 (100.0%) | 0 (0.0%) |
| Firefighting & Prevention | 0 (0.0%) | 0 (0.0%) |
| Law Enforcement | 40 (100.0%) | 0 (0.0%) |
| Food Preparation & Serving | 143 (61.9%) | 88 (38.1%) |
| Cleaning & Maintenance | 0 (0.0%) | 0 (0.0%) |
| Personal Care & Service | 0 (0.0%) | 11 (100.0%) |
| Total (Category) | 183 (61.8%) | 113 (38.2%) |
| Total (Overall) | 1,093 (56.1%) | 855 (43.9%) |
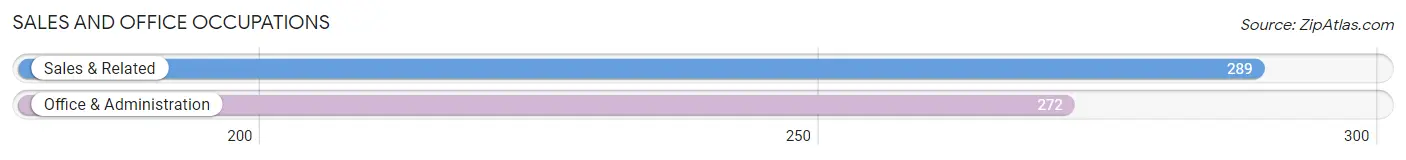
Sales and Office Occupations
The most common Sales and Office occupations in Lake of the Pines are Sales & Related (289 | 14.8%), and Office & Administration (272 | 14.0%).
Sales and Office Occupations by Sex
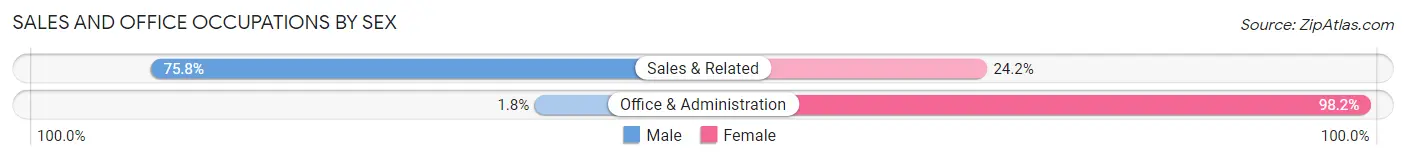
| Occupation | Male | Female |
| Sales & Related | 219 (75.8%) | 70 (24.2%) |
| Office & Administration | 5 (1.8%) | 267 (98.2%) |
| Total (Category) | 224 (39.9%) | 337 (60.1%) |
| Total (Overall) | 1,093 (56.1%) | 855 (43.9%) |
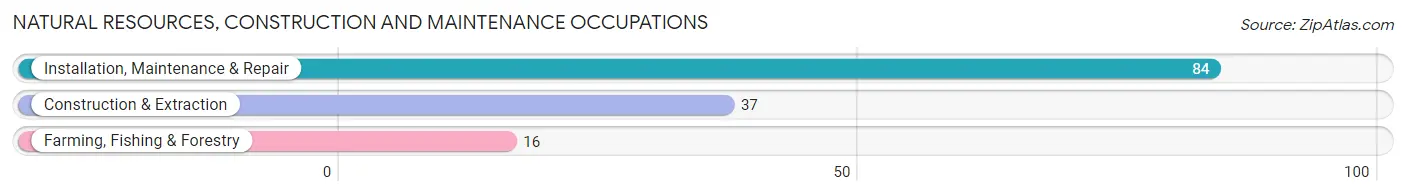
Natural Resources, Construction and Maintenance Occupations
The most common Natural Resources, Construction and Maintenance occupations in Lake of the Pines are Installation, Maintenance & Repair (84 | 4.3%), Construction & Extraction (37 | 1.9%), and Farming, Fishing & Forestry (16 | 0.8%).
Natural Resources, Construction and Maintenance Occupations by Sex
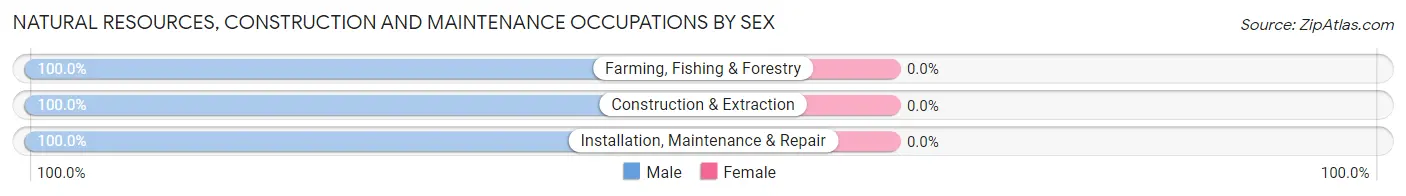
| Occupation | Male | Female |
| Farming, Fishing & Forestry | 16 (100.0%) | 0 (0.0%) |
| Construction & Extraction | 37 (100.0%) | 0 (0.0%) |
| Installation, Maintenance & Repair | 84 (100.0%) | 0 (0.0%) |
| Total (Category) | 137 (100.0%) | 0 (0.0%) |
| Total (Overall) | 1,093 (56.1%) | 855 (43.9%) |
Production, Transportation and Moving Occupations
The most common Production, Transportation and Moving occupations in Lake of the Pines are , and Transportation (51 | 2.6%).
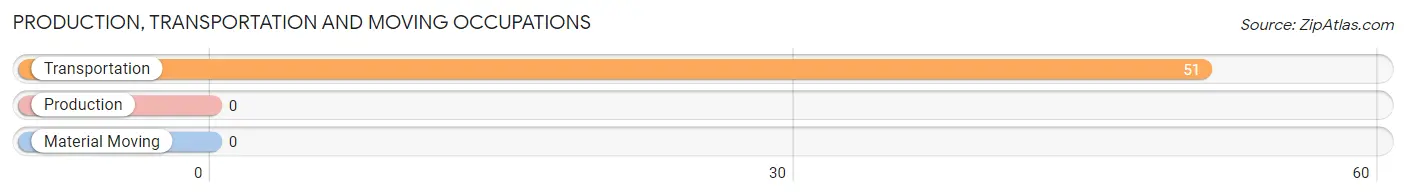
Production, Transportation and Moving Occupations by Sex
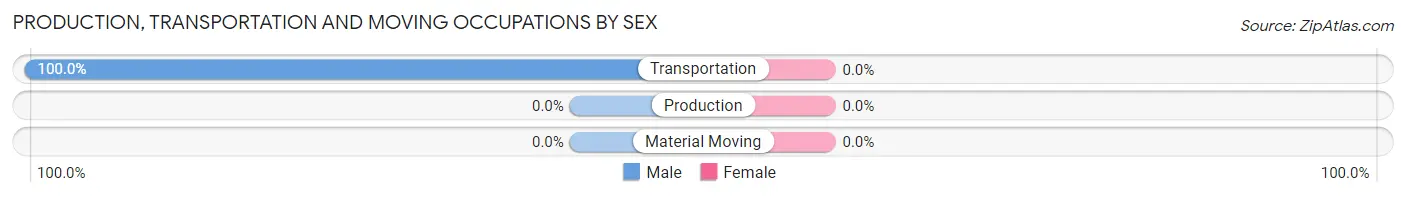
| Occupation | Male | Female |
| Production | 0 (0.0%) | 0 (0.0%) |
| Transportation | 51 (100.0%) | 0 (0.0%) |
| Material Moving | 0 (0.0%) | 0 (0.0%) |
| Total (Category) | 51 (100.0%) | 0 (0.0%) |
| Total (Overall) | 1,093 (56.1%) | 855 (43.9%) |
Employment Industries by Sex in Lake of the Pines
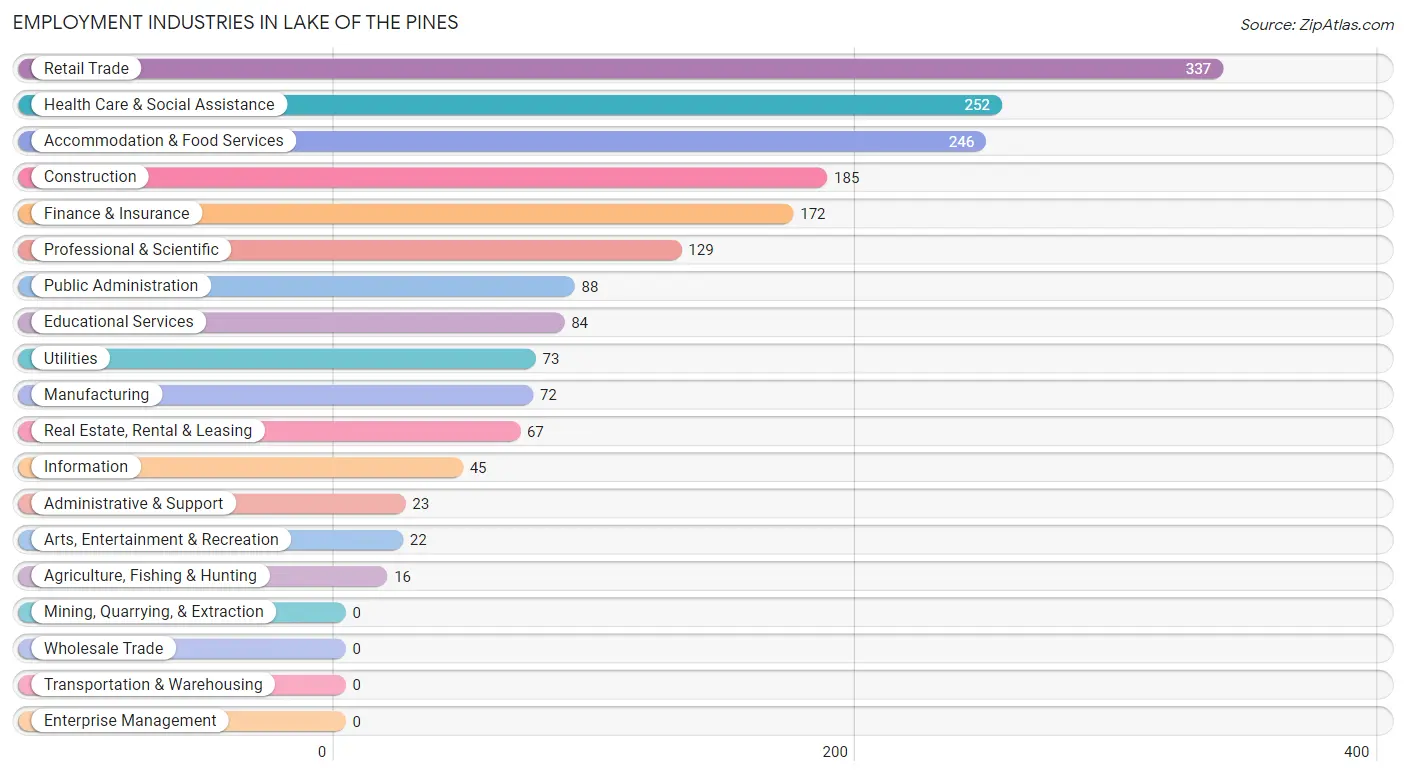
Employment Industries in Lake of the Pines
The major employment industries in Lake of the Pines include Retail Trade (337 | 17.3%), Health Care & Social Assistance (252 | 12.9%), Accommodation & Food Services (246 | 12.6%), Construction (185 | 9.5%), and Finance & Insurance (172 | 8.8%).
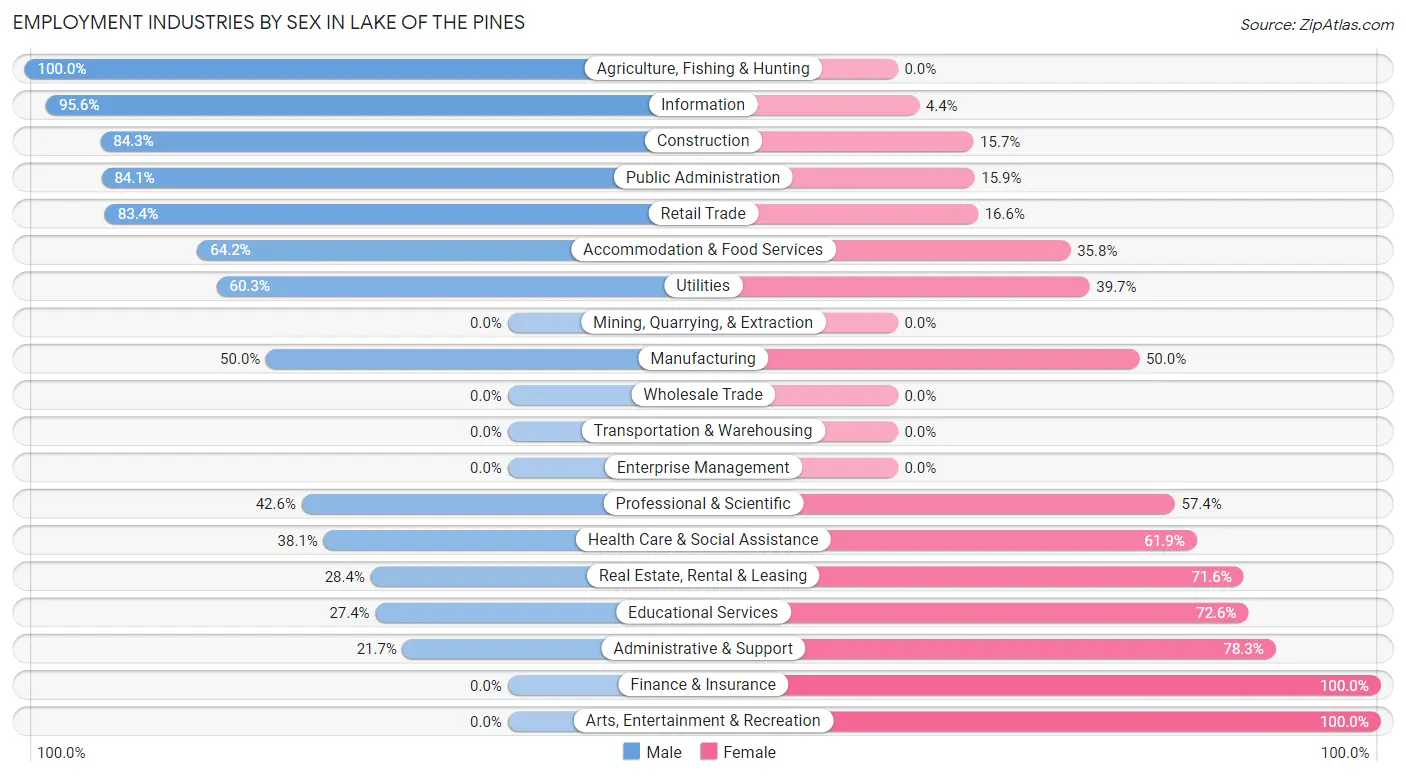
Employment Industries by Sex in Lake of the Pines
The Lake of the Pines industries that see more men than women are Agriculture, Fishing & Hunting (100.0%), Information (95.6%), and Construction (84.3%), whereas the industries that tend to have a higher number of women are Finance & Insurance (100.0%), Arts, Entertainment & Recreation (100.0%), and Administrative & Support (78.3%).
| Industry | Male | Female |
| Agriculture, Fishing & Hunting | 16 (100.0%) | 0 (0.0%) |
| Mining, Quarrying, & Extraction | 0 (0.0%) | 0 (0.0%) |
| Construction | 156 (84.3%) | 29 (15.7%) |
| Manufacturing | 36 (50.0%) | 36 (50.0%) |
| Wholesale Trade | 0 (0.0%) | 0 (0.0%) |
| Retail Trade | 281 (83.4%) | 56 (16.6%) |
| Transportation & Warehousing | 0 (0.0%) | 0 (0.0%) |
| Utilities | 44 (60.3%) | 29 (39.7%) |
| Information | 43 (95.6%) | 2 (4.4%) |
| Finance & Insurance | 0 (0.0%) | 172 (100.0%) |
| Real Estate, Rental & Leasing | 19 (28.4%) | 48 (71.6%) |
| Professional & Scientific | 55 (42.6%) | 74 (57.4%) |
| Enterprise Management | 0 (0.0%) | 0 (0.0%) |
| Administrative & Support | 5 (21.7%) | 18 (78.3%) |
| Educational Services | 23 (27.4%) | 61 (72.6%) |
| Health Care & Social Assistance | 96 (38.1%) | 156 (61.9%) |
| Arts, Entertainment & Recreation | 0 (0.0%) | 22 (100.0%) |
| Accommodation & Food Services | 158 (64.2%) | 88 (35.8%) |
| Public Administration | 74 (84.1%) | 14 (15.9%) |
| Total | 1,093 (56.1%) | 855 (43.9%) |
Education in Lake of the Pines
School Enrollment in Lake of the Pines
The most common levels of schooling among the 930 students in Lake of the Pines are middle school (329 | 35.4%), high school (215 | 23.1%), and elementary school (193 | 20.7%).
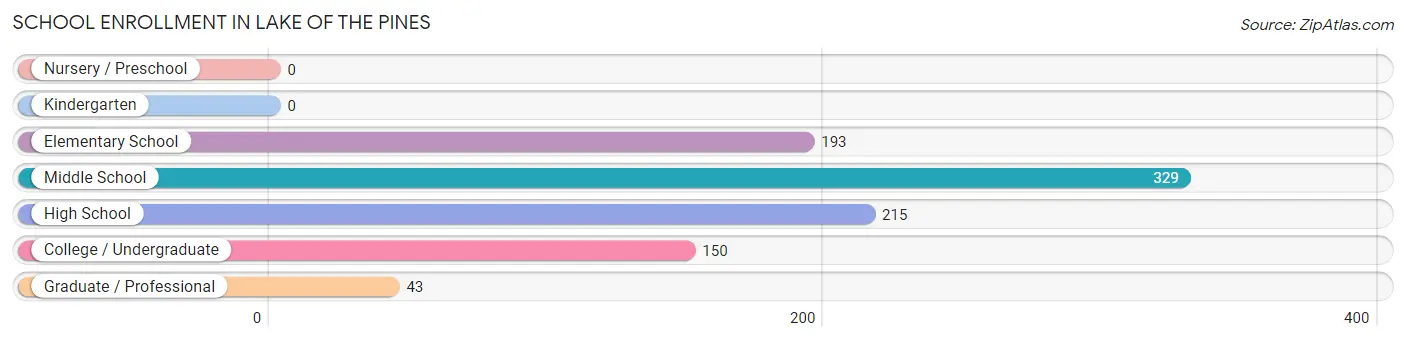
| School Level | # Students | % Students |
| Nursery / Preschool | 0 | 0.0% |
| Kindergarten | 0 | 0.0% |
| Elementary School | 193 | 20.7% |
| Middle School | 329 | 35.4% |
| High School | 215 | 23.1% |
| College / Undergraduate | 150 | 16.1% |
| Graduate / Professional | 43 | 4.6% |
| Total | 930 | 100.0% |
School Enrollment by Age by Funding Source in Lake of the Pines
Out of a total of 930 students who are enrolled in schools in Lake of the Pines, 182 (19.6%) attend a private institution, while the remaining 748 (80.4%) are enrolled in public schools. The age group of 10 to 14 year olds has the highest likelihood of being enrolled in private schools, with 139 (38.3% in the age bracket) enrolled. Conversely, the age group of 5 to 9 year old has the lowest likelihood of being enrolled in a private school, with 163 (100.0% in the age bracket) attending a public institution.
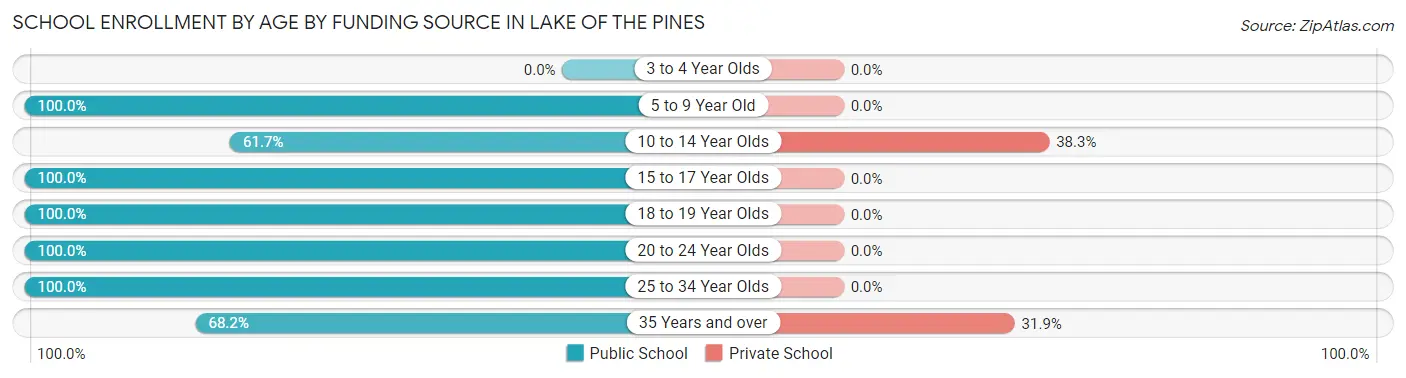
| Age Bracket | Public School | Private School |
| 3 to 4 Year Olds | 0 (0.0%) | 0 (0.0%) |
| 5 to 9 Year Old | 163 (100.0%) | 0 (0.0%) |
| 10 to 14 Year Olds | 224 (61.7%) | 139 (38.3%) |
| 15 to 17 Year Olds | 143 (100.0%) | 0 (0.0%) |
| 18 to 19 Year Olds | 68 (100.0%) | 0 (0.0%) |
| 20 to 24 Year Olds | 15 (100.0%) | 0 (0.0%) |
| 25 to 34 Year Olds | 43 (100.0%) | 0 (0.0%) |
| 35 Years and over | 92 (68.1%) | 43 (31.9%) |
| Total | 748 (80.4%) | 182 (19.6%) |
Educational Attainment by Field of Study in Lake of the Pines
Business (252 | 17.7%), visual & performing arts (159 | 11.1%), liberal arts & history (155 | 10.9%), science & technology (153 | 10.7%), and psychology (114 | 8.0%) are the most common fields of study among 1,427 individuals in Lake of the Pines who have obtained a bachelor's degree or higher.
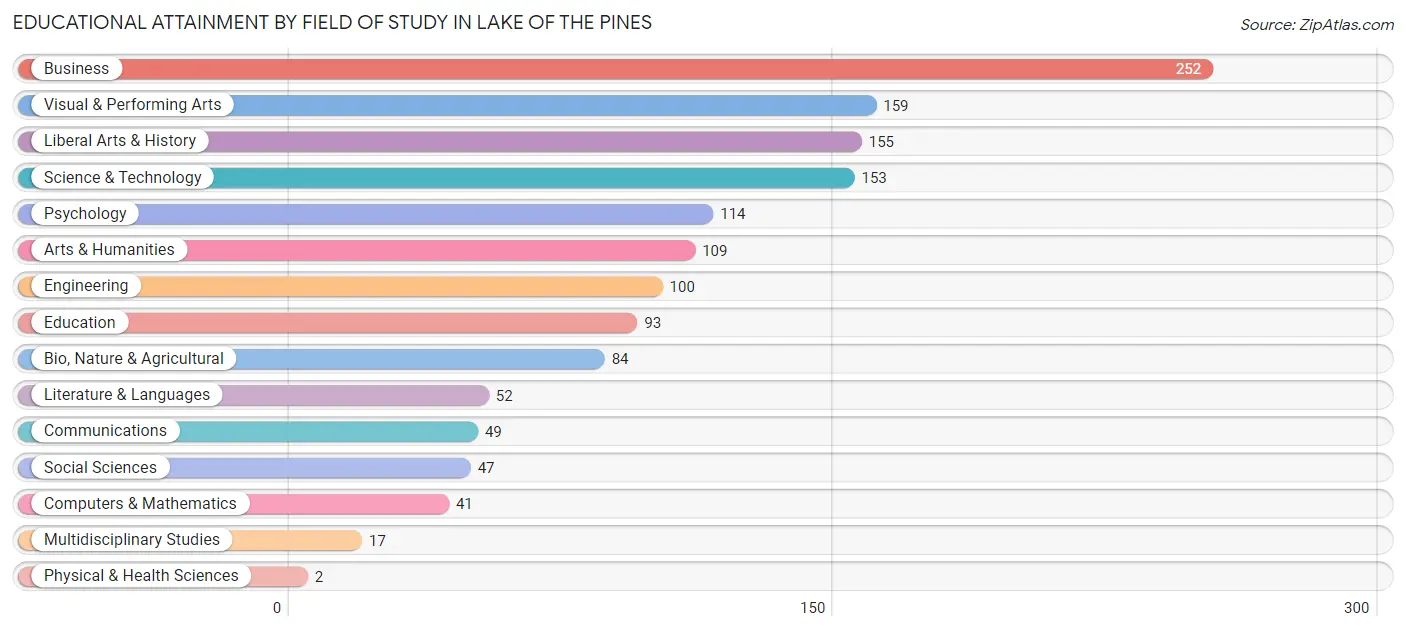
| Field of Study | # Graduates | % Graduates |
| Computers & Mathematics | 41 | 2.9% |
| Bio, Nature & Agricultural | 84 | 5.9% |
| Physical & Health Sciences | 2 | 0.1% |
| Psychology | 114 | 8.0% |
| Social Sciences | 47 | 3.3% |
| Engineering | 100 | 7.0% |
| Multidisciplinary Studies | 17 | 1.2% |
| Science & Technology | 153 | 10.7% |
| Business | 252 | 17.7% |
| Education | 93 | 6.5% |
| Literature & Languages | 52 | 3.6% |
| Liberal Arts & History | 155 | 10.9% |
| Visual & Performing Arts | 159 | 11.1% |
| Communications | 49 | 3.4% |
| Arts & Humanities | 109 | 7.6% |
| Total | 1,427 | 100.0% |
Transportation & Commute in Lake of the Pines
Vehicle Availability by Sex in Lake of the Pines
The most prevalent vehicle ownership categories in Lake of the Pines are males with 2 vehicles (520, accounting for 47.6%) and females with 2 vehicles (331, making up 67.8%).
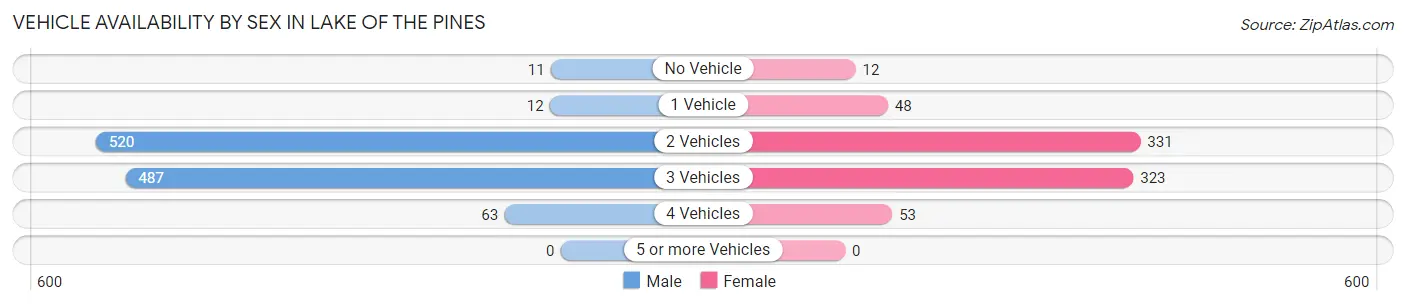
| Vehicles Available | Male | Female |
| No Vehicle | 11 (1.0%) | 12 (1.6%) |
| 1 Vehicle | 12 (1.1%) | 48 (6.3%) |
| 2 Vehicles | 520 (47.6%) | 331 (43.2%) |
| 3 Vehicles | 487 (44.6%) | 323 (42.1%) |
| 4 Vehicles | 63 (5.8%) | 53 (6.9%) |
| 5 or more Vehicles | 0 (0.0%) | 0 (0.0%) |
| Total | 1,093 (100.0%) | 767 (100.0%) |
Commute Time in Lake of the Pines
The most frequently occuring commute durations in Lake of the Pines are 25 to 29 minutes (294 commuters, 19.7%), 10 to 14 minutes (241 commuters, 16.2%), and 45 to 59 minutes (185 commuters, 12.4%).
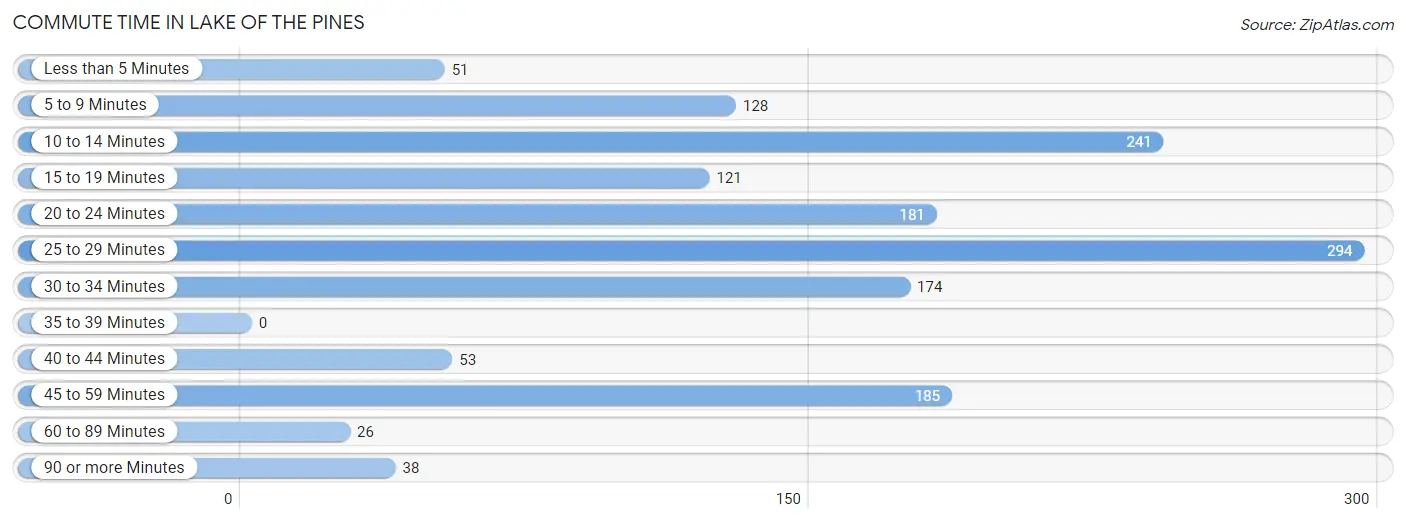
| Commute Time | # Commuters | % Commuters |
| Less than 5 Minutes | 51 | 3.4% |
| 5 to 9 Minutes | 128 | 8.6% |
| 10 to 14 Minutes | 241 | 16.2% |
| 15 to 19 Minutes | 121 | 8.1% |
| 20 to 24 Minutes | 181 | 12.1% |
| 25 to 29 Minutes | 294 | 19.7% |
| 30 to 34 Minutes | 174 | 11.7% |
| 35 to 39 Minutes | 0 | 0.0% |
| 40 to 44 Minutes | 53 | 3.5% |
| 45 to 59 Minutes | 185 | 12.4% |
| 60 to 89 Minutes | 26 | 1.7% |
| 90 or more Minutes | 38 | 2.5% |
Commute Time by Sex in Lake of the Pines
The most common commute times in Lake of the Pines are 25 to 29 minutes (219 commuters, 22.0%) for males and 10 to 14 minutes (150 commuters, 30.1%) for females.
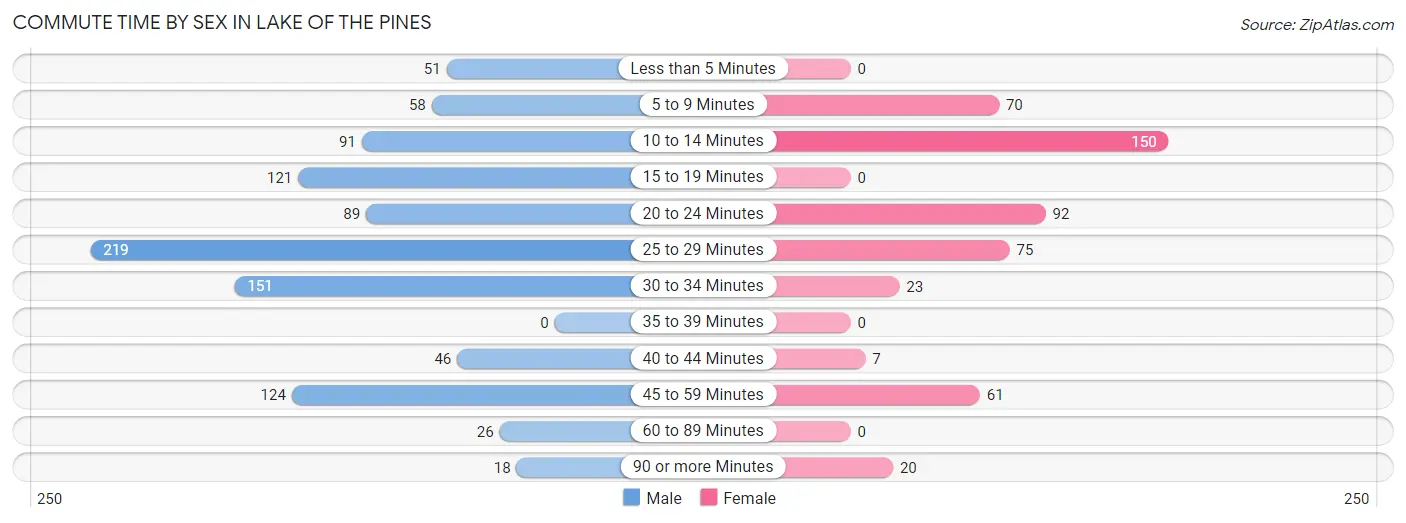
| Commute Time | Male | Female |
| Less than 5 Minutes | 51 (5.1%) | 0 (0.0%) |
| 5 to 9 Minutes | 58 (5.8%) | 70 (14.1%) |
| 10 to 14 Minutes | 91 (9.1%) | 150 (30.1%) |
| 15 to 19 Minutes | 121 (12.2%) | 0 (0.0%) |
| 20 to 24 Minutes | 89 (8.9%) | 92 (18.5%) |
| 25 to 29 Minutes | 219 (22.0%) | 75 (15.1%) |
| 30 to 34 Minutes | 151 (15.2%) | 23 (4.6%) |
| 35 to 39 Minutes | 0 (0.0%) | 0 (0.0%) |
| 40 to 44 Minutes | 46 (4.6%) | 7 (1.4%) |
| 45 to 59 Minutes | 124 (12.5%) | 61 (12.2%) |
| 60 to 89 Minutes | 26 (2.6%) | 0 (0.0%) |
| 90 or more Minutes | 18 (1.8%) | 20 (4.0%) |
Time of Departure to Work by Sex in Lake of the Pines
The most frequent times of departure to work in Lake of the Pines are 6:00 AM to 6:29 AM (244, 24.5%) for males and 9:00 AM to 9:59 AM (196, 39.4%) for females.
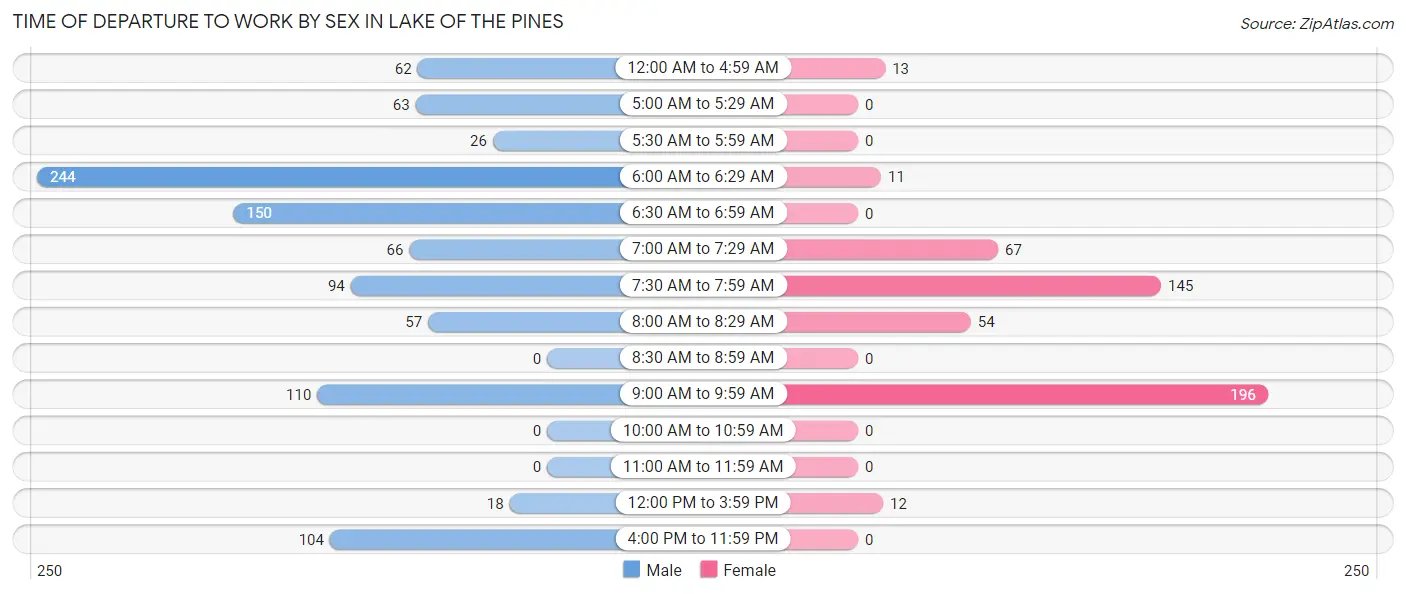
| Time of Departure | Male | Female |
| 12:00 AM to 4:59 AM | 62 (6.2%) | 13 (2.6%) |
| 5:00 AM to 5:29 AM | 63 (6.3%) | 0 (0.0%) |
| 5:30 AM to 5:59 AM | 26 (2.6%) | 0 (0.0%) |
| 6:00 AM to 6:29 AM | 244 (24.5%) | 11 (2.2%) |
| 6:30 AM to 6:59 AM | 150 (15.1%) | 0 (0.0%) |
| 7:00 AM to 7:29 AM | 66 (6.6%) | 67 (13.5%) |
| 7:30 AM to 7:59 AM | 94 (9.5%) | 145 (29.1%) |
| 8:00 AM to 8:29 AM | 57 (5.7%) | 54 (10.8%) |
| 8:30 AM to 8:59 AM | 0 (0.0%) | 0 (0.0%) |
| 9:00 AM to 9:59 AM | 110 (11.1%) | 196 (39.4%) |
| 10:00 AM to 10:59 AM | 0 (0.0%) | 0 (0.0%) |
| 11:00 AM to 11:59 AM | 0 (0.0%) | 0 (0.0%) |
| 12:00 PM to 3:59 PM | 18 (1.8%) | 12 (2.4%) |
| 4:00 PM to 11:59 PM | 104 (10.5%) | 0 (0.0%) |
| Total | 994 (100.0%) | 498 (100.0%) |
Housing Occupancy in Lake of the Pines
Occupancy by Ownership in Lake of the Pines
Of the total 1,916 dwellings in Lake of the Pines, owner-occupied units account for 1,704 (88.9%), while renter-occupied units make up 212 (11.1%).
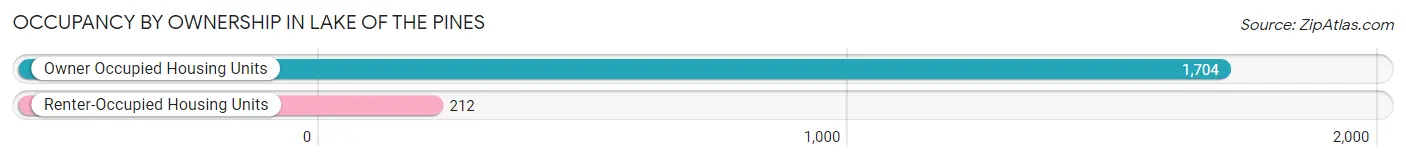
| Occupancy | # Housing Units | % Housing Units |
| Owner Occupied Housing Units | 1,704 | 88.9% |
| Renter-Occupied Housing Units | 212 | 11.1% |
| Total Occupied Housing Units | 1,916 | 100.0% |
Occupancy by Household Size in Lake of the Pines
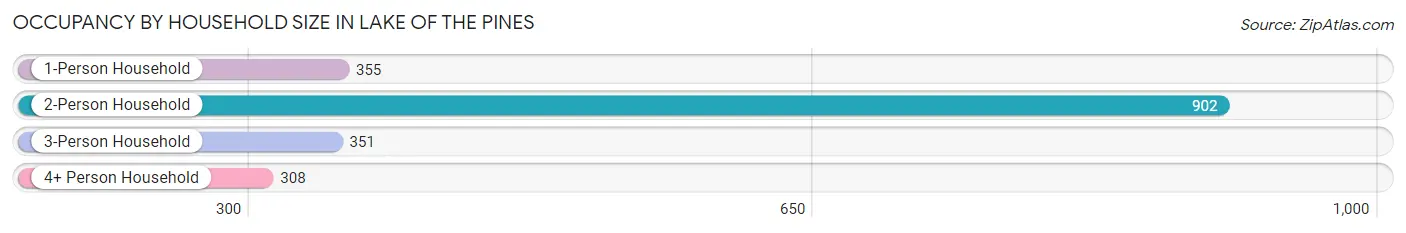
| Household Size | # Housing Units | % Housing Units |
| 1-Person Household | 355 | 18.5% |
| 2-Person Household | 902 | 47.1% |
| 3-Person Household | 351 | 18.3% |
| 4+ Person Household | 308 | 16.1% |
| Total Housing Units | 1,916 | 100.0% |
Occupancy by Ownership by Household Size in Lake of the Pines
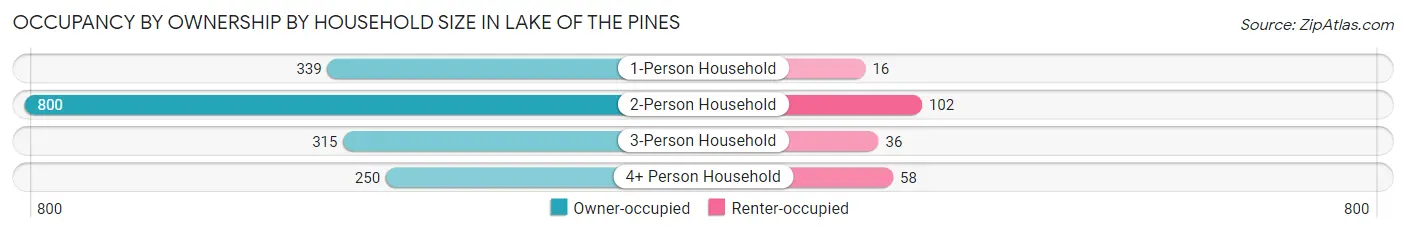
| Household Size | Owner-occupied | Renter-occupied |
| 1-Person Household | 339 (95.5%) | 16 (4.5%) |
| 2-Person Household | 800 (88.7%) | 102 (11.3%) |
| 3-Person Household | 315 (89.7%) | 36 (10.3%) |
| 4+ Person Household | 250 (81.2%) | 58 (18.8%) |
| Total Housing Units | 1,704 (88.9%) | 212 (11.1%) |
Occupancy by Educational Attainment in Lake of the Pines
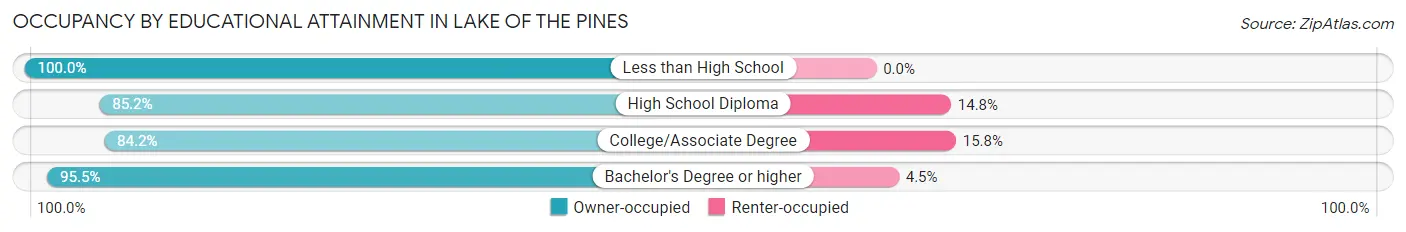
| Household Size | Owner-occupied | Renter-occupied |
| Less than High School | 40 (100.0%) | 0 (0.0%) |
| High School Diploma | 299 (85.2%) | 52 (14.8%) |
| College/Associate Degree | 683 (84.2%) | 128 (15.8%) |
| Bachelor's Degree or higher | 682 (95.5%) | 32 (4.5%) |
Occupancy by Age of Householder in Lake of the Pines
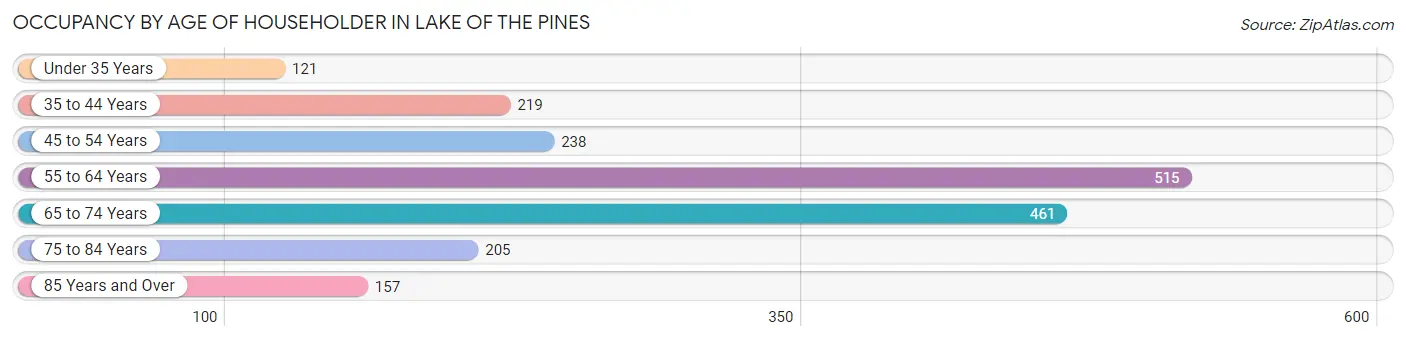
| Age Bracket | # Households | % Households |
| Under 35 Years | 121 | 6.3% |
| 35 to 44 Years | 219 | 11.4% |
| 45 to 54 Years | 238 | 12.4% |
| 55 to 64 Years | 515 | 26.9% |
| 65 to 74 Years | 461 | 24.1% |
| 75 to 84 Years | 205 | 10.7% |
| 85 Years and Over | 157 | 8.2% |
| Total | 1,916 | 100.0% |
Housing Finances in Lake of the Pines
Median Income by Occupancy in Lake of the Pines
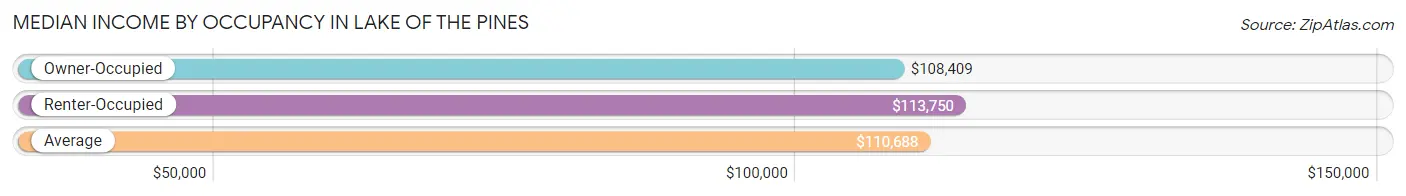
| Occupancy Type | # Households | Median Income |
| Owner-Occupied | 1,704 (88.9%) | $108,409 |
| Renter-Occupied | 212 (11.1%) | $113,750 |
| Average | 1,916 (100.0%) | $110,688 |
Occupancy by Householder Income Bracket in Lake of the Pines
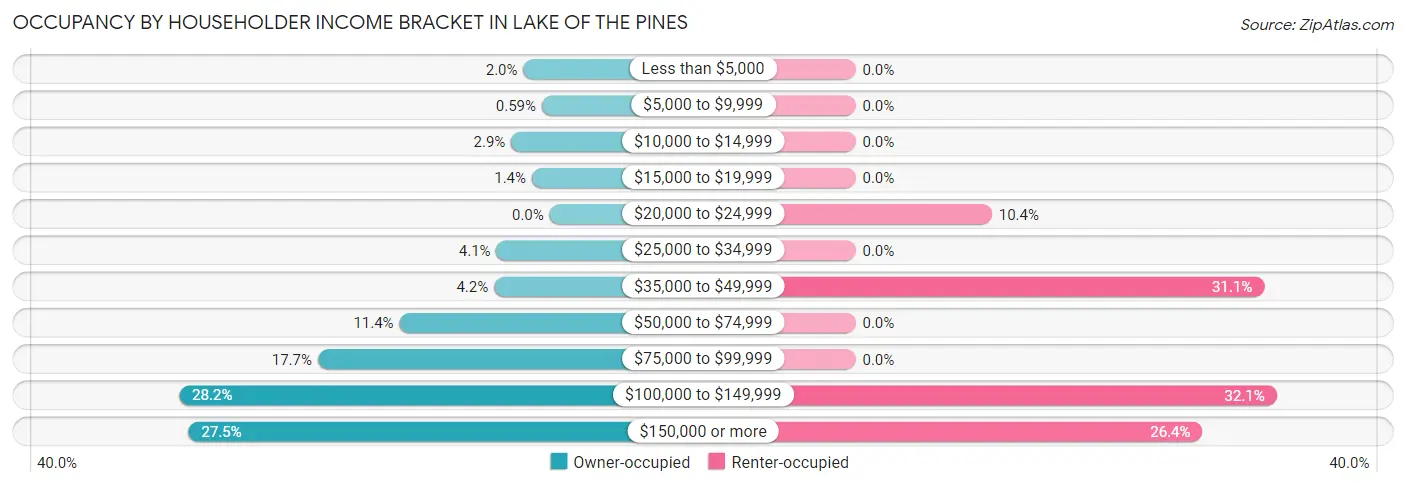
| Income Bracket | Owner-occupied | Renter-occupied |
| Less than $5,000 | 34 (2.0%) | 0 (0.0%) |
| $5,000 to $9,999 | 10 (0.6%) | 0 (0.0%) |
| $10,000 to $14,999 | 50 (2.9%) | 0 (0.0%) |
| $15,000 to $19,999 | 23 (1.3%) | 0 (0.0%) |
| $20,000 to $24,999 | 0 (0.0%) | 22 (10.4%) |
| $25,000 to $34,999 | 69 (4.1%) | 0 (0.0%) |
| $35,000 to $49,999 | 72 (4.2%) | 66 (31.1%) |
| $50,000 to $74,999 | 195 (11.4%) | 0 (0.0%) |
| $75,000 to $99,999 | 301 (17.7%) | 0 (0.0%) |
| $100,000 to $149,999 | 481 (28.2%) | 68 (32.1%) |
| $150,000 or more | 469 (27.5%) | 56 (26.4%) |
| Total | 1,704 (100.0%) | 212 (100.0%) |
Monthly Housing Cost Tiers in Lake of the Pines
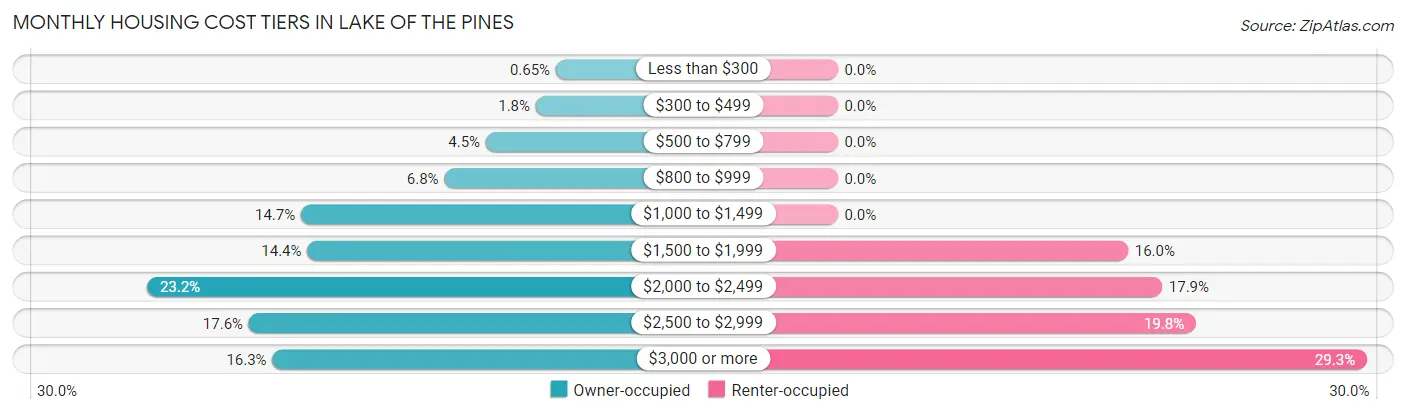
| Monthly Cost | Owner-occupied | Renter-occupied |
| Less than $300 | 11 (0.6%) | 0 (0.0%) |
| $300 to $499 | 30 (1.8%) | 0 (0.0%) |
| $500 to $799 | 77 (4.5%) | 0 (0.0%) |
| $800 to $999 | 116 (6.8%) | 0 (0.0%) |
| $1,000 to $1,499 | 251 (14.7%) | 0 (0.0%) |
| $1,500 to $1,999 | 245 (14.4%) | 34 (16.0%) |
| $2,000 to $2,499 | 396 (23.2%) | 38 (17.9%) |
| $2,500 to $2,999 | 300 (17.6%) | 42 (19.8%) |
| $3,000 or more | 278 (16.3%) | 62 (29.2%) |
| Total | 1,704 (100.0%) | 212 (100.0%) |
Physical Housing Characteristics in Lake of the Pines
Housing Structures in Lake of the Pines
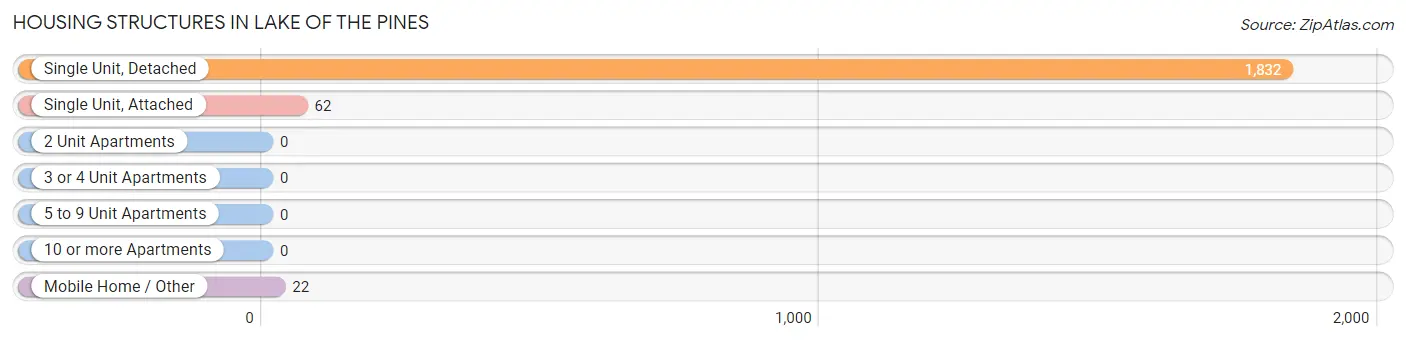
| Structure Type | # Housing Units | % Housing Units |
| Single Unit, Detached | 1,832 | 95.6% |
| Single Unit, Attached | 62 | 3.2% |
| 2 Unit Apartments | 0 | 0.0% |
| 3 or 4 Unit Apartments | 0 | 0.0% |
| 5 to 9 Unit Apartments | 0 | 0.0% |
| 10 or more Apartments | 0 | 0.0% |
| Mobile Home / Other | 22 | 1.1% |
| Total | 1,916 | 100.0% |
Housing Structures by Occupancy in Lake of the Pines
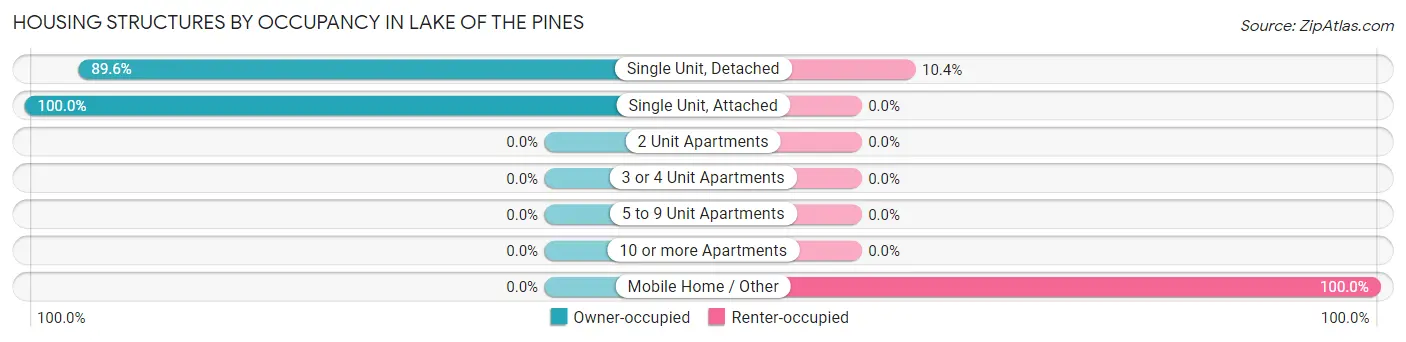
| Structure Type | Owner-occupied | Renter-occupied |
| Single Unit, Detached | 1,642 (89.6%) | 190 (10.4%) |
| Single Unit, Attached | 62 (100.0%) | 0 (0.0%) |
| 2 Unit Apartments | 0 (0.0%) | 0 (0.0%) |
| 3 or 4 Unit Apartments | 0 (0.0%) | 0 (0.0%) |
| 5 to 9 Unit Apartments | 0 (0.0%) | 0 (0.0%) |
| 10 or more Apartments | 0 (0.0%) | 0 (0.0%) |
| Mobile Home / Other | 0 (0.0%) | 22 (100.0%) |
| Total | 1,704 (88.9%) | 212 (11.1%) |
Housing Structures by Number of Rooms in Lake of the Pines
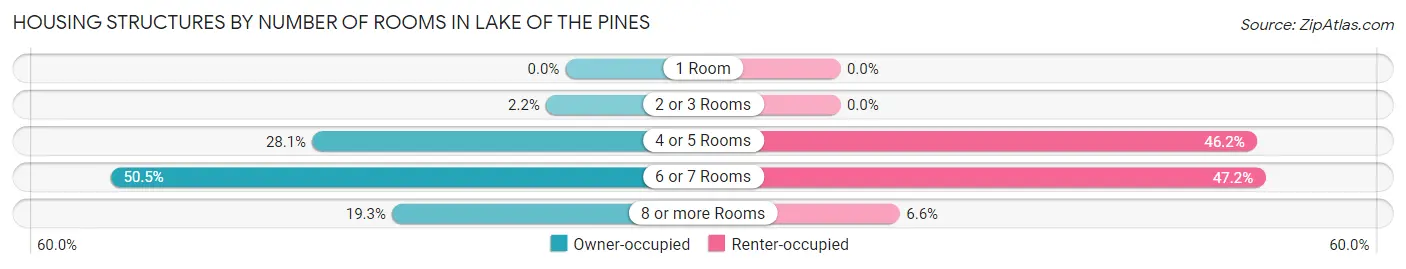
| Number of Rooms | Owner-occupied | Renter-occupied |
| 1 Room | 0 (0.0%) | 0 (0.0%) |
| 2 or 3 Rooms | 37 (2.2%) | 0 (0.0%) |
| 4 or 5 Rooms | 479 (28.1%) | 98 (46.2%) |
| 6 or 7 Rooms | 860 (50.5%) | 100 (47.2%) |
| 8 or more Rooms | 328 (19.3%) | 14 (6.6%) |
| Total | 1,704 (100.0%) | 212 (100.0%) |
Housing Structure by Heating Type in Lake of the Pines
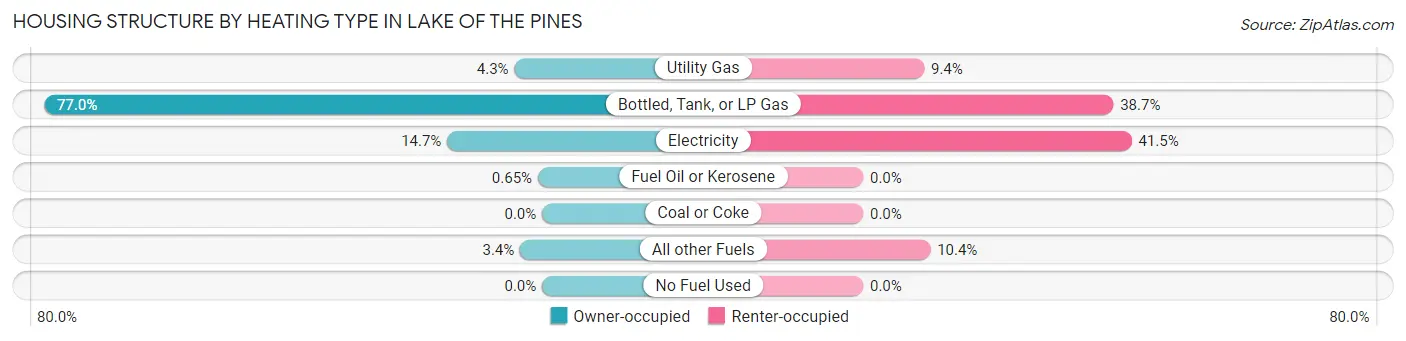
| Heating Type | Owner-occupied | Renter-occupied |
| Utility Gas | 73 (4.3%) | 20 (9.4%) |
| Bottled, Tank, or LP Gas | 1,312 (77.0%) | 82 (38.7%) |
| Electricity | 250 (14.7%) | 88 (41.5%) |
| Fuel Oil or Kerosene | 11 (0.6%) | 0 (0.0%) |
| Coal or Coke | 0 (0.0%) | 0 (0.0%) |
| All other Fuels | 58 (3.4%) | 22 (10.4%) |
| No Fuel Used | 0 (0.0%) | 0 (0.0%) |
| Total | 1,704 (100.0%) | 212 (100.0%) |
Household Vehicle Usage in Lake of the Pines
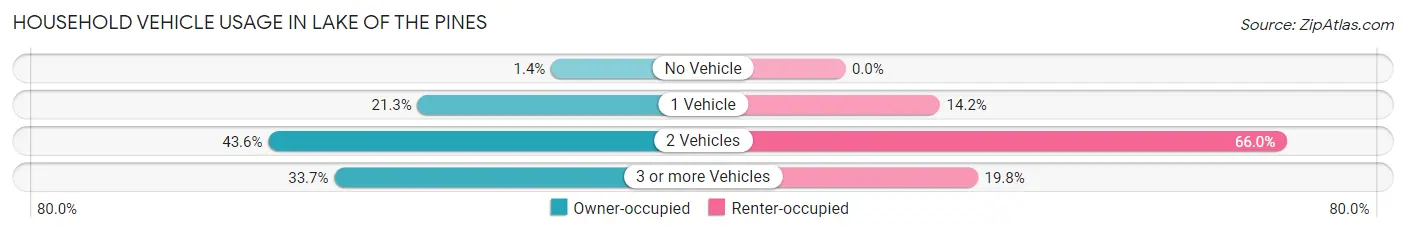
| Vehicles per Household | Owner-occupied | Renter-occupied |
| No Vehicle | 23 (1.3%) | 0 (0.0%) |
| 1 Vehicle | 363 (21.3%) | 30 (14.1%) |
| 2 Vehicles | 743 (43.6%) | 140 (66.0%) |
| 3 or more Vehicles | 575 (33.7%) | 42 (19.8%) |
| Total | 1,704 (100.0%) | 212 (100.0%) |
Real Estate & Mortgages in Lake of the Pines
Real Estate and Mortgage Overview in Lake of the Pines
| Characteristic | Without Mortgage | With Mortgage |
| Housing Units | 476 | 1,228 |
| Median Property Value | $624,300 | $599,400 |
| Median Household Income | $98,043 | $378 |
| Monthly Housing Costs | $1,127 | $278 |
| Real Estate Taxes | $5,964 | $0 |
Property Value by Mortgage Status in Lake of the Pines
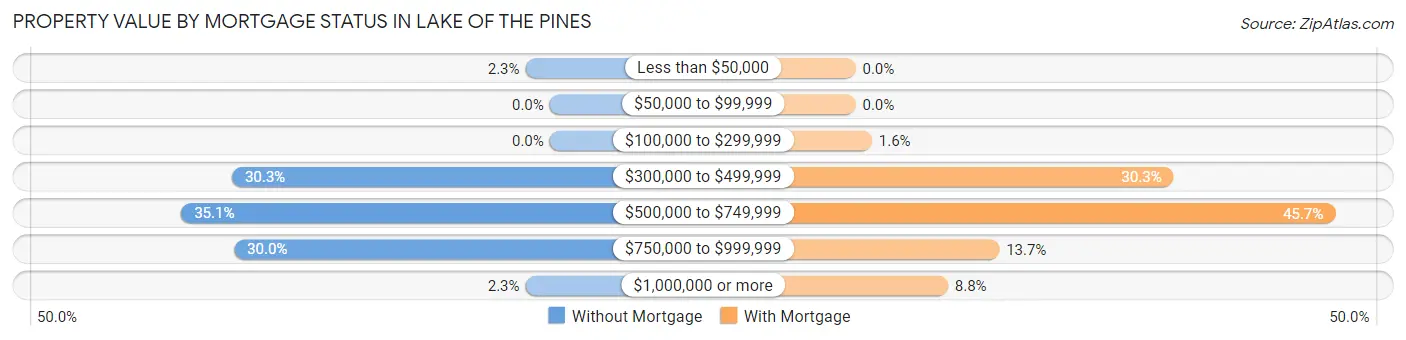
| Property Value | Without Mortgage | With Mortgage |
| Less than $50,000 | 11 (2.3%) | 0 (0.0%) |
| $50,000 to $99,999 | 0 (0.0%) | 0 (0.0%) |
| $100,000 to $299,999 | 0 (0.0%) | 19 (1.5%) |
| $300,000 to $499,999 | 144 (30.2%) | 372 (30.3%) |
| $500,000 to $749,999 | 167 (35.1%) | 561 (45.7%) |
| $750,000 to $999,999 | 143 (30.0%) | 168 (13.7%) |
| $1,000,000 or more | 11 (2.3%) | 108 (8.8%) |
| Total | 476 (100.0%) | 1,228 (100.0%) |
Household Income by Mortgage Status in Lake of the Pines
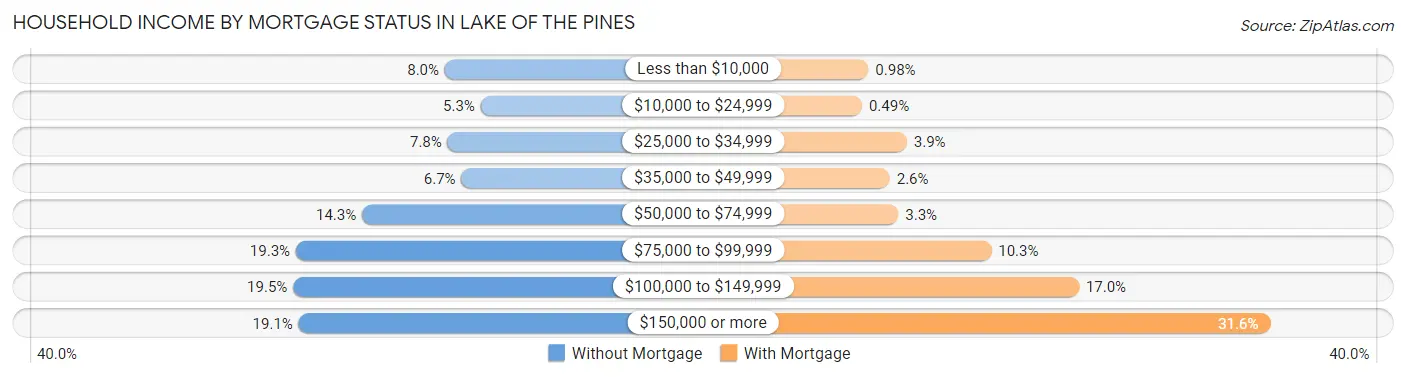
| Household Income | Without Mortgage | With Mortgage |
| Less than $10,000 | 38 (8.0%) | 12 (1.0%) |
| $10,000 to $24,999 | 25 (5.2%) | 6 (0.5%) |
| $25,000 to $34,999 | 37 (7.8%) | 48 (3.9%) |
| $35,000 to $49,999 | 32 (6.7%) | 32 (2.6%) |
| $50,000 to $74,999 | 68 (14.3%) | 40 (3.3%) |
| $75,000 to $99,999 | 92 (19.3%) | 127 (10.3%) |
| $100,000 to $149,999 | 93 (19.5%) | 209 (17.0%) |
| $150,000 or more | 91 (19.1%) | 388 (31.6%) |
| Total | 476 (100.0%) | 1,228 (100.0%) |
Property Value to Household Income Ratio in Lake of the Pines
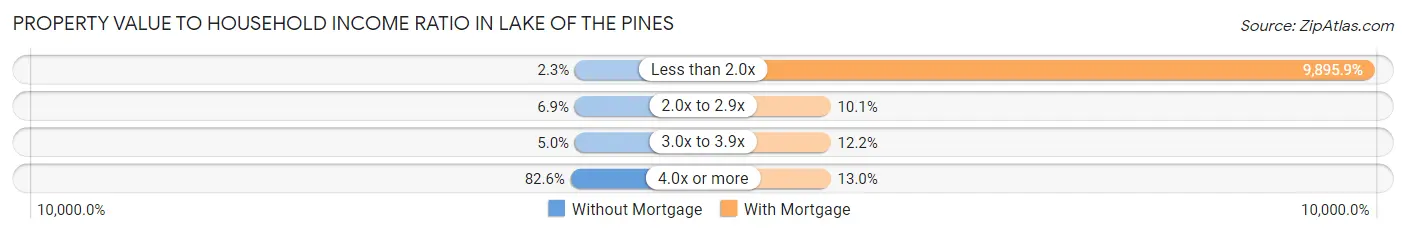
| Value-to-Income Ratio | Without Mortgage | With Mortgage |
| Less than 2.0x | 11 (2.3%) | 121,522 (9,895.9%) |
| 2.0x to 2.9x | 33 (6.9%) | 124 (10.1%) |
| 3.0x to 3.9x | 24 (5.0%) | 150 (12.2%) |
| 4.0x or more | 393 (82.6%) | 160 (13.0%) |
| Total | 476 (100.0%) | 1,228 (100.0%) |
Real Estate Taxes by Mortgage Status in Lake of the Pines
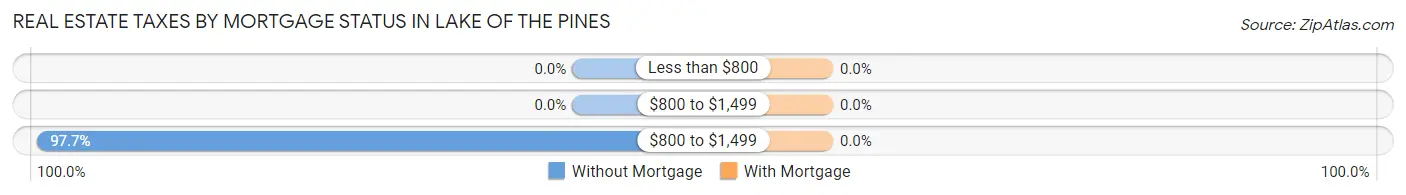
| Property Taxes | Without Mortgage | With Mortgage |
| Less than $800 | 0 (0.0%) | 0 (0.0%) |
| $800 to $1,499 | 0 (0.0%) | 0 (0.0%) |
| $800 to $1,499 | 465 (97.7%) | 0 (0.0%) |
| Total | 476 (100.0%) | 1,228 (100.0%) |
Health & Disability in Lake of the Pines
Health Insurance Coverage by Age in Lake of the Pines
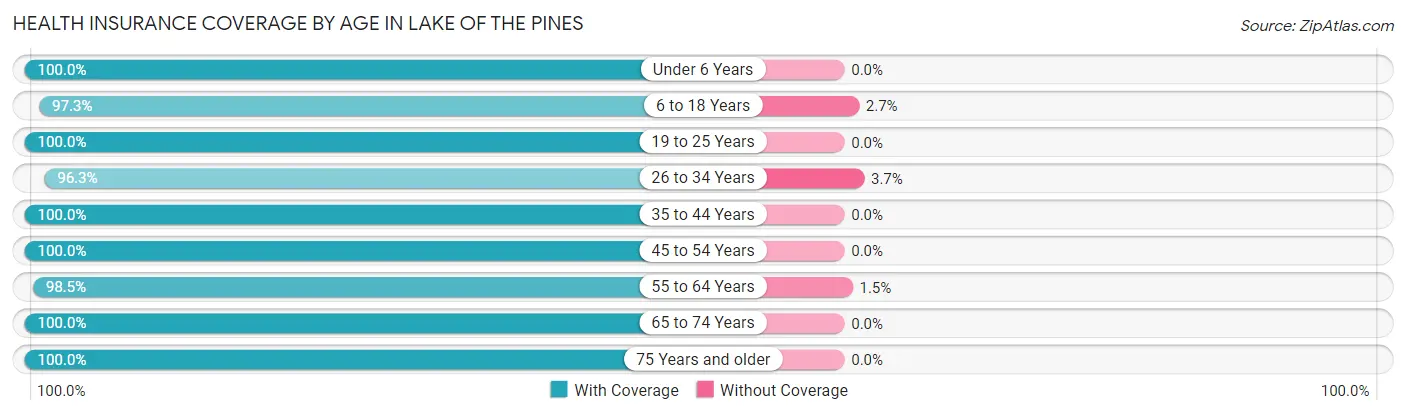
| Age Bracket | With Coverage | Without Coverage |
| Under 6 Years | 60 (100.0%) | 0 (0.0%) |
| 6 to 18 Years | 717 (97.3%) | 20 (2.7%) |
| 19 to 25 Years | 276 (100.0%) | 0 (0.0%) |
| 26 to 34 Years | 419 (96.3%) | 16 (3.7%) |
| 35 to 44 Years | 454 (100.0%) | 0 (0.0%) |
| 45 to 54 Years | 454 (100.0%) | 0 (0.0%) |
| 55 to 64 Years | 838 (98.5%) | 13 (1.5%) |
| 65 to 74 Years | 904 (100.0%) | 0 (0.0%) |
| 75 Years and older | 532 (100.0%) | 0 (0.0%) |
| Total | 4,654 (99.0%) | 49 (1.0%) |
Health Insurance Coverage by Citizenship Status in Lake of the Pines
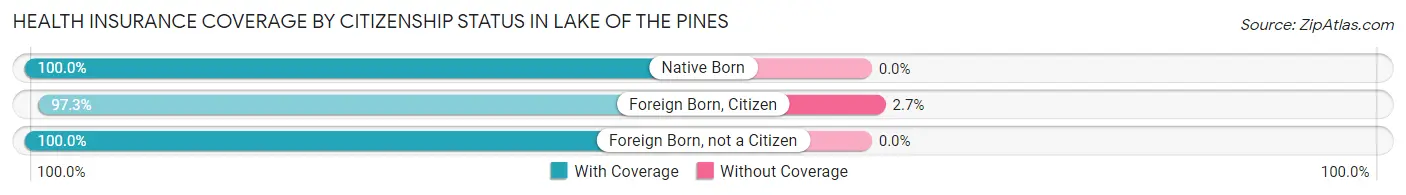
| Citizenship Status | With Coverage | Without Coverage |
| Native Born | 60 (100.0%) | 0 (0.0%) |
| Foreign Born, Citizen | 717 (97.3%) | 20 (2.7%) |
| Foreign Born, not a Citizen | 276 (100.0%) | 0 (0.0%) |
Health Insurance Coverage by Household Income in Lake of the Pines
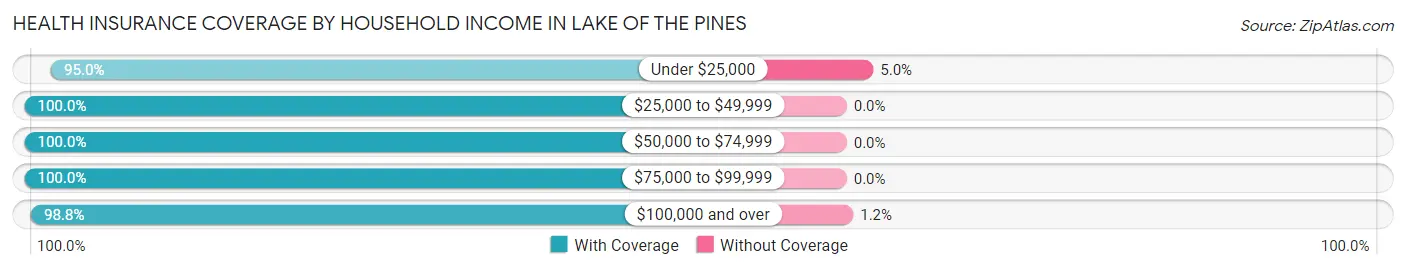
| Household Income | With Coverage | Without Coverage |
| Under $25,000 | 248 (95.0%) | 13 (5.0%) |
| $25,000 to $49,999 | 324 (100.0%) | 0 (0.0%) |
| $50,000 to $74,999 | 369 (100.0%) | 0 (0.0%) |
| $75,000 to $99,999 | 800 (100.0%) | 0 (0.0%) |
| $100,000 and over | 2,913 (98.8%) | 36 (1.2%) |
Public vs Private Health Insurance Coverage by Age in Lake of the Pines
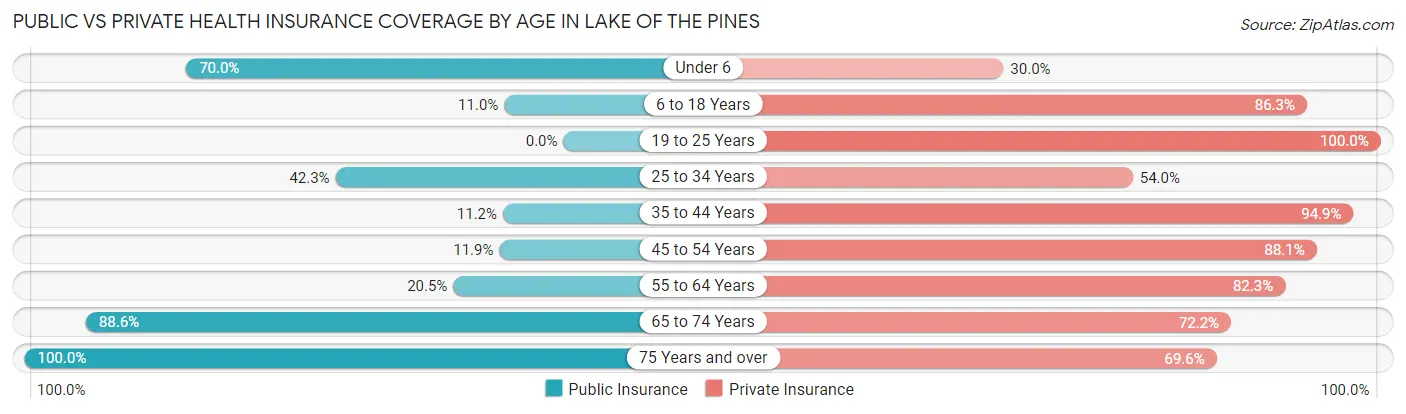
| Age Bracket | Public Insurance | Private Insurance |
| Under 6 | 42 (70.0%) | 18 (30.0%) |
| 6 to 18 Years | 81 (11.0%) | 636 (86.3%) |
| 19 to 25 Years | 0 (0.0%) | 276 (100.0%) |
| 25 to 34 Years | 184 (42.3%) | 235 (54.0%) |
| 35 to 44 Years | 51 (11.2%) | 431 (94.9%) |
| 45 to 54 Years | 54 (11.9%) | 400 (88.1%) |
| 55 to 64 Years | 174 (20.4%) | 700 (82.3%) |
| 65 to 74 Years | 801 (88.6%) | 653 (72.2%) |
| 75 Years and over | 532 (100.0%) | 370 (69.6%) |
| Total | 1,919 (40.8%) | 3,719 (79.1%) |
Disability Status by Sex by Age in Lake of the Pines
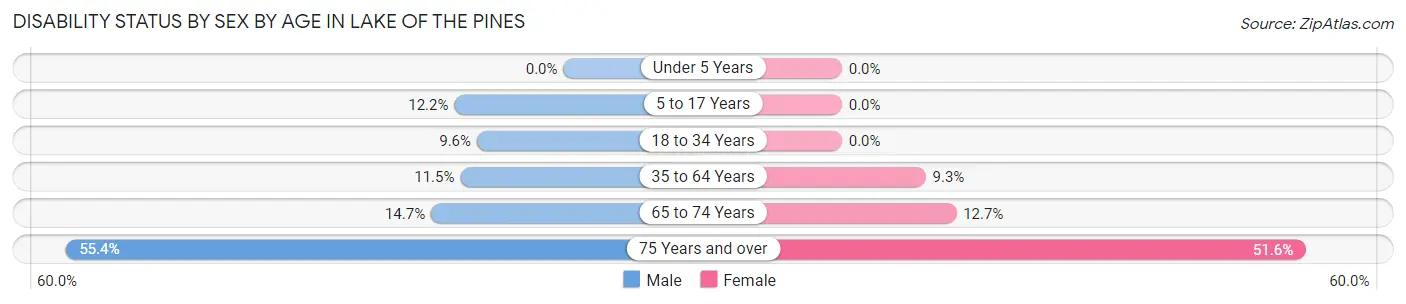
| Age Bracket | Male | Female |
| Under 5 Years | 0 (0.0%) | 0 (0.0%) |
| 5 to 17 Years | 35 (12.1%) | 0 (0.0%) |
| 18 to 34 Years | 44 (9.6%) | 0 (0.0%) |
| 35 to 64 Years | 101 (11.5%) | 82 (9.3%) |
| 65 to 74 Years | 65 (14.7%) | 59 (12.7%) |
| 75 Years and over | 155 (55.4%) | 130 (51.6%) |
Disability Class by Sex by Age in Lake of the Pines
Disability Class: Hearing Difficulty
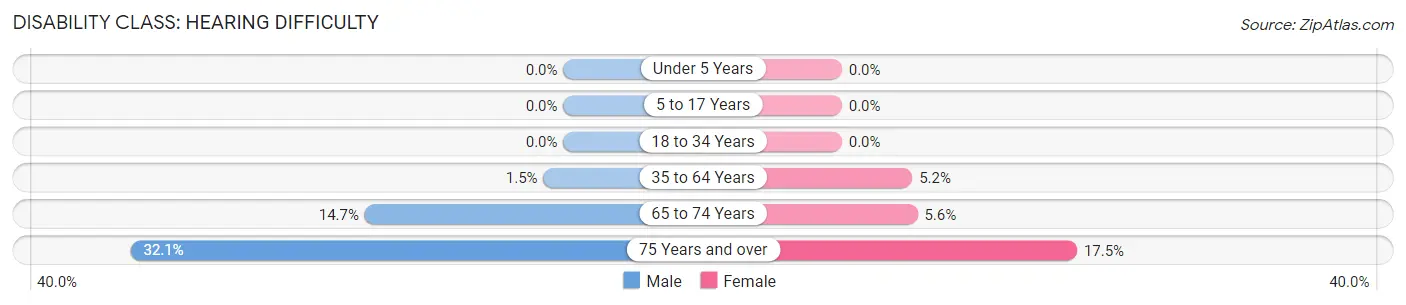
| Age Bracket | Male | Female |
| Under 5 Years | 0 (0.0%) | 0 (0.0%) |
| 5 to 17 Years | 0 (0.0%) | 0 (0.0%) |
| 18 to 34 Years | 0 (0.0%) | 0 (0.0%) |
| 35 to 64 Years | 13 (1.5%) | 46 (5.2%) |
| 65 to 74 Years | 65 (14.7%) | 26 (5.6%) |
| 75 Years and over | 90 (32.1%) | 44 (17.5%) |
Disability Class: Vision Difficulty
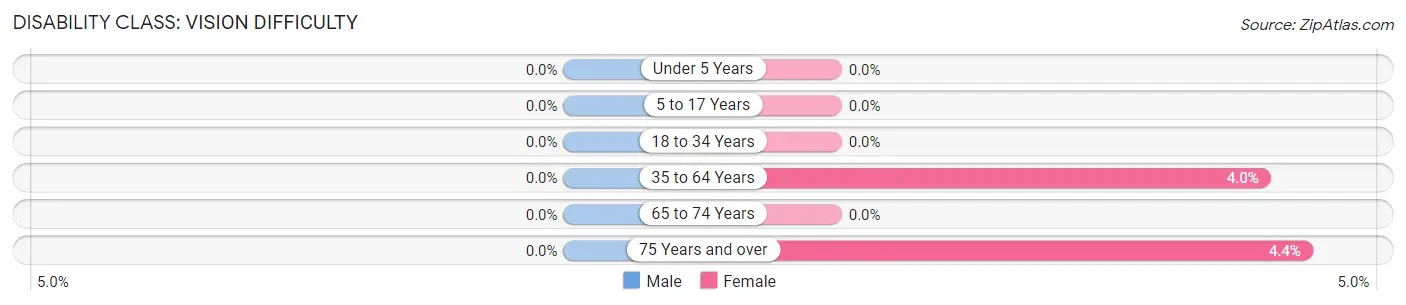
| Age Bracket | Male | Female |
| Under 5 Years | 0 (0.0%) | 0 (0.0%) |
| 5 to 17 Years | 0 (0.0%) | 0 (0.0%) |
| 18 to 34 Years | 0 (0.0%) | 0 (0.0%) |
| 35 to 64 Years | 0 (0.0%) | 35 (4.0%) |
| 65 to 74 Years | 0 (0.0%) | 0 (0.0%) |
| 75 Years and over | 0 (0.0%) | 11 (4.4%) |
Disability Class: Cognitive Difficulty
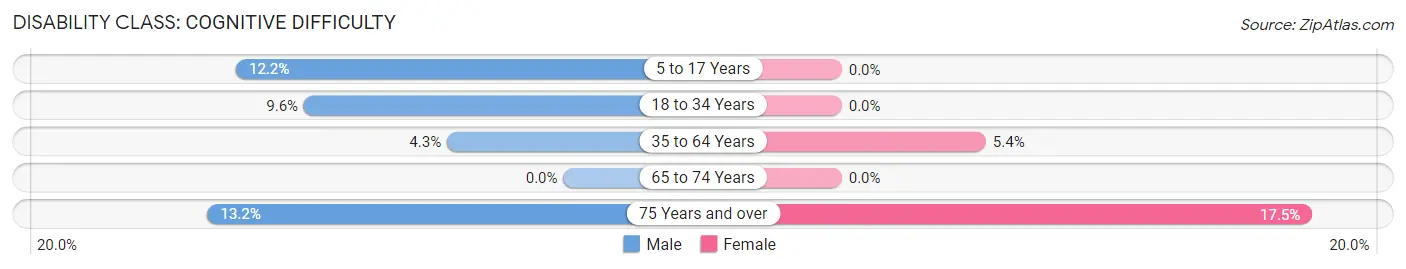
| Age Bracket | Male | Female |
| 5 to 17 Years | 35 (12.1%) | 0 (0.0%) |
| 18 to 34 Years | 44 (9.6%) | 0 (0.0%) |
| 35 to 64 Years | 38 (4.3%) | 47 (5.3%) |
| 65 to 74 Years | 0 (0.0%) | 0 (0.0%) |
| 75 Years and over | 37 (13.2%) | 44 (17.5%) |
Disability Class: Ambulatory Difficulty
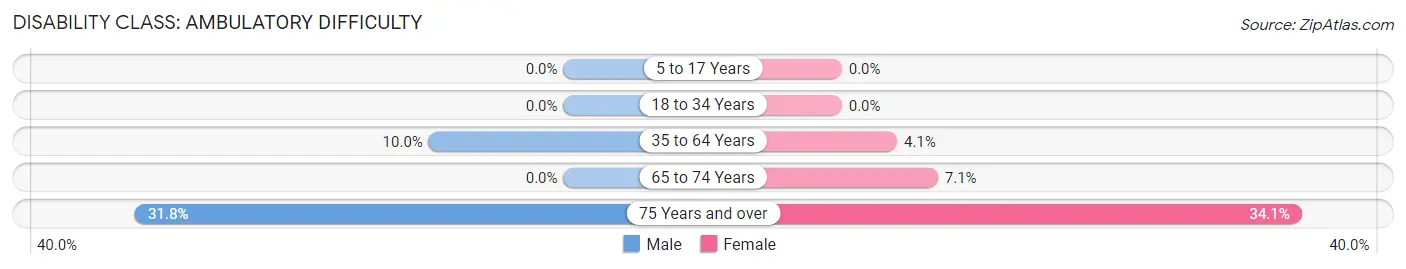
| Age Bracket | Male | Female |
| 5 to 17 Years | 0 (0.0%) | 0 (0.0%) |
| 18 to 34 Years | 0 (0.0%) | 0 (0.0%) |
| 35 to 64 Years | 88 (10.0%) | 36 (4.1%) |
| 65 to 74 Years | 0 (0.0%) | 33 (7.1%) |
| 75 Years and over | 89 (31.8%) | 86 (34.1%) |
Disability Class: Self-Care Difficulty
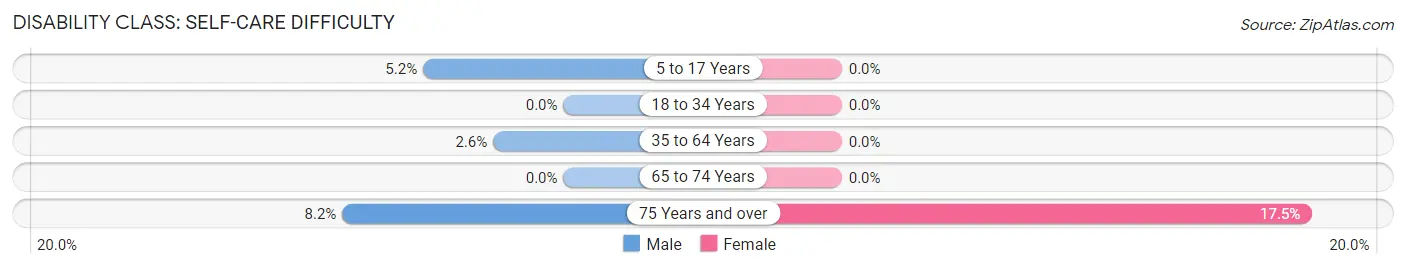
| Age Bracket | Male | Female |
| 5 to 17 Years | 15 (5.2%) | 0 (0.0%) |
| 18 to 34 Years | 0 (0.0%) | 0 (0.0%) |
| 35 to 64 Years | 23 (2.6%) | 0 (0.0%) |
| 65 to 74 Years | 0 (0.0%) | 0 (0.0%) |
| 75 Years and over | 23 (8.2%) | 44 (17.5%) |
Technology Access in Lake of the Pines
Computing Device Access in Lake of the Pines
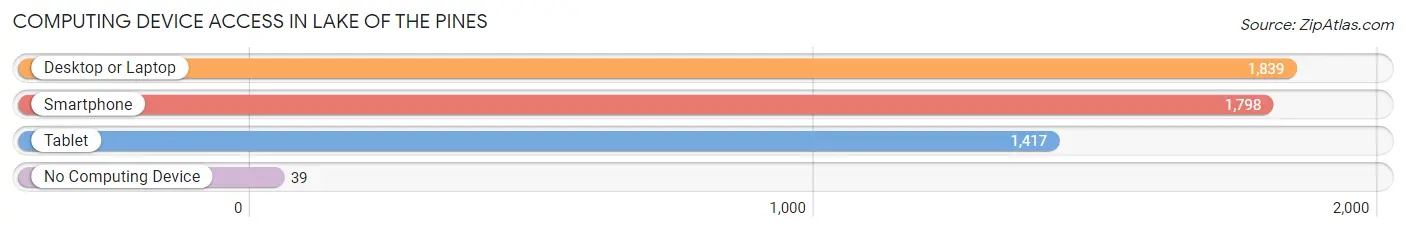
| Device Type | # Households | % Households |
| Desktop or Laptop | 1,839 | 96.0% |
| Smartphone | 1,798 | 93.8% |
| Tablet | 1,417 | 74.0% |
| No Computing Device | 39 | 2.0% |
| Total | 1,916 | 100.0% |
Internet Access in Lake of the Pines
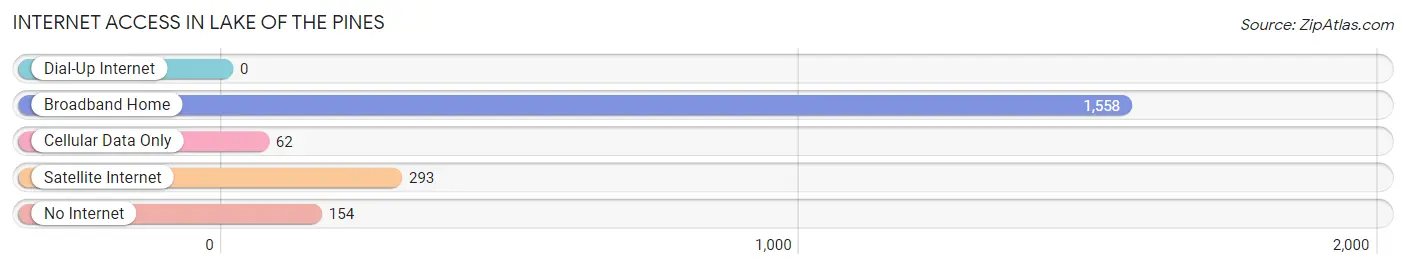
| Internet Type | # Households | % Households |
| Dial-Up Internet | 0 | 0.0% |
| Broadband Home | 1,558 | 81.3% |
| Cellular Data Only | 62 | 3.2% |
| Satellite Internet | 293 | 15.3% |
| No Internet | 154 | 8.0% |
| Total | 1,916 | 100.0% |
Lake of the Pines Summary
Lake of the Pines is a census-designated place located in Nevada County, California, United States. It is situated in the Sierra Nevada foothills, approximately 20 miles northeast of Auburn and 40 miles northeast of Sacramento. The population was 3,917 at the 2010 census.
History
The area that is now Lake of the Pines was originally inhabited by the Nisenan people, a branch of the Maidu tribe. The Nisenan people lived in the area for thousands of years before the arrival of European settlers.
The first European settlers arrived in the area in the mid-1800s. The area was originally known as “Pine Grove” and was home to a small community of loggers and miners. In the early 1900s, the area was developed as a resort community and the name was changed to “Lake of the Pines”.
The area was incorporated as a census designated place in 2000
Geography
Lake of the Pines is located at 39°10′17″N 121°2′17″W (39.1714, -121.0378). It is situated in the Sierra Nevada foothills, approximately 20 miles northeast of Auburn and 40 miles northeast of Sacramento.
The area is characterized by rolling hills, oak woodlands, and grassy meadows. The area is home to a variety of wildlife, including deer, coyotes, foxes, and a variety of birds.
The area is also home to several lakes, including Lake of the Pines, which is the largest lake in the area. The lake is a popular destination for fishing, boating, and other recreational activities.
Economy
The economy of Lake of the Pines is largely based on tourism and recreation. The area is home to several resorts, campgrounds, and other recreational facilities. The area is also home to several wineries and vineyards.
The area is also home to several businesses, including restaurants, retail stores, and professional services.
Demographics
As of the 2010 census, the population of Lake of the Pines was 3,917. The racial makeup of the area was 91.3% White, 0.7% African American, 0.7% Native American, 1.2% Asian, 0.2% Pacific Islander, 3.2% from other races, and 3.1% from two or more races. Hispanic or Latino of any race were 8.2% of the population.
The median household income in the area was $68,958, and the median family income was $76,958. The per capita income for the area was $31,958.
Conclusion
Lake of the Pines is a census-designated place located in Nevada County, California, United States. It is situated in the Sierra Nevada foothills, approximately 20 miles northeast of Auburn and 40 miles northeast of Sacramento. The area was originally inhabited by the Nisenan people, a branch of the Maidu tribe, and was later developed as a resort community in the early 1900s. The economy of Lake of the Pines is largely based on tourism and recreation, and the area is home to several resorts, campgrounds, wineries, and other businesses. As of the 2010 census, the population of Lake of the Pines was 3,917. The median household income in the area was $68,958, and the median family income was $76,958.
Common Questions
What is Per Capita Income in Lake of the Pines?
Per Capita income in Lake of the Pines is $56,260.
What is the Median Family Income in Lake of the Pines?
Median Family Income in Lake of the Pines is $113,257.
What is the Median Household income in Lake of the Pines?
Median Household Income in Lake of the Pines is $110,688.
What is Income or Wage Gap in Lake of the Pines?
Income or Wage Gap in Lake of the Pines is 32.5%.
Women in Lake of the Pines earn 67.5 cents for every dollar earned by a man.
What is Inequality or Gini Index in Lake of the Pines?
Inequality or Gini Index in Lake of the Pines is 0.39.
What is the Total Population of Lake of the Pines?
Total Population of Lake of the Pines is 4,703.
What is the Total Male Population of Lake of the Pines?
Total Male Population of Lake of the Pines is 2,346.
What is the Total Female Population of Lake of the Pines?
Total Female Population of Lake of the Pines is 2,357.
What is the Ratio of Males per 100 Females in Lake of the Pines?
There are 99.53 Males per 100 Females in Lake of the Pines.
What is the Ratio of Females per 100 Males in Lake of the Pines?
There are 100.47 Females per 100 Males in Lake of the Pines.
What is the Median Population Age in Lake of the Pines?
Median Population Age in Lake of the Pines is 54.5 Years.
What is the Average Family Size in Lake of the Pines
Average Family Size in Lake of the Pines is 2.6 People.
What is the Average Household Size in Lake of the Pines
Average Household Size in Lake of the Pines is 2.5 People.
How Large is the Labor Force in Lake of the Pines?
There are 2,017 People in the Labor Forcein in Lake of the Pines.
What is the Percentage of People in the Labor Force in Lake of the Pines?
50.3% of People are in the Labor Force in Lake of the Pines.
What is the Unemployment Rate in Lake of the Pines?
Unemployment Rate in Lake of the Pines is 3.4%.