Humboldt Hill, CA Map & Demographics
Humboldt Hill Map
Humboldt Hill Overview
$36,901
PER CAPITA INCOME
$108,400
AVG FAMILY INCOME
$80,938
AVG HOUSEHOLD INCOME
27.7%
WAGE / INCOME GAP [ % ]
72.3¢/ $1
WAGE / INCOME GAP [ $ ]
0.37
INEQUALITY / GINI INDEX
3,273
TOTAL POPULATION
1,576
MALE POPULATION
1,697
FEMALE POPULATION
92.87
MALES / 100 FEMALES
107.68
FEMALES / 100 MALES
46.0
MEDIAN AGE
3.2
AVG FAMILY SIZE
2.5
AVG HOUSEHOLD SIZE
1,572
LABOR FORCE [ PEOPLE ]
56.5%
PERCENT IN LABOR FORCE
5.3%
UNEMPLOYMENT RATE
Income in Humboldt Hill
Income Overview in Humboldt Hill
Per Capita Income in Humboldt Hill is $36,901, while median incomes of families and households are $108,400 and $80,938 respectively.
| Characteristic | Number | Measure |
| Per Capita Income | 3,273 | $36,901 |
| Median Family Income | 670 | $108,400 |
| Mean Family Income | 670 | $119,561 |
| Median Household Income | 1,210 | $80,938 |
| Mean Household Income | 1,210 | $99,105 |
| Income Deficit | 670 | $0 |
| Wage / Income Gap (%) | 3,273 | 27.74% |
| Wage / Income Gap ($) | 3,273 | 72.26¢ per $1 |
| Gini / Inequality Index | 3,273 | 0.37 |
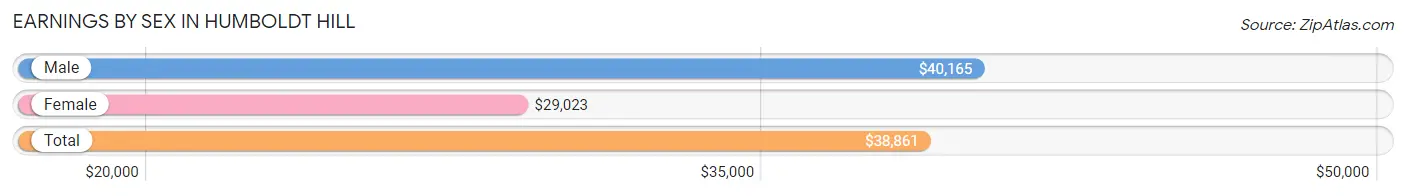
Earnings by Sex in Humboldt Hill
Average Earnings in Humboldt Hill are $38,861, $40,165 for men and $29,023 for women, a difference of 27.7%.
| Sex | Number | Average Earnings |
| Male | 917 (56.0%) | $40,165 |
| Female | 719 (44.0%) | $29,023 |
| Total | 1,636 (100.0%) | $38,861 |
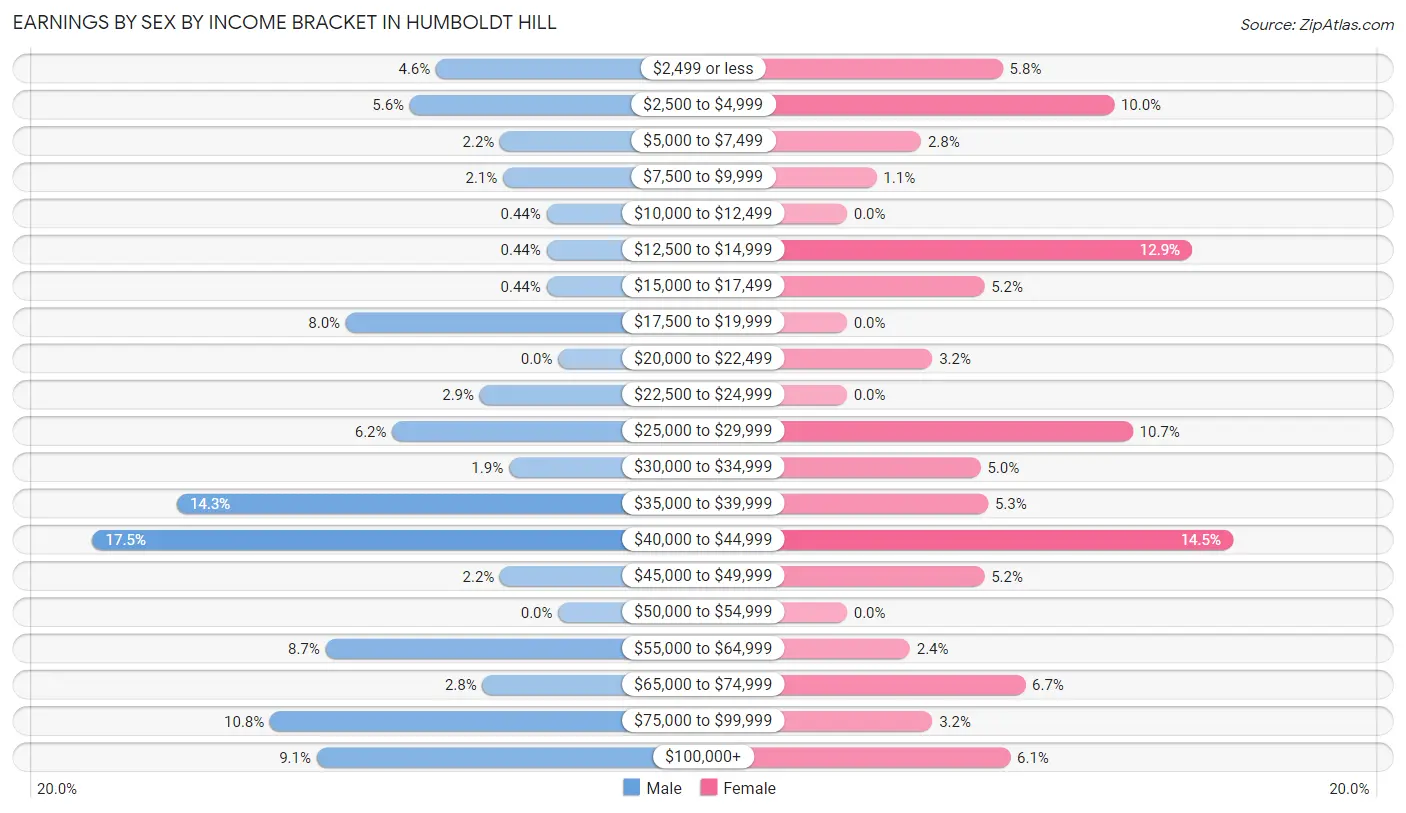
Earnings by Sex by Income Bracket in Humboldt Hill
The most common earnings brackets in Humboldt Hill are $40,000 to $44,999 for men (160 | 17.4%) and $40,000 to $44,999 for women (104 | 14.5%).
| Income | Male | Female |
| $2,499 or less | 42 (4.6%) | 42 (5.8%) |
| $2,500 to $4,999 | 51 (5.6%) | 72 (10.0%) |
| $5,000 to $7,499 | 20 (2.2%) | 20 (2.8%) |
| $7,500 to $9,999 | 19 (2.1%) | 8 (1.1%) |
| $10,000 to $12,499 | 4 (0.4%) | 0 (0.0%) |
| $12,500 to $14,999 | 4 (0.4%) | 93 (12.9%) |
| $15,000 to $17,499 | 4 (0.4%) | 37 (5.1%) |
| $17,500 to $19,999 | 73 (8.0%) | 0 (0.0%) |
| $20,000 to $22,499 | 0 (0.0%) | 23 (3.2%) |
| $22,500 to $24,999 | 27 (2.9%) | 0 (0.0%) |
| $25,000 to $29,999 | 57 (6.2%) | 77 (10.7%) |
| $30,000 to $34,999 | 17 (1.8%) | 36 (5.0%) |
| $35,000 to $39,999 | 131 (14.3%) | 38 (5.3%) |
| $40,000 to $44,999 | 160 (17.4%) | 104 (14.5%) |
| $45,000 to $49,999 | 20 (2.2%) | 37 (5.1%) |
| $50,000 to $54,999 | 0 (0.0%) | 0 (0.0%) |
| $55,000 to $64,999 | 80 (8.7%) | 17 (2.4%) |
| $65,000 to $74,999 | 26 (2.8%) | 48 (6.7%) |
| $75,000 to $99,999 | 99 (10.8%) | 23 (3.2%) |
| $100,000+ | 83 (9.0%) | 44 (6.1%) |
| Total | 917 (100.0%) | 719 (100.0%) |
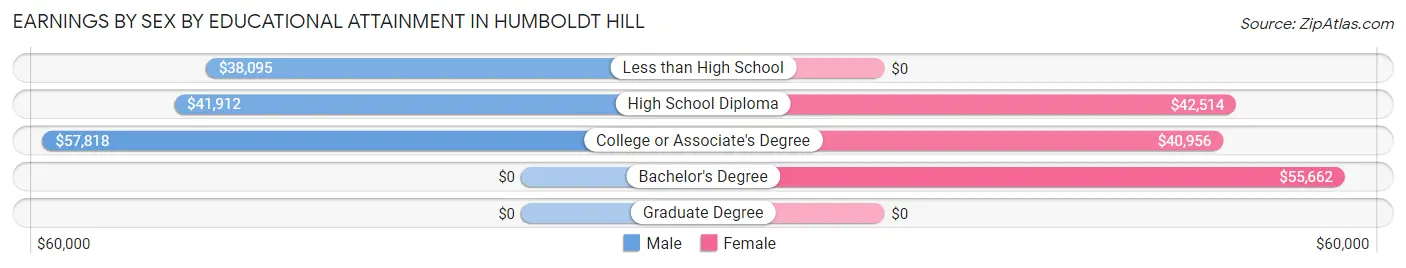
Earnings by Sex by Educational Attainment in Humboldt Hill
Average earnings in Humboldt Hill are $41,519 for men and $39,934 for women, a difference of 3.8%. Men with an educational attainment of college or associate's degree enjoy the highest average annual earnings of $57,818, while those with less than high school education earn the least with $38,095. Women with an educational attainment of bachelor's degree earn the most with the average annual earnings of $55,662, while those with college or associate's degree education have the smallest earnings of $40,956.
| Educational Attainment | Male Income | Female Income |
| Less than High School | $38,095 | $0 |
| High School Diploma | $41,912 | $42,514 |
| College or Associate's Degree | $57,818 | $40,956 |
| Bachelor's Degree | - | - |
| Graduate Degree | - | - |
| Total | $41,519 | $39,934 |
Family Income in Humboldt Hill
Family Income Brackets in Humboldt Hill
According to the Humboldt Hill family income data, there are 225 families falling into the $100,000 to $149,999 income range, which is the most common income bracket and makes up 33.6% of all families.
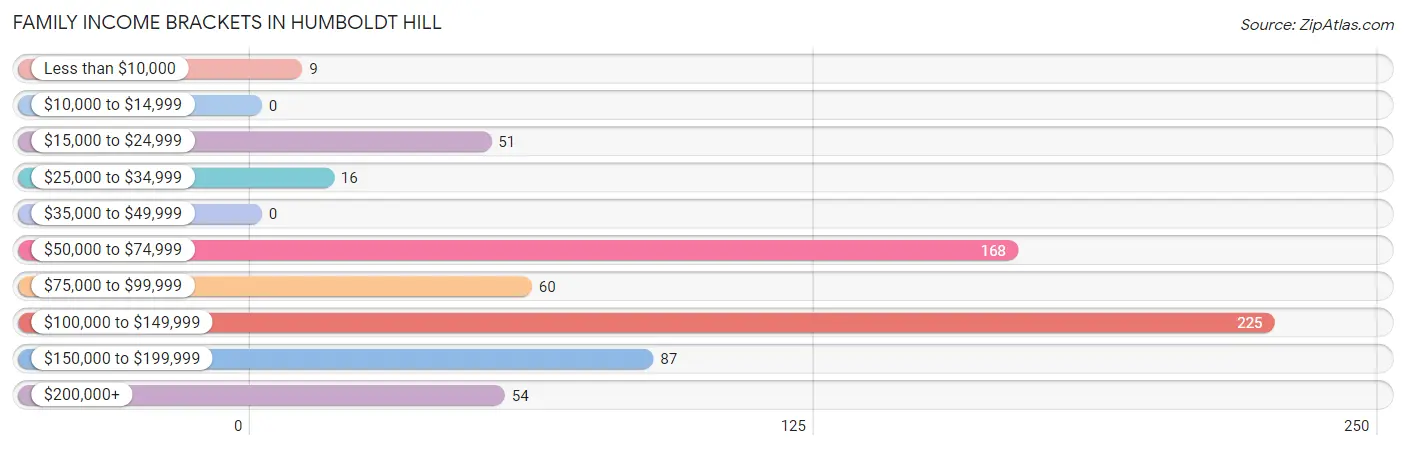
| Income Bracket | # Families | % Families |
| Less than $10,000 | 9 | 1.3% |
| $10,000 to $14,999 | 0 | 0.0% |
| $15,000 to $24,999 | 51 | 7.6% |
| $25,000 to $34,999 | 16 | 2.4% |
| $35,000 to $49,999 | 0 | 0.0% |
| $50,000 to $74,999 | 168 | 25.1% |
| $75,000 to $99,999 | 60 | 9.0% |
| $100,000 to $149,999 | 225 | 33.6% |
| $150,000 to $199,999 | 87 | 13.0% |
| $200,000+ | 54 | 8.1% |
Family Income by Famaliy Size in Humboldt Hill
4-person families (46 | 6.9%) account for the highest median family income in Humboldt Hill with $188,889 per family, while 4-person families (46 | 6.9%) have the highest median income of $47,222 per family member.
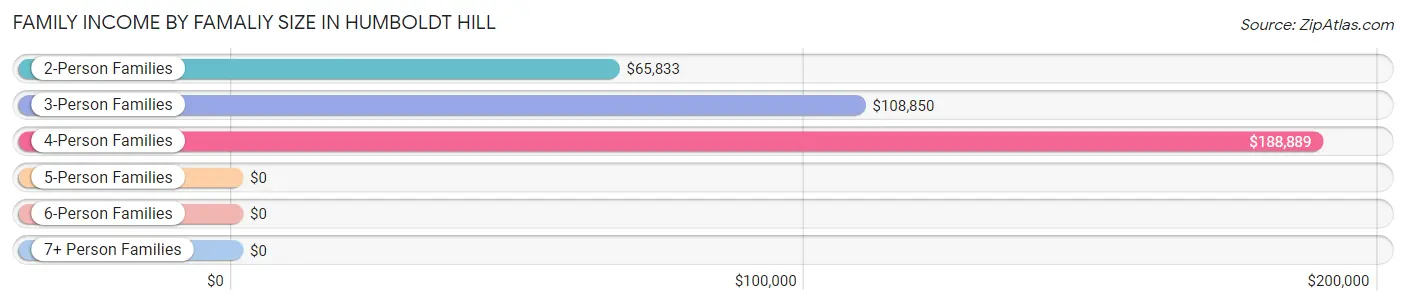
| Income Bracket | # Families | Median Income |
| 2-Person Families | 326 (48.7%) | $65,833 |
| 3-Person Families | 173 (25.8%) | $108,850 |
| 4-Person Families | 46 (6.9%) | $188,889 |
| 5-Person Families | 0 (0.0%) | $0 |
| 6-Person Families | 29 (4.3%) | $0 |
| 7+ Person Families | 96 (14.3%) | $0 |
| Total | 670 (100.0%) | $108,400 |
Family Income by Number of Earners in Humboldt Hill
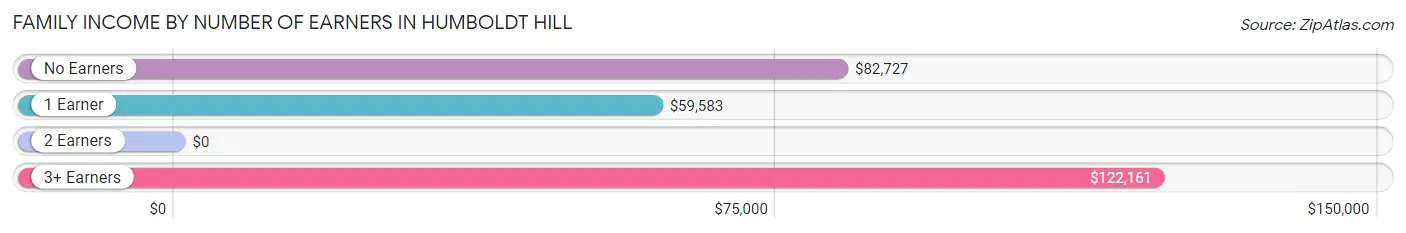
| Number of Earners | # Families | Median Income |
| No Earners | 126 (18.8%) | $82,727 |
| 1 Earner | 189 (28.2%) | $59,583 |
| 2 Earners | 189 (28.2%) | $0 |
| 3+ Earners | 166 (24.8%) | $122,161 |
| Total | 670 (100.0%) | $108,400 |
Household Income in Humboldt Hill
Household Income Brackets in Humboldt Hill
With 299 households falling in the category, the $100,000 to $149,999 income range is the most frequent in Humboldt Hill, accounting for 24.7% of all households. In contrast, only 8 households (0.7%) fall into the less than $10,000 income bracket, making it the least populous group.
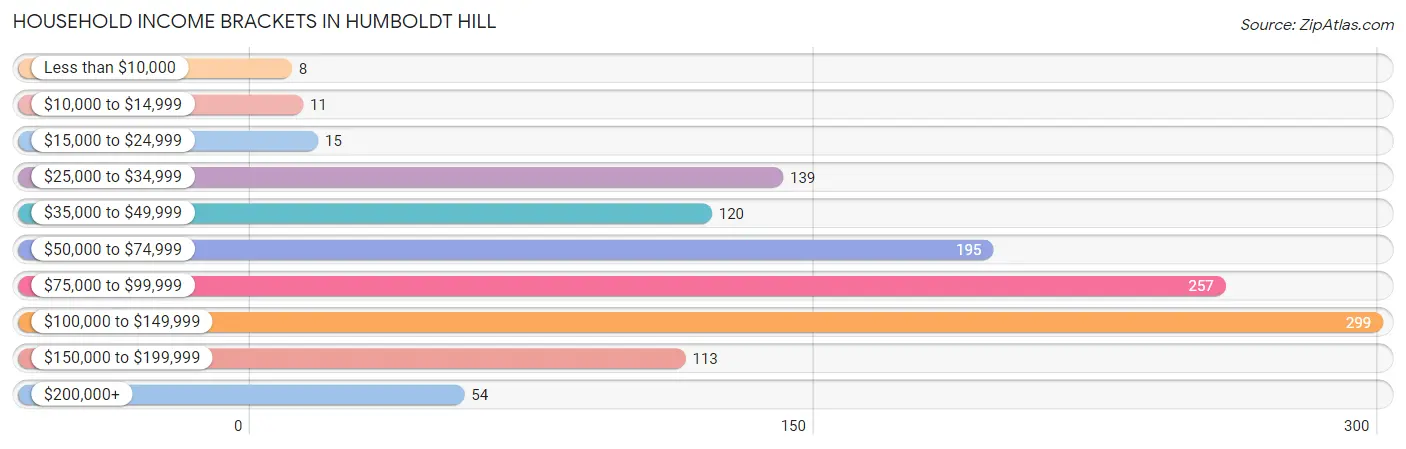
| Income Bracket | # Households | % Households |
| Less than $10,000 | 8 | 0.7% |
| $10,000 to $14,999 | 11 | 0.9% |
| $15,000 to $24,999 | 15 | 1.2% |
| $25,000 to $34,999 | 139 | 11.5% |
| $35,000 to $49,999 | 120 | 9.9% |
| $50,000 to $74,999 | 195 | 16.1% |
| $75,000 to $99,999 | 257 | 21.2% |
| $100,000 to $149,999 | 299 | 24.7% |
| $150,000 to $199,999 | 113 | 9.3% |
| $200,000+ | 54 | 4.5% |
Household Income by Householder Age in Humboldt Hill
The median household income in Humboldt Hill is $80,938, with the highest median household income of $89,743 found in the 45 to 64 years age bracket for the primary householder. A total of 487 households (40.3%) fall into this category. Meanwhile, the 15 to 24 years age bracket for the primary householder has the lowest median household income of $0, with 43 households (3.5%) in this group.
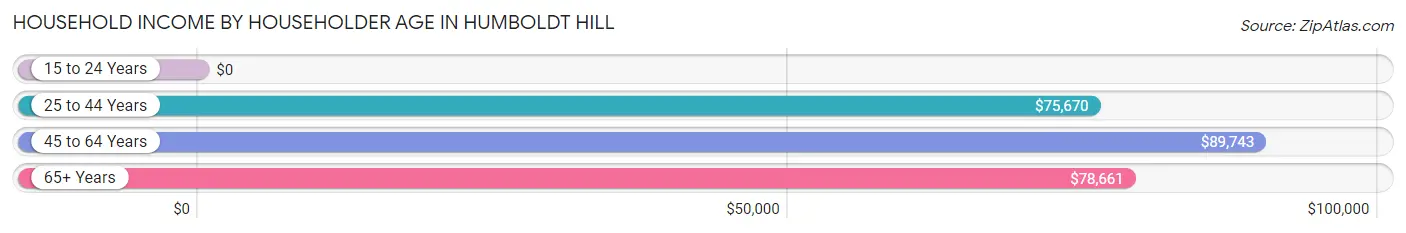
| Income Bracket | # Households | Median Income |
| 15 to 24 Years | 43 (3.5%) | $0 |
| 25 to 44 Years | 273 (22.6%) | $75,670 |
| 45 to 64 Years | 487 (40.3%) | $89,743 |
| 65+ Years | 407 (33.6%) | $78,661 |
| Total | 1,210 (100.0%) | $80,938 |
Poverty in Humboldt Hill
Income Below Poverty by Sex and Age in Humboldt Hill
With 11.7% poverty level for males and 12.7% for females among the residents of Humboldt Hill, 12 to 14 year old males and 6 to 11 year old females are the most vulnerable to poverty, with 31 males (100.0%) and 53 females (100.0%) in their respective age groups living below the poverty level.
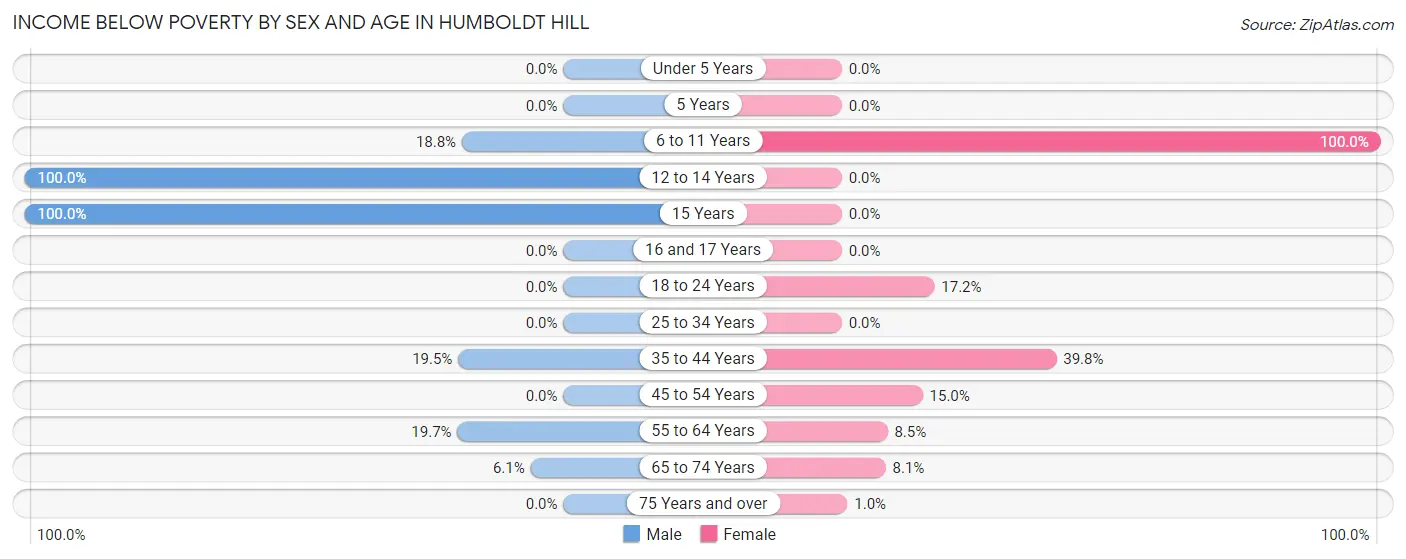
| Age Bracket | Male | Female |
| Under 5 Years | 0 (0.0%) | 0 (0.0%) |
| 5 Years | 0 (0.0%) | 0 (0.0%) |
| 6 to 11 Years | 16 (18.8%) | 53 (100.0%) |
| 12 to 14 Years | 31 (100.0%) | 0 (0.0%) |
| 15 Years | 5 (100.0%) | 0 (0.0%) |
| 16 and 17 Years | 0 (0.0%) | 0 (0.0%) |
| 18 to 24 Years | 0 (0.0%) | 28 (17.2%) |
| 25 to 34 Years | 0 (0.0%) | 0 (0.0%) |
| 35 to 44 Years | 57 (19.5%) | 43 (39.8%) |
| 45 to 54 Years | 0 (0.0%) | 21 (15.0%) |
| 55 to 64 Years | 57 (19.7%) | 31 (8.5%) |
| 65 to 74 Years | 9 (6.1%) | 20 (8.1%) |
| 75 Years and over | 0 (0.0%) | 2 (1.0%) |
| Total | 175 (11.7%) | 198 (12.7%) |
Income Above Poverty by Sex and Age in Humboldt Hill
According to the poverty statistics in Humboldt Hill, males aged under 5 years and females aged under 5 years are the age groups that are most secure financially, with 100.0% of males and 100.0% of females in these age groups living above the poverty line.
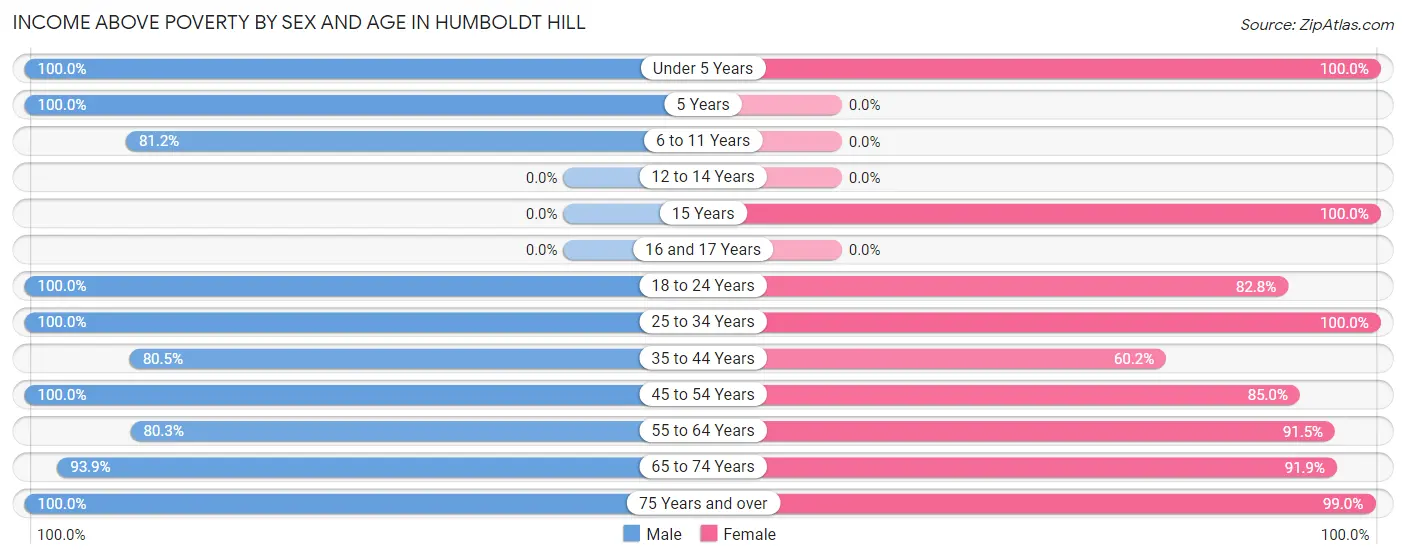
| Age Bracket | Male | Female |
| Under 5 Years | 178 (100.0%) | 49 (100.0%) |
| 5 Years | 17 (100.0%) | 0 (0.0%) |
| 6 to 11 Years | 69 (81.2%) | 0 (0.0%) |
| 12 to 14 Years | 0 (0.0%) | 0 (0.0%) |
| 15 Years | 0 (0.0%) | 62 (100.0%) |
| 16 and 17 Years | 0 (0.0%) | 0 (0.0%) |
| 18 to 24 Years | 128 (100.0%) | 135 (82.8%) |
| 25 to 34 Years | 115 (100.0%) | 176 (100.0%) |
| 35 to 44 Years | 235 (80.5%) | 65 (60.2%) |
| 45 to 54 Years | 111 (100.0%) | 119 (85.0%) |
| 55 to 64 Years | 233 (80.3%) | 335 (91.5%) |
| 65 to 74 Years | 139 (93.9%) | 226 (91.9%) |
| 75 Years and over | 91 (100.0%) | 193 (99.0%) |
| Total | 1,316 (88.3%) | 1,360 (87.3%) |
Income Below Poverty Among Married-Couple Families in Humboldt Hill
The poverty statistics for married-couple families in Humboldt Hill show that 3.2% or 15 of the total 465 families live below the poverty line. Families with 3 or 4 children have the highest poverty rate of 4.8%, comprising of 6 families. On the other hand, families with 1 or 2 children have the lowest poverty rate of 0.0%, which includes 0 families.
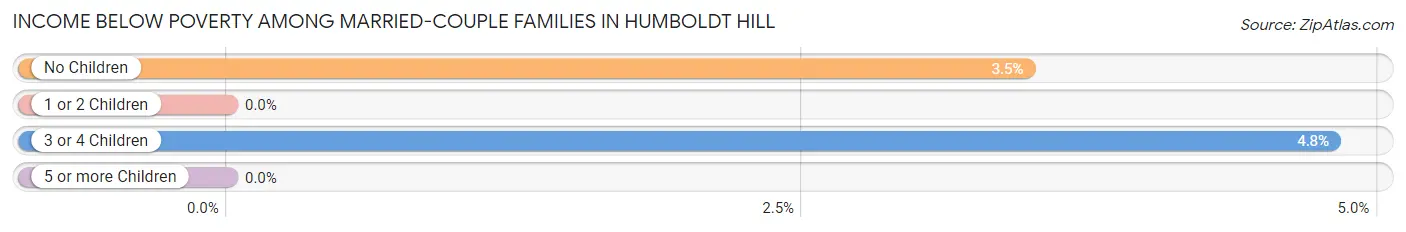
| Children | Above Poverty | Below Poverty |
| No Children | 250 (96.5%) | 9 (3.5%) |
| 1 or 2 Children | 81 (100.0%) | 0 (0.0%) |
| 3 or 4 Children | 119 (95.2%) | 6 (4.8%) |
| 5 or more Children | 0 (0.0%) | 0 (0.0%) |
| Total | 450 (96.8%) | 15 (3.2%) |
Income Below Poverty Among Single-Parent Households in Humboldt Hill
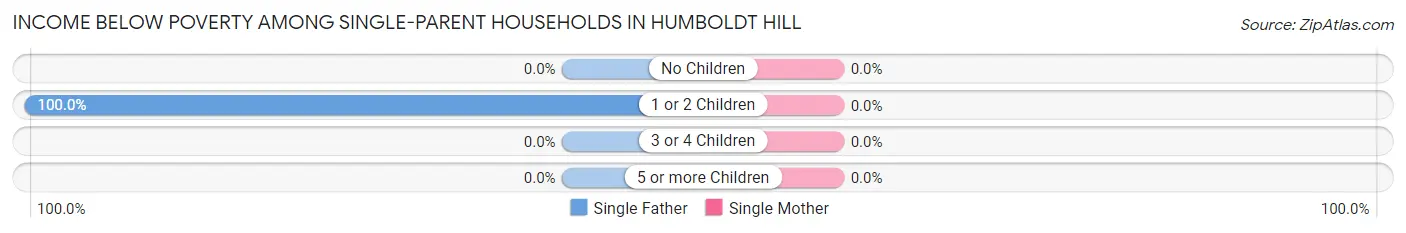
| Children | Single Father | Single Mother |
| No Children | 0 (0.0%) | 0 (0.0%) |
| 1 or 2 Children | 51 (100.0%) | 0 (0.0%) |
| 3 or 4 Children | 0 (0.0%) | 0 (0.0%) |
| 5 or more Children | 0 (0.0%) | 0 (0.0%) |
| Total | 51 (51.0%) | 0 (0.0%) |
Income Below Poverty Among Married-Couple vs Single-Parent Households in Humboldt Hill
The poverty data for Humboldt Hill shows that 15 of the married-couple family households (3.2%) and 51 of the single-parent households (24.9%) are living below the poverty level. Within the married-couple family households, those with 3 or 4 children have the highest poverty rate, with 6 households (4.8%) falling below the poverty line. Among the single-parent households, those with 1 or 2 children have the highest poverty rate, with 51 household (83.6%) living below poverty.
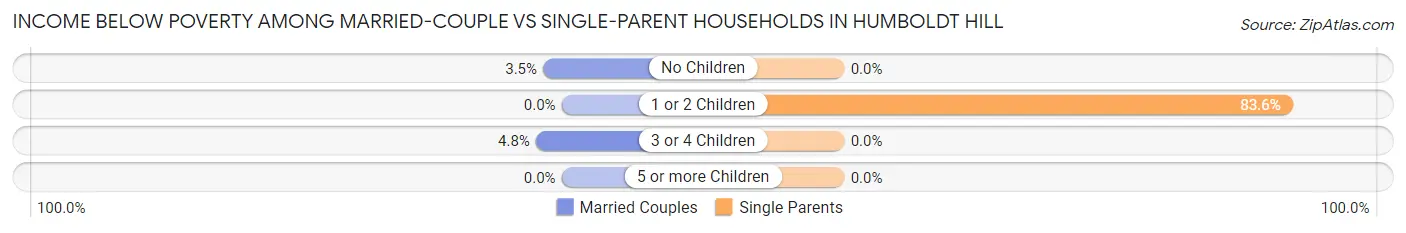
| Children | Married-Couple Families | Single-Parent Households |
| No Children | 9 (3.5%) | 0 (0.0%) |
| 1 or 2 Children | 0 (0.0%) | 51 (83.6%) |
| 3 or 4 Children | 6 (4.8%) | 0 (0.0%) |
| 5 or more Children | 0 (0.0%) | 0 (0.0%) |
| Total | 15 (3.2%) | 51 (24.9%) |
Race in Humboldt Hill
The most populous races in Humboldt Hill are White / Caucasian (2,093 | 63.9%), Hispanic or Latino (851 | 26.0%), and Some other Race (704 | 21.5%).
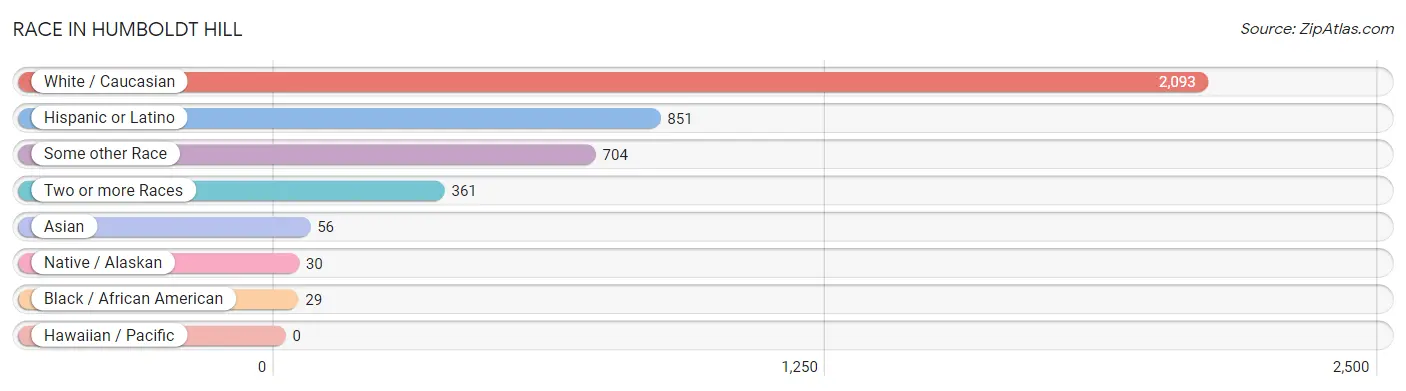
| Race | # Population | % Population |
| Asian | 56 | 1.7% |
| Black / African American | 29 | 0.9% |
| Hawaiian / Pacific | 0 | 0.0% |
| Hispanic or Latino | 851 | 26.0% |
| Native / Alaskan | 30 | 0.9% |
| White / Caucasian | 2,093 | 63.9% |
| Two or more Races | 361 | 11.0% |
| Some other Race | 704 | 21.5% |
| Total | 3,273 | 100.0% |
Ancestry in Humboldt Hill
The most populous ancestries reported in Humboldt Hill are Mexican (837 | 25.6%), English (506 | 15.5%), Irish (393 | 12.0%), German (300 | 9.2%), and Italian (214 | 6.5%), together accounting for 68.8% of all Humboldt Hill residents.
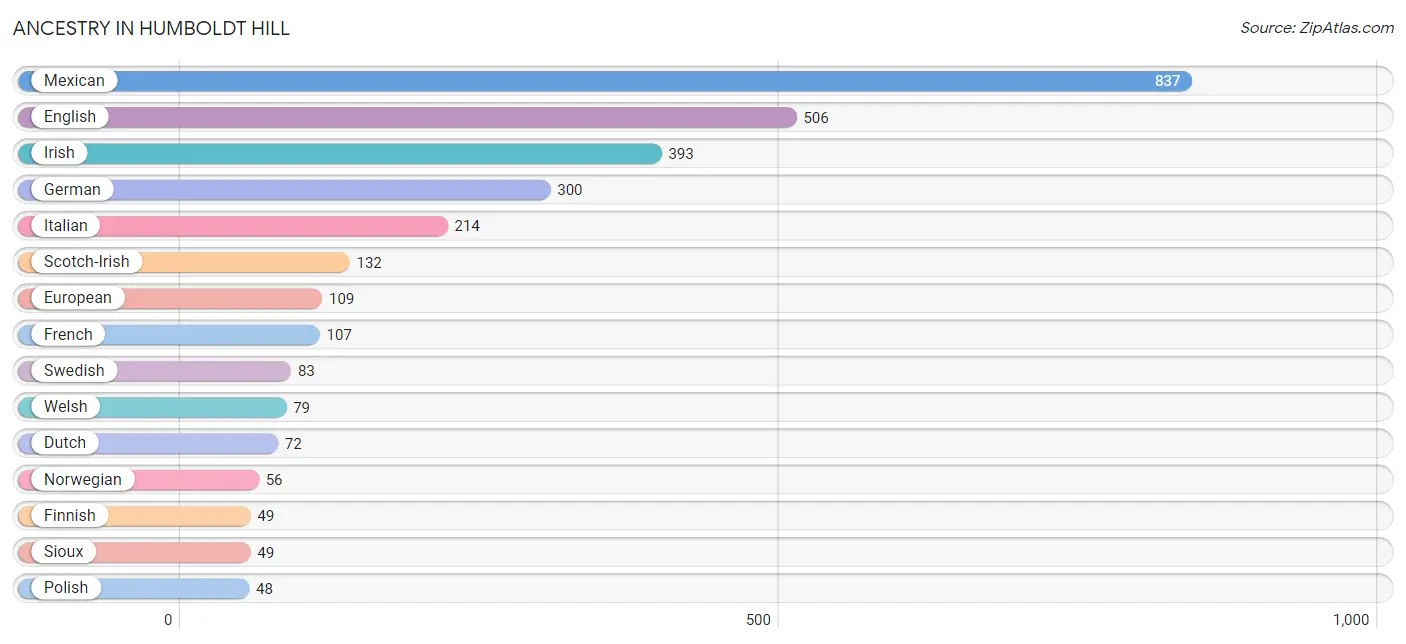
| Ancestry | # Population | % Population |
| Aleut | 33 | 1.0% |
| American | 10 | 0.3% |
| Austrian | 11 | 0.3% |
| Bhutanese | 25 | 0.8% |
| British | 11 | 0.3% |
| Burmese | 15 | 0.5% |
| Canadian | 15 | 0.5% |
| Cherokee | 15 | 0.5% |
| Chippewa | 11 | 0.3% |
| Danish | 21 | 0.6% |
| Dutch | 72 | 2.2% |
| English | 506 | 15.5% |
| European | 109 | 3.3% |
| Finnish | 49 | 1.5% |
| French | 107 | 3.3% |
| French Canadian | 4 | 0.1% |
| German | 300 | 9.2% |
| Greek | 13 | 0.4% |
| Irish | 393 | 12.0% |
| Italian | 214 | 6.5% |
| Korean | 21 | 0.6% |
| Maltese | 4 | 0.1% |
| Mexican | 837 | 25.6% |
| Norwegian | 56 | 1.7% |
| Paiute | 30 | 0.9% |
| Polish | 48 | 1.5% |
| Portuguese | 35 | 1.1% |
| Puerto Rican | 4 | 0.1% |
| Scandinavian | 9 | 0.3% |
| Scotch-Irish | 132 | 4.0% |
| Scottish | 24 | 0.7% |
| Sioux | 49 | 1.5% |
| Spaniard | 7 | 0.2% |
| Sri Lankan | 10 | 0.3% |
| Swedish | 83 | 2.5% |
| Swiss | 19 | 0.6% |
| Welsh | 79 | 2.4% | View All 37 Rows |
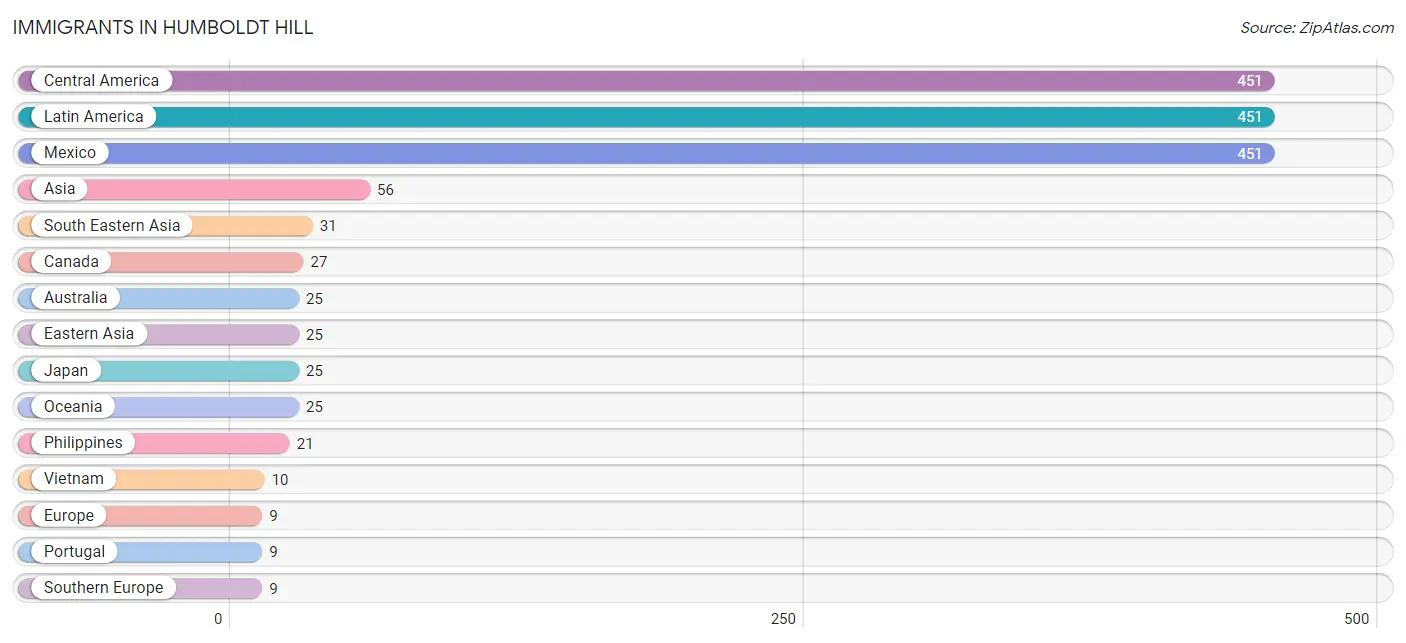
Immigrants in Humboldt Hill
The most numerous immigrant groups reported in Humboldt Hill came from Central America (451 | 13.8%), Latin America (451 | 13.8%), Mexico (451 | 13.8%), Asia (56 | 1.7%), and South Eastern Asia (31 | 0.9%), together accounting for 44.0% of all Humboldt Hill residents.
| Immigration Origin | # Population | % Population |
| Asia | 56 | 1.7% |
| Australia | 25 | 0.8% |
| Canada | 27 | 0.8% |
| Central America | 451 | 13.8% |
| Eastern Asia | 25 | 0.8% |
| Europe | 9 | 0.3% |
| Japan | 25 | 0.8% |
| Latin America | 451 | 13.8% |
| Mexico | 451 | 13.8% |
| Oceania | 25 | 0.8% |
| Philippines | 21 | 0.6% |
| Portugal | 9 | 0.3% |
| South Eastern Asia | 31 | 0.9% |
| Southern Europe | 9 | 0.3% |
| Vietnam | 10 | 0.3% | View All 15 Rows |
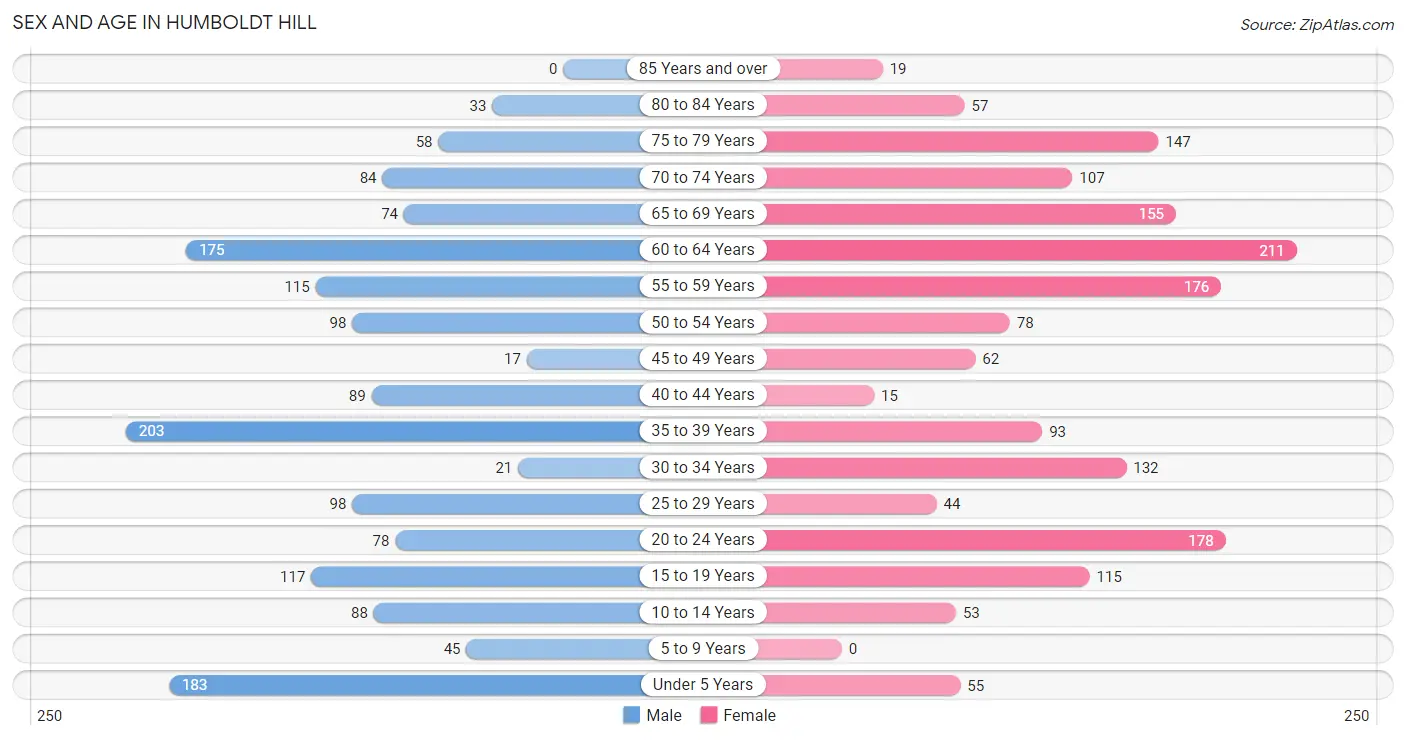
Sex and Age in Humboldt Hill
Sex and Age in Humboldt Hill
The most populous age groups in Humboldt Hill are 35 to 39 Years (203 | 12.9%) for men and 60 to 64 Years (211 | 12.4%) for women.
| Age Bracket | Male | Female |
| Under 5 Years | 183 (11.6%) | 55 (3.2%) |
| 5 to 9 Years | 45 (2.9%) | 0 (0.0%) |
| 10 to 14 Years | 88 (5.6%) | 53 (3.1%) |
| 15 to 19 Years | 117 (7.4%) | 115 (6.8%) |
| 20 to 24 Years | 78 (5.0%) | 178 (10.5%) |
| 25 to 29 Years | 98 (6.2%) | 44 (2.6%) |
| 30 to 34 Years | 21 (1.3%) | 132 (7.8%) |
| 35 to 39 Years | 203 (12.9%) | 93 (5.5%) |
| 40 to 44 Years | 89 (5.7%) | 15 (0.9%) |
| 45 to 49 Years | 17 (1.1%) | 62 (3.6%) |
| 50 to 54 Years | 98 (6.2%) | 78 (4.6%) |
| 55 to 59 Years | 115 (7.3%) | 176 (10.4%) |
| 60 to 64 Years | 175 (11.1%) | 211 (12.4%) |
| 65 to 69 Years | 74 (4.7%) | 155 (9.1%) |
| 70 to 74 Years | 84 (5.3%) | 107 (6.3%) |
| 75 to 79 Years | 58 (3.7%) | 147 (8.7%) |
| 80 to 84 Years | 33 (2.1%) | 57 (3.4%) |
| 85 Years and over | 0 (0.0%) | 19 (1.1%) |
| Total | 1,576 (100.0%) | 1,697 (100.0%) |
Families and Households in Humboldt Hill
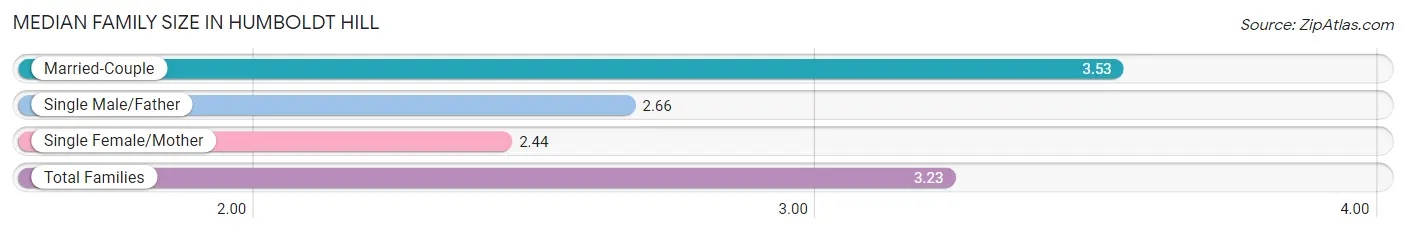
Median Family Size in Humboldt Hill
The median family size in Humboldt Hill is 3.23 persons per family, with married-couple families (465 | 69.4%) accounting for the largest median family size of 3.53 persons per family. On the other hand, single female/mother families (105 | 15.7%) represent the smallest median family size with 2.44 persons per family.
| Family Type | # Families | Family Size |
| Married-Couple | 465 (69.4%) | 3.53 |
| Single Male/Father | 100 (14.9%) | 2.66 |
| Single Female/Mother | 105 (15.7%) | 2.44 |
| Total Families | 670 (100.0%) | 3.23 |
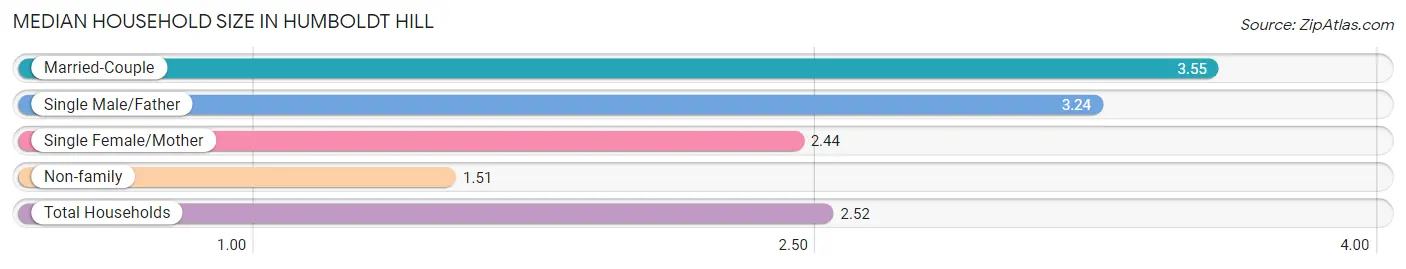
Median Household Size in Humboldt Hill
The median household size in Humboldt Hill is 2.52 persons per household, with married-couple households (465 | 38.4%) accounting for the largest median household size of 3.55 persons per household. non-family households (540 | 44.6%) represent the smallest median household size with 1.51 persons per household.
| Household Type | # Households | Household Size |
| Married-Couple | 465 (38.4%) | 3.55 |
| Single Male/Father | 100 (8.3%) | 3.24 |
| Single Female/Mother | 105 (8.7%) | 2.44 |
| Non-family | 540 (44.6%) | 1.51 |
| Total Households | 1,210 (100.0%) | 2.52 |
Household Size by Marriage Status in Humboldt Hill
Out of a total of 1,210 households in Humboldt Hill, 670 (55.4%) are family households, while 540 (44.6%) are nonfamily households. The most numerous type of family households are 2-person households, comprising 265, and the most common type of nonfamily households are 1-person households, comprising 397.
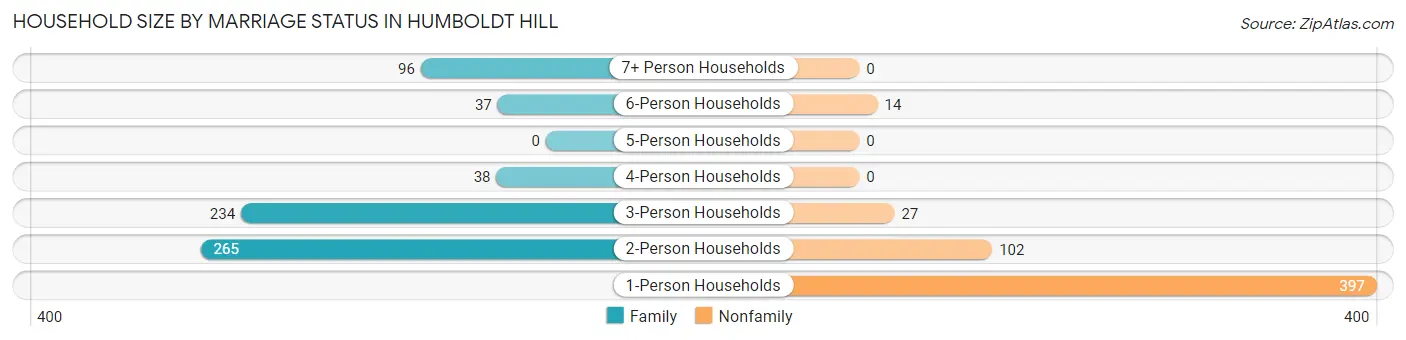
| Household Size | Family Households | Nonfamily Households |
| 1-Person Households | - | 397 (32.8%) |
| 2-Person Households | 265 (21.9%) | 102 (8.4%) |
| 3-Person Households | 234 (19.3%) | 27 (2.2%) |
| 4-Person Households | 38 (3.1%) | 0 (0.0%) |
| 5-Person Households | 0 (0.0%) | 0 (0.0%) |
| 6-Person Households | 37 (3.1%) | 14 (1.2%) |
| 7+ Person Households | 96 (7.9%) | 0 (0.0%) |
| Total | 670 (55.4%) | 540 (44.6%) |
Female Fertility in Humboldt Hill
Fertility by Age in Humboldt Hill
Average fertility rate in Humboldt Hill is 50.0 births per 1,000 women. Women in the age bracket of 20 to 34 years have the highest fertility rate with 62.0 births per 1,000 women. Women in the age bracket of 20 to 34 years acount for 68.8% of all women with births.
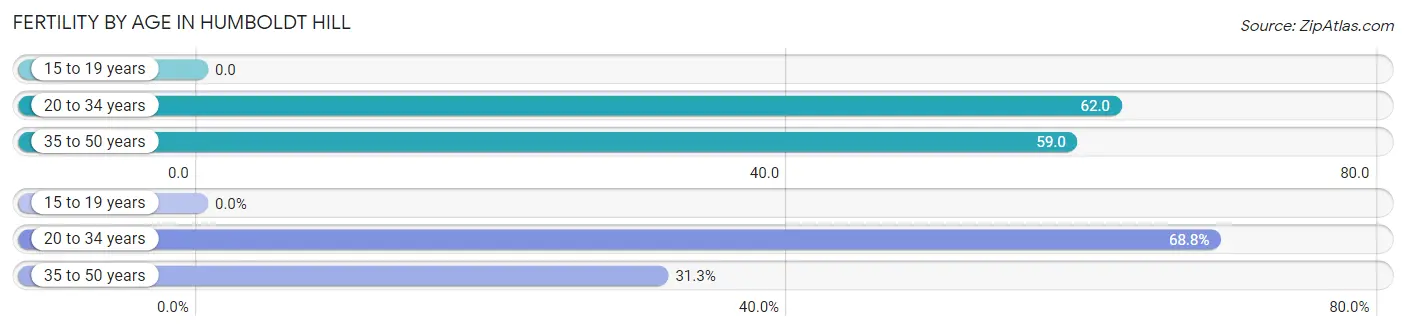
| Age Bracket | Women with Births | Births / 1,000 Women |
| 15 to 19 years | 0 (0.0%) | 0.0 |
| 20 to 34 years | 22 (68.8%) | 62.0 |
| 35 to 50 years | 10 (31.2%) | 59.0 |
| Total | 32 (100.0%) | 50.0 |
Fertility by Age by Marriage Status in Humboldt Hill
31.2% of women with births (32) in Humboldt Hill are married. The highest percentage of unmarried women with births falls into 20 to 34 years age bracket with 100.0% of them unmarried at the time of birth, while the lowest percentage of unmarried women with births belong to 35 to 50 years age bracket with 0.0% of them unmarried.
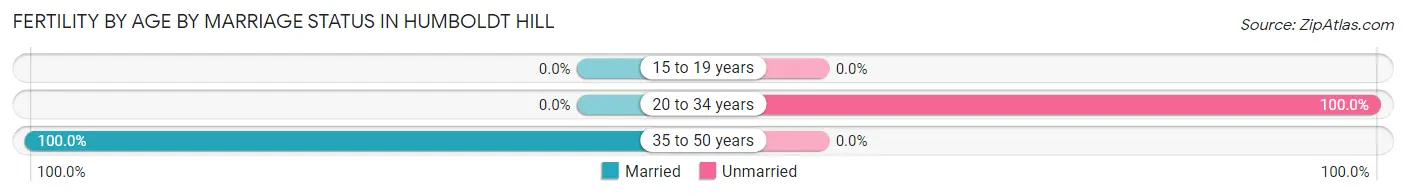
| Age Bracket | Married | Unmarried |
| 15 to 19 years | 0 (0.0%) | 0 (0.0%) |
| 20 to 34 years | 0 (0.0%) | 22 (100.0%) |
| 35 to 50 years | 10 (100.0%) | 0 (0.0%) |
| Total | 10 (31.2%) | 22 (68.8%) |
Fertility by Education in Humboldt Hill
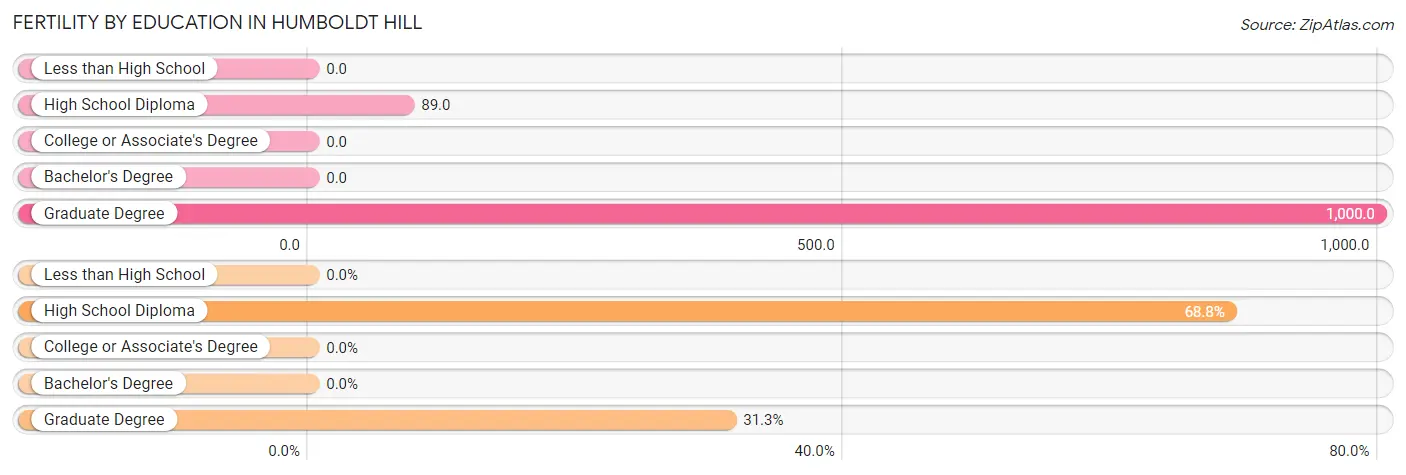
| Educational Attainment | Women with Births | Births / 1,000 Women |
| Less than High School | 0 (0.0%) | 0.0 |
| High School Diploma | 22 (68.8%) | 89.0 |
| College or Associate's Degree | 0 (0.0%) | 0.0 |
| Bachelor's Degree | 0 (0.0%) | 0.0 |
| Graduate Degree | 10 (31.2%) | 1,000.0 |
| Total | 32 (100.0%) | 50.0 |
Fertility by Education by Marriage Status in Humboldt Hill
68.8% of women with births in Humboldt Hill are unmarried. Women with the educational attainment of graduate degree are most likely to be married with 100.0% of them married at childbirth, while women with the educational attainment of high school diploma are least likely to be married with 100.0% of them unmarried at childbirth.
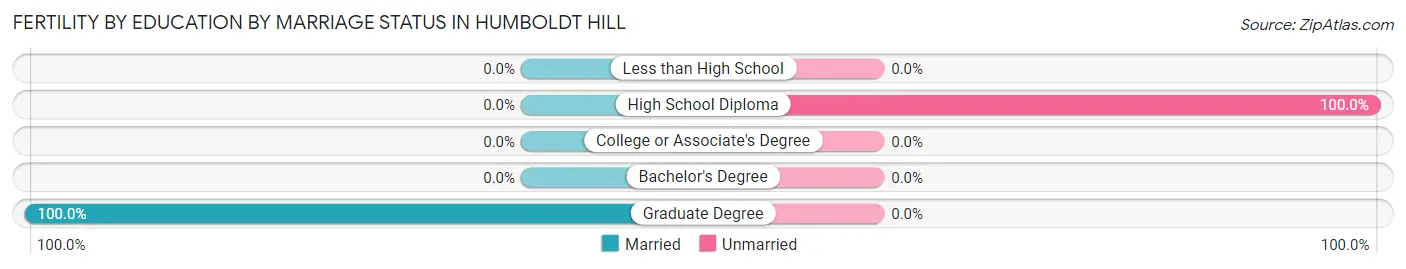
| Educational Attainment | Married | Unmarried |
| Less than High School | 0 (0.0%) | 0 (0.0%) |
| High School Diploma | 0 (0.0%) | 22 (100.0%) |
| College or Associate's Degree | 0 (0.0%) | 0 (0.0%) |
| Bachelor's Degree | 0 (0.0%) | 0 (0.0%) |
| Graduate Degree | 10 (100.0%) | 0 (0.0%) |
| Total | 10 (31.2%) | 22 (68.8%) |
Employment Characteristics in Humboldt Hill
Employment by Class of Employer in Humboldt Hill
Among the 1,453 employed individuals in Humboldt Hill, private company employees (788 | 54.2%), local government employees (208 | 14.3%), and self-employed (not incorporated) (155 | 10.7%) make up the most common classes of employment.
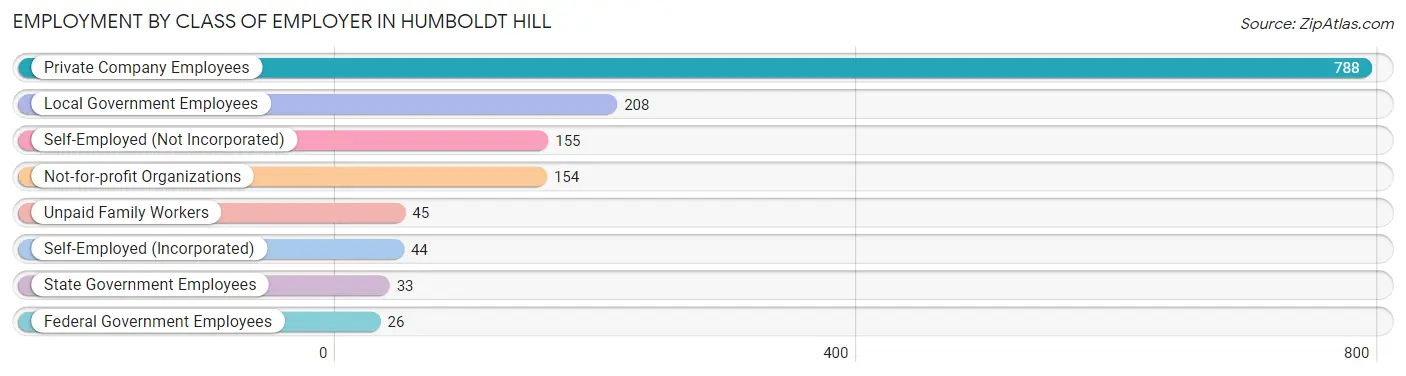
| Employer Class | # Employees | % Employees |
| Private Company Employees | 788 | 54.2% |
| Self-Employed (Incorporated) | 44 | 3.0% |
| Self-Employed (Not Incorporated) | 155 | 10.7% |
| Not-for-profit Organizations | 154 | 10.6% |
| Local Government Employees | 208 | 14.3% |
| State Government Employees | 33 | 2.3% |
| Federal Government Employees | 26 | 1.8% |
| Unpaid Family Workers | 45 | 3.1% |
| Total | 1,453 | 100.0% |
Employment Status by Age in Humboldt Hill
According to the labor force statistics for Humboldt Hill, out of the total population over 16 years of age (2,782), 56.5% or 1,572 individuals are in the labor force, with 5.3% or 83 of them unemployed. The age group with the highest labor force participation rate is 30 to 34 years, with 100.0% or 153 individuals in the labor force. Within the labor force, the 16 to 19 years age range has the highest percentage of unemployed individuals, with 29.2% or 40 of them being unemployed.
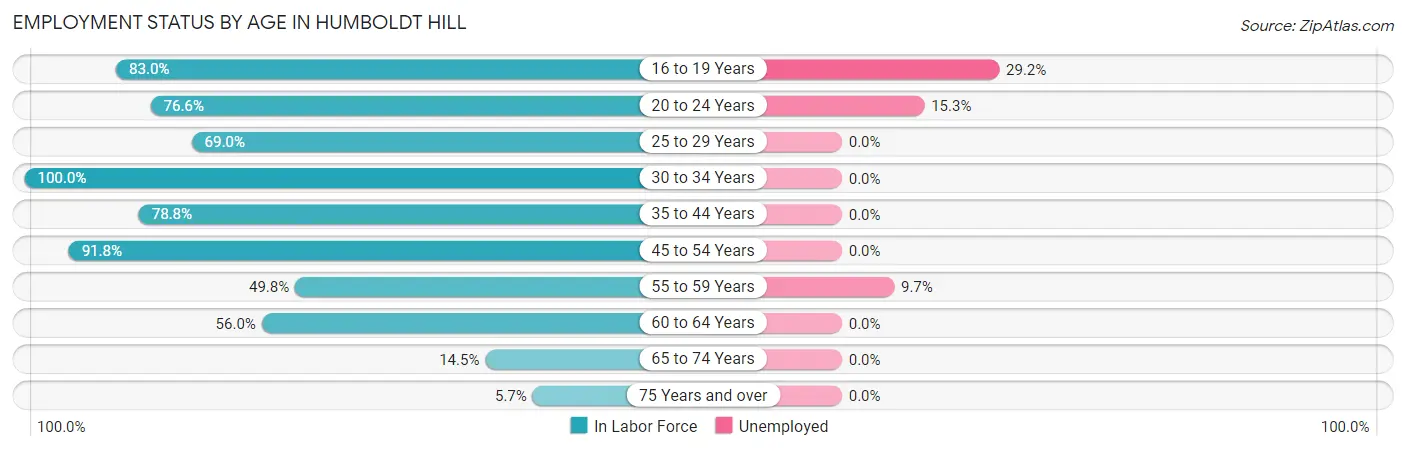
| Age Bracket | In Labor Force | Unemployed |
| 16 to 19 Years | 137 (83.0%) | 40 (29.2%) |
| 20 to 24 Years | 196 (76.6%) | 30 (15.3%) |
| 25 to 29 Years | 98 (69.0%) | 0 (0.0%) |
| 30 to 34 Years | 153 (100.0%) | 0 (0.0%) |
| 35 to 44 Years | 315 (78.8%) | 0 (0.0%) |
| 45 to 54 Years | 234 (91.8%) | 0 (0.0%) |
| 55 to 59 Years | 145 (49.8%) | 14 (9.7%) |
| 60 to 64 Years | 216 (56.0%) | 0 (0.0%) |
| 65 to 74 Years | 61 (14.5%) | 0 (0.0%) |
| 75 Years and over | 18 (5.7%) | 0 (0.0%) |
| Total | 1,572 (56.5%) | 83 (5.3%) |
Employment Status by Educational Attainment in Humboldt Hill
According to labor force statistics for Humboldt Hill, 71.4% of individuals (1,162) out of the total population between 25 and 64 years of age (1,627) are in the labor force, with 1.2% or 14 of them being unemployed. The group with the highest labor force participation rate are those with the educational attainment of bachelor's degree or higher, with 91.5% or 214 individuals in the labor force. Within the labor force, individuals with less than high school education have the highest percentage of unemployment, with 9.1% or 14 of them being unemployed.
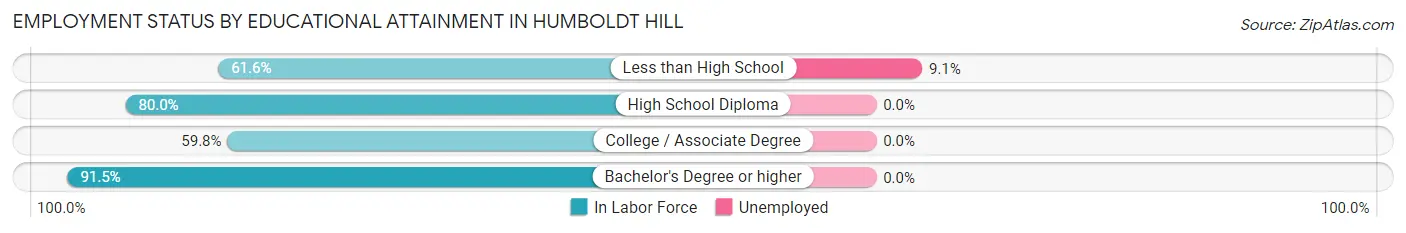
| Educational Attainment | In Labor Force | Unemployed |
| Less than High School | 154 (61.6%) | 23 (9.1%) |
| High School Diploma | 433 (80.0%) | 0 (0.0%) |
| College / Associate Degree | 360 (59.8%) | 0 (0.0%) |
| Bachelor's Degree or higher | 214 (91.5%) | 0 (0.0%) |
| Total | 1,162 (71.4%) | 20 (1.2%) |
Employment Occupations by Sex in Humboldt Hill
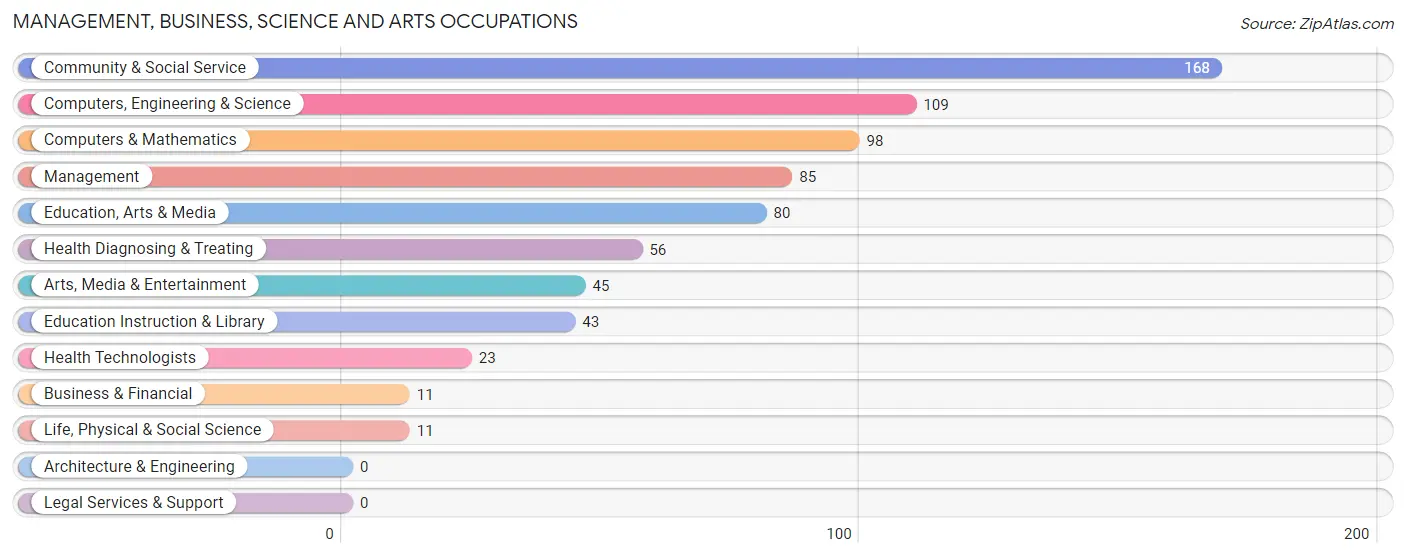
Management, Business, Science and Arts Occupations
The most common Management, Business, Science and Arts occupations in Humboldt Hill are Community & Social Service (168 | 11.3%), Computers, Engineering & Science (109 | 7.3%), Computers & Mathematics (98 | 6.6%), Management (85 | 5.7%), and Education, Arts & Media (80 | 5.4%).
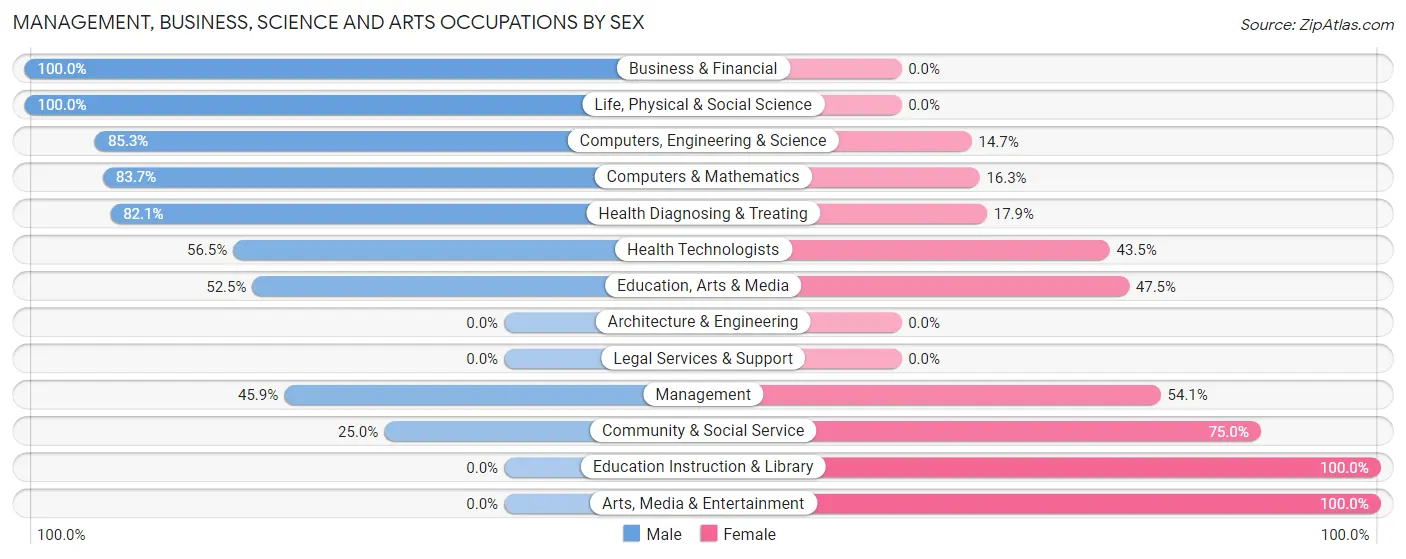
Management, Business, Science and Arts Occupations by Sex
Within the Management, Business, Science and Arts occupations in Humboldt Hill, the most male-oriented occupations are Business & Financial (100.0%), Life, Physical & Social Science (100.0%), and Computers, Engineering & Science (85.3%), while the most female-oriented occupations are Education Instruction & Library (100.0%), Arts, Media & Entertainment (100.0%), and Community & Social Service (75.0%).
| Occupation | Male | Female |
| Management | 39 (45.9%) | 46 (54.1%) |
| Business & Financial | 11 (100.0%) | 0 (0.0%) |
| Computers, Engineering & Science | 93 (85.3%) | 16 (14.7%) |
| Computers & Mathematics | 82 (83.7%) | 16 (16.3%) |
| Architecture & Engineering | 0 (0.0%) | 0 (0.0%) |
| Life, Physical & Social Science | 11 (100.0%) | 0 (0.0%) |
| Community & Social Service | 42 (25.0%) | 126 (75.0%) |
| Education, Arts & Media | 42 (52.5%) | 38 (47.5%) |
| Legal Services & Support | 0 (0.0%) | 0 (0.0%) |
| Education Instruction & Library | 0 (0.0%) | 43 (100.0%) |
| Arts, Media & Entertainment | 0 (0.0%) | 45 (100.0%) |
| Health Diagnosing & Treating | 46 (82.1%) | 10 (17.9%) |
| Health Technologists | 13 (56.5%) | 10 (43.5%) |
| Total (Category) | 231 (53.8%) | 198 (46.2%) |
| Total (Overall) | 872 (58.6%) | 617 (41.4%) |
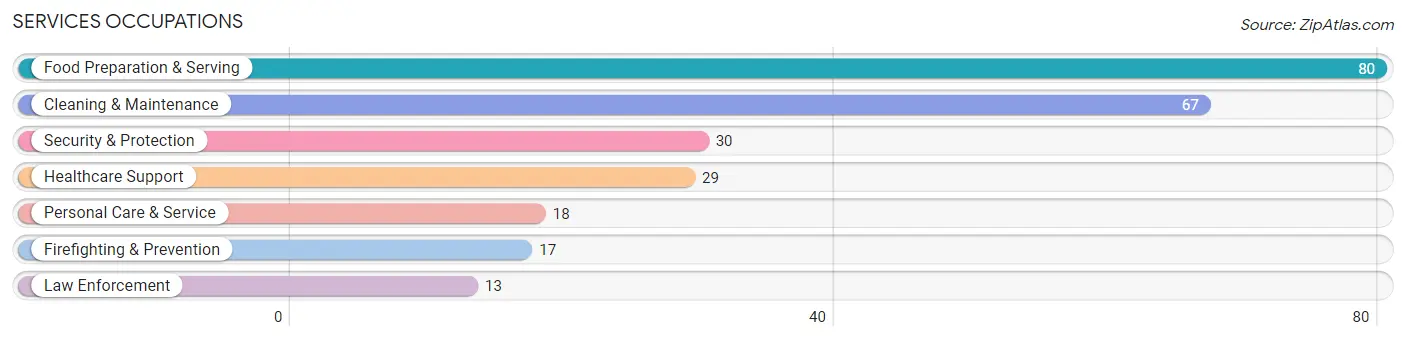
Services Occupations
The most common Services occupations in Humboldt Hill are Food Preparation & Serving (80 | 5.4%), Cleaning & Maintenance (67 | 4.5%), Security & Protection (30 | 2.0%), Healthcare Support (29 | 1.9%), and Personal Care & Service (18 | 1.2%).
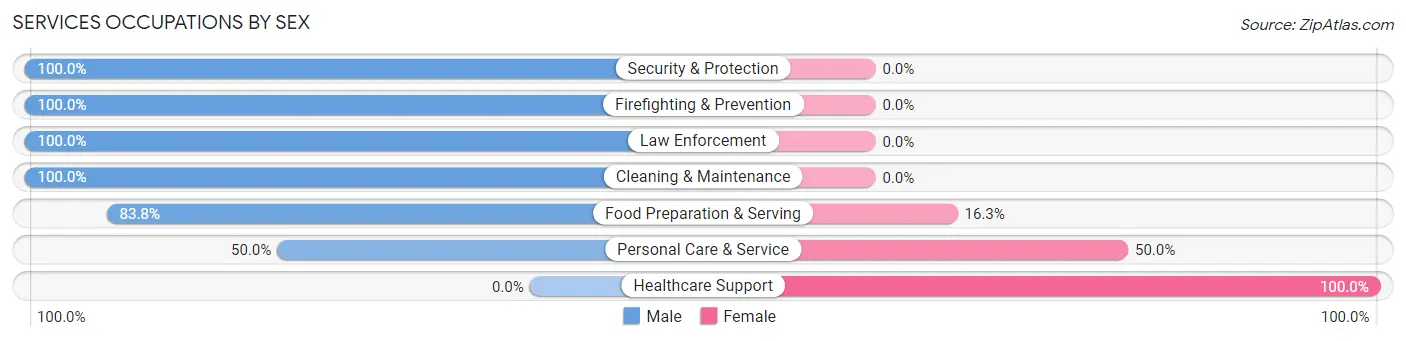
Services Occupations by Sex
Within the Services occupations in Humboldt Hill, the most male-oriented occupations are Security & Protection (100.0%), Firefighting & Prevention (100.0%), and Law Enforcement (100.0%), while the most female-oriented occupations are Healthcare Support (100.0%), Personal Care & Service (50.0%), and Food Preparation & Serving (16.3%).
| Occupation | Male | Female |
| Healthcare Support | 0 (0.0%) | 29 (100.0%) |
| Security & Protection | 30 (100.0%) | 0 (0.0%) |
| Firefighting & Prevention | 17 (100.0%) | 0 (0.0%) |
| Law Enforcement | 13 (100.0%) | 0 (0.0%) |
| Food Preparation & Serving | 67 (83.8%) | 13 (16.3%) |
| Cleaning & Maintenance | 67 (100.0%) | 0 (0.0%) |
| Personal Care & Service | 9 (50.0%) | 9 (50.0%) |
| Total (Category) | 173 (77.2%) | 51 (22.8%) |
| Total (Overall) | 872 (58.6%) | 617 (41.4%) |
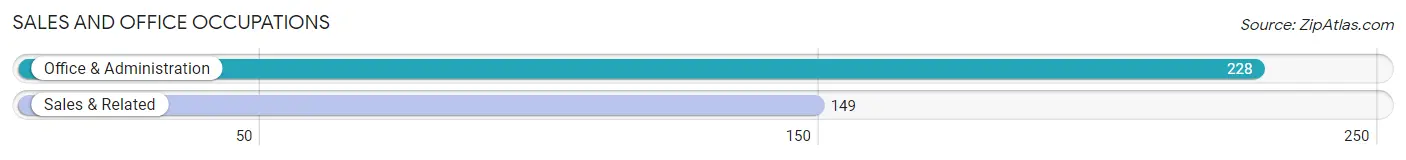
Sales and Office Occupations
The most common Sales and Office occupations in Humboldt Hill are Office & Administration (228 | 15.3%), and Sales & Related (149 | 10.0%).
Sales and Office Occupations by Sex
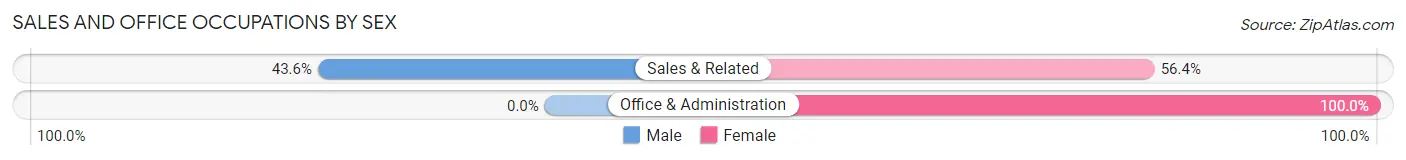
| Occupation | Male | Female |
| Sales & Related | 65 (43.6%) | 84 (56.4%) |
| Office & Administration | 0 (0.0%) | 228 (100.0%) |
| Total (Category) | 65 (17.2%) | 312 (82.8%) |
| Total (Overall) | 872 (58.6%) | 617 (41.4%) |
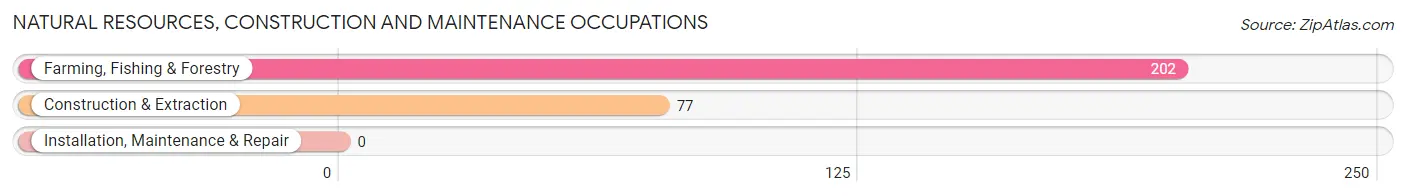
Natural Resources, Construction and Maintenance Occupations
The most common Natural Resources, Construction and Maintenance occupations in Humboldt Hill are Farming, Fishing & Forestry (202 | 13.6%), and Construction & Extraction (77 | 5.2%).
Natural Resources, Construction and Maintenance Occupations by Sex
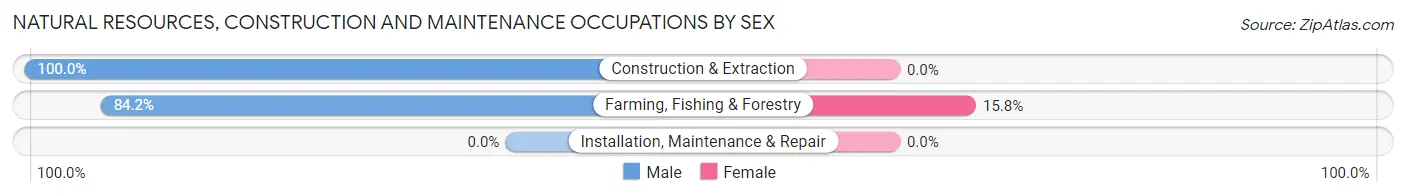
| Occupation | Male | Female |
| Farming, Fishing & Forestry | 170 (84.2%) | 32 (15.8%) |
| Construction & Extraction | 77 (100.0%) | 0 (0.0%) |
| Installation, Maintenance & Repair | 0 (0.0%) | 0 (0.0%) |
| Total (Category) | 247 (88.5%) | 32 (11.5%) |
| Total (Overall) | 872 (58.6%) | 617 (41.4%) |
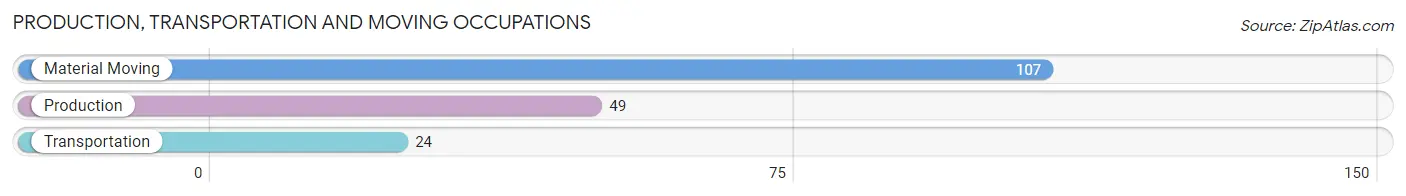
Production, Transportation and Moving Occupations
The most common Production, Transportation and Moving occupations in Humboldt Hill are Material Moving (107 | 7.2%), Production (49 | 3.3%), and Transportation (24 | 1.6%).
Production, Transportation and Moving Occupations by Sex
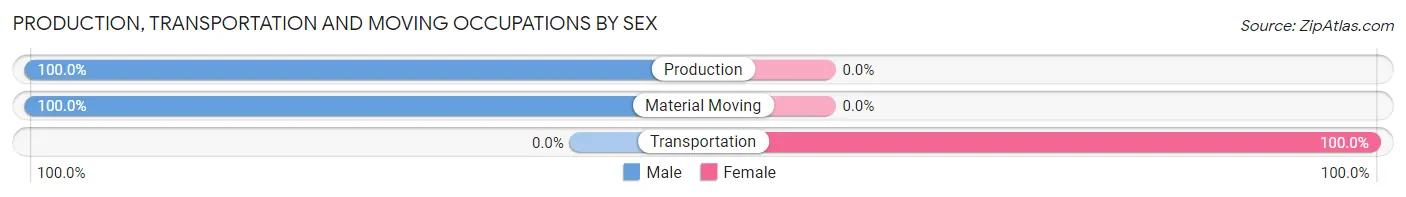
| Occupation | Male | Female |
| Production | 49 (100.0%) | 0 (0.0%) |
| Transportation | 0 (0.0%) | 24 (100.0%) |
| Material Moving | 107 (100.0%) | 0 (0.0%) |
| Total (Category) | 156 (86.7%) | 24 (13.3%) |
| Total (Overall) | 872 (58.6%) | 617 (41.4%) |
Employment Industries by Sex in Humboldt Hill
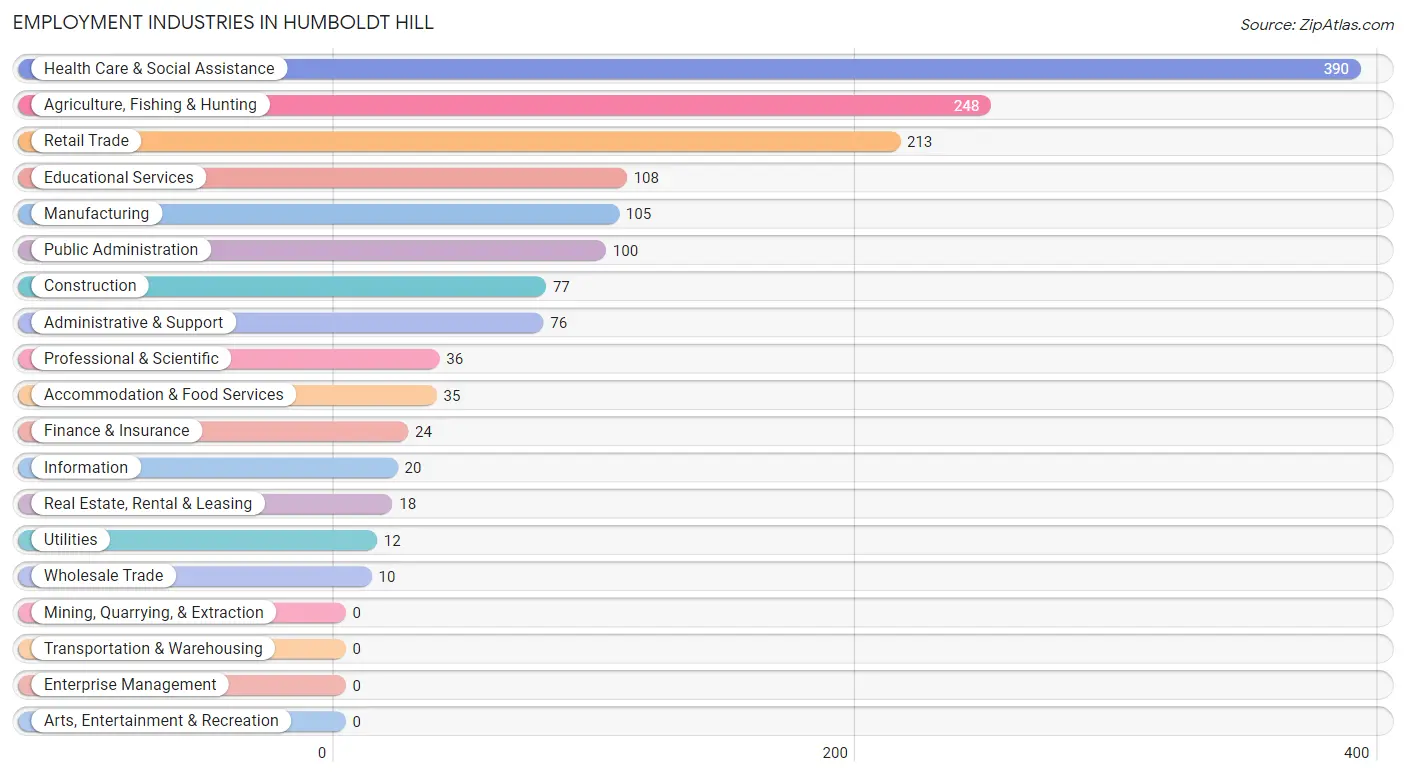
Employment Industries in Humboldt Hill
The major employment industries in Humboldt Hill include Health Care & Social Assistance (390 | 26.2%), Agriculture, Fishing & Hunting (248 | 16.7%), Retail Trade (213 | 14.3%), Educational Services (108 | 7.2%), and Manufacturing (105 | 7.0%).
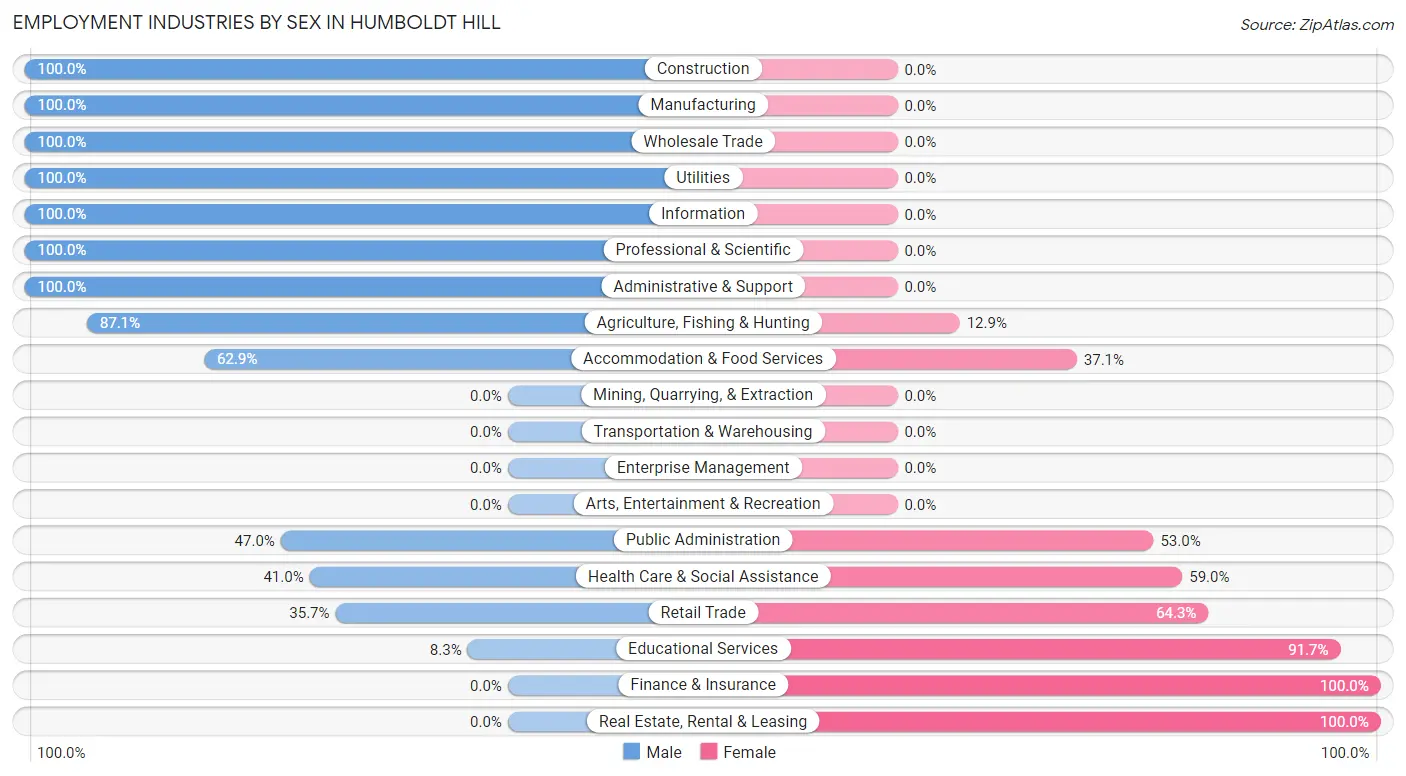
Employment Industries by Sex in Humboldt Hill
The Humboldt Hill industries that see more men than women are Construction (100.0%), Manufacturing (100.0%), and Wholesale Trade (100.0%), whereas the industries that tend to have a higher number of women are Finance & Insurance (100.0%), Real Estate, Rental & Leasing (100.0%), and Educational Services (91.7%).
| Industry | Male | Female |
| Agriculture, Fishing & Hunting | 216 (87.1%) | 32 (12.9%) |
| Mining, Quarrying, & Extraction | 0 (0.0%) | 0 (0.0%) |
| Construction | 77 (100.0%) | 0 (0.0%) |
| Manufacturing | 105 (100.0%) | 0 (0.0%) |
| Wholesale Trade | 10 (100.0%) | 0 (0.0%) |
| Retail Trade | 76 (35.7%) | 137 (64.3%) |
| Transportation & Warehousing | 0 (0.0%) | 0 (0.0%) |
| Utilities | 12 (100.0%) | 0 (0.0%) |
| Information | 20 (100.0%) | 0 (0.0%) |
| Finance & Insurance | 0 (0.0%) | 24 (100.0%) |
| Real Estate, Rental & Leasing | 0 (0.0%) | 18 (100.0%) |
| Professional & Scientific | 36 (100.0%) | 0 (0.0%) |
| Enterprise Management | 0 (0.0%) | 0 (0.0%) |
| Administrative & Support | 76 (100.0%) | 0 (0.0%) |
| Educational Services | 9 (8.3%) | 99 (91.7%) |
| Health Care & Social Assistance | 160 (41.0%) | 230 (59.0%) |
| Arts, Entertainment & Recreation | 0 (0.0%) | 0 (0.0%) |
| Accommodation & Food Services | 22 (62.9%) | 13 (37.1%) |
| Public Administration | 47 (47.0%) | 53 (53.0%) |
| Total | 872 (58.6%) | 617 (41.4%) |
Education in Humboldt Hill
School Enrollment in Humboldt Hill
The most common levels of schooling among the 470 students in Humboldt Hill are college / undergraduate (206 | 43.8%), middle school (141 | 30.0%), and high school (95 | 20.2%).
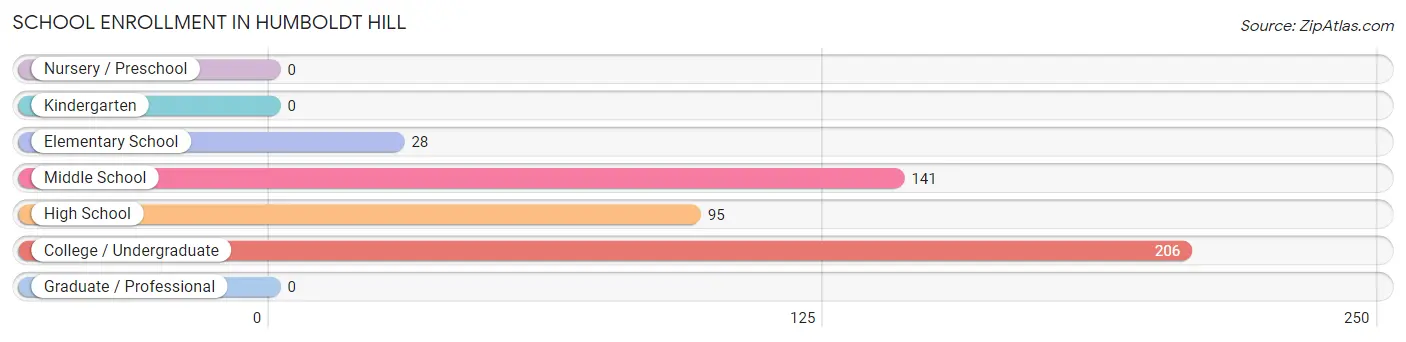
| School Level | # Students | % Students |
| Nursery / Preschool | 0 | 0.0% |
| Kindergarten | 0 | 0.0% |
| Elementary School | 28 | 6.0% |
| Middle School | 141 | 30.0% |
| High School | 95 | 20.2% |
| College / Undergraduate | 206 | 43.8% |
| Graduate / Professional | 0 | 0.0% |
| Total | 470 | 100.0% |
School Enrollment by Age by Funding Source in Humboldt Hill
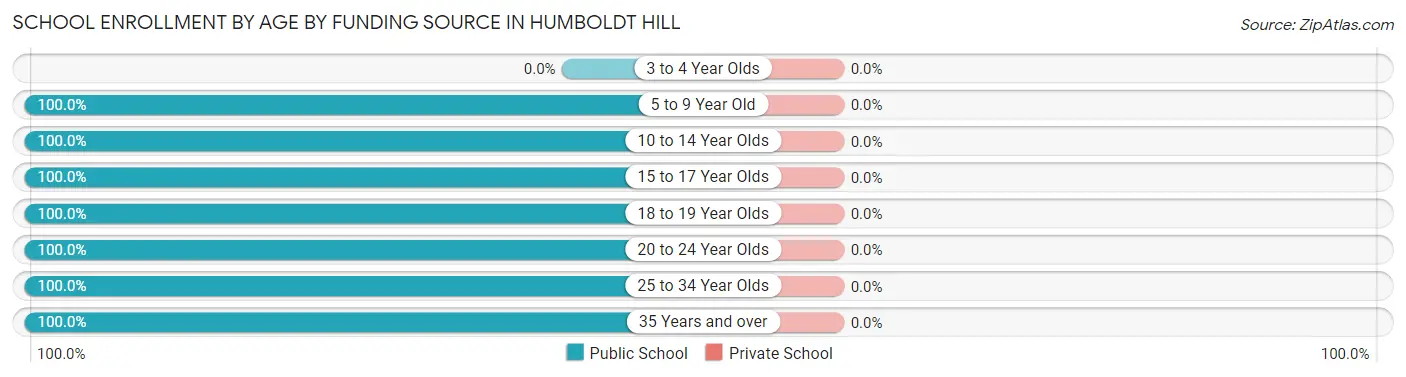
| Age Bracket | Public School | Private School |
| 3 to 4 Year Olds | 0 (0.0%) | 0 (0.0%) |
| 5 to 9 Year Old | 28 (100.0%) | 0 (0.0%) |
| 10 to 14 Year Olds | 141 (100.0%) | 0 (0.0%) |
| 15 to 17 Year Olds | 67 (100.0%) | 0 (0.0%) |
| 18 to 19 Year Olds | 111 (100.0%) | 0 (0.0%) |
| 20 to 24 Year Olds | 110 (100.0%) | 0 (0.0%) |
| 25 to 34 Year Olds | 9 (100.0%) | 0 (0.0%) |
| 35 Years and over | 4 (100.0%) | 0 (0.0%) |
| Total | 470 (100.0%) | 0 (0.0%) |
Educational Attainment by Field of Study in Humboldt Hill
Science & technology (69 | 13.8%), education (69 | 13.8%), social sciences (57 | 11.4%), visual & performing arts (57 | 11.4%), and bio, nature & agricultural (50 | 10.0%) are the most common fields of study among 500 individuals in Humboldt Hill who have obtained a bachelor's degree or higher.
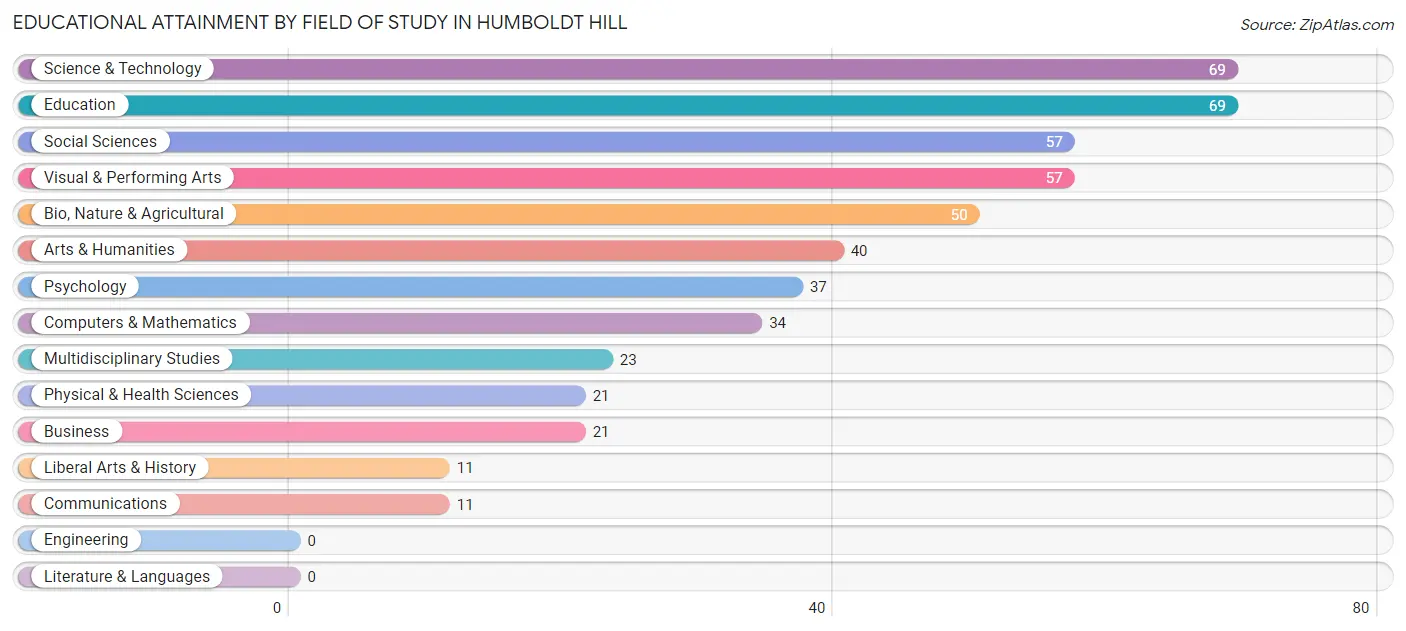
| Field of Study | # Graduates | % Graduates |
| Computers & Mathematics | 34 | 6.8% |
| Bio, Nature & Agricultural | 50 | 10.0% |
| Physical & Health Sciences | 21 | 4.2% |
| Psychology | 37 | 7.4% |
| Social Sciences | 57 | 11.4% |
| Engineering | 0 | 0.0% |
| Multidisciplinary Studies | 23 | 4.6% |
| Science & Technology | 69 | 13.8% |
| Business | 21 | 4.2% |
| Education | 69 | 13.8% |
| Literature & Languages | 0 | 0.0% |
| Liberal Arts & History | 11 | 2.2% |
| Visual & Performing Arts | 57 | 11.4% |
| Communications | 11 | 2.2% |
| Arts & Humanities | 40 | 8.0% |
| Total | 500 | 100.0% |
Transportation & Commute in Humboldt Hill
Vehicle Availability by Sex in Humboldt Hill
The most prevalent vehicle ownership categories in Humboldt Hill are males with 1 vehicle (240, accounting for 29.3%) and females with 1 vehicle (94, making up 41.2%).
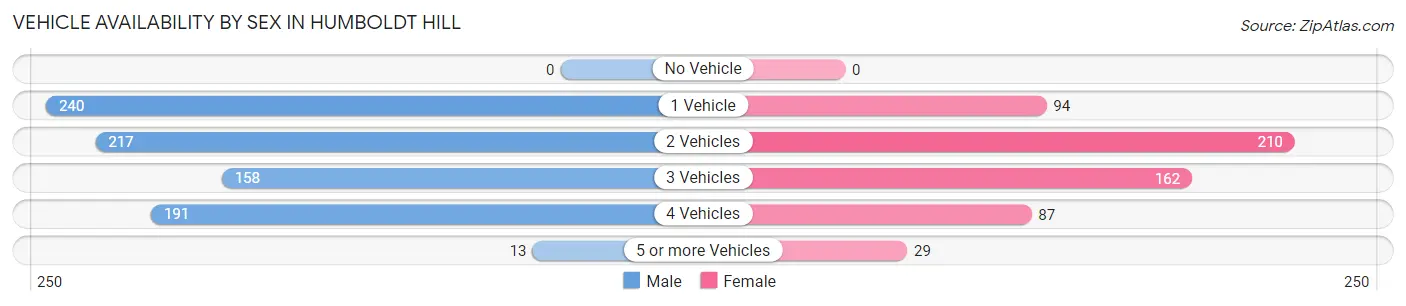
| Vehicles Available | Male | Female |
| No Vehicle | 0 (0.0%) | 0 (0.0%) |
| 1 Vehicle | 240 (29.3%) | 94 (16.2%) |
| 2 Vehicles | 217 (26.5%) | 210 (36.1%) |
| 3 Vehicles | 158 (19.3%) | 162 (27.8%) |
| 4 Vehicles | 191 (23.3%) | 87 (14.9%) |
| 5 or more Vehicles | 13 (1.6%) | 29 (5.0%) |
| Total | 819 (100.0%) | 582 (100.0%) |
Commute Time in Humboldt Hill
The most frequently occuring commute durations in Humboldt Hill are 20 to 24 minutes (388 commuters, 28.8%), 10 to 14 minutes (322 commuters, 23.9%), and 30 to 34 minutes (258 commuters, 19.2%).
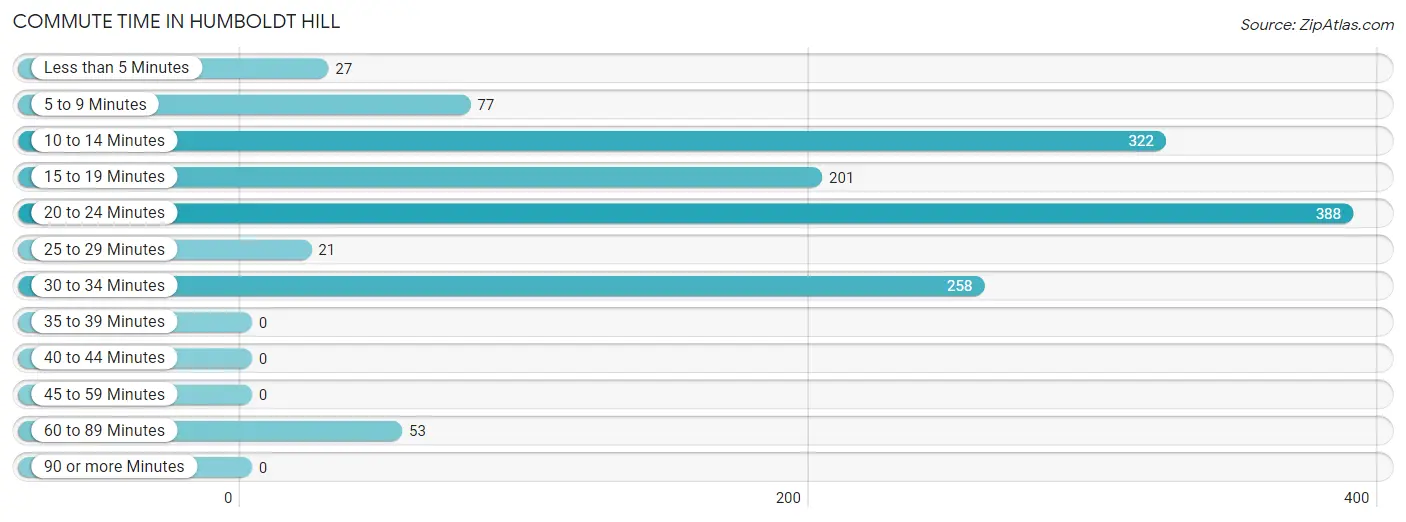
| Commute Time | # Commuters | % Commuters |
| Less than 5 Minutes | 27 | 2.0% |
| 5 to 9 Minutes | 77 | 5.7% |
| 10 to 14 Minutes | 322 | 23.9% |
| 15 to 19 Minutes | 201 | 14.9% |
| 20 to 24 Minutes | 388 | 28.8% |
| 25 to 29 Minutes | 21 | 1.6% |
| 30 to 34 Minutes | 258 | 19.2% |
| 35 to 39 Minutes | 0 | 0.0% |
| 40 to 44 Minutes | 0 | 0.0% |
| 45 to 59 Minutes | 0 | 0.0% |
| 60 to 89 Minutes | 53 | 3.9% |
| 90 or more Minutes | 0 | 0.0% |
Commute Time by Sex in Humboldt Hill
The most common commute times in Humboldt Hill are 30 to 34 minutes (209 commuters, 28.1%) for males and 20 to 24 minutes (197 commuters, 32.6%) for females.
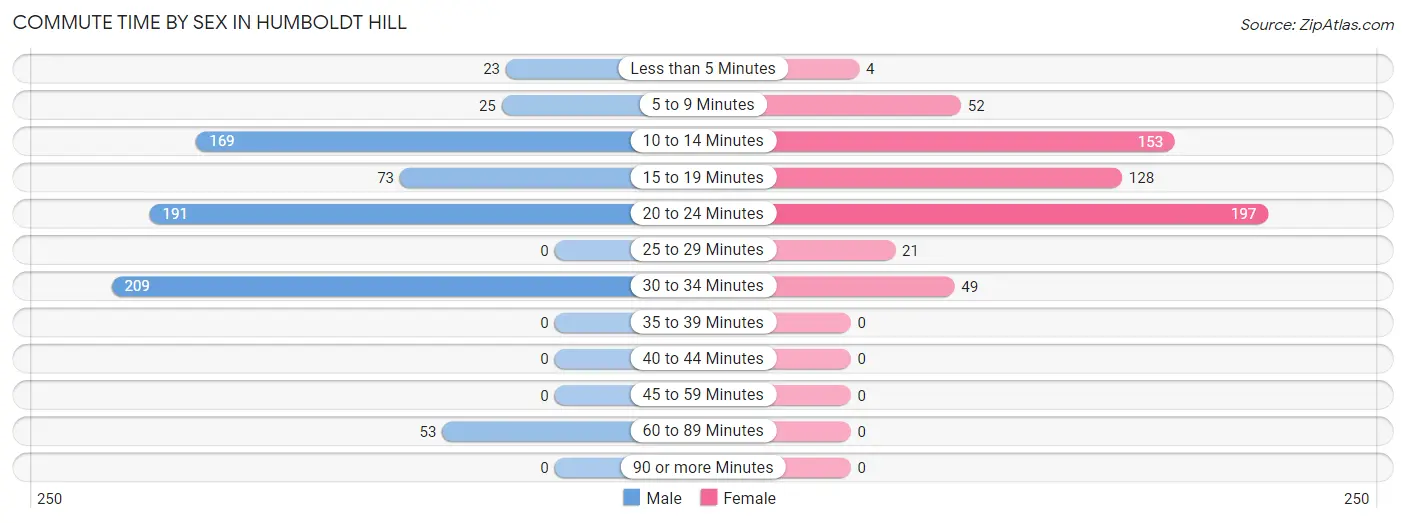
| Commute Time | Male | Female |
| Less than 5 Minutes | 23 (3.1%) | 4 (0.7%) |
| 5 to 9 Minutes | 25 (3.4%) | 52 (8.6%) |
| 10 to 14 Minutes | 169 (22.8%) | 153 (25.3%) |
| 15 to 19 Minutes | 73 (9.8%) | 128 (21.2%) |
| 20 to 24 Minutes | 191 (25.7%) | 197 (32.6%) |
| 25 to 29 Minutes | 0 (0.0%) | 21 (3.5%) |
| 30 to 34 Minutes | 209 (28.1%) | 49 (8.1%) |
| 35 to 39 Minutes | 0 (0.0%) | 0 (0.0%) |
| 40 to 44 Minutes | 0 (0.0%) | 0 (0.0%) |
| 45 to 59 Minutes | 0 (0.0%) | 0 (0.0%) |
| 60 to 89 Minutes | 53 (7.1%) | 0 (0.0%) |
| 90 or more Minutes | 0 (0.0%) | 0 (0.0%) |
Time of Departure to Work by Sex in Humboldt Hill
The most frequent times of departure to work in Humboldt Hill are 6:00 AM to 6:29 AM (221, 29.7%) for males and 7:30 AM to 7:59 AM (150, 24.8%) for females.
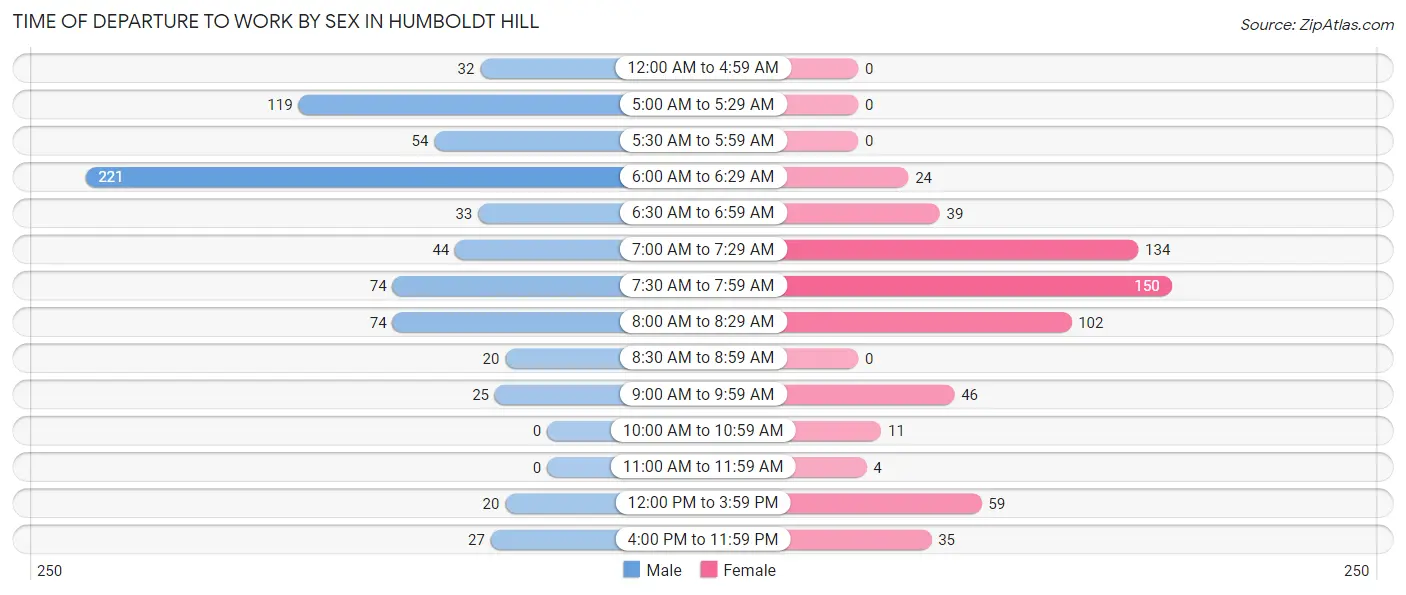
| Time of Departure | Male | Female |
| 12:00 AM to 4:59 AM | 32 (4.3%) | 0 (0.0%) |
| 5:00 AM to 5:29 AM | 119 (16.0%) | 0 (0.0%) |
| 5:30 AM to 5:59 AM | 54 (7.3%) | 0 (0.0%) |
| 6:00 AM to 6:29 AM | 221 (29.7%) | 24 (4.0%) |
| 6:30 AM to 6:59 AM | 33 (4.4%) | 39 (6.5%) |
| 7:00 AM to 7:29 AM | 44 (5.9%) | 134 (22.2%) |
| 7:30 AM to 7:59 AM | 74 (10.0%) | 150 (24.8%) |
| 8:00 AM to 8:29 AM | 74 (10.0%) | 102 (16.9%) |
| 8:30 AM to 8:59 AM | 20 (2.7%) | 0 (0.0%) |
| 9:00 AM to 9:59 AM | 25 (3.4%) | 46 (7.6%) |
| 10:00 AM to 10:59 AM | 0 (0.0%) | 11 (1.8%) |
| 11:00 AM to 11:59 AM | 0 (0.0%) | 4 (0.7%) |
| 12:00 PM to 3:59 PM | 20 (2.7%) | 59 (9.8%) |
| 4:00 PM to 11:59 PM | 27 (3.6%) | 35 (5.8%) |
| Total | 743 (100.0%) | 604 (100.0%) |
Housing Occupancy in Humboldt Hill
Occupancy by Ownership in Humboldt Hill
Of the total 1,210 dwellings in Humboldt Hill, owner-occupied units account for 760 (62.8%), while renter-occupied units make up 450 (37.2%).
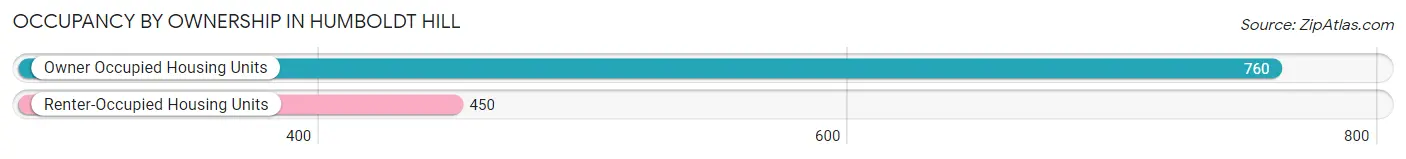
| Occupancy | # Housing Units | % Housing Units |
| Owner Occupied Housing Units | 760 | 62.8% |
| Renter-Occupied Housing Units | 450 | 37.2% |
| Total Occupied Housing Units | 1,210 | 100.0% |
Occupancy by Household Size in Humboldt Hill
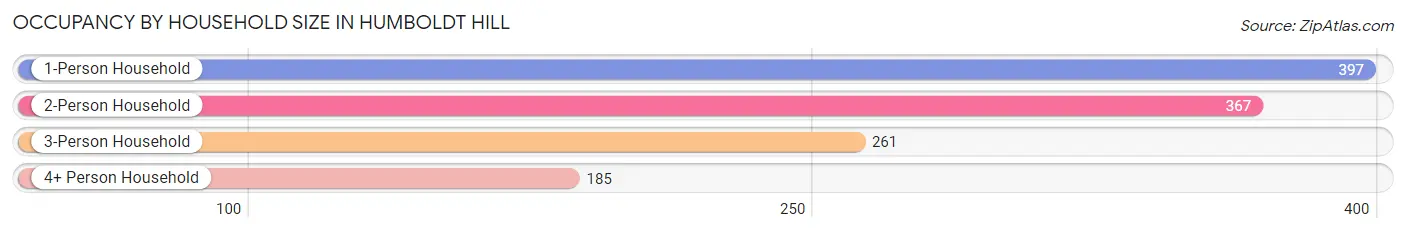
| Household Size | # Housing Units | % Housing Units |
| 1-Person Household | 397 | 32.8% |
| 2-Person Household | 367 | 30.3% |
| 3-Person Household | 261 | 21.6% |
| 4+ Person Household | 185 | 15.3% |
| Total Housing Units | 1,210 | 100.0% |
Occupancy by Ownership by Household Size in Humboldt Hill
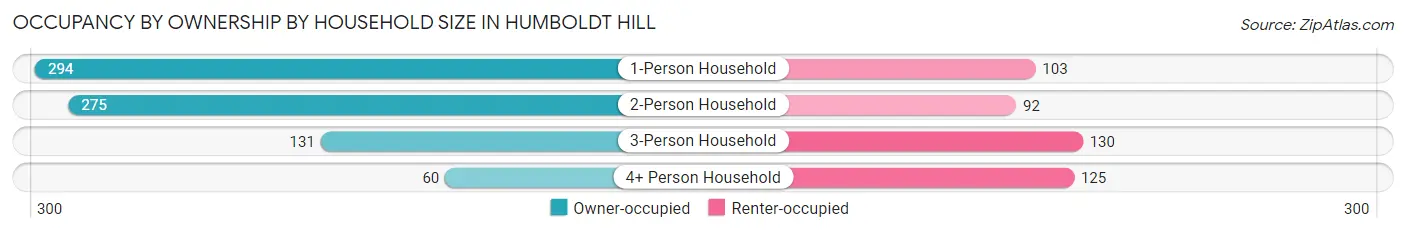
| Household Size | Owner-occupied | Renter-occupied |
| 1-Person Household | 294 (74.1%) | 103 (25.9%) |
| 2-Person Household | 275 (74.9%) | 92 (25.1%) |
| 3-Person Household | 131 (50.2%) | 130 (49.8%) |
| 4+ Person Household | 60 (32.4%) | 125 (67.6%) |
| Total Housing Units | 760 (62.8%) | 450 (37.2%) |
Occupancy by Educational Attainment in Humboldt Hill
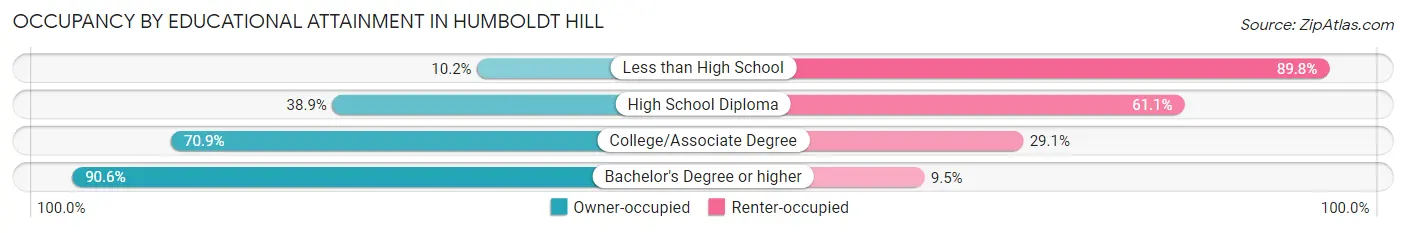
| Household Size | Owner-occupied | Renter-occupied |
| Less than High School | 14 (10.2%) | 123 (89.8%) |
| High School Diploma | 79 (38.9%) | 124 (61.1%) |
| College/Associate Degree | 437 (70.9%) | 179 (29.1%) |
| Bachelor's Degree or higher | 230 (90.5%) | 24 (9.5%) |
Occupancy by Age of Householder in Humboldt Hill
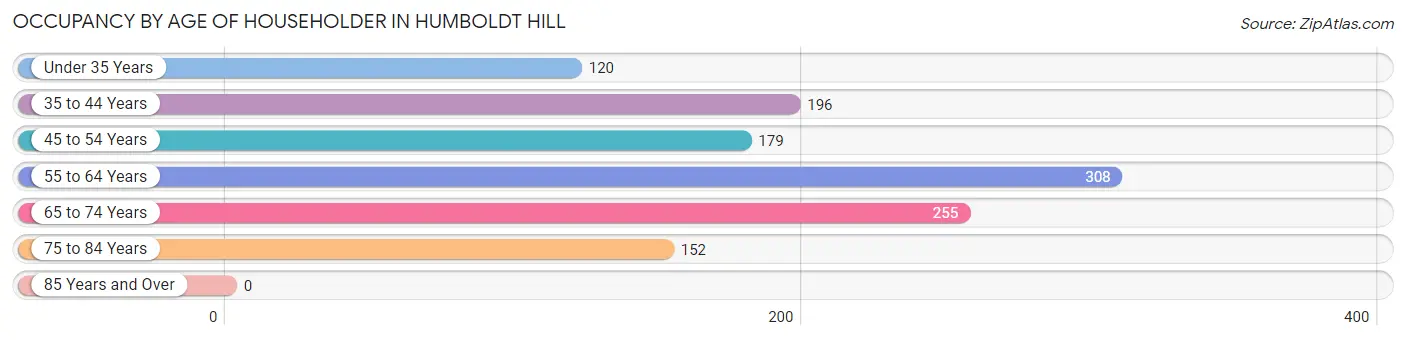
| Age Bracket | # Households | % Households |
| Under 35 Years | 120 | 9.9% |
| 35 to 44 Years | 196 | 16.2% |
| 45 to 54 Years | 179 | 14.8% |
| 55 to 64 Years | 308 | 25.5% |
| 65 to 74 Years | 255 | 21.1% |
| 75 to 84 Years | 152 | 12.6% |
| 85 Years and Over | 0 | 0.0% |
| Total | 1,210 | 100.0% |
Housing Finances in Humboldt Hill
Median Income by Occupancy in Humboldt Hill
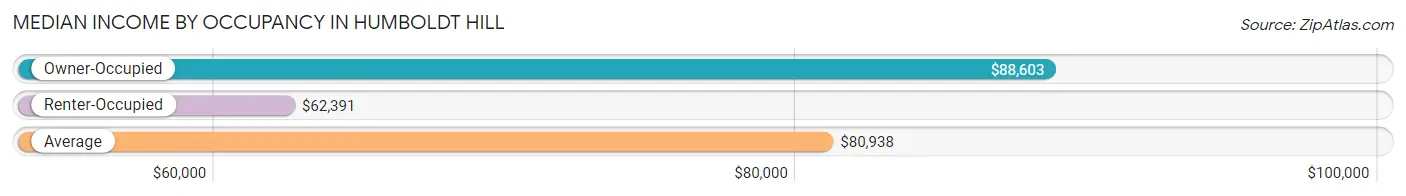
| Occupancy Type | # Households | Median Income |
| Owner-Occupied | 760 (62.8%) | $88,603 |
| Renter-Occupied | 450 (37.2%) | $62,391 |
| Average | 1,210 (100.0%) | $80,938 |
Occupancy by Householder Income Bracket in Humboldt Hill
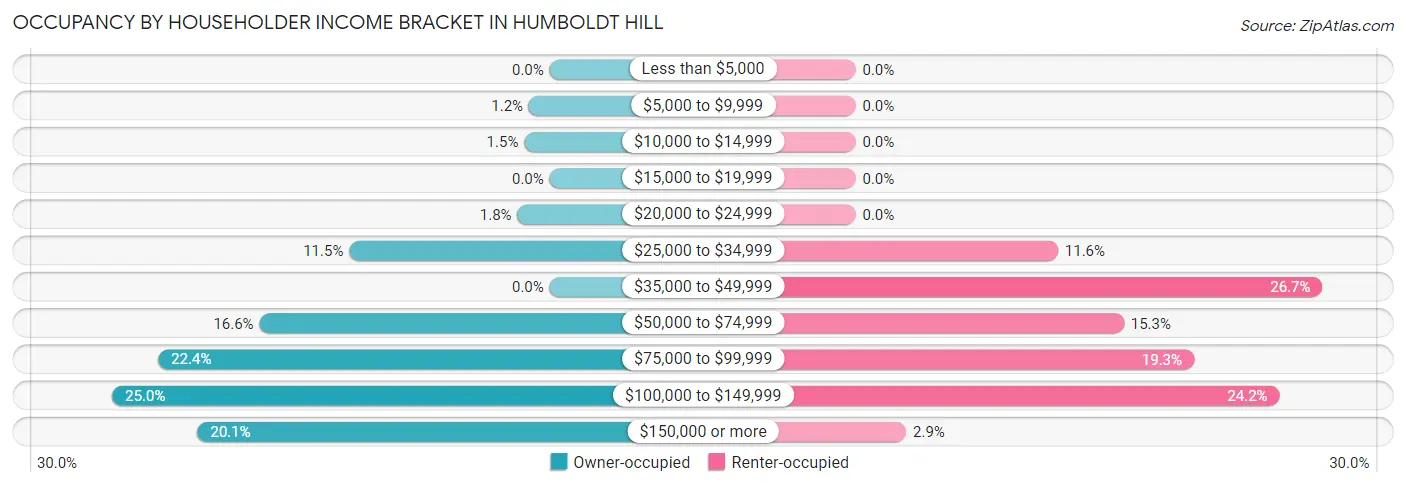
| Income Bracket | Owner-occupied | Renter-occupied |
| Less than $5,000 | 0 (0.0%) | 0 (0.0%) |
| $5,000 to $9,999 | 9 (1.2%) | 0 (0.0%) |
| $10,000 to $14,999 | 11 (1.5%) | 0 (0.0%) |
| $15,000 to $19,999 | 0 (0.0%) | 0 (0.0%) |
| $20,000 to $24,999 | 14 (1.8%) | 0 (0.0%) |
| $25,000 to $34,999 | 87 (11.5%) | 52 (11.6%) |
| $35,000 to $49,999 | 0 (0.0%) | 120 (26.7%) |
| $50,000 to $74,999 | 126 (16.6%) | 69 (15.3%) |
| $75,000 to $99,999 | 170 (22.4%) | 87 (19.3%) |
| $100,000 to $149,999 | 190 (25.0%) | 109 (24.2%) |
| $150,000 or more | 153 (20.1%) | 13 (2.9%) |
| Total | 760 (100.0%) | 450 (100.0%) |
Monthly Housing Cost Tiers in Humboldt Hill
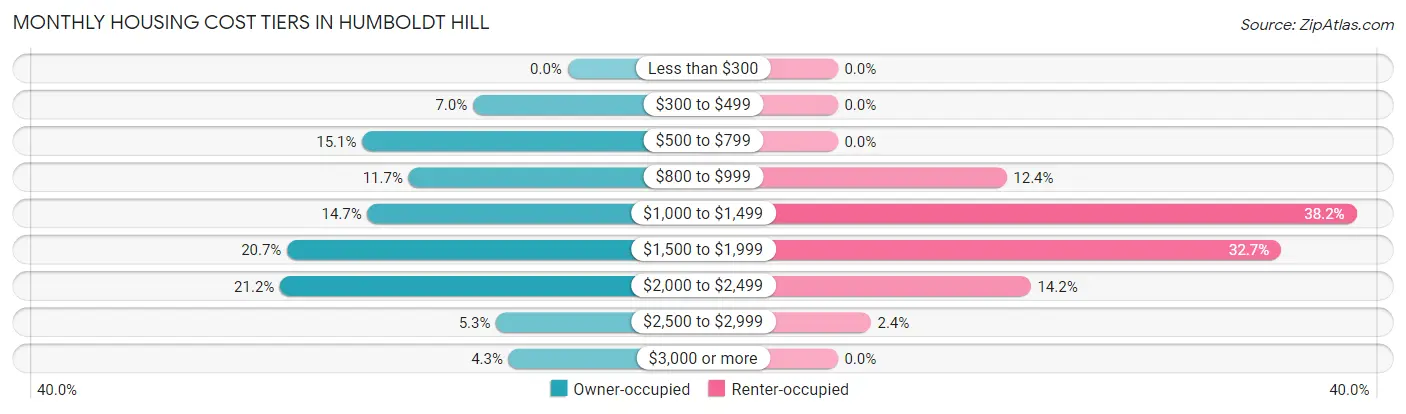
| Monthly Cost | Owner-occupied | Renter-occupied |
| Less than $300 | 0 (0.0%) | 0 (0.0%) |
| $300 to $499 | 53 (7.0%) | 0 (0.0%) |
| $500 to $799 | 115 (15.1%) | 0 (0.0%) |
| $800 to $999 | 89 (11.7%) | 56 (12.4%) |
| $1,000 to $1,499 | 112 (14.7%) | 172 (38.2%) |
| $1,500 to $1,999 | 157 (20.7%) | 147 (32.7%) |
| $2,000 to $2,499 | 161 (21.2%) | 64 (14.2%) |
| $2,500 to $2,999 | 40 (5.3%) | 11 (2.4%) |
| $3,000 or more | 33 (4.3%) | 0 (0.0%) |
| Total | 760 (100.0%) | 450 (100.0%) |
Physical Housing Characteristics in Humboldt Hill
Housing Structures in Humboldt Hill
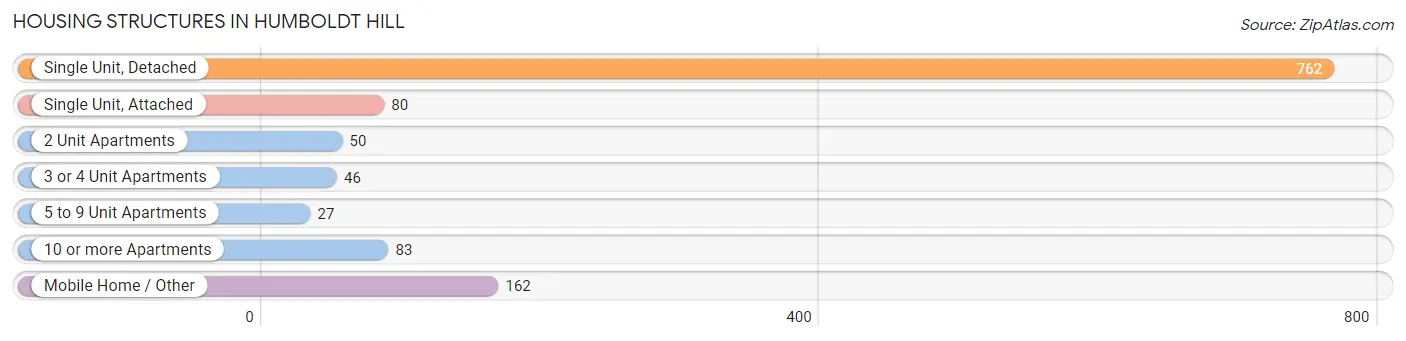
| Structure Type | # Housing Units | % Housing Units |
| Single Unit, Detached | 762 | 63.0% |
| Single Unit, Attached | 80 | 6.6% |
| 2 Unit Apartments | 50 | 4.1% |
| 3 or 4 Unit Apartments | 46 | 3.8% |
| 5 to 9 Unit Apartments | 27 | 2.2% |
| 10 or more Apartments | 83 | 6.9% |
| Mobile Home / Other | 162 | 13.4% |
| Total | 1,210 | 100.0% |
Housing Structures by Occupancy in Humboldt Hill
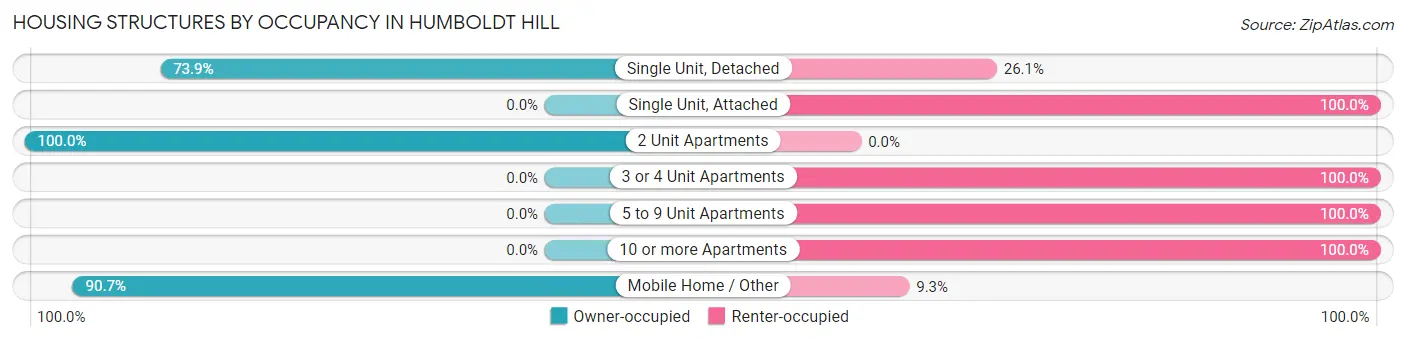
| Structure Type | Owner-occupied | Renter-occupied |
| Single Unit, Detached | 563 (73.9%) | 199 (26.1%) |
| Single Unit, Attached | 0 (0.0%) | 80 (100.0%) |
| 2 Unit Apartments | 50 (100.0%) | 0 (0.0%) |
| 3 or 4 Unit Apartments | 0 (0.0%) | 46 (100.0%) |
| 5 to 9 Unit Apartments | 0 (0.0%) | 27 (100.0%) |
| 10 or more Apartments | 0 (0.0%) | 83 (100.0%) |
| Mobile Home / Other | 147 (90.7%) | 15 (9.3%) |
| Total | 760 (62.8%) | 450 (37.2%) |
Housing Structures by Number of Rooms in Humboldt Hill
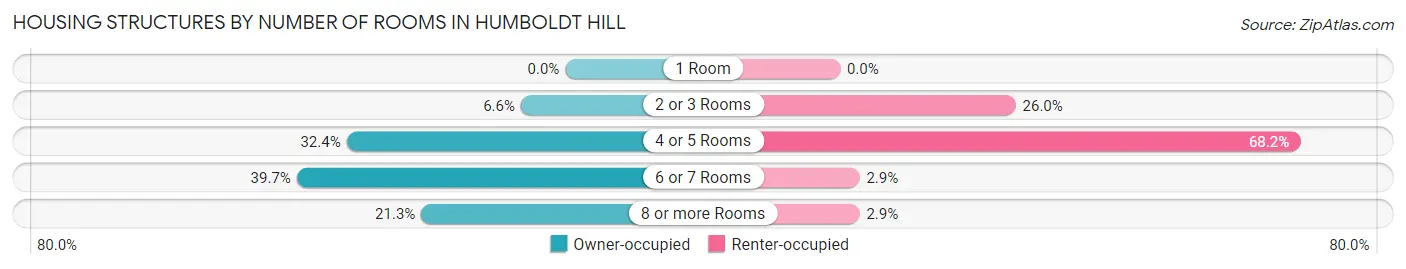
| Number of Rooms | Owner-occupied | Renter-occupied |
| 1 Room | 0 (0.0%) | 0 (0.0%) |
| 2 or 3 Rooms | 50 (6.6%) | 117 (26.0%) |
| 4 or 5 Rooms | 246 (32.4%) | 307 (68.2%) |
| 6 or 7 Rooms | 302 (39.7%) | 13 (2.9%) |
| 8 or more Rooms | 162 (21.3%) | 13 (2.9%) |
| Total | 760 (100.0%) | 450 (100.0%) |
Housing Structure by Heating Type in Humboldt Hill
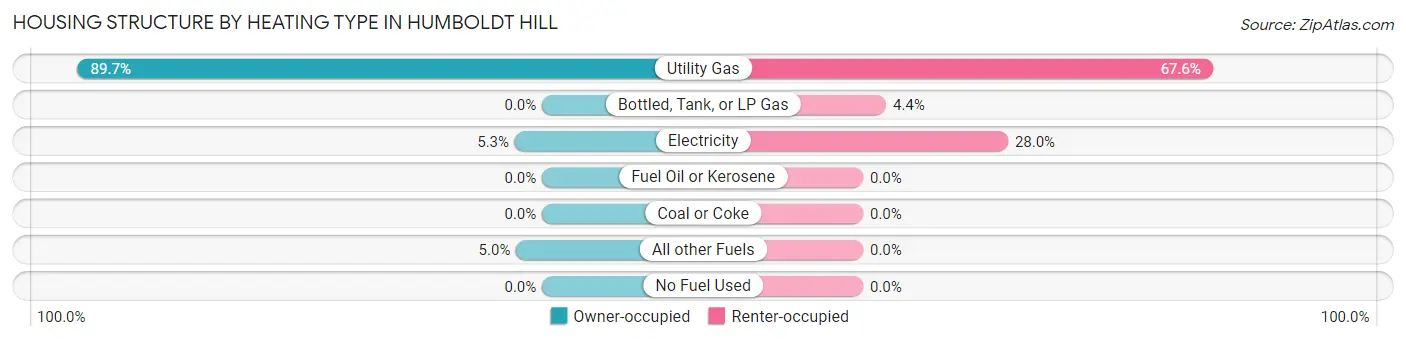
| Heating Type | Owner-occupied | Renter-occupied |
| Utility Gas | 682 (89.7%) | 304 (67.6%) |
| Bottled, Tank, or LP Gas | 0 (0.0%) | 20 (4.4%) |
| Electricity | 40 (5.3%) | 126 (28.0%) |
| Fuel Oil or Kerosene | 0 (0.0%) | 0 (0.0%) |
| Coal or Coke | 0 (0.0%) | 0 (0.0%) |
| All other Fuels | 38 (5.0%) | 0 (0.0%) |
| No Fuel Used | 0 (0.0%) | 0 (0.0%) |
| Total | 760 (100.0%) | 450 (100.0%) |
Household Vehicle Usage in Humboldt Hill
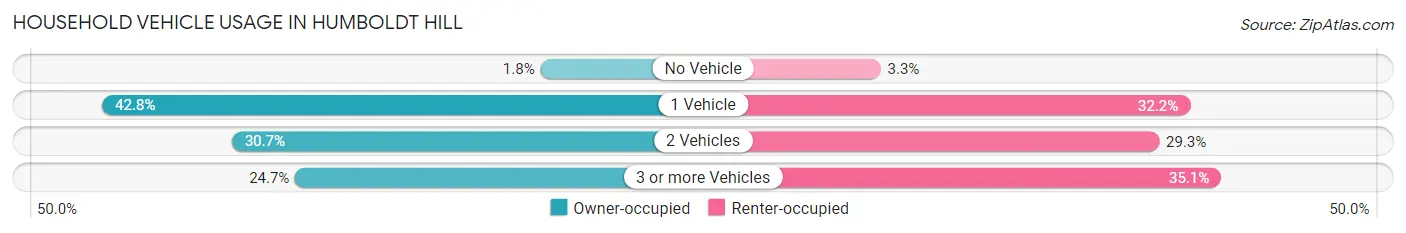
| Vehicles per Household | Owner-occupied | Renter-occupied |
| No Vehicle | 14 (1.8%) | 15 (3.3%) |
| 1 Vehicle | 325 (42.8%) | 145 (32.2%) |
| 2 Vehicles | 233 (30.7%) | 132 (29.3%) |
| 3 or more Vehicles | 188 (24.7%) | 158 (35.1%) |
| Total | 760 (100.0%) | 450 (100.0%) |
Real Estate & Mortgages in Humboldt Hill
Real Estate and Mortgage Overview in Humboldt Hill
| Characteristic | Without Mortgage | With Mortgage |
| Housing Units | 289 | 471 |
| Median Property Value | - | - |
| Median Household Income | $65,875 | $114 |
| Monthly Housing Costs | $764 | $33 |
| Real Estate Taxes | $1,333 | $27 |
Property Value by Mortgage Status in Humboldt Hill
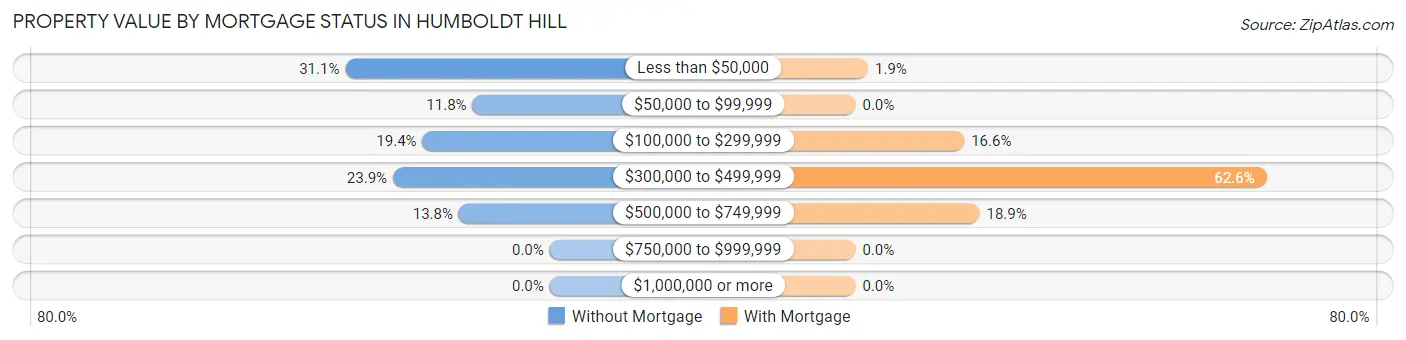
| Property Value | Without Mortgage | With Mortgage |
| Less than $50,000 | 90 (31.1%) | 9 (1.9%) |
| $50,000 to $99,999 | 34 (11.8%) | 0 (0.0%) |
| $100,000 to $299,999 | 56 (19.4%) | 78 (16.6%) |
| $300,000 to $499,999 | 69 (23.9%) | 295 (62.6%) |
| $500,000 to $749,999 | 40 (13.8%) | 89 (18.9%) |
| $750,000 to $999,999 | 0 (0.0%) | 0 (0.0%) |
| $1,000,000 or more | 0 (0.0%) | 0 (0.0%) |
| Total | 289 (100.0%) | 471 (100.0%) |
Household Income by Mortgage Status in Humboldt Hill
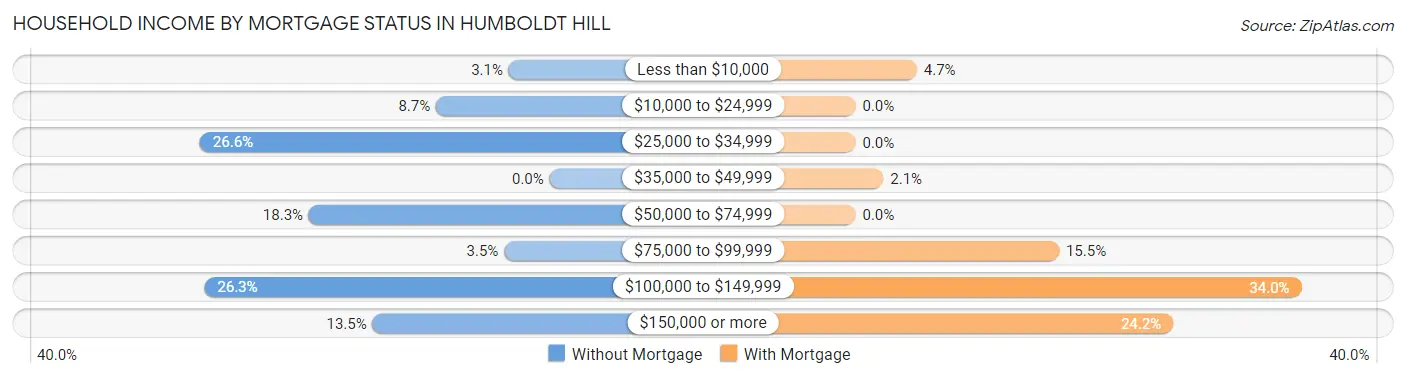
| Household Income | Without Mortgage | With Mortgage |
| Less than $10,000 | 9 (3.1%) | 22 (4.7%) |
| $10,000 to $24,999 | 25 (8.6%) | 0 (0.0%) |
| $25,000 to $34,999 | 77 (26.6%) | 0 (0.0%) |
| $35,000 to $49,999 | 0 (0.0%) | 10 (2.1%) |
| $50,000 to $74,999 | 53 (18.3%) | 0 (0.0%) |
| $75,000 to $99,999 | 10 (3.5%) | 73 (15.5%) |
| $100,000 to $149,999 | 76 (26.3%) | 160 (34.0%) |
| $150,000 or more | 39 (13.5%) | 114 (24.2%) |
| Total | 289 (100.0%) | 471 (100.0%) |
Property Value to Household Income Ratio in Humboldt Hill
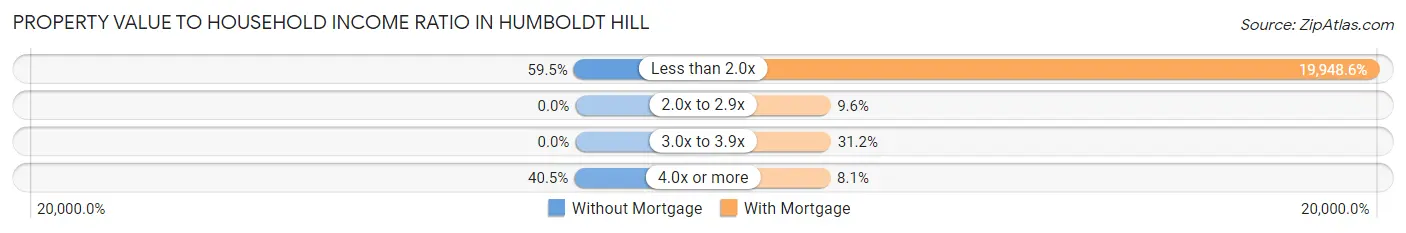
| Value-to-Income Ratio | Without Mortgage | With Mortgage |
| Less than 2.0x | 172 (59.5%) | 93,958 (19,948.6%) |
| 2.0x to 2.9x | 0 (0.0%) | 45 (9.6%) |
| 3.0x to 3.9x | 0 (0.0%) | 147 (31.2%) |
| 4.0x or more | 117 (40.5%) | 38 (8.1%) |
| Total | 289 (100.0%) | 471 (100.0%) |
Real Estate Taxes by Mortgage Status in Humboldt Hill
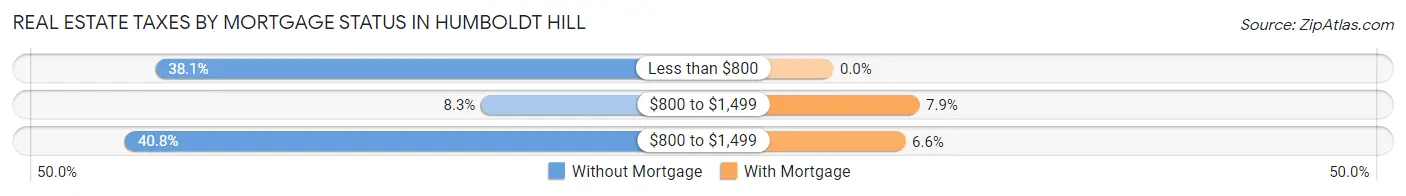
| Property Taxes | Without Mortgage | With Mortgage |
| Less than $800 | 110 (38.1%) | 0 (0.0%) |
| $800 to $1,499 | 24 (8.3%) | 37 (7.9%) |
| $800 to $1,499 | 118 (40.8%) | 31 (6.6%) |
| Total | 289 (100.0%) | 471 (100.0%) |
Health & Disability in Humboldt Hill
Health Insurance Coverage by Age in Humboldt Hill
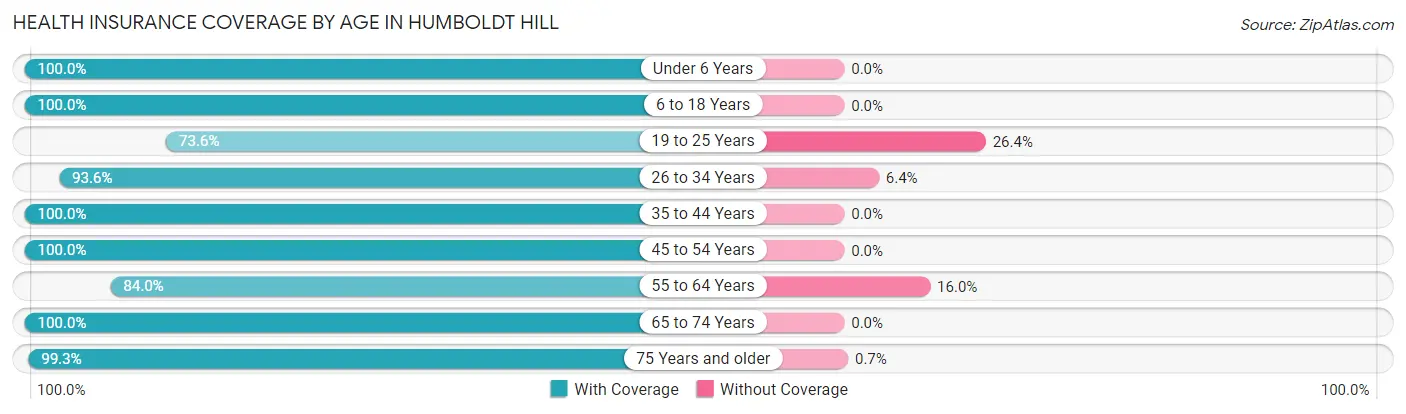
| Age Bracket | With Coverage | Without Coverage |
| Under 6 Years | 255 (100.0%) | 0 (0.0%) |
| 6 to 18 Years | 343 (100.0%) | 0 (0.0%) |
| 19 to 25 Years | 254 (73.6%) | 91 (26.4%) |
| 26 to 34 Years | 247 (93.6%) | 17 (6.4%) |
| 35 to 44 Years | 400 (100.0%) | 0 (0.0%) |
| 45 to 54 Years | 255 (100.0%) | 0 (0.0%) |
| 55 to 64 Years | 551 (84.0%) | 105 (16.0%) |
| 65 to 74 Years | 394 (100.0%) | 0 (0.0%) |
| 75 Years and older | 284 (99.3%) | 2 (0.7%) |
| Total | 2,983 (93.3%) | 215 (6.7%) |
Health Insurance Coverage by Citizenship Status in Humboldt Hill
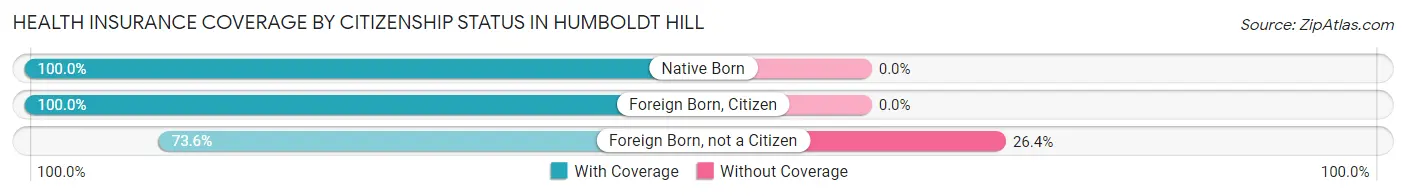
| Citizenship Status | With Coverage | Without Coverage |
| Native Born | 255 (100.0%) | 0 (0.0%) |
| Foreign Born, Citizen | 343 (100.0%) | 0 (0.0%) |
| Foreign Born, not a Citizen | 254 (73.6%) | 91 (26.4%) |
Health Insurance Coverage by Household Income in Humboldt Hill
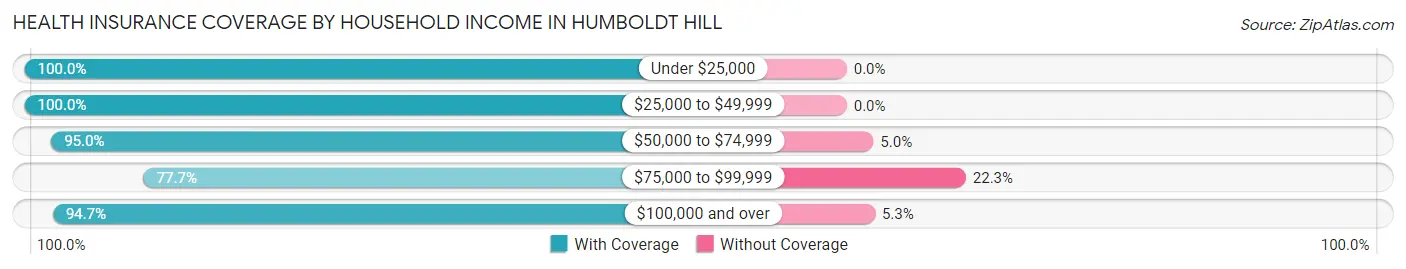
| Household Income | With Coverage | Without Coverage |
| Under $25,000 | 43 (100.0%) | 0 (0.0%) |
| $25,000 to $49,999 | 506 (100.0%) | 0 (0.0%) |
| $50,000 to $74,999 | 438 (95.0%) | 23 (5.0%) |
| $75,000 to $99,999 | 376 (77.7%) | 108 (22.3%) |
| $100,000 and over | 1,470 (94.7%) | 82 (5.3%) |
Public vs Private Health Insurance Coverage by Age in Humboldt Hill
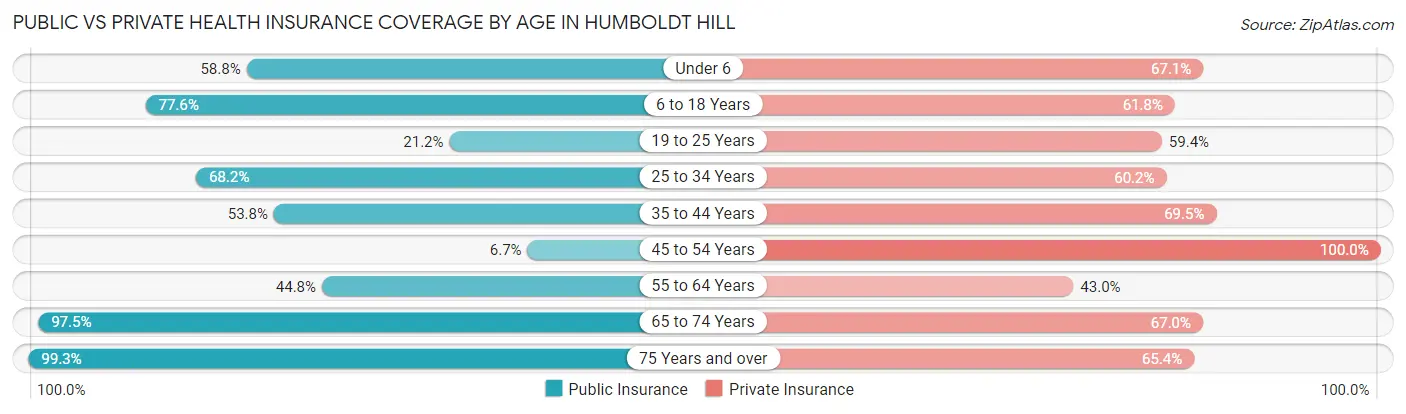
| Age Bracket | Public Insurance | Private Insurance |
| Under 6 | 150 (58.8%) | 171 (67.1%) |
| 6 to 18 Years | 266 (77.5%) | 212 (61.8%) |
| 19 to 25 Years | 73 (21.2%) | 205 (59.4%) |
| 25 to 34 Years | 180 (68.2%) | 159 (60.2%) |
| 35 to 44 Years | 215 (53.7%) | 278 (69.5%) |
| 45 to 54 Years | 17 (6.7%) | 255 (100.0%) |
| 55 to 64 Years | 294 (44.8%) | 282 (43.0%) |
| 65 to 74 Years | 384 (97.5%) | 264 (67.0%) |
| 75 Years and over | 284 (99.3%) | 187 (65.4%) |
| Total | 1,863 (58.3%) | 2,013 (62.9%) |
Disability Status by Sex by Age in Humboldt Hill
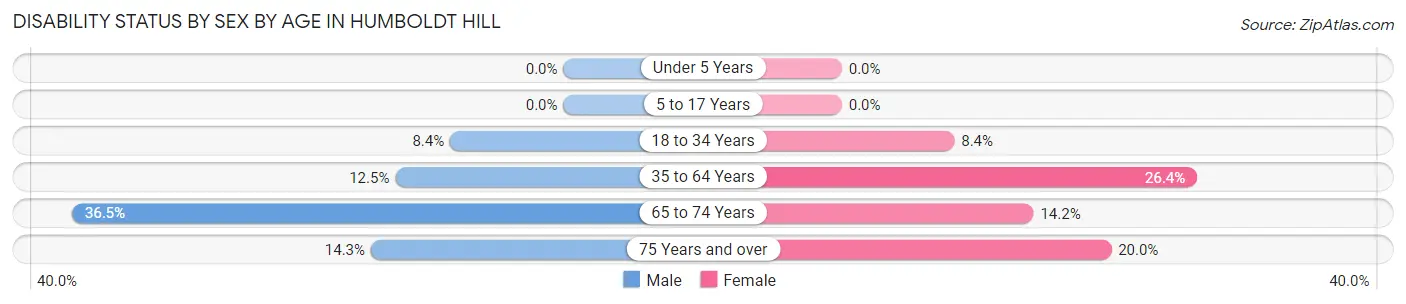
| Age Bracket | Male | Female |
| Under 5 Years | 0 (0.0%) | 0 (0.0%) |
| 5 to 17 Years | 0 (0.0%) | 0 (0.0%) |
| 18 to 34 Years | 26 (8.4%) | 34 (8.4%) |
| 35 to 64 Years | 87 (12.5%) | 162 (26.4%) |
| 65 to 74 Years | 54 (36.5%) | 35 (14.2%) |
| 75 Years and over | 13 (14.3%) | 39 (20.0%) |
Disability Class by Sex by Age in Humboldt Hill
Disability Class: Hearing Difficulty
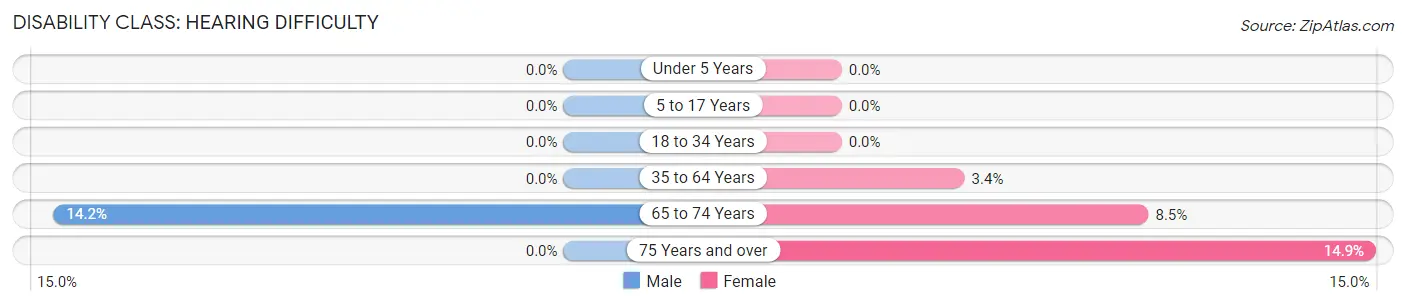
| Age Bracket | Male | Female |
| Under 5 Years | 0 (0.0%) | 0 (0.0%) |
| 5 to 17 Years | 0 (0.0%) | 0 (0.0%) |
| 18 to 34 Years | 0 (0.0%) | 0 (0.0%) |
| 35 to 64 Years | 0 (0.0%) | 21 (3.4%) |
| 65 to 74 Years | 21 (14.2%) | 21 (8.5%) |
| 75 Years and over | 0 (0.0%) | 29 (14.9%) |
Disability Class: Vision Difficulty
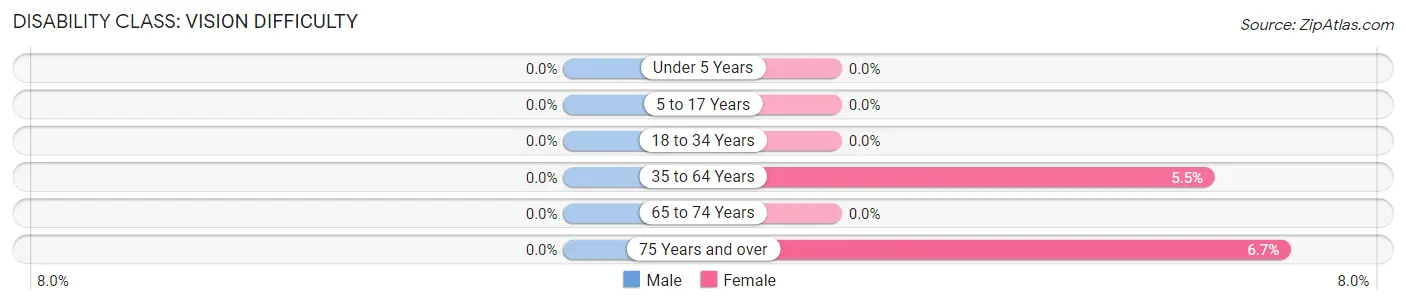
| Age Bracket | Male | Female |
| Under 5 Years | 0 (0.0%) | 0 (0.0%) |
| 5 to 17 Years | 0 (0.0%) | 0 (0.0%) |
| 18 to 34 Years | 0 (0.0%) | 0 (0.0%) |
| 35 to 64 Years | 0 (0.0%) | 34 (5.5%) |
| 65 to 74 Years | 0 (0.0%) | 0 (0.0%) |
| 75 Years and over | 0 (0.0%) | 13 (6.7%) |
Disability Class: Cognitive Difficulty
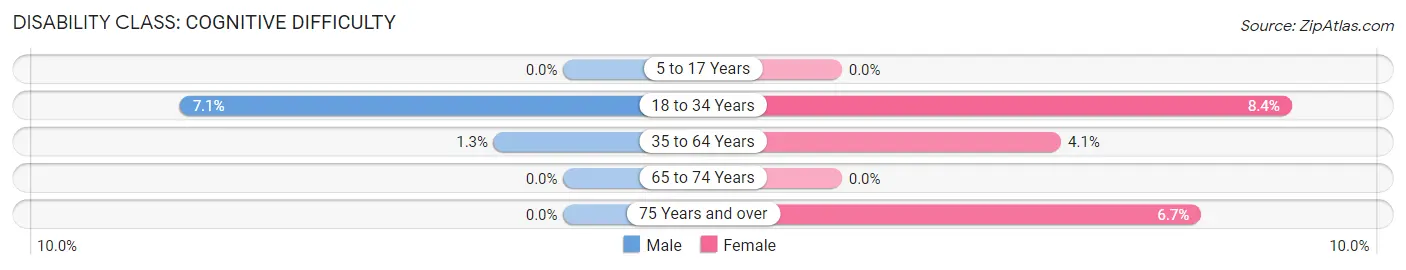
| Age Bracket | Male | Female |
| 5 to 17 Years | 0 (0.0%) | 0 (0.0%) |
| 18 to 34 Years | 22 (7.1%) | 34 (8.4%) |
| 35 to 64 Years | 9 (1.3%) | 25 (4.1%) |
| 65 to 74 Years | 0 (0.0%) | 0 (0.0%) |
| 75 Years and over | 0 (0.0%) | 13 (6.7%) |
Disability Class: Ambulatory Difficulty
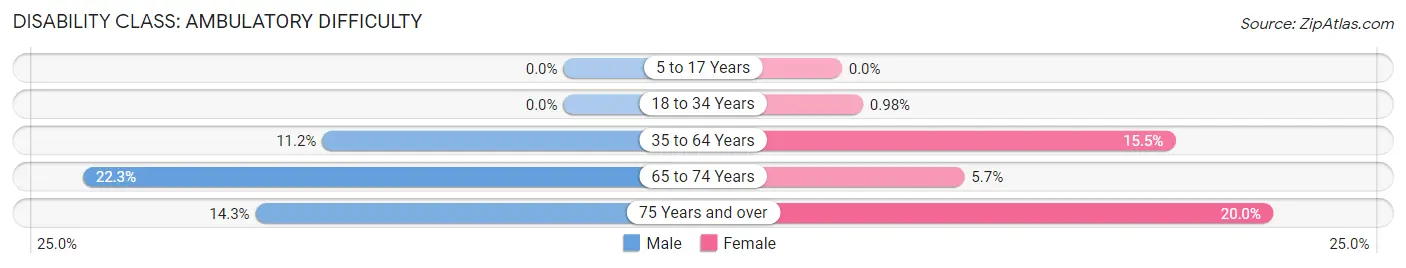
| Age Bracket | Male | Female |
| 5 to 17 Years | 0 (0.0%) | 0 (0.0%) |
| 18 to 34 Years | 0 (0.0%) | 4 (1.0%) |
| 35 to 64 Years | 78 (11.2%) | 95 (15.5%) |
| 65 to 74 Years | 33 (22.3%) | 14 (5.7%) |
| 75 Years and over | 13 (14.3%) | 39 (20.0%) |
Disability Class: Self-Care Difficulty
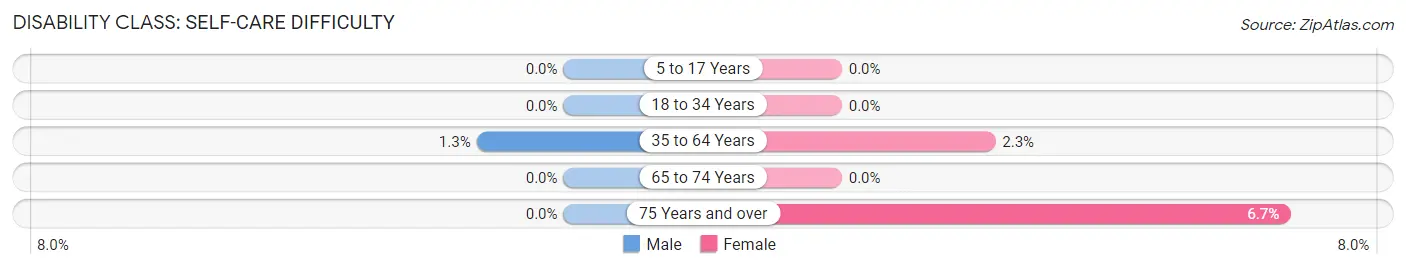
| Age Bracket | Male | Female |
| 5 to 17 Years | 0 (0.0%) | 0 (0.0%) |
| 18 to 34 Years | 0 (0.0%) | 0 (0.0%) |
| 35 to 64 Years | 9 (1.3%) | 14 (2.3%) |
| 65 to 74 Years | 0 (0.0%) | 0 (0.0%) |
| 75 Years and over | 0 (0.0%) | 13 (6.7%) |
Technology Access in Humboldt Hill
Computing Device Access in Humboldt Hill
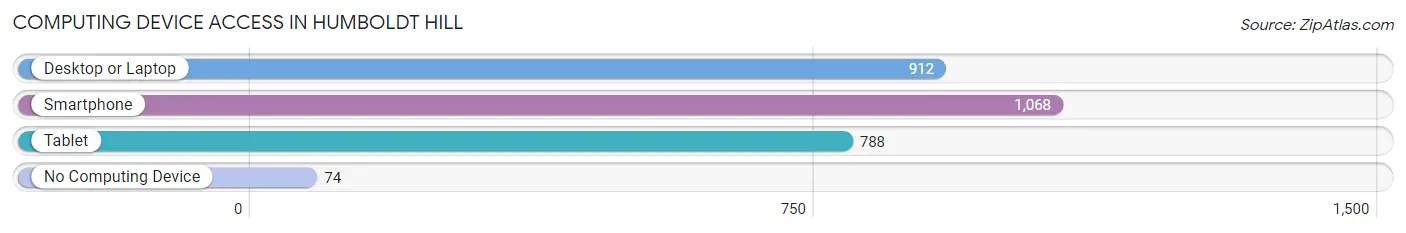
| Device Type | # Households | % Households |
| Desktop or Laptop | 912 | 75.4% |
| Smartphone | 1,068 | 88.3% |
| Tablet | 788 | 65.1% |
| No Computing Device | 74 | 6.1% |
| Total | 1,210 | 100.0% |
Internet Access in Humboldt Hill
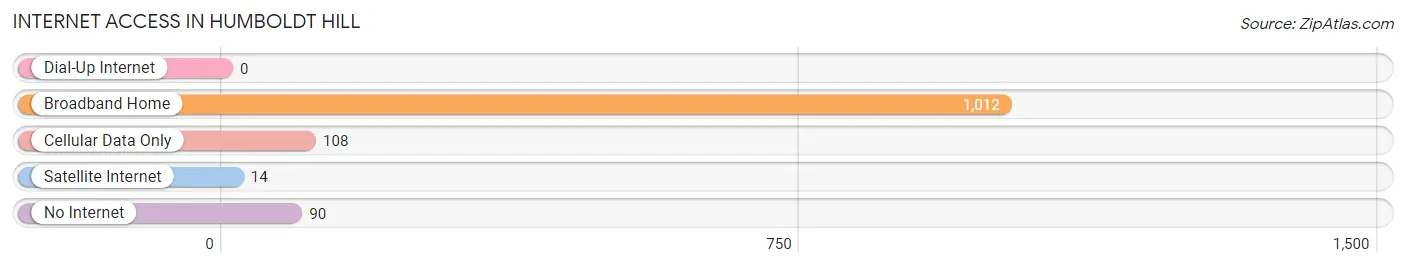
| Internet Type | # Households | % Households |
| Dial-Up Internet | 0 | 0.0% |
| Broadband Home | 1,012 | 83.6% |
| Cellular Data Only | 108 | 8.9% |
| Satellite Internet | 14 | 1.2% |
| No Internet | 90 | 7.4% |
| Total | 1,210 | 100.0% |
Humboldt Hill Summary
Humboldt Hill is a small unincorporated community located in Humboldt County, California. It is situated on the eastern side of the Eel River, approximately 8 miles south of Eureka. The community is home to a population of approximately 1,000 people, and is known for its rural atmosphere and close-knit community.
Geography
Humboldt Hill is located in the northern part of Humboldt County, California. It is situated on the eastern side of the Eel River, approximately 8 miles south of Eureka. The community is surrounded by rolling hills and is located in a temperate climate zone. The average annual temperature is around 55 degrees Fahrenheit, and the average annual precipitation is around 40 inches.
The area is home to a variety of wildlife, including deer, elk, bear, and mountain lions. The nearby Eel River is home to a variety of fish, including salmon, steelhead, and trout.
History
Humboldt Hill was first settled in the late 1800s by a group of settlers from the Midwest. The settlers were attracted to the area due to its abundance of natural resources, including timber and fish. The settlers established a small logging community, and the area quickly grew in population.
In the early 1900s, the area was home to a number of small farms and ranches. The area was also home to a number of small businesses, including a general store, a blacksmith, and a post office.
In the 1950s, the area began to experience a population decline as many of the residents moved away in search of better economic opportunities. The area has since experienced a resurgence in population, and is now home to a diverse population of approximately 1,000 people.
Economy
Humboldt Hill is home to a variety of small businesses, including a general store, a gas station, and a post office. The area is also home to a number of small farms and ranches, and is known for its production of timber and fish.
The area is also home to a number of tourist attractions, including the Humboldt Hill Wildlife Refuge and the Humboldt Hill State Park. The area is also home to a number of wineries, and is known for its production of high-quality wines.
Demographics
As of the 2010 census, the population of Humboldt Hill was 1,000 people. The racial makeup of the area was 94.2% White, 0.7% African American, 0.7% Native American, 0.7% Asian, 0.3% Pacific Islander, and 3.1% from other races. The median household income was $41,250, and the median family income was $50,000.
The area is home to a diverse population, and is known for its close-knit community. The area is also home to a number of churches, and is known for its strong religious values.
Common Questions
What is Per Capita Income in Humboldt Hill?
Per Capita income in Humboldt Hill is $36,901.
What is the Median Family Income in Humboldt Hill?
Median Family Income in Humboldt Hill is $108,400.
What is the Median Household income in Humboldt Hill?
Median Household Income in Humboldt Hill is $80,938.
What is Income or Wage Gap in Humboldt Hill?
Income or Wage Gap in Humboldt Hill is 27.7%.
Women in Humboldt Hill earn 72.3 cents for every dollar earned by a man.
What is Inequality or Gini Index in Humboldt Hill?
Inequality or Gini Index in Humboldt Hill is 0.37.
What is the Total Population of Humboldt Hill?
Total Population of Humboldt Hill is 3,273.
What is the Total Male Population of Humboldt Hill?
Total Male Population of Humboldt Hill is 1,576.
What is the Total Female Population of Humboldt Hill?
Total Female Population of Humboldt Hill is 1,697.
What is the Ratio of Males per 100 Females in Humboldt Hill?
There are 92.87 Males per 100 Females in Humboldt Hill.
What is the Ratio of Females per 100 Males in Humboldt Hill?
There are 107.68 Females per 100 Males in Humboldt Hill.
What is the Median Population Age in Humboldt Hill?
Median Population Age in Humboldt Hill is 46.0 Years.
What is the Average Family Size in Humboldt Hill
Average Family Size in Humboldt Hill is 3.2 People.
What is the Average Household Size in Humboldt Hill
Average Household Size in Humboldt Hill is 2.5 People.
How Large is the Labor Force in Humboldt Hill?
There are 1,572 People in the Labor Forcein in Humboldt Hill.
What is the Percentage of People in the Labor Force in Humboldt Hill?
56.5% of People are in the Labor Force in Humboldt Hill.
What is the Unemployment Rate in Humboldt Hill?
Unemployment Rate in Humboldt Hill is 5.3%.