Cities with the Lowest Poverty Level Among Seniors Over the Age of 75 in Iowa
RELATED REPORTS & OPTIONS
Lowest Poverty | Seniors 75+
Iowa
Compare Cities
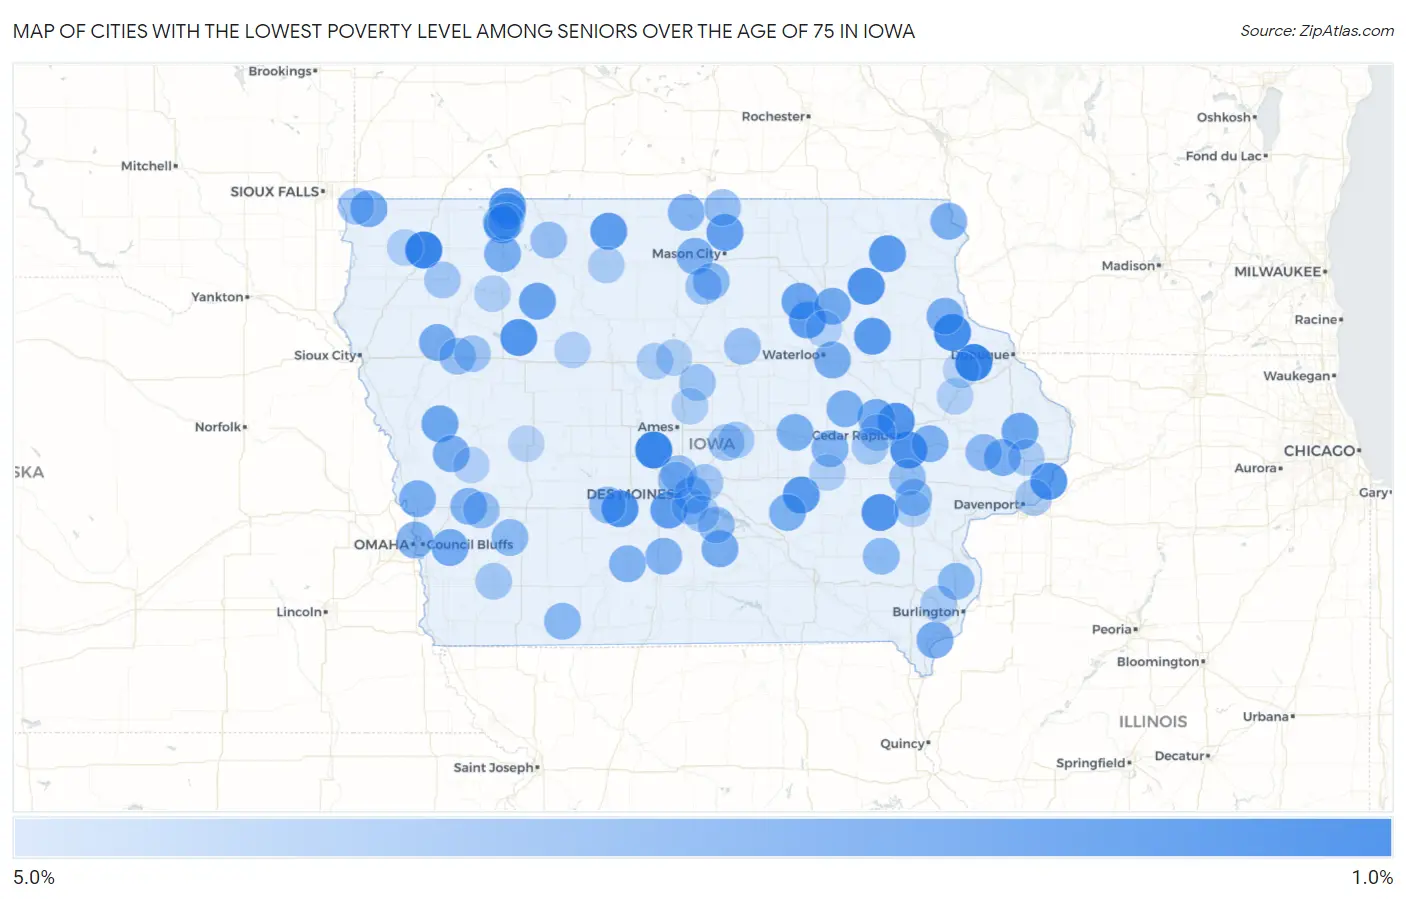
Map of Cities with the Lowest Poverty Level Among Seniors Over the Age of 75 in Iowa
5.0%
0.0%
Cities with the Lowest Poverty Level Among Seniors Over the Age of 75 in Iowa
| City | Senior Poverty | vs State | vs National | |
| 1. | Sheldon | 1.3% | 9.3%(-8.06)#1 | 11.1%(-9.78)#212 |
| 2. | Farley | 1.3% | 9.3%(-8.04)#2 | 11.1%(-9.77)#218 |
| 3. | Madrid | 1.4% | 9.3%(-7.98)#3 | 11.1%(-9.71)#239 |
| 4. | Colesburg | 1.6% | 9.3%(-7.70)#4 | 11.1%(-9.43)#356 |
| 5. | Ely | 1.9% | 9.3%(-7.45)#5 | 11.1%(-9.18)#466 |
| 6. | Earlham | 2.0% | 9.3%(-7.38)#6 | 11.1%(-9.11)#496 |
| 7. | Hawkeye | 2.0% | 9.3%(-7.34)#7 | 11.1%(-9.07)#522 |
| 8. | Wellman | 2.0% | 9.3%(-7.30)#8 | 11.1%(-9.03)#543 |
| 9. | Newell | 2.1% | 9.3%(-7.26)#9 | 11.1%(-8.98)#576 |
| 10. | Princeton | 2.1% | 9.3%(-7.23)#10 | 11.1%(-8.96)#595 |
| 11. | Hiawatha | 2.1% | 9.3%(-7.23)#11 | 11.1%(-8.96)#598 |
| 12. | Montezuma | 2.2% | 9.3%(-7.09)#12 | 11.1%(-8.82)#686 |
| 13. | Hazleton | 2.3% | 9.3%(-7.07)#13 | 11.1%(-8.79)#705 |
| 14. | Waverly | 2.3% | 9.3%(-7.03)#14 | 11.1%(-8.76)#726 |
| 15. | Ossian | 2.4% | 9.3%(-6.99)#15 | 11.1%(-8.71)#747 |
| 16. | Bancroft | 2.4% | 9.3%(-6.96)#16 | 11.1%(-8.69)#765 |
| 17. | Orleans | 2.5% | 9.3%(-6.87)#17 | 11.1%(-8.60)#833 |
| 18. | Norwalk | 2.5% | 9.3%(-6.85)#18 | 11.1%(-8.58)#844 |
| 19. | Manly | 2.6% | 9.3%(-6.78)#19 | 11.1%(-8.50)#897 |
| 20. | Laurens | 2.7% | 9.3%(-6.62)#20 | 11.1%(-8.35)#1,023 |
| 21. | Milford | 2.7% | 9.3%(-6.62)#21 | 11.1%(-8.34)#1,027 |
| 22. | Plainfield | 2.8% | 9.3%(-6.56)#22 | 11.1%(-8.29)#1,067 |
| 23. | Delmar | 2.9% | 9.3%(-6.48)#23 | 11.1%(-8.21)#1,138 |
| 24. | Ute | 2.9% | 9.3%(-6.48)#24 | 11.1%(-8.21)#1,140 |
| 25. | Tripoli | 3.0% | 9.3%(-6.31)#25 | 11.1%(-8.04)#1,262 |
| 26. | Shellsburg | 3.1% | 9.3%(-6.28)#26 | 11.1%(-8.01)#1,295 |
| 27. | Treynor | 3.1% | 9.3%(-6.26)#27 | 11.1%(-7.99)#1,302 |
| 28. | Melcher Dallas | 3.1% | 9.3%(-6.21)#28 | 11.1%(-7.94)#1,341 |
| 29. | Lester | 3.1% | 9.3%(-6.21)#29 | 11.1%(-7.94)#1,352 |
| 30. | Washta | 3.1% | 9.3%(-6.21)#30 | 11.1%(-7.94)#1,355 |
| 31. | Fort Madison | 3.2% | 9.3%(-6.17)#31 | 11.1%(-7.90)#1,378 |
| 32. | Elk Run Heights | 3.2% | 9.3%(-6.15)#32 | 11.1%(-7.88)#1,397 |
| 33. | Dunlap | 3.2% | 9.3%(-6.14)#33 | 11.1%(-7.87)#1,401 |
| 34. | Calamus | 3.2% | 9.3%(-6.11)#34 | 11.1%(-7.84)#1,439 |
| 35. | Garber | 3.2% | 9.3%(-6.11)#35 | 11.1%(-7.84)#1,445 |
| 36. | Spencer | 3.2% | 9.3%(-6.10)#36 | 11.1%(-7.83)#1,451 |
| 37. | Missouri Valley | 3.2% | 9.3%(-6.10)#37 | 11.1%(-7.83)#1,452 |
| 38. | Lansing | 3.3% | 9.3%(-6.04)#38 | 11.1%(-7.77)#1,495 |
| 39. | Pleasant Hill | 3.3% | 9.3%(-6.03)#39 | 11.1%(-7.76)#1,502 |
| 40. | Toledo | 3.3% | 9.3%(-6.03)#40 | 11.1%(-7.76)#1,507 |
| 41. | New Sharon | 3.3% | 9.3%(-6.01)#41 | 11.1%(-7.73)#1,520 |
| 42. | Garrison | 3.3% | 9.3%(-6.01)#42 | 11.1%(-7.73)#1,532 |
| 43. | Lisbon | 3.4% | 9.3%(-5.96)#43 | 11.1%(-7.69)#1,576 |
| 44. | Carter Lake | 3.4% | 9.3%(-5.95)#44 | 11.1%(-7.68)#1,584 |
| 45. | Ventura | 3.4% | 9.3%(-5.95)#45 | 11.1%(-7.68)#1,592 |
| 46. | Shelby | 3.4% | 9.3%(-5.89)#46 | 11.1%(-7.62)#1,637 |
| 47. | New Virginia | 3.4% | 9.3%(-5.89)#47 | 11.1%(-7.62)#1,640 |
| 48. | Lorimor | 3.4% | 9.3%(-5.89)#48 | 11.1%(-7.62)#1,645 |
| 49. | Lake Mills | 3.5% | 9.3%(-5.85)#49 | 11.1%(-7.57)#1,675 |
| 50. | Belle Plaine | 3.5% | 9.3%(-5.81)#50 | 11.1%(-7.54)#1,699 |
| 51. | Hills | 3.7% | 9.3%(-5.64)#51 | 11.1%(-7.36)#1,870 |
| 52. | Swaledale | 3.7% | 9.3%(-5.64)#52 | 11.1%(-7.36)#1,882 |
| 53. | Conway | 3.7% | 9.3%(-5.64)#53 | 11.1%(-7.36)#1,883 |
| 54. | Mediapolis | 3.7% | 9.3%(-5.60)#54 | 11.1%(-7.33)#1,904 |
| 55. | Spirit Lake | 3.8% | 9.3%(-5.59)#55 | 11.1%(-7.31)#1,916 |
| 56. | Brighton | 3.8% | 9.3%(-5.57)#56 | 11.1%(-7.29)#1,948 |
| 57. | Lewis | 3.8% | 9.3%(-5.57)#57 | 11.1%(-7.29)#1,953 |
| 58. | Lowden | 3.8% | 9.3%(-5.49)#58 | 11.1%(-7.22)#2,010 |
| 59. | Dexter | 3.9% | 9.3%(-5.42)#59 | 11.1%(-7.15)#2,100 |
| 60. | West Okoboji | 3.9% | 9.3%(-5.39)#60 | 11.1%(-7.12)#2,125 |
| 61. | Pleasantville | 4.0% | 9.3%(-5.38)#61 | 11.1%(-7.11)#2,138 |
| 62. | Avoca | 4.1% | 9.3%(-5.29)#62 | 11.1%(-7.01)#2,229 |
| 63. | Ankeny | 4.1% | 9.3%(-5.28)#63 | 11.1%(-7.01)#2,237 |
| 64. | Holstein | 4.1% | 9.3%(-5.27)#64 | 11.1%(-7.00)#2,242 |
| 65. | Coralville | 4.1% | 9.3%(-5.26)#65 | 11.1%(-6.99)#2,251 |
| 66. | Graettinger | 4.1% | 9.3%(-5.26)#66 | 11.1%(-6.99)#2,260 |
| 67. | Northwood | 4.1% | 9.3%(-5.25)#67 | 11.1%(-6.97)#2,278 |
| 68. | Ackley | 4.1% | 9.3%(-5.19)#68 | 11.1%(-6.92)#2,313 |
| 69. | Carlisle | 4.3% | 9.3%(-5.08)#69 | 11.1%(-6.81)#2,433 |
| 70. | Radcliffe | 4.3% | 9.3%(-5.08)#70 | 11.1%(-6.81)#2,442 |
| 71. | Saylorville | 4.3% | 9.3%(-5.08)#71 | 11.1%(-6.80)#2,448 |
| 72. | Thornton | 4.3% | 9.3%(-5.05)#72 | 11.1%(-6.78)#2,465 |
| 73. | Atkins | 4.3% | 9.3%(-4.99)#73 | 11.1%(-6.72)#2,514 |
| 74. | Galva | 4.3% | 9.3%(-4.99)#74 | 11.1%(-6.72)#2,534 |
| 75. | Rhodes | 4.3% | 9.3%(-4.99)#75 | 11.1%(-6.72)#2,542 |
| 76. | Bettendorf | 4.4% | 9.3%(-4.98)#76 | 11.1%(-6.71)#2,553 |
| 77. | Paullina | 4.4% | 9.3%(-4.95)#77 | 11.1%(-6.68)#2,573 |
| 78. | Mitchellville | 4.4% | 9.3%(-4.94)#78 | 11.1%(-6.67)#2,579 |
| 79. | Larchwood | 4.4% | 9.3%(-4.94)#79 | 11.1%(-6.67)#2,583 |
| 80. | Norway | 4.4% | 9.3%(-4.89)#80 | 11.1%(-6.62)#2,635 |
| 81. | Red Oak | 4.5% | 9.3%(-4.89)#81 | 11.1%(-6.61)#2,639 |
| 82. | Danville | 4.5% | 9.3%(-4.79)#82 | 11.1%(-6.52)#2,731 |
| 83. | Melbourne | 4.5% | 9.3%(-4.79)#83 | 11.1%(-6.52)#2,734 |
| 84. | Hartford | 4.5% | 9.3%(-4.79)#84 | 11.1%(-6.52)#2,738 |
| 85. | Dewitt | 4.6% | 9.3%(-4.70)#85 | 11.1%(-6.43)#2,841 |
| 86. | Webster City | 4.7% | 9.3%(-4.68)#86 | 11.1%(-6.40)#2,869 |
| 87. | Algona | 4.7% | 9.3%(-4.68)#87 | 11.1%(-6.40)#2,874 |
| 88. | Arnolds Park | 4.7% | 9.3%(-4.61)#88 | 11.1%(-6.34)#2,911 |
| 89. | Monticello | 4.7% | 9.3%(-4.59)#89 | 11.1%(-6.32)#2,923 |
| 90. | Roland | 4.8% | 9.3%(-4.58)#90 | 11.1%(-6.31)#2,934 |
| 91. | Boyden | 4.8% | 9.3%(-4.58)#91 | 11.1%(-6.31)#2,943 |
| 92. | Blairsburg | 4.8% | 9.3%(-4.58)#92 | 11.1%(-6.31)#2,971 |
| 93. | Linn Grove | 4.8% | 9.3%(-4.58)#93 | 11.1%(-6.31)#2,973 |
| 94. | Riverside | 4.8% | 9.3%(-4.52)#94 | 11.1%(-6.25)#3,014 |
| 95. | Denver | 4.8% | 9.3%(-4.51)#95 | 11.1%(-6.24)#3,025 |
| 96. | Victor | 4.8% | 9.3%(-4.50)#96 | 11.1%(-6.23)#3,037 |
| 97. | Earling | 4.9% | 9.3%(-4.46)#97 | 11.1%(-6.19)#3,073 |
| 98. | Manson | 4.9% | 9.3%(-4.45)#98 | 11.1%(-6.18)#3,085 |
| 99. | Worthington | 5.0% | 9.3%(-4.34)#99 | 11.1%(-6.07)#3,210 |
| 100. | Templeton | 5.0% | 9.3%(-4.34)#100 | 11.1%(-6.07)#3,213 |
Common Questions
What are the Top 10 Cities with the Lowest Poverty Level Among Seniors Over the Age of 75 in Iowa?
Top 10 Cities with the Lowest Poverty Level Among Seniors Over the Age of 75 in Iowa are:
What city has the Lowest Poverty Level Among Seniors Over the Age of 75 in Iowa?
Sheldon has the Lowest Poverty Level Among Seniors Over the Age of 75 in Iowa with 1.3%.
What is the Poverty Level Among Seniors Over the Age of 75 in the State of Iowa?
Poverty Level Among Seniors Over the Age of 75 in Iowa is 9.3%.
What is the Poverty Level Among Seniors Over the Age of 75 in the United States?
Poverty Level Among Seniors Over the Age of 75 in the United States is 11.1%.