Cities with the Lowest Poverty Level Among Seniors Over the Age of 75 in Nebraska
RELATED REPORTS & OPTIONS
Lowest Poverty | Seniors 75+
Nebraska
Compare Cities
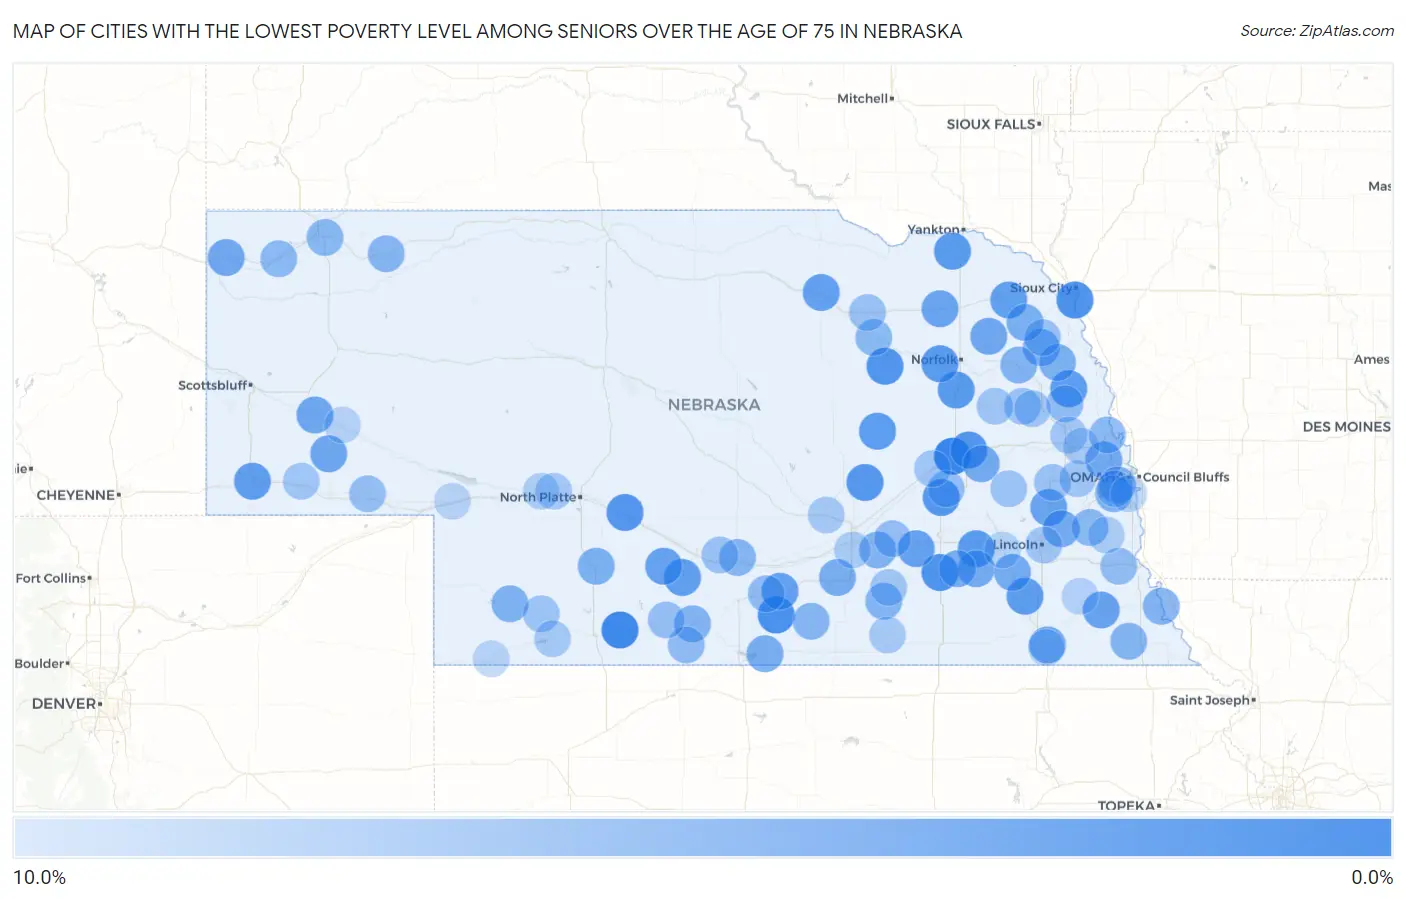
Map of Cities with the Lowest Poverty Level Among Seniors Over the Age of 75 in Nebraska
10.0%
0.0%
Cities with the Lowest Poverty Level Among Seniors Over the Age of 75 in Nebraska
| City | Senior Poverty | vs State | vs National | |
| 1. | Duncan | 0.88% | 10.3%(-9.42)#1 | 11.1%(-10.2)#121 |
| 2. | Indianola | 1.3% | 10.3%(-9.02)#2 | 11.1%(-9.78)#214 |
| 3. | Hildreth | 1.9% | 10.3%(-8.45)#3 | 11.1%(-9.22)#452 |
| 4. | Dakota City | 2.1% | 10.3%(-8.22)#4 | 11.1%(-8.98)#573 |
| 5. | Fairmont | 2.2% | 10.3%(-8.15)#5 | 11.1%(-8.92)#618 |
| 6. | Elgin | 2.4% | 10.3%(-7.90)#6 | 11.1%(-8.67)#778 |
| 7. | Palmer | 2.6% | 10.3%(-7.74)#7 | 11.1%(-8.50)#904 |
| 8. | Brady | 2.6% | 10.3%(-7.67)#8 | 11.1%(-8.44)#956 |
| 9. | Columbus | 2.7% | 10.3%(-7.63)#9 | 11.1%(-8.39)#976 |
| 10. | Stromsburg | 2.7% | 10.3%(-7.62)#10 | 11.1%(-8.38)#986 |
| 11. | Crofton | 2.8% | 10.3%(-7.49)#11 | 11.1%(-8.25)#1,101 |
| 12. | Madison | 2.9% | 10.3%(-7.45)#12 | 11.1%(-8.21)#1,124 |
| 13. | Battle Creek | 2.9% | 10.3%(-7.45)#13 | 11.1%(-8.21)#1,127 |
| 14. | Beaver Crossing | 2.9% | 10.3%(-7.45)#14 | 11.1%(-8.21)#1,139 |
| 15. | Oakland | 3.0% | 10.3%(-7.35)#15 | 11.1%(-8.11)#1,209 |
| 16. | Cedar Rapids | 3.0% | 10.3%(-7.27)#16 | 11.1%(-8.04)#1,268 |
| 17. | Clatonia | 3.1% | 10.3%(-7.18)#17 | 11.1%(-7.94)#1,351 |
| 18. | Kimball | 3.3% | 10.3%(-7.02)#18 | 11.1%(-7.78)#1,487 |
| 19. | Dixon | 3.3% | 10.3%(-6.97)#19 | 11.1%(-7.73)#1,536 |
| 20. | Elwood | 3.4% | 10.3%(-6.91)#20 | 11.1%(-7.68)#1,594 |
| 21. | Minden | 3.5% | 10.3%(-6.85)#21 | 11.1%(-7.61)#1,650 |
| 22. | O Neill | 3.5% | 10.3%(-6.83)#22 | 11.1%(-7.59)#1,660 |
| 23. | Eustis | 3.5% | 10.3%(-6.80)#23 | 11.1%(-7.56)#1,684 |
| 24. | Henderson | 3.6% | 10.3%(-6.73)#24 | 11.1%(-7.50)#1,743 |
| 25. | Tecumseh | 3.7% | 10.3%(-6.58)#25 | 11.1%(-7.34)#1,893 |
| 26. | Ceresco | 3.8% | 10.3%(-6.53)#26 | 11.1%(-7.29)#1,938 |
| 27. | Osmond | 3.8% | 10.3%(-6.46)#27 | 11.1%(-7.22)#2,012 |
| 28. | Bridgeport | 4.1% | 10.3%(-6.22)#28 | 11.1%(-6.99)#2,259 |
| 29. | Winside | 4.2% | 10.3%(-6.14)#29 | 11.1%(-6.90)#2,344 |
| 30. | Dalton | 4.2% | 10.3%(-6.14)#30 | 11.1%(-6.90)#2,352 |
| 31. | Blue Springs | 4.2% | 10.3%(-6.14)#31 | 11.1%(-6.90)#2,361 |
| 32. | Harrison | 4.3% | 10.3%(-6.05)#32 | 11.1%(-6.81)#2,444 |
| 33. | Bennington | 4.3% | 10.3%(-6.04)#33 | 11.1%(-6.80)#2,449 |
| 34. | Friend | 4.3% | 10.3%(-5.96)#34 | 11.1%(-6.72)#2,523 |
| 35. | Bellwood | 4.4% | 10.3%(-5.89)#35 | 11.1%(-6.66)#2,600 |
| 36. | Crete | 4.5% | 10.3%(-5.84)#36 | 11.1%(-6.60)#2,647 |
| 37. | Waverly | 4.5% | 10.3%(-5.76)#37 | 11.1%(-6.52)#2,721 |
| 38. | Pender | 4.8% | 10.3%(-5.54)#38 | 11.1%(-6.31)#2,936 |
| 39. | Juniata | 4.8% | 10.3%(-5.54)#39 | 11.1%(-6.31)#2,944 |
| 40. | Exeter | 4.8% | 10.3%(-5.54)#40 | 11.1%(-6.31)#2,949 |
| 41. | Naponee | 4.8% | 10.3%(-5.54)#41 | 11.1%(-6.31)#2,974 |
| 42. | Wakefield | 4.9% | 10.3%(-5.40)#42 | 11.1%(-6.16)#3,093 |
| 43. | Bancroft | 5.0% | 10.3%(-5.35)#43 | 11.1%(-6.12)#3,152 |
| 44. | Maywood | 5.0% | 10.3%(-5.30)#44 | 11.1%(-6.07)#3,221 |
| 45. | Wauneta | 5.1% | 10.3%(-5.24)#45 | 11.1%(-6.00)#3,279 |
| 46. | Ralston | 5.2% | 10.3%(-5.09)#46 | 11.1%(-5.85)#3,417 |
| 47. | Papillion | 5.2% | 10.3%(-5.08)#47 | 11.1%(-5.84)#3,422 |
| 48. | Giltner | 5.3% | 10.3%(-5.04)#48 | 11.1%(-5.80)#3,482 |
| 49. | Edison | 5.3% | 10.3%(-5.04)#49 | 11.1%(-5.80)#3,499 |
| 50. | Brownville | 5.3% | 10.3%(-5.04)#50 | 11.1%(-5.80)#3,500 |
| 51. | Wisner | 5.3% | 10.3%(-4.97)#51 | 11.1%(-5.73)#3,552 |
| 52. | Fairfield | 5.4% | 10.3%(-4.90)#52 | 11.1%(-5.66)#3,612 |
| 53. | Humboldt | 5.5% | 10.3%(-4.81)#53 | 11.1%(-5.57)#3,694 |
| 54. | Elm Creek | 5.6% | 10.3%(-4.75)#54 | 11.1%(-5.51)#3,752 |
| 55. | Rushville | 5.6% | 10.3%(-4.75)#55 | 11.1%(-5.51)#3,757 |
| 56. | Campbell | 5.6% | 10.3%(-4.75)#56 | 11.1%(-5.51)#3,788 |
| 57. | Chadron | 5.7% | 10.3%(-4.63)#57 | 11.1%(-5.40)#3,901 |
| 58. | Murdock | 5.8% | 10.3%(-4.53)#58 | 11.1%(-5.30)#4,004 |
| 59. | Blair | 5.9% | 10.3%(-4.45)#59 | 11.1%(-5.21)#4,083 |
| 60. | Crawford | 5.9% | 10.3%(-4.42)#60 | 11.1%(-5.18)#4,111 |
| 61. | Clearwater | 5.9% | 10.3%(-4.42)#61 | 11.1%(-5.18)#4,142 |
| 62. | Axtell | 6.1% | 10.3%(-4.24)#62 | 11.1%(-5.01)#4,318 |
| 63. | Uehling | 6.1% | 10.3%(-4.24)#63 | 11.1%(-5.01)#4,334 |
| 64. | Beaver City | 6.1% | 10.3%(-4.18)#64 | 11.1%(-4.94)#4,397 |
| 65. | Dunbar | 6.2% | 10.3%(-4.05)#65 | 11.1%(-4.82)#4,569 |
| 66. | Aurora | 6.3% | 10.3%(-3.98)#66 | 11.1%(-4.75)#4,618 |
| 67. | Osceola | 6.4% | 10.3%(-3.92)#67 | 11.1%(-4.68)#4,687 |
| 68. | Holbrook | 6.5% | 10.3%(-3.85)#68 | 11.1%(-4.62)#4,771 |
| 69. | Lodgepole | 6.5% | 10.3%(-3.78)#69 | 11.1%(-4.55)#4,846 |
| 70. | Overton | 6.7% | 10.3%(-3.64)#70 | 11.1%(-4.40)#4,972 |
| 71. | Orchard | 6.7% | 10.3%(-3.64)#71 | 11.1%(-4.40)#4,994 |
| 72. | Thurston | 6.7% | 10.3%(-3.64)#72 | 11.1%(-4.40)#5,017 |
| 73. | Wahoo | 6.7% | 10.3%(-3.62)#73 | 11.1%(-4.38)#5,030 |
| 74. | Dodge | 6.8% | 10.3%(-3.55)#74 | 11.1%(-4.31)#5,083 |
| 75. | Brainard | 6.8% | 10.3%(-3.49)#75 | 11.1%(-4.25)#5,139 |
| 76. | Palisade | 6.9% | 10.3%(-3.41)#76 | 11.1%(-4.17)#5,239 |
| 77. | Clarkson | 7.0% | 10.3%(-3.33)#77 | 11.1%(-4.09)#5,313 |
| 78. | Lincoln | 7.1% | 10.3%(-3.24)#78 | 11.1%(-4.00)#5,385 |
| 79. | La Vista | 7.1% | 10.3%(-3.22)#79 | 11.1%(-3.99)#5,400 |
| 80. | Yutan | 7.1% | 10.3%(-3.16)#80 | 11.1%(-3.92)#5,449 |
| 81. | Nickerson | 7.1% | 10.3%(-3.16)#81 | 11.1%(-3.92)#5,460 |
| 82. | Silver Creek | 7.1% | 10.3%(-3.16)#82 | 11.1%(-3.92)#5,468 |
| 83. | Snyder | 7.1% | 10.3%(-3.16)#83 | 11.1%(-3.92)#5,473 |
| 84. | Potter | 7.1% | 10.3%(-3.16)#84 | 11.1%(-3.92)#5,475 |
| 85. | Clay Center | 7.2% | 10.3%(-3.06)#85 | 11.1%(-3.82)#5,574 |
| 86. | Cairo | 7.4% | 10.3%(-2.90)#86 | 11.1%(-3.66)#5,720 |
| 87. | Hershey | 7.4% | 10.3%(-2.90)#87 | 11.1%(-3.66)#5,722 |
| 88. | Trenton | 7.4% | 10.3%(-2.90)#88 | 11.1%(-3.66)#5,728 |
| 89. | Nelson | 7.4% | 10.3%(-2.90)#89 | 11.1%(-3.66)#5,731 |
| 90. | Arlington | 7.5% | 10.3%(-2.78)#90 | 11.1%(-3.54)#5,849 |
| 91. | Weeping Water | 7.7% | 10.3%(-2.61)#91 | 11.1%(-3.37)#5,974 |
| 92. | Doniphan | 7.7% | 10.3%(-2.61)#92 | 11.1%(-3.37)#5,983 |
| 93. | Sutherland | 7.9% | 10.3%(-2.41)#93 | 11.1%(-3.17)#6,178 |
| 94. | Sterling | 8.0% | 10.3%(-2.26)#94 | 11.1%(-3.02)#6,331 |
| 95. | Milford | 8.2% | 10.3%(-2.14)#95 | 11.1%(-2.90)#6,434 |
| 96. | Wymore | 8.2% | 10.3%(-2.08)#96 | 11.1%(-2.85)#6,487 |
| 97. | Bellevue | 8.2% | 10.3%(-2.07)#97 | 11.1%(-2.83)#6,504 |
| 98. | Benkelman | 8.3% | 10.3%(-1.97)#98 | 11.1%(-2.73)#6,589 |
| 99. | Brule | 8.3% | 10.3%(-1.97)#99 | 11.1%(-2.73)#6,635 |
| 100. | Broadwater | 8.3% | 10.3%(-1.97)#100 | 11.1%(-2.73)#6,662 |
Common Questions
What are the Top 10 Cities with the Lowest Poverty Level Among Seniors Over the Age of 75 in Nebraska?
Top 10 Cities with the Lowest Poverty Level Among Seniors Over the Age of 75 in Nebraska are:
#1
0.88%
#2
1.3%
#3
1.9%
#4
2.1%
#5
2.2%
#6
2.4%
#7
2.6%
#8
2.6%
#9
2.7%
#10
2.7%
What city has the Lowest Poverty Level Among Seniors Over the Age of 75 in Nebraska?
Duncan has the Lowest Poverty Level Among Seniors Over the Age of 75 in Nebraska with 0.88%.
What is the Poverty Level Among Seniors Over the Age of 75 in the State of Nebraska?
Poverty Level Among Seniors Over the Age of 75 in Nebraska is 10.3%.
What is the Poverty Level Among Seniors Over the Age of 75 in the United States?
Poverty Level Among Seniors Over the Age of 75 in the United States is 11.1%.