Cities with the Lowest Poverty Level Among Seniors Over the Age of 75 in Michigan
RELATED REPORTS & OPTIONS
Lowest Poverty | Seniors 75+
Michigan
Compare Cities
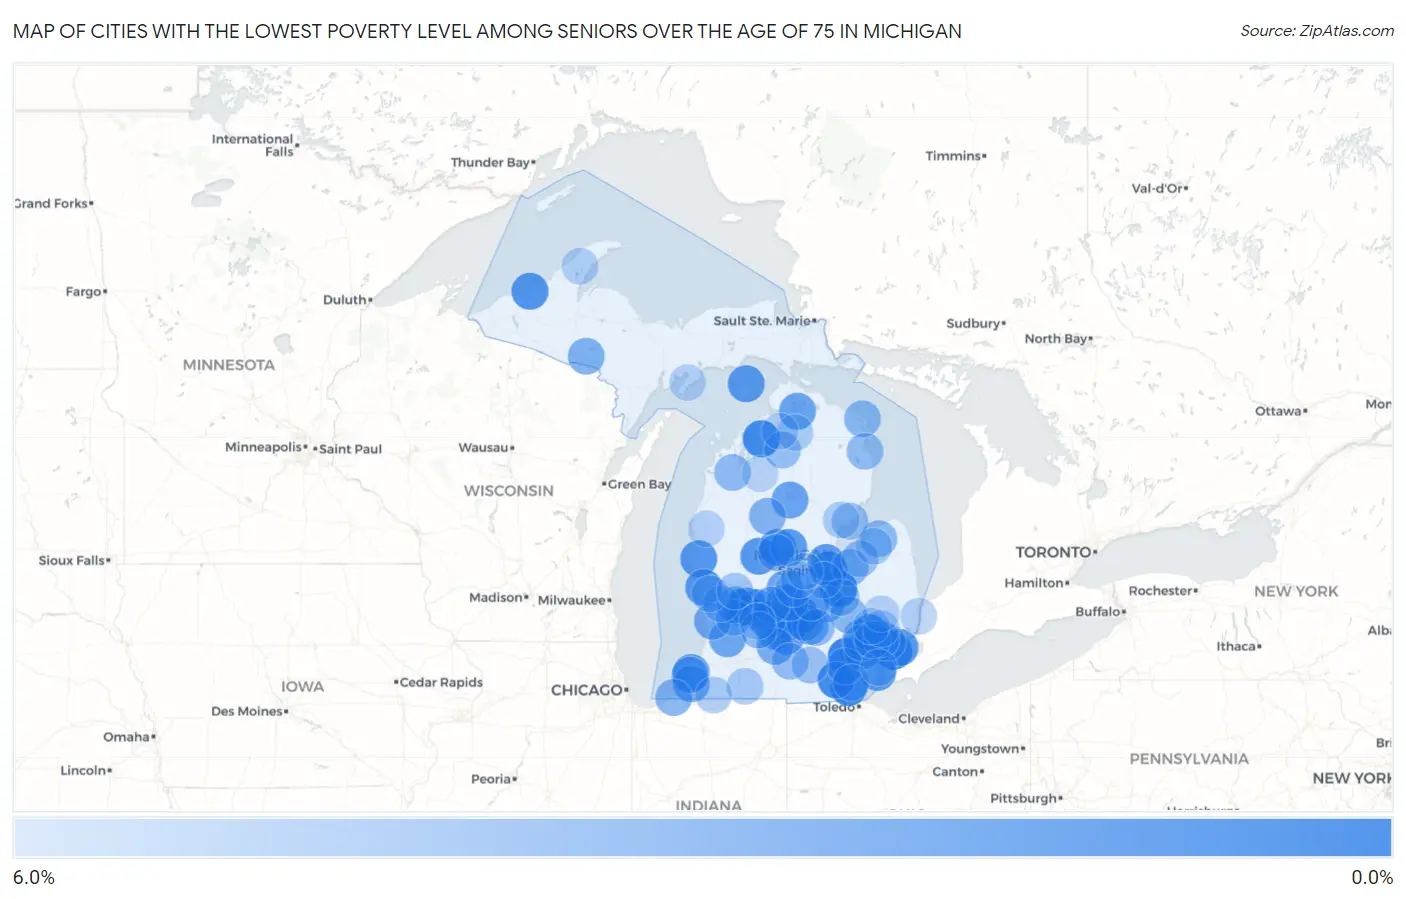
Map of Cities with the Lowest Poverty Level Among Seniors Over the Age of 75 in Michigan
6.0%
0.0%
Cities with the Lowest Poverty Level Among Seniors Over the Age of 75 in Michigan
| City | Senior Poverty | vs State | vs National | |
| 1. | Barton Hills | 0.99% | 9.6%(-8.63)#1 | 11.1%(-10.1)#140 |
| 2. | Grand Ledge | 1.1% | 9.6%(-8.52)#2 | 11.1%(-9.97)#158 |
| 3. | Montrose | 1.1% | 9.6%(-8.48)#3 | 11.1%(-9.93)#170 |
| 4. | Petersburg | 1.2% | 9.6%(-8.44)#4 | 11.1%(-9.89)#181 |
| 5. | Grosse Pointe Park | 1.3% | 9.6%(-8.37)#5 | 11.1%(-9.82)#204 |
| 6. | Central Lake | 1.3% | 9.6%(-8.30)#6 | 11.1%(-9.75)#225 |
| 7. | Tecumseh | 1.4% | 9.6%(-8.18)#7 | 11.1%(-9.63)#269 |
| 8. | Dewitt | 1.5% | 9.6%(-8.15)#8 | 11.1%(-9.60)#282 |
| 9. | Lathrup Village | 1.5% | 9.6%(-8.11)#9 | 11.1%(-9.55)#299 |
| 10. | Forest Hills | 1.8% | 9.6%(-7.78)#10 | 11.1%(-9.23)#441 |
| 11. | Ontonagon | 1.9% | 9.6%(-7.77)#11 | 11.1%(-9.22)#449 |
| 12. | Ferndale | 1.9% | 9.6%(-7.74)#12 | 11.1%(-9.19)#462 |
| 13. | Shields | 1.9% | 9.6%(-7.71)#13 | 11.1%(-9.15)#474 |
| 14. | New Era | 2.0% | 9.6%(-7.66)#14 | 11.1%(-9.11)#501 |
| 15. | Roosevelt Park | 2.0% | 9.6%(-7.60)#15 | 11.1%(-9.05)#533 |
| 16. | Canadian Lakes | 2.0% | 9.6%(-7.57)#16 | 11.1%(-9.02)#556 |
| 17. | St James | 2.1% | 9.6%(-7.54)#17 | 11.1%(-8.98)#583 |
| 18. | Village Of Grosse Pointe Shores | 2.1% | 9.6%(-7.50)#18 | 11.1%(-8.94)#600 |
| 19. | Gibraltar | 2.2% | 9.6%(-7.46)#19 | 11.1%(-8.91)#625 |
| 20. | Weidman | 2.2% | 9.6%(-7.45)#20 | 11.1%(-8.89)#636 |
| 21. | Freeland | 2.2% | 9.6%(-7.41)#21 | 11.1%(-8.85)#661 |
| 22. | Rosebush | 2.2% | 9.6%(-7.40)#22 | 11.1%(-8.84)#673 |
| 23. | Huntington Woods | 2.2% | 9.6%(-7.39)#23 | 11.1%(-8.83)#676 |
| 24. | St Joseph | 2.5% | 9.6%(-7.17)#24 | 11.1%(-8.61)#817 |
| 25. | East Grand Rapids | 2.5% | 9.6%(-7.16)#25 | 11.1%(-8.61)#821 |
| 26. | Charlotte | 2.5% | 9.6%(-7.15)#26 | 11.1%(-8.59)#835 |
| 27. | Indian River | 2.6% | 9.6%(-7.00)#27 | 11.1%(-8.45)#940 |
| 28. | Houghton Lake | 2.6% | 9.6%(-7.00)#28 | 11.1%(-8.44)#945 |
| 29. | Allegan | 2.7% | 9.6%(-6.93)#29 | 11.1%(-8.37)#989 |
| 30. | Beverly Hills | 2.7% | 9.6%(-6.88)#30 | 11.1%(-8.33)#1,037 |
| 31. | Lowell | 2.8% | 9.6%(-6.84)#31 | 11.1%(-8.29)#1,059 |
| 32. | Carson City | 2.8% | 9.6%(-6.84)#32 | 11.1%(-8.29)#1,062 |
| 33. | Holland | 2.9% | 9.6%(-6.77)#33 | 11.1%(-8.21)#1,120 |
| 34. | Vermontville | 2.9% | 9.6%(-6.76)#34 | 11.1%(-8.21)#1,133 |
| 35. | Lake Odessa | 2.9% | 9.6%(-6.74)#35 | 11.1%(-8.19)#1,145 |
| 36. | Plymouth | 2.9% | 9.6%(-6.73)#36 | 11.1%(-8.18)#1,155 |
| 37. | Baroda | 2.9% | 9.6%(-6.68)#37 | 11.1%(-8.13)#1,190 |
| 38. | Pewamo | 2.9% | 9.6%(-6.68)#38 | 11.1%(-8.13)#1,197 |
| 39. | Okemos | 3.0% | 9.6%(-6.64)#39 | 11.1%(-8.09)#1,218 |
| 40. | Corunna | 3.0% | 9.6%(-6.60)#40 | 11.1%(-8.05)#1,254 |
| 41. | Keego Harbor | 3.1% | 9.6%(-6.54)#41 | 11.1%(-7.99)#1,300 |
| 42. | Bellevue | 3.1% | 9.6%(-6.53)#42 | 11.1%(-7.97)#1,318 |
| 43. | Wolverine Lake | 3.2% | 9.6%(-6.41)#43 | 11.1%(-7.86)#1,409 |
| 44. | Walker | 3.2% | 9.6%(-6.38)#44 | 11.1%(-7.83)#1,448 |
| 45. | Sylvan Lake | 3.2% | 9.6%(-6.37)#45 | 11.1%(-7.82)#1,460 |
| 46. | East Lansing | 3.3% | 9.6%(-6.35)#46 | 11.1%(-7.80)#1,476 |
| 47. | Crystal Falls | 3.3% | 9.6%(-6.32)#47 | 11.1%(-7.77)#1,493 |
| 48. | Fowler | 3.3% | 9.6%(-6.29)#48 | 11.1%(-7.73)#1,517 |
| 49. | Lake Isabella | 3.4% | 9.6%(-6.25)#49 | 11.1%(-7.70)#1,563 |
| 50. | Marion | 3.4% | 9.6%(-6.23)#50 | 11.1%(-7.68)#1,591 |
| 51. | Shoreham | 3.4% | 9.6%(-6.20)#51 | 11.1%(-7.65)#1,611 |
| 52. | Grand Beach | 3.4% | 9.6%(-6.17)#52 | 11.1%(-7.62)#1,644 |
| 53. | Bruce Crossing | 3.5% | 9.6%(-6.14)#53 | 11.1%(-7.59)#1,664 |
| 54. | Reese | 3.5% | 9.6%(-6.10)#54 | 11.1%(-7.55)#1,692 |
| 55. | Saline | 3.6% | 9.6%(-6.02)#55 | 11.1%(-7.47)#1,779 |
| 56. | Ionia | 3.6% | 9.6%(-5.98)#56 | 11.1%(-7.43)#1,801 |
| 57. | Presque Isle Harbor | 3.7% | 9.6%(-5.96)#57 | 11.1%(-7.41)#1,828 |
| 58. | Lake Fenton | 3.7% | 9.6%(-5.94)#58 | 11.1%(-7.39)#1,846 |
| 59. | Hastings | 3.7% | 9.6%(-5.89)#59 | 11.1%(-7.33)#1,900 |
| 60. | Elkton | 3.8% | 9.6%(-5.85)#60 | 11.1%(-7.29)#1,947 |
| 61. | Interlochen | 3.8% | 9.6%(-5.82)#61 | 11.1%(-7.27)#1,975 |
| 62. | Novi | 3.9% | 9.6%(-5.70)#62 | 11.1%(-7.15)#2,094 |
| 63. | Ossineke | 4.0% | 9.6%(-5.66)#63 | 11.1%(-7.11)#2,140 |
| 64. | Williamston | 4.0% | 9.6%(-5.63)#64 | 11.1%(-7.08)#2,157 |
| 65. | Albion | 4.0% | 9.6%(-5.60)#65 | 11.1%(-7.04)#2,198 |
| 66. | Ida | 4.1% | 9.6%(-5.54)#66 | 11.1%(-6.99)#2,263 |
| 67. | Au Gres | 4.1% | 9.6%(-5.51)#67 | 11.1%(-6.96)#2,287 |
| 68. | Lakes Of The North | 4.1% | 9.6%(-5.50)#68 | 11.1%(-6.94)#2,298 |
| 69. | Vandercook Lake | 4.2% | 9.6%(-5.46)#69 | 11.1%(-6.91)#2,319 |
| 70. | Center Line | 4.2% | 9.6%(-5.45)#70 | 11.1%(-6.90)#2,325 |
| 71. | Dundee | 4.2% | 9.6%(-5.45)#71 | 11.1%(-6.90)#2,327 |
| 72. | Akron | 4.2% | 9.6%(-5.45)#72 | 11.1%(-6.90)#2,353 |
| 73. | Flushing | 4.2% | 9.6%(-5.42)#73 | 11.1%(-6.87)#2,380 |
| 74. | Byron Center | 4.2% | 9.6%(-5.40)#74 | 11.1%(-6.85)#2,398 |
| 75. | Clawson | 4.2% | 9.6%(-5.37)#75 | 11.1%(-6.82)#2,427 |
| 76. | Perrinton | 4.3% | 9.6%(-5.37)#76 | 11.1%(-6.81)#2,443 |
| 77. | Allendale | 4.3% | 9.6%(-5.29)#77 | 11.1%(-6.74)#2,495 |
| 78. | St Charles | 4.3% | 9.6%(-5.27)#78 | 11.1%(-6.72)#2,515 |
| 79. | Franklin | 4.4% | 9.6%(-5.26)#79 | 11.1%(-6.70)#2,557 |
| 80. | Fruitport | 4.4% | 9.6%(-5.23)#80 | 11.1%(-6.68)#2,572 |
| 81. | Sparta | 4.5% | 9.6%(-5.15)#81 | 11.1%(-6.60)#2,648 |
| 82. | Ovid | 4.5% | 9.6%(-5.14)#82 | 11.1%(-6.59)#2,660 |
| 83. | Riverview | 4.5% | 9.6%(-5.10)#83 | 11.1%(-6.55)#2,699 |
| 84. | Centreville | 4.5% | 9.6%(-5.08)#84 | 11.1%(-6.52)#2,728 |
| 85. | Owendale | 4.5% | 9.6%(-5.08)#85 | 11.1%(-6.52)#2,758 |
| 86. | Ithaca | 4.6% | 9.6%(-5.03)#86 | 11.1%(-6.48)#2,793 |
| 87. | Breckenridge | 4.6% | 9.6%(-5.01)#87 | 11.1%(-6.45)#2,815 |
| 88. | Rochester Hills | 4.6% | 9.6%(-4.99)#88 | 11.1%(-6.43)#2,838 |
| 89. | Edwardsburg | 4.7% | 9.6%(-4.97)#89 | 11.1%(-6.42)#2,857 |
| 90. | Vanderbilt | 4.8% | 9.6%(-4.86)#90 | 11.1%(-6.31)#2,951 |
| 91. | Omer | 4.8% | 9.6%(-4.86)#91 | 11.1%(-6.31)#2,963 |
| 92. | Hubbell | 4.8% | 9.6%(-4.78)#92 | 11.1%(-6.23)#3,039 |
| 93. | Boyne Falls | 4.9% | 9.6%(-4.74)#93 | 11.1%(-6.19)#3,075 |
| 94. | St Clair | 5.0% | 9.6%(-4.65)#94 | 11.1%(-6.10)#3,165 |
| 95. | Freeport | 5.0% | 9.6%(-4.62)#95 | 11.1%(-6.07)#3,200 |
| 96. | Leonard | 5.0% | 9.6%(-4.62)#96 | 11.1%(-6.07)#3,215 |
| 97. | Custer | 5.0% | 9.6%(-4.62)#97 | 11.1%(-6.07)#3,217 |
| 98. | Lake Angelus | 5.0% | 9.6%(-4.62)#98 | 11.1%(-6.07)#3,218 |
| 99. | Garden | 5.0% | 9.6%(-4.62)#99 | 11.1%(-6.07)#3,227 |
| 100. | South Boardman | 5.1% | 9.6%(-4.49)#100 | 11.1%(-5.94)#3,339 |
Common Questions
What are the Top 10 Cities with the Lowest Poverty Level Among Seniors Over the Age of 75 in Michigan?
Top 10 Cities with the Lowest Poverty Level Among Seniors Over the Age of 75 in Michigan are:
#1
0.99%
#2
1.1%
#3
1.1%
#4
1.2%
#5
1.3%
#6
1.3%
#7
1.4%
#8
1.5%
#9
1.5%
#10
1.8%
What city has the Lowest Poverty Level Among Seniors Over the Age of 75 in Michigan?
Barton Hills has the Lowest Poverty Level Among Seniors Over the Age of 75 in Michigan with 0.99%.
What is the Poverty Level Among Seniors Over the Age of 75 in the State of Michigan?
Poverty Level Among Seniors Over the Age of 75 in Michigan is 9.6%.
What is the Poverty Level Among Seniors Over the Age of 75 in the United States?
Poverty Level Among Seniors Over the Age of 75 in the United States is 11.1%.