Spring Valley CDP San Diego County, CA Map & Demographics
Spring Valley CDP San Diego County Overview
$36,862
PER CAPITA INCOME
$100,346
AVG FAMILY INCOME
$98,099
AVG HOUSEHOLD INCOME
24.8%
WAGE / INCOME GAP [ % ]
75.2¢/ $1
WAGE / INCOME GAP [ $ ]
$11,583
FAMILY INCOME DEFICIT
0.39
INEQUALITY / GINI INDEX
32,496
TOTAL POPULATION
16,045
MALE POPULATION
16,451
FEMALE POPULATION
97.53
MALES / 100 FEMALES
102.53
FEMALES / 100 MALES
35.4
MEDIAN AGE
3.6
AVG FAMILY SIZE
3.3
AVG HOUSEHOLD SIZE
17,237
LABOR FORCE [ PEOPLE ]
67.4%
PERCENT IN LABOR FORCE
7.1%
UNEMPLOYMENT RATE
Income in Spring Valley CDP San Diego County
Income Overview in Spring Valley CDP San Diego County
Per Capita Income in Spring Valley CDP San Diego County is $36,862, while median incomes of families and households are $100,346 and $98,099 respectively.
| Characteristic | Number | Measure |
| Per Capita Income | 32,496 | $36,862 |
| Median Family Income | 7,759 | $100,346 |
| Mean Family Income | 7,759 | $120,335 |
| Median Household Income | 9,818 | $98,099 |
| Mean Household Income | 9,818 | $118,007 |
| Income Deficit | 7,759 | $11,583 |
| Wage / Income Gap (%) | 32,496 | 24.84% |
| Wage / Income Gap ($) | 32,496 | 75.16¢ per $1 |
| Gini / Inequality Index | 32,496 | 0.39 |
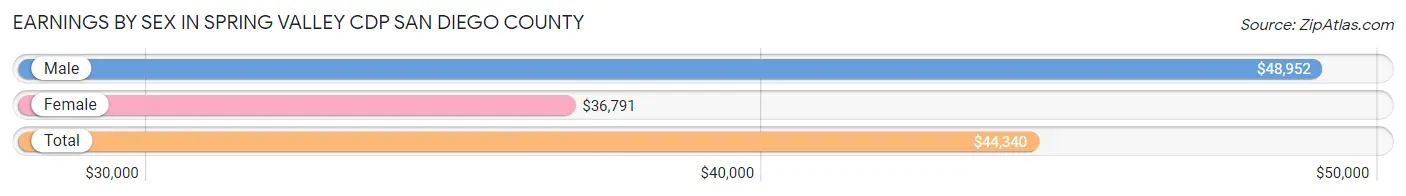
Earnings by Sex in Spring Valley CDP San Diego County
Average Earnings in Spring Valley CDP San Diego County are $44,340, $48,952 for men and $36,791 for women, a difference of 24.8%.
| Sex | Number | Average Earnings |
| Male | 9,473 (54.2%) | $48,952 |
| Female | 8,006 (45.8%) | $36,791 |
| Total | 17,479 (100.0%) | $44,340 |
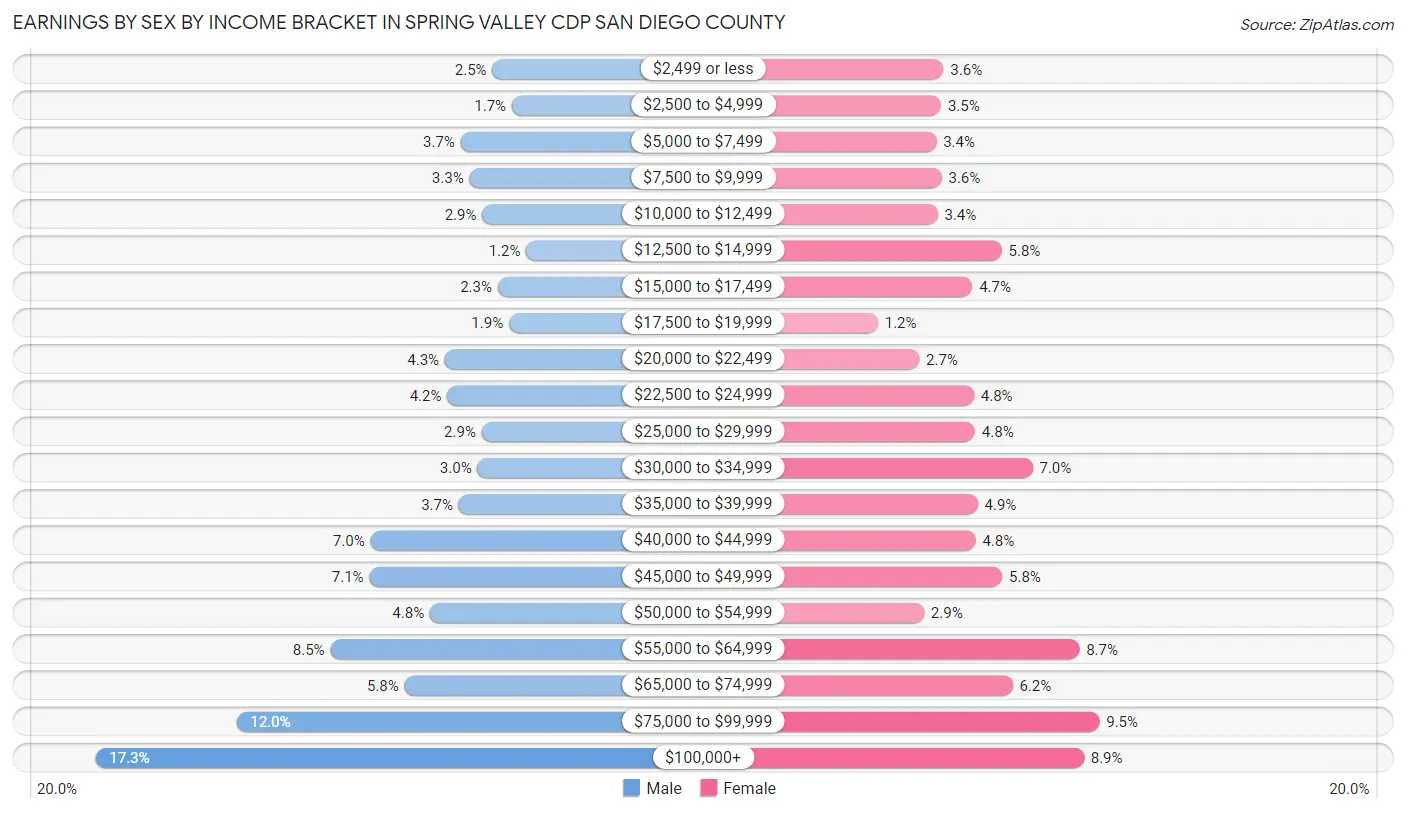
Earnings by Sex by Income Bracket in Spring Valley CDP San Diego County
The most common earnings brackets in Spring Valley CDP San Diego County are $100,000+ for men (1,640 | 17.3%) and $75,000 to $99,999 for women (757 | 9.5%).
| Income | Male | Female |
| $2,499 or less | 234 (2.5%) | 290 (3.6%) |
| $2,500 to $4,999 | 165 (1.7%) | 283 (3.5%) |
| $5,000 to $7,499 | 347 (3.7%) | 268 (3.4%) |
| $7,500 to $9,999 | 315 (3.3%) | 284 (3.5%) |
| $10,000 to $12,499 | 270 (2.9%) | 272 (3.4%) |
| $12,500 to $14,999 | 114 (1.2%) | 464 (5.8%) |
| $15,000 to $17,499 | 215 (2.3%) | 376 (4.7%) |
| $17,500 to $19,999 | 175 (1.8%) | 93 (1.2%) |
| $20,000 to $22,499 | 403 (4.3%) | 217 (2.7%) |
| $22,500 to $24,999 | 394 (4.2%) | 381 (4.8%) |
| $25,000 to $29,999 | 272 (2.9%) | 384 (4.8%) |
| $30,000 to $34,999 | 287 (3.0%) | 557 (7.0%) |
| $35,000 to $39,999 | 353 (3.7%) | 392 (4.9%) |
| $40,000 to $44,999 | 667 (7.0%) | 386 (4.8%) |
| $45,000 to $49,999 | 671 (7.1%) | 466 (5.8%) |
| $50,000 to $54,999 | 456 (4.8%) | 231 (2.9%) |
| $55,000 to $64,999 | 809 (8.5%) | 697 (8.7%) |
| $65,000 to $74,999 | 546 (5.8%) | 497 (6.2%) |
| $75,000 to $99,999 | 1,140 (12.0%) | 757 (9.5%) |
| $100,000+ | 1,640 (17.3%) | 711 (8.9%) |
| Total | 9,473 (100.0%) | 8,006 (100.0%) |
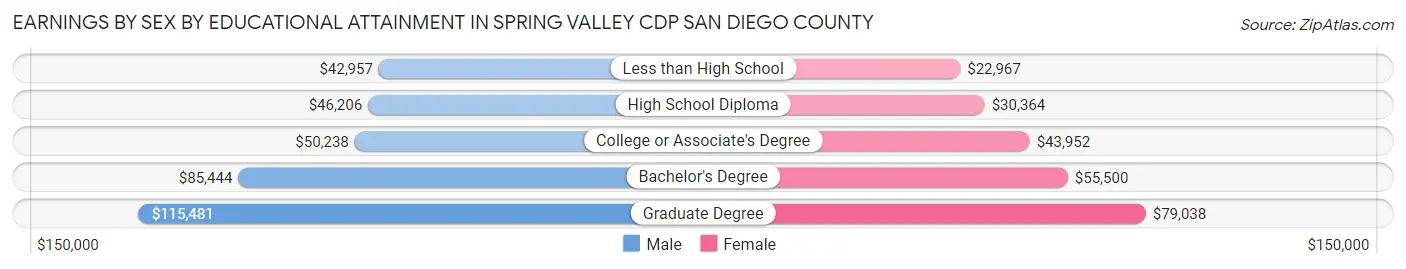
Earnings by Sex by Educational Attainment in Spring Valley CDP San Diego County
Average earnings in Spring Valley CDP San Diego County are $52,372 for men and $41,747 for women, a difference of 20.3%. Men with an educational attainment of graduate degree enjoy the highest average annual earnings of $115,481, while those with less than high school education earn the least with $42,957. Women with an educational attainment of graduate degree earn the most with the average annual earnings of $79,038, while those with less than high school education have the smallest earnings of $22,967.
| Educational Attainment | Male Income | Female Income |
| Less than High School | $42,957 | $22,967 |
| High School Diploma | $46,206 | $30,364 |
| College or Associate's Degree | $50,238 | $43,952 |
| Bachelor's Degree | $85,444 | $55,500 |
| Graduate Degree | $115,481 | $79,038 |
| Total | $52,372 | $41,747 |
Family Income in Spring Valley CDP San Diego County
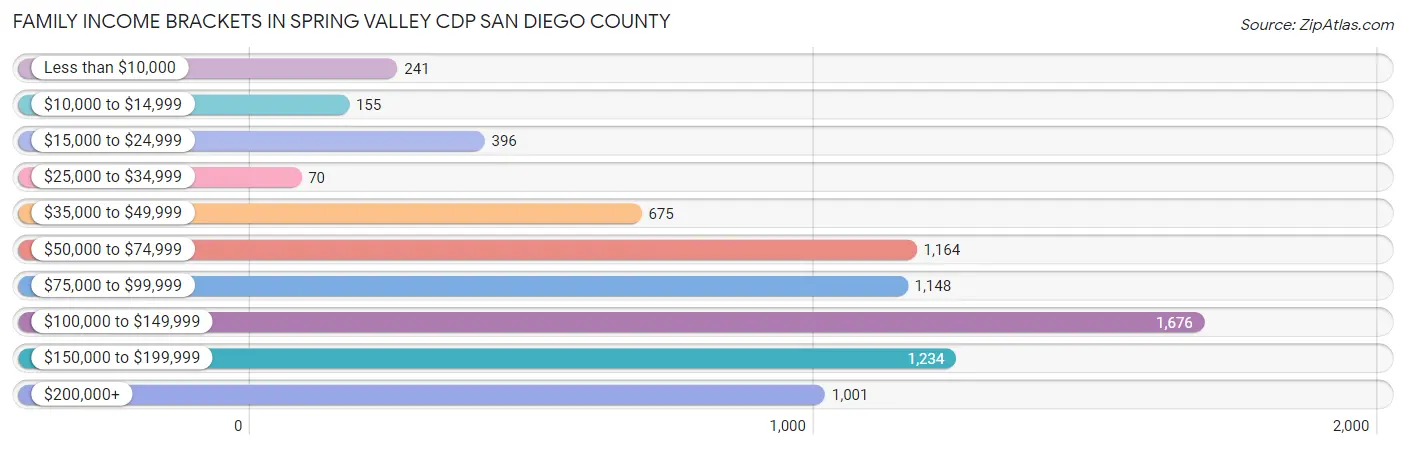
Family Income Brackets in Spring Valley CDP San Diego County
According to the Spring Valley CDP San Diego County family income data, there are 1,676 families falling into the $100,000 to $149,999 income range, which is the most common income bracket and makes up 21.6% of all families. Conversely, the $25,000 to $34,999 income bracket is the least frequent group with only 70 families (0.9%) belonging to this category.
| Income Bracket | # Families | % Families |
| Less than $10,000 | 241 | 3.1% |
| $10,000 to $14,999 | 155 | 2.0% |
| $15,000 to $24,999 | 396 | 5.1% |
| $25,000 to $34,999 | 70 | 0.9% |
| $35,000 to $49,999 | 675 | 8.7% |
| $50,000 to $74,999 | 1,164 | 15.0% |
| $75,000 to $99,999 | 1,148 | 14.8% |
| $100,000 to $149,999 | 1,676 | 21.6% |
| $150,000 to $199,999 | 1,234 | 15.9% |
| $200,000+ | 1,001 | 12.9% |
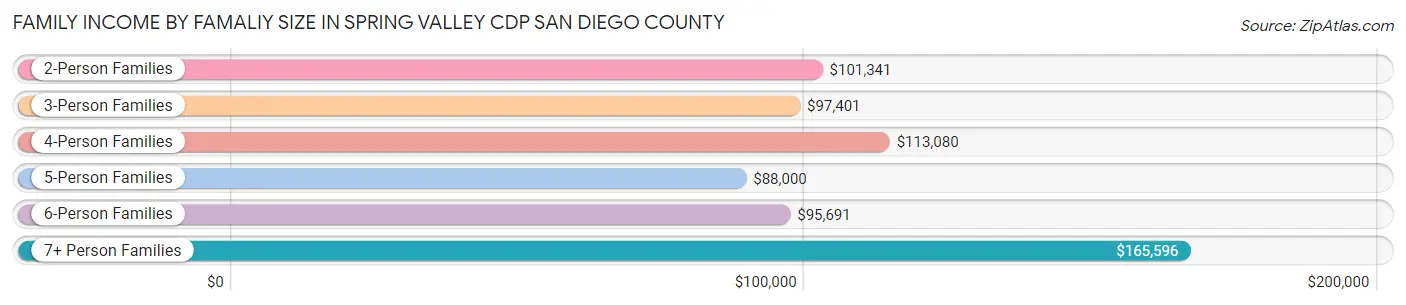
Family Income by Famaliy Size in Spring Valley CDP San Diego County
7+ person families (222 | 2.9%) account for the highest median family income in Spring Valley CDP San Diego County with $165,596 per family, while 2-person families (2,725 | 35.1%) have the highest median income of $50,670 per family member.
| Income Bracket | # Families | Median Income |
| 2-Person Families | 2,725 (35.1%) | $101,341 |
| 3-Person Families | 1,747 (22.5%) | $97,401 |
| 4-Person Families | 1,851 (23.9%) | $113,080 |
| 5-Person Families | 816 (10.5%) | $88,000 |
| 6-Person Families | 398 (5.1%) | $95,691 |
| 7+ Person Families | 222 (2.9%) | $165,596 |
| Total | 7,759 (100.0%) | $100,346 |
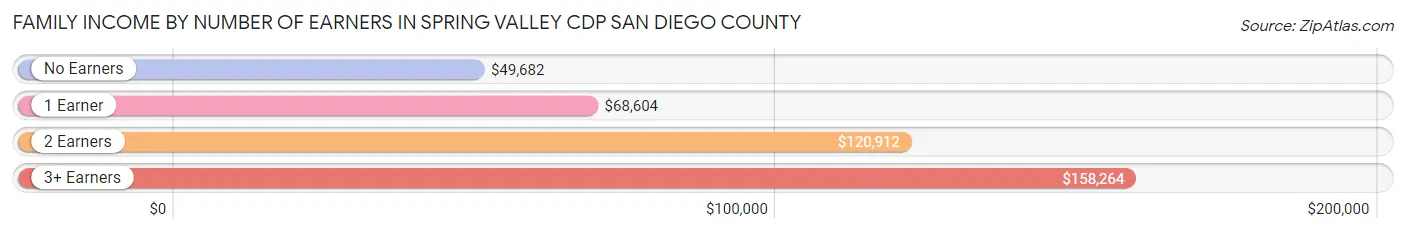
Family Income by Number of Earners in Spring Valley CDP San Diego County
The median family income in Spring Valley CDP San Diego County is $100,346, with families comprising 3+ earners (1,333) having the highest median family income of $158,264, while families with no earners (955) have the lowest median family income of $49,682, accounting for 17.2% and 12.3% of families, respectively.
| Number of Earners | # Families | Median Income |
| No Earners | 955 (12.3%) | $49,682 |
| 1 Earner | 2,386 (30.7%) | $68,604 |
| 2 Earners | 3,085 (39.8%) | $120,912 |
| 3+ Earners | 1,333 (17.2%) | $158,264 |
| Total | 7,759 (100.0%) | $100,346 |
Household Income in Spring Valley CDP San Diego County
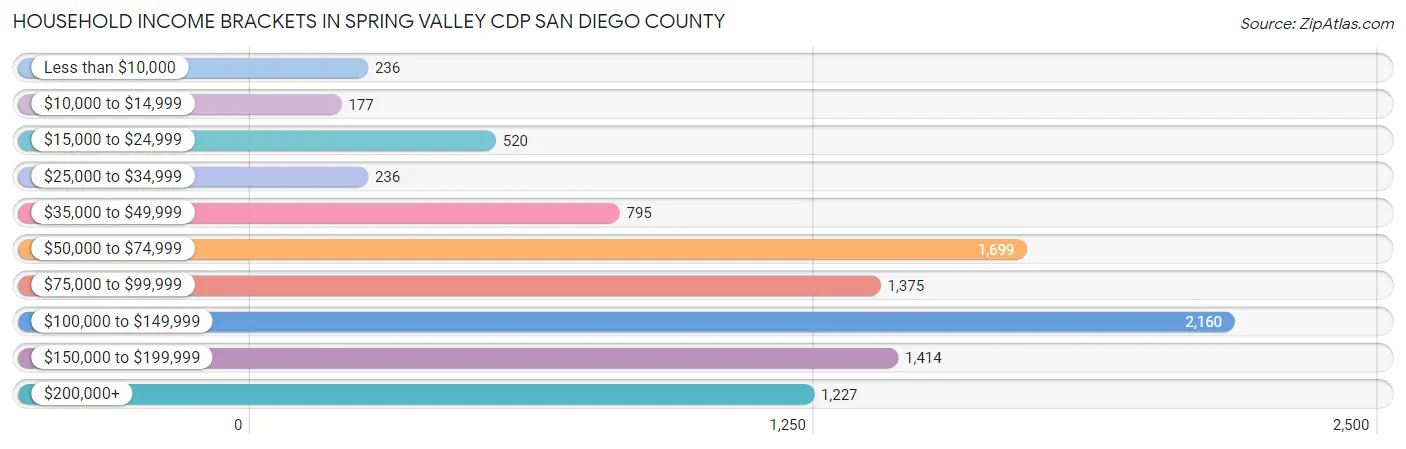
Household Income Brackets in Spring Valley CDP San Diego County
With 2,160 households falling in the category, the $100,000 to $149,999 income range is the most frequent in Spring Valley CDP San Diego County, accounting for 22.0% of all households. In contrast, only 177 households (1.8%) fall into the $10,000 to $14,999 income bracket, making it the least populous group.
| Income Bracket | # Households | % Households |
| Less than $10,000 | 236 | 2.4% |
| $10,000 to $14,999 | 177 | 1.8% |
| $15,000 to $24,999 | 520 | 5.3% |
| $25,000 to $34,999 | 236 | 2.4% |
| $35,000 to $49,999 | 795 | 8.1% |
| $50,000 to $74,999 | 1,699 | 17.3% |
| $75,000 to $99,999 | 1,375 | 14.0% |
| $100,000 to $149,999 | 2,160 | 22.0% |
| $150,000 to $199,999 | 1,414 | 14.4% |
| $200,000+ | 1,227 | 12.5% |
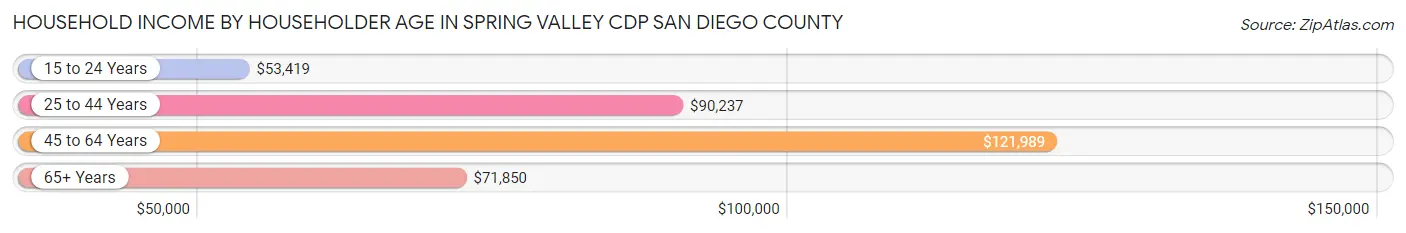
Household Income by Householder Age in Spring Valley CDP San Diego County
The median household income in Spring Valley CDP San Diego County is $98,099, with the highest median household income of $121,989 found in the 45 to 64 years age bracket for the primary householder. A total of 3,793 households (38.6%) fall into this category. Meanwhile, the 15 to 24 years age bracket for the primary householder has the lowest median household income of $53,419, with 125 households (1.3%) in this group.
| Income Bracket | # Households | Median Income |
| 15 to 24 Years | 125 (1.3%) | $53,419 |
| 25 to 44 Years | 3,885 (39.6%) | $90,237 |
| 45 to 64 Years | 3,793 (38.6%) | $121,989 |
| 65+ Years | 2,015 (20.5%) | $71,850 |
| Total | 9,818 (100.0%) | $98,099 |
Poverty in Spring Valley CDP San Diego County
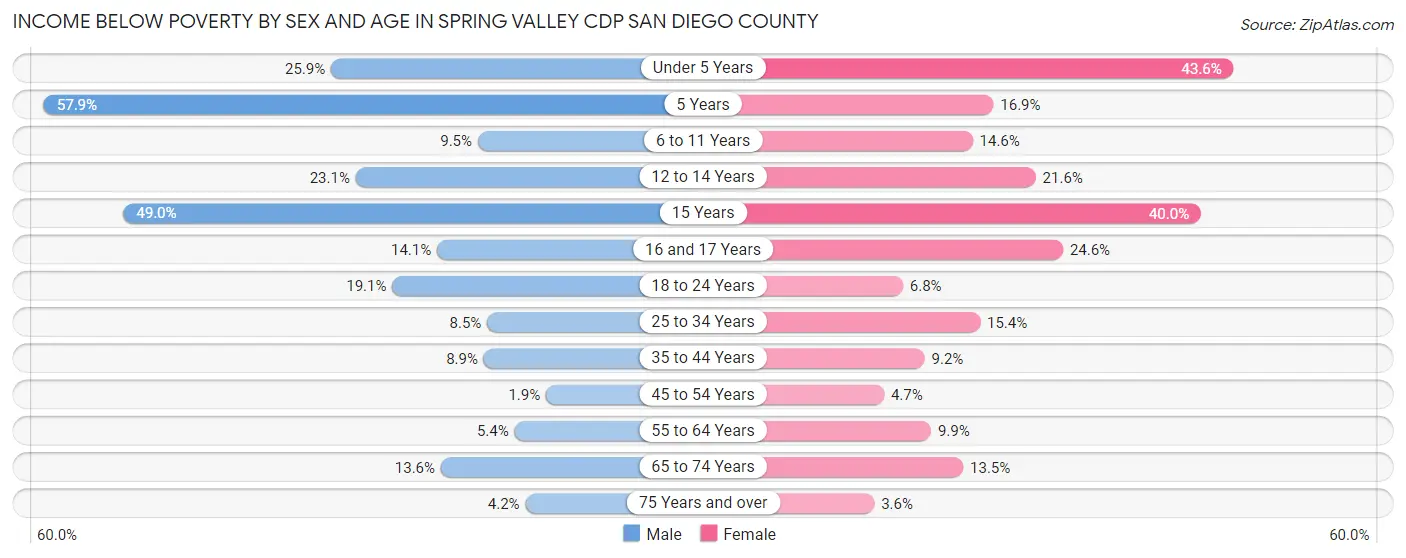
Income Below Poverty by Sex and Age in Spring Valley CDP San Diego County
With 11.8% poverty level for males and 14.3% for females among the residents of Spring Valley CDP San Diego County, 5 year old males and under 5 year old females are the most vulnerable to poverty, with 129 males (57.9%) and 572 females (43.6%) in their respective age groups living below the poverty level.
| Age Bracket | Male | Female |
| Under 5 Years | 298 (25.9%) | 572 (43.6%) |
| 5 Years | 129 (57.9%) | 40 (16.9%) |
| 6 to 11 Years | 91 (9.5%) | 160 (14.6%) |
| 12 to 14 Years | 185 (23.1%) | 149 (21.6%) |
| 15 Years | 49 (49.0%) | 122 (40.0%) |
| 16 and 17 Years | 75 (14.1%) | 118 (24.6%) |
| 18 to 24 Years | 286 (19.1%) | 112 (6.8%) |
| 25 to 34 Years | 219 (8.5%) | 368 (15.4%) |
| 35 to 44 Years | 215 (8.9%) | 221 (9.2%) |
| 45 to 54 Years | 39 (1.9%) | 87 (4.7%) |
| 55 to 64 Years | 99 (5.4%) | 191 (9.9%) |
| 65 to 74 Years | 187 (13.6%) | 174 (13.5%) |
| 75 Years and over | 21 (4.2%) | 26 (3.6%) |
| Total | 1,893 (11.8%) | 2,340 (14.3%) |
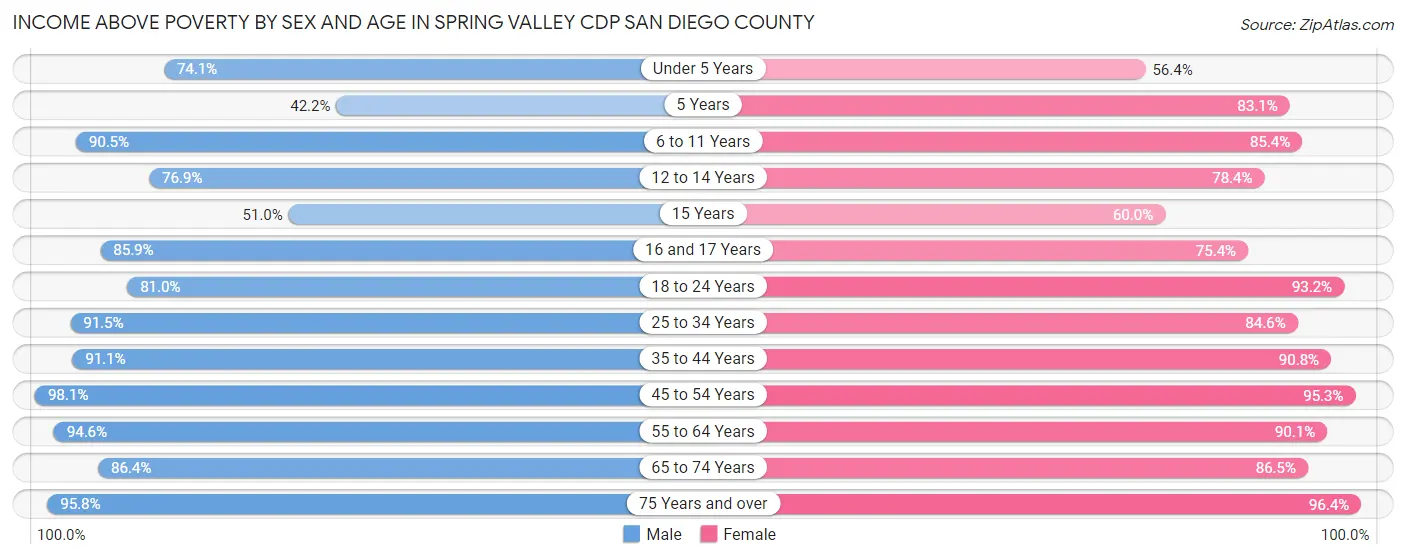
Income Above Poverty by Sex and Age in Spring Valley CDP San Diego County
According to the poverty statistics in Spring Valley CDP San Diego County, males aged 45 to 54 years and females aged 75 years and over are the age groups that are most secure financially, with 98.1% of males and 96.4% of females in these age groups living above the poverty line.
| Age Bracket | Male | Female |
| Under 5 Years | 854 (74.1%) | 739 (56.4%) |
| 5 Years | 94 (42.1%) | 197 (83.1%) |
| 6 to 11 Years | 865 (90.5%) | 938 (85.4%) |
| 12 to 14 Years | 615 (76.9%) | 541 (78.4%) |
| 15 Years | 51 (51.0%) | 183 (60.0%) |
| 16 and 17 Years | 458 (85.9%) | 361 (75.4%) |
| 18 to 24 Years | 1,215 (80.9%) | 1,536 (93.2%) |
| 25 to 34 Years | 2,365 (91.5%) | 2,022 (84.6%) |
| 35 to 44 Years | 2,213 (91.1%) | 2,176 (90.8%) |
| 45 to 54 Years | 1,982 (98.1%) | 1,766 (95.3%) |
| 55 to 64 Years | 1,721 (94.6%) | 1,732 (90.1%) |
| 65 to 74 Years | 1,184 (86.4%) | 1,114 (86.5%) |
| 75 Years and over | 477 (95.8%) | 695 (96.4%) |
| Total | 14,094 (88.2%) | 14,000 (85.7%) |
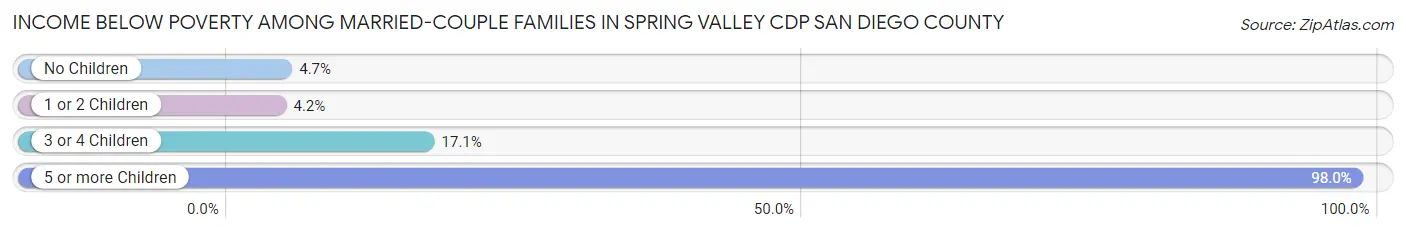
Income Below Poverty Among Married-Couple Families in Spring Valley CDP San Diego County
The poverty statistics for married-couple families in Spring Valley CDP San Diego County show that 6.2% or 348 of the total 5,624 families live below the poverty line. Families with 5 or more children have the highest poverty rate of 98.0%, comprising of 48 families. On the other hand, families with 1 or 2 children have the lowest poverty rate of 4.2%, which includes 86 families.
| Children | Above Poverty | Below Poverty |
| No Children | 3,007 (95.3%) | 149 (4.7%) |
| 1 or 2 Children | 1,953 (95.8%) | 86 (4.2%) |
| 3 or 4 Children | 315 (82.9%) | 65 (17.1%) |
| 5 or more Children | 1 (2.0%) | 48 (98.0%) |
| Total | 5,276 (93.8%) | 348 (6.2%) |
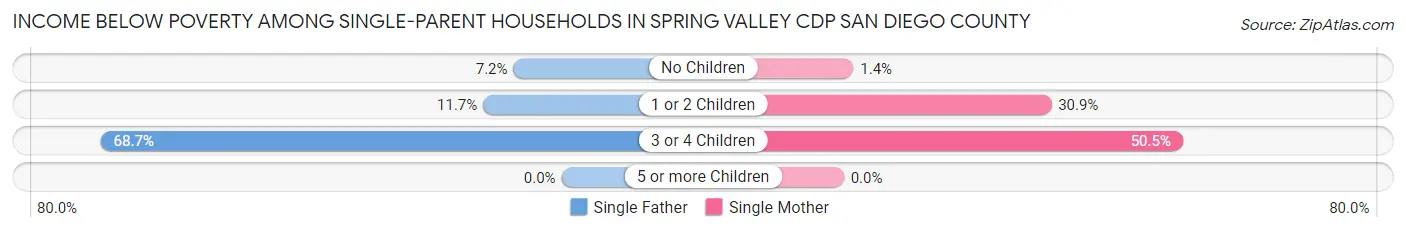
Income Below Poverty Among Single-Parent Households in Spring Valley CDP San Diego County
According to the poverty data in Spring Valley CDP San Diego County, 22.4% or 209 single-father households and 22.1% or 266 single-mother households are living below the poverty line. Among single-father households, those with 3 or 4 children have the highest poverty rate, with 138 households (68.7%) experiencing poverty. Likewise, among single-mother households, those with 3 or 4 children have the highest poverty rate, with 97 households (50.5%) falling below the poverty line.
| Children | Single Father | Single Mother |
| No Children | 23 (7.2%) | 7 (1.4%) |
| 1 or 2 Children | 48 (11.7%) | 162 (30.9%) |
| 3 or 4 Children | 138 (68.7%) | 97 (50.5%) |
| 5 or more Children | 0 (0.0%) | 0 (0.0%) |
| Total | 209 (22.4%) | 266 (22.1%) |
Income Below Poverty Among Married-Couple vs Single-Parent Households in Spring Valley CDP San Diego County
The poverty data for Spring Valley CDP San Diego County shows that 348 of the married-couple family households (6.2%) and 475 of the single-parent households (22.3%) are living below the poverty level. Within the married-couple family households, those with 5 or more children have the highest poverty rate, with 48 households (98.0%) falling below the poverty line. Among the single-parent households, those with 3 or 4 children have the highest poverty rate, with 235 household (59.8%) living below poverty.
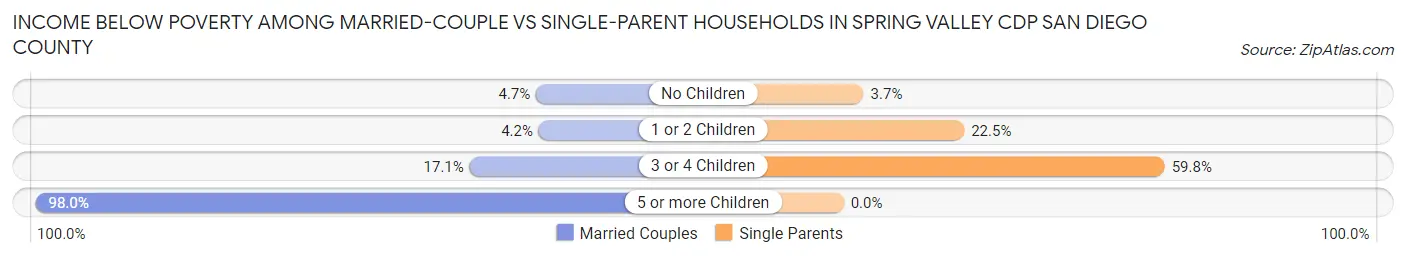
| Children | Married-Couple Families | Single-Parent Households |
| No Children | 149 (4.7%) | 30 (3.7%) |
| 1 or 2 Children | 86 (4.2%) | 210 (22.5%) |
| 3 or 4 Children | 65 (17.1%) | 235 (59.8%) |
| 5 or more Children | 48 (98.0%) | 0 (0.0%) |
| Total | 348 (6.2%) | 475 (22.3%) |
Race in Spring Valley CDP San Diego County
The most populous races in Spring Valley CDP San Diego County are White / Caucasian (17,417 | 53.6%), Hispanic or Latino (12,916 | 39.8%), and Two or more Races (5,035 | 15.5%).
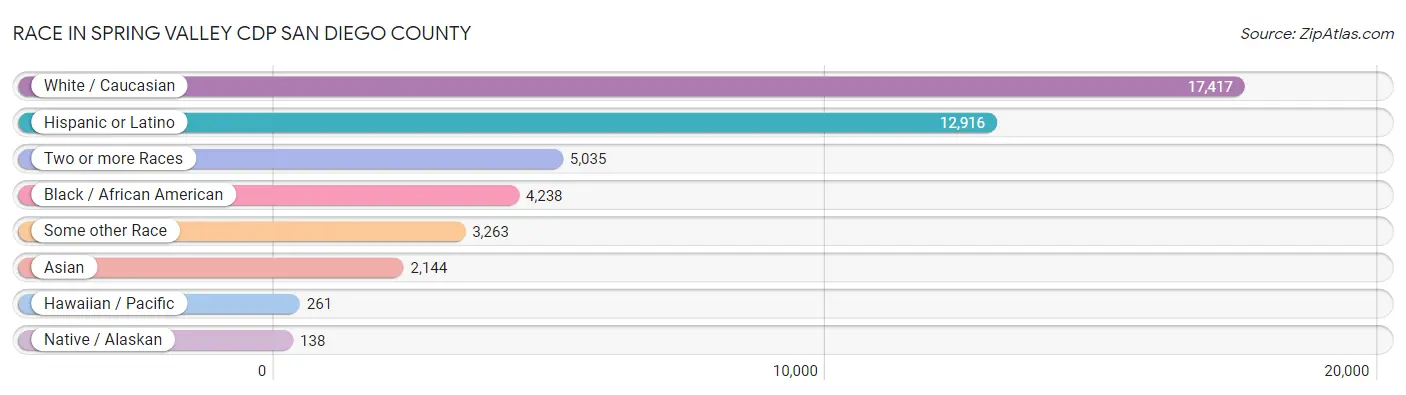
| Race | # Population | % Population |
| Asian | 2,144 | 6.6% |
| Black / African American | 4,238 | 13.0% |
| Hawaiian / Pacific | 261 | 0.8% |
| Hispanic or Latino | 12,916 | 39.8% |
| Native / Alaskan | 138 | 0.4% |
| White / Caucasian | 17,417 | 53.6% |
| Two or more Races | 5,035 | 15.5% |
| Some other Race | 3,263 | 10.0% |
| Total | 32,496 | 100.0% |
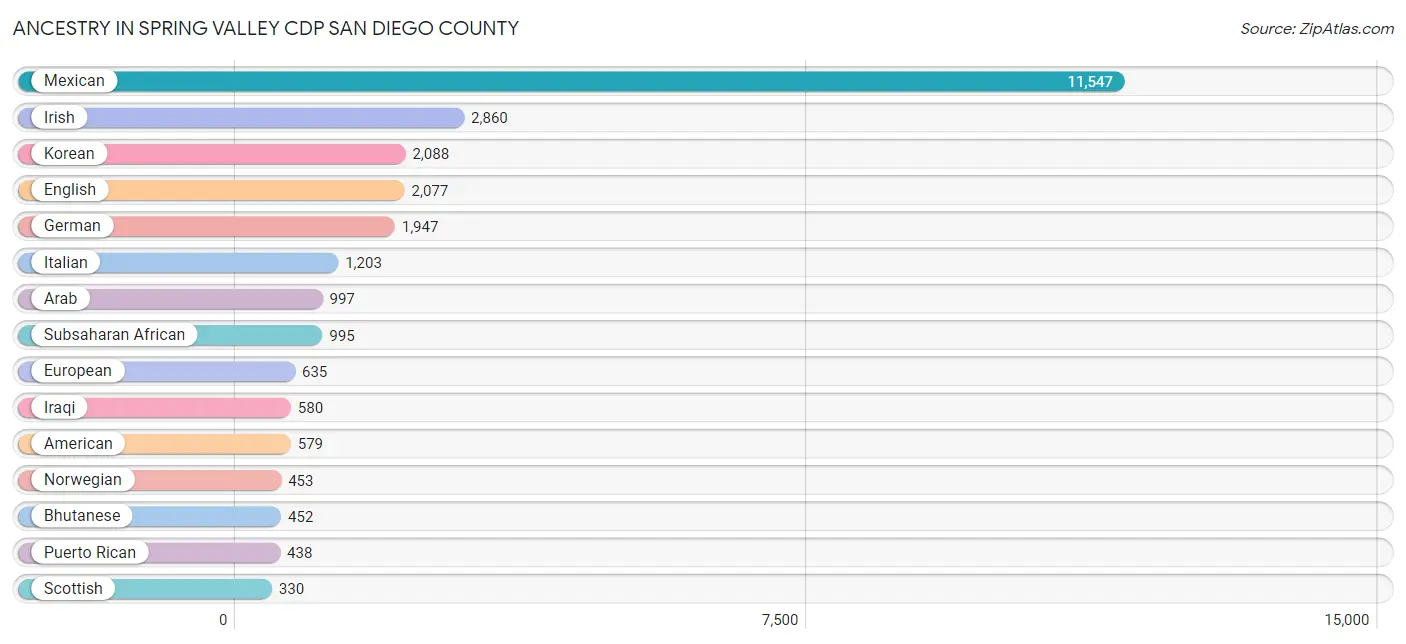
Ancestry in Spring Valley CDP San Diego County
The most populous ancestries reported in Spring Valley CDP San Diego County are Mexican (11,547 | 35.5%), Irish (2,860 | 8.8%), Korean (2,088 | 6.4%), English (2,077 | 6.4%), and German (1,947 | 6.0%), together accounting for 63.1% of all Spring Valley CDP San Diego County residents.
| Ancestry | # Population | % Population |
| African | 258 | 0.8% |
| American | 579 | 1.8% |
| Arab | 997 | 3.1% |
| Argentinean | 12 | 0.0% |
| Assyrian / Chaldean / Syriac | 205 | 0.6% |
| Australian | 12 | 0.0% |
| Austrian | 9 | 0.0% |
| Basque | 18 | 0.1% |
| Belizean | 28 | 0.1% |
| Bhutanese | 452 | 1.4% |
| Blackfeet | 11 | 0.0% |
| Bolivian | 87 | 0.3% |
| Brazilian | 18 | 0.1% |
| British | 201 | 0.6% |
| Burmese | 186 | 0.6% |
| Canadian | 7 | 0.0% |
| Central American | 325 | 1.0% |
| Central American Indian | 22 | 0.1% |
| Cherokee | 184 | 0.6% |
| Choctaw | 61 | 0.2% |
| Colombian | 23 | 0.1% |
| Costa Rican | 19 | 0.1% |
| Creek | 4 | 0.0% |
| Czech | 87 | 0.3% |
| Danish | 69 | 0.2% |
| Dutch | 222 | 0.7% |
| Eastern European | 19 | 0.1% |
| English | 2,077 | 6.4% |
| Ethiopian | 73 | 0.2% |
| European | 635 | 1.9% |
| Filipino | 29 | 0.1% |
| Finnish | 35 | 0.1% |
| French | 304 | 0.9% |
| French Canadian | 94 | 0.3% |
| German | 1,947 | 6.0% |
| Greek | 120 | 0.4% |
| Guamanian / Chamorro | 292 | 0.9% |
| Guatemalan | 233 | 0.7% |
| Guyanese | 11 | 0.0% |
| Haitian | 19 | 0.1% |
| Hungarian | 70 | 0.2% |
| Icelander | 6 | 0.0% |
| Indian (Asian) | 224 | 0.7% |
| Iranian | 36 | 0.1% |
| Iraqi | 580 | 1.8% |
| Irish | 2,860 | 8.8% |
| Israeli | 12 | 0.0% |
| Italian | 1,203 | 3.7% |
| Jamaican | 48 | 0.2% |
| Japanese | 188 | 0.6% |
| Korean | 2,088 | 6.4% |
| Latvian | 9 | 0.0% |
| Lebanese | 60 | 0.2% |
| Lithuanian | 37 | 0.1% |
| Malaysian | 36 | 0.1% |
| Menominee | 13 | 0.0% |
| Mexican | 11,547 | 35.5% |
| Mexican American Indian | 78 | 0.2% |
| Moroccan | 31 | 0.1% |
| Native Hawaiian | 138 | 0.4% |
| Nicaraguan | 12 | 0.0% |
| Nigerian | 87 | 0.3% |
| Northern European | 48 | 0.2% |
| Norwegian | 453 | 1.4% |
| Pakistani | 38 | 0.1% |
| Palestinian | 143 | 0.4% |
| Panamanian | 6 | 0.0% |
| Peruvian | 117 | 0.4% |
| Polish | 278 | 0.9% |
| Portuguese | 28 | 0.1% |
| Pueblo | 45 | 0.1% |
| Puerto Rican | 438 | 1.3% |
| Romanian | 35 | 0.1% |
| Russian | 95 | 0.3% |
| Salvadoran | 55 | 0.2% |
| Samoan | 43 | 0.1% |
| Scandinavian | 86 | 0.3% |
| Scotch-Irish | 119 | 0.4% |
| Scottish | 330 | 1.0% |
| Seminole | 88 | 0.3% |
| Slovene | 3 | 0.0% |
| Somali | 62 | 0.2% |
| South African | 30 | 0.1% |
| South American | 259 | 0.8% |
| Spaniard | 43 | 0.1% |
| Spanish | 59 | 0.2% |
| Sri Lankan | 119 | 0.4% |
| Subsaharan African | 995 | 3.1% |
| Swedish | 144 | 0.4% |
| Swiss | 171 | 0.5% |
| Syrian | 17 | 0.1% |
| Thai | 98 | 0.3% |
| Trinidadian and Tobagonian | 17 | 0.1% |
| Turkish | 7 | 0.0% |
| Ukrainian | 74 | 0.2% |
| Venezuelan | 17 | 0.1% |
| Welsh | 111 | 0.3% |
| West Indian | 21 | 0.1% |
| Yugoslavian | 7 | 0.0% |
| Yuman | 6 | 0.0% | View All 100 Rows |
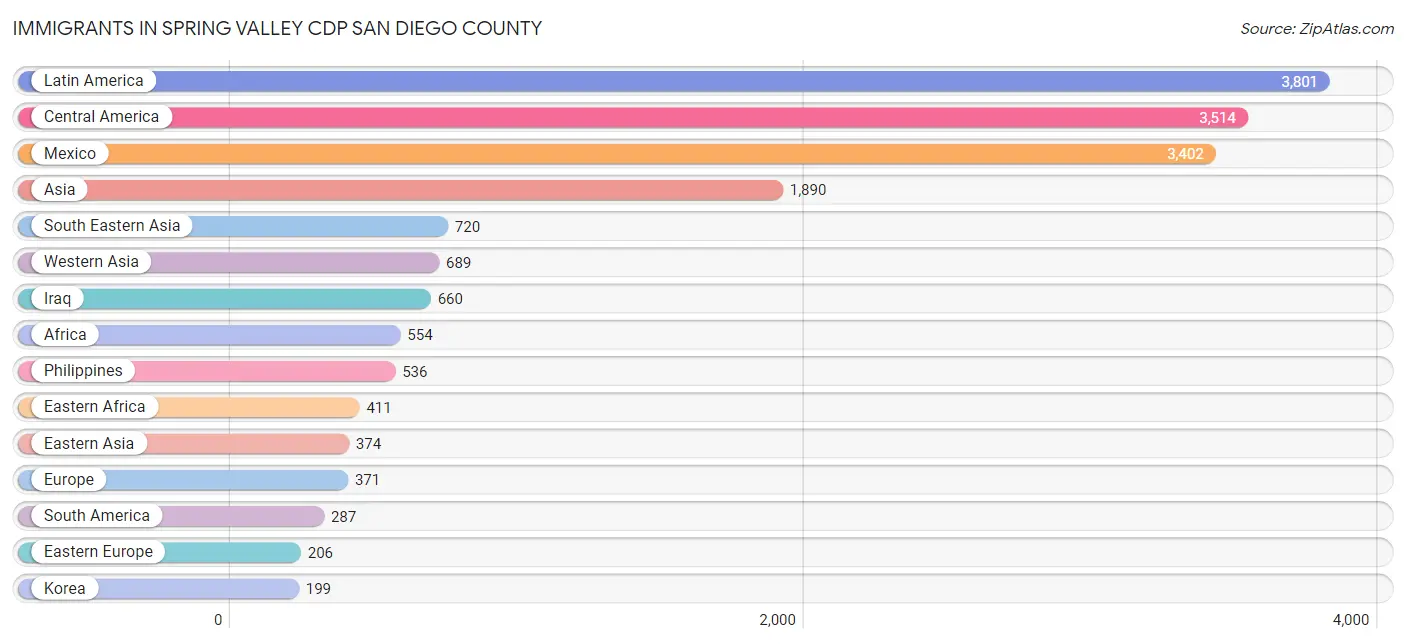
Immigrants in Spring Valley CDP San Diego County
The most numerous immigrant groups reported in Spring Valley CDP San Diego County came from Latin America (3,801 | 11.7%), Central America (3,514 | 10.8%), Mexico (3,402 | 10.5%), Asia (1,890 | 5.8%), and South Eastern Asia (720 | 2.2%), together accounting for 41.0% of all Spring Valley CDP San Diego County residents.
| Immigration Origin | # Population | % Population |
| Afghanistan | 16 | 0.1% |
| Africa | 554 | 1.7% |
| Argentina | 12 | 0.0% |
| Asia | 1,890 | 5.8% |
| Belarus | 27 | 0.1% |
| Bolivia | 87 | 0.3% |
| Brazil | 24 | 0.1% |
| Cambodia | 89 | 0.3% |
| Canada | 5 | 0.0% |
| Central America | 3,514 | 10.8% |
| China | 32 | 0.1% |
| Colombia | 5 | 0.0% |
| Congo | 92 | 0.3% |
| Eastern Africa | 411 | 1.3% |
| Eastern Asia | 374 | 1.1% |
| Eastern Europe | 206 | 0.6% |
| El Salvador | 39 | 0.1% |
| England | 27 | 0.1% |
| Eritrea | 44 | 0.1% |
| Europe | 371 | 1.1% |
| France | 13 | 0.0% |
| Germany | 10 | 0.0% |
| Guatemala | 67 | 0.2% |
| Guyana | 14 | 0.0% |
| Hungary | 59 | 0.2% |
| Iran | 73 | 0.2% |
| Iraq | 660 | 2.0% |
| Israel | 29 | 0.1% |
| Italy | 27 | 0.1% |
| Japan | 143 | 0.4% |
| Korea | 199 | 0.6% |
| Laos | 6 | 0.0% |
| Latin America | 3,801 | 11.7% |
| Mexico | 3,402 | 10.5% |
| Middle Africa | 92 | 0.3% |
| Moldova | 18 | 0.1% |
| Nepal | 7 | 0.0% |
| Netherlands | 12 | 0.0% |
| Nigeria | 25 | 0.1% |
| Northern Europe | 93 | 0.3% |
| Panama | 6 | 0.0% |
| Peru | 145 | 0.4% |
| Philippines | 536 | 1.7% |
| Romania | 25 | 0.1% |
| Somalia | 30 | 0.1% |
| South Africa | 26 | 0.1% |
| South America | 287 | 0.9% |
| South Central Asia | 96 | 0.3% |
| South Eastern Asia | 720 | 2.2% |
| Southern Europe | 37 | 0.1% |
| Spain | 10 | 0.0% |
| Taiwan | 32 | 0.1% |
| Thailand | 15 | 0.1% |
| Ukraine | 77 | 0.2% |
| Vietnam | 74 | 0.2% |
| Western Africa | 25 | 0.1% |
| Western Asia | 689 | 2.1% |
| Western Europe | 35 | 0.1% | View All 58 Rows |
Sex and Age in Spring Valley CDP San Diego County
Sex and Age in Spring Valley CDP San Diego County
The most populous age groups in Spring Valley CDP San Diego County are 25 to 29 Years (1,415 | 8.8%) for men and 35 to 39 Years (1,421 | 8.6%) for women.
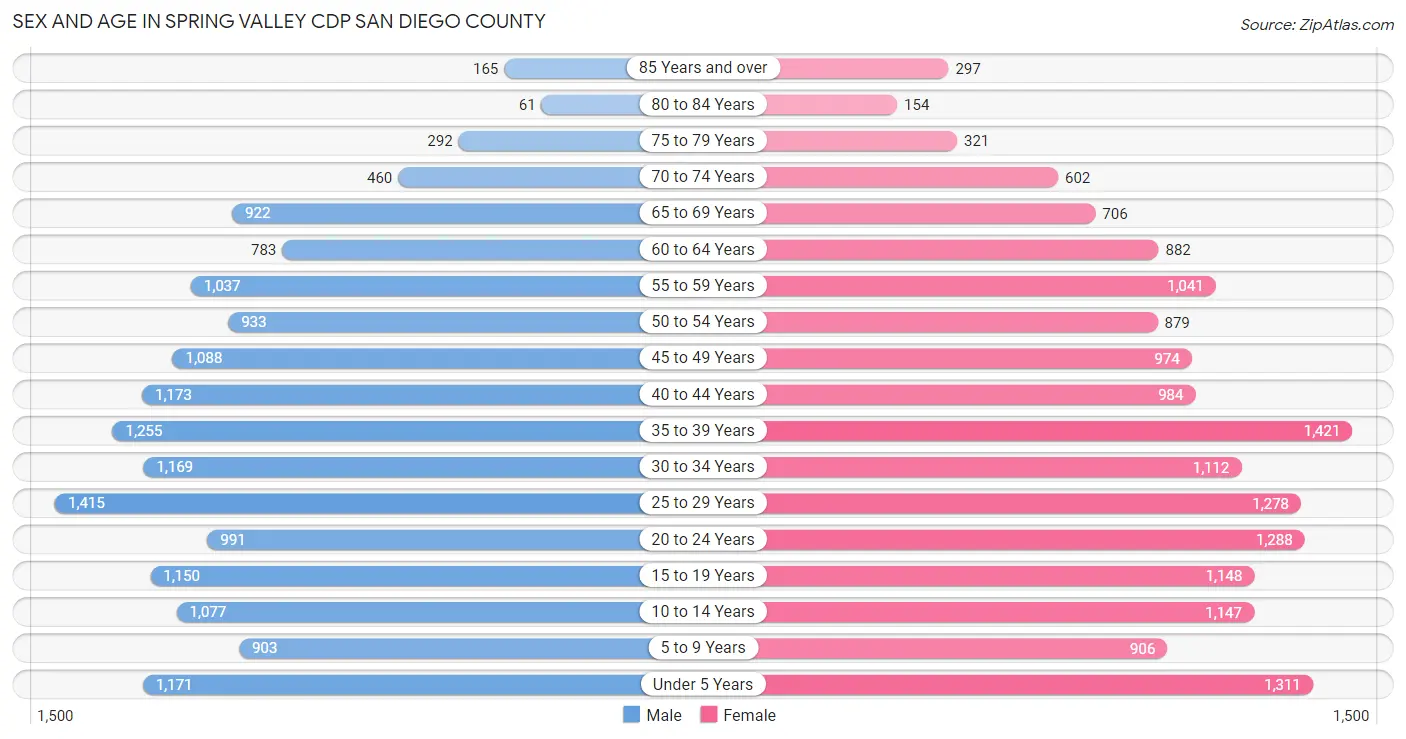
| Age Bracket | Male | Female |
| Under 5 Years | 1,171 (7.3%) | 1,311 (8.0%) |
| 5 to 9 Years | 903 (5.6%) | 906 (5.5%) |
| 10 to 14 Years | 1,077 (6.7%) | 1,147 (7.0%) |
| 15 to 19 Years | 1,150 (7.2%) | 1,148 (7.0%) |
| 20 to 24 Years | 991 (6.2%) | 1,288 (7.8%) |
| 25 to 29 Years | 1,415 (8.8%) | 1,278 (7.8%) |
| 30 to 34 Years | 1,169 (7.3%) | 1,112 (6.8%) |
| 35 to 39 Years | 1,255 (7.8%) | 1,421 (8.6%) |
| 40 to 44 Years | 1,173 (7.3%) | 984 (6.0%) |
| 45 to 49 Years | 1,088 (6.8%) | 974 (5.9%) |
| 50 to 54 Years | 933 (5.8%) | 879 (5.3%) |
| 55 to 59 Years | 1,037 (6.5%) | 1,041 (6.3%) |
| 60 to 64 Years | 783 (4.9%) | 882 (5.4%) |
| 65 to 69 Years | 922 (5.8%) | 706 (4.3%) |
| 70 to 74 Years | 460 (2.9%) | 602 (3.7%) |
| 75 to 79 Years | 292 (1.8%) | 321 (1.9%) |
| 80 to 84 Years | 61 (0.4%) | 154 (0.9%) |
| 85 Years and over | 165 (1.0%) | 297 (1.8%) |
| Total | 16,045 (100.0%) | 16,451 (100.0%) |
Families and Households in Spring Valley CDP San Diego County
Median Family Size in Spring Valley CDP San Diego County
The median family size in Spring Valley CDP San Diego County is 3.59 persons per family, with single female/mother families (1,202 | 15.5%) accounting for the largest median family size of 3.72 persons per family. On the other hand, single male/father families (933 | 12.0%) represent the smallest median family size with 3.38 persons per family.
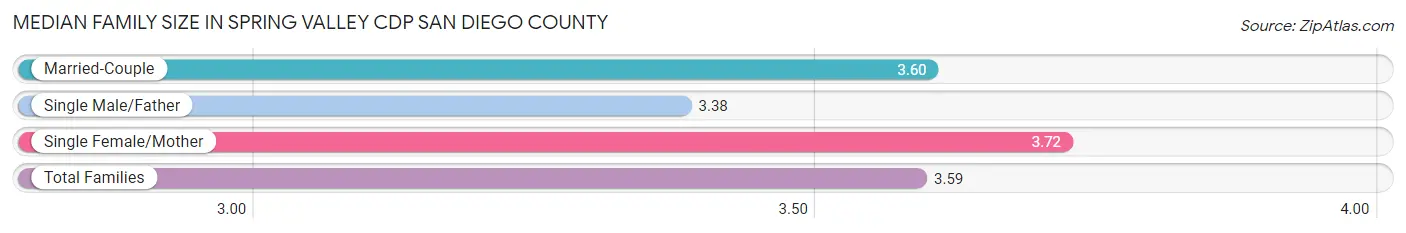
| Family Type | # Families | Family Size |
| Married-Couple | 5,624 (72.5%) | 3.60 |
| Single Male/Father | 933 (12.0%) | 3.38 |
| Single Female/Mother | 1,202 (15.5%) | 3.72 |
| Total Families | 7,759 (100.0%) | 3.59 |
Median Household Size in Spring Valley CDP San Diego County
The median household size in Spring Valley CDP San Diego County is 3.29 persons per household, with single female/mother households (1,202 | 12.2%) accounting for the largest median household size of 4.1 persons per household. non-family households (2,059 | 21.0%) represent the smallest median household size with 1.57 persons per household.
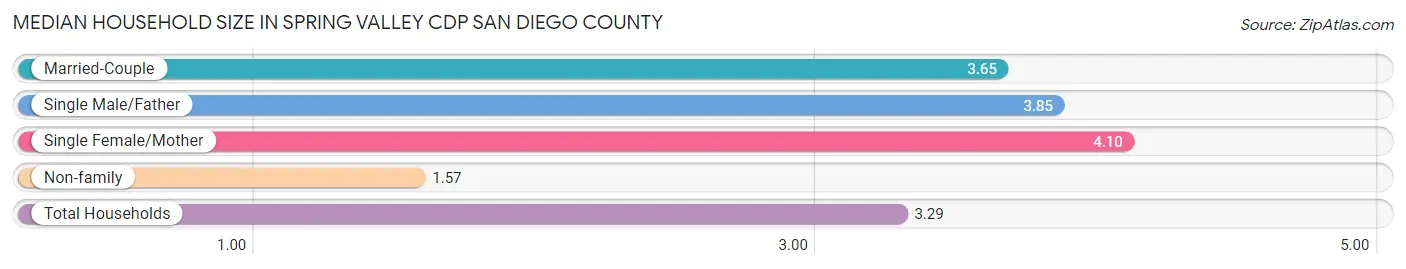
| Household Type | # Households | Household Size |
| Married-Couple | 5,624 (57.3%) | 3.65 |
| Single Male/Father | 933 (9.5%) | 3.85 |
| Single Female/Mother | 1,202 (12.2%) | 4.10 |
| Non-family | 2,059 (21.0%) | 1.57 |
| Total Households | 9,818 (100.0%) | 3.29 |
Household Size by Marriage Status in Spring Valley CDP San Diego County
Out of a total of 9,818 households in Spring Valley CDP San Diego County, 7,759 (79.0%) are family households, while 2,059 (21.0%) are nonfamily households. The most numerous type of family households are 2-person households, comprising 2,471, and the most common type of nonfamily households are 1-person households, comprising 1,263.
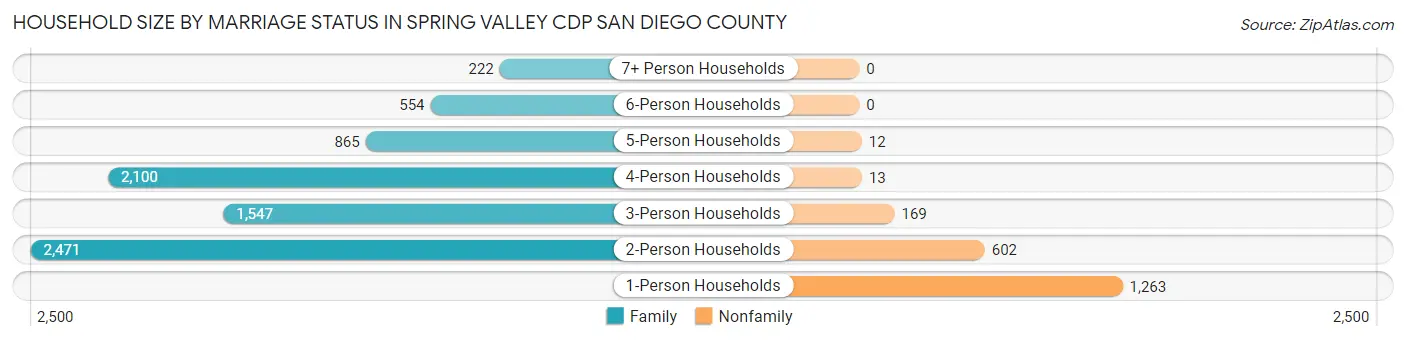
| Household Size | Family Households | Nonfamily Households |
| 1-Person Households | - | 1,263 (12.9%) |
| 2-Person Households | 2,471 (25.2%) | 602 (6.1%) |
| 3-Person Households | 1,547 (15.8%) | 169 (1.7%) |
| 4-Person Households | 2,100 (21.4%) | 13 (0.1%) |
| 5-Person Households | 865 (8.8%) | 12 (0.1%) |
| 6-Person Households | 554 (5.6%) | 0 (0.0%) |
| 7+ Person Households | 222 (2.3%) | 0 (0.0%) |
| Total | 7,759 (79.0%) | 2,059 (21.0%) |
Female Fertility in Spring Valley CDP San Diego County
Fertility by Age in Spring Valley CDP San Diego County
Average fertility rate in Spring Valley CDP San Diego County is 59.0 births per 1,000 women. Women in the age bracket of 20 to 34 years have the highest fertility rate with 73.0 births per 1,000 women. Women in the age bracket of 20 to 34 years acount for 54.2% of all women with births.
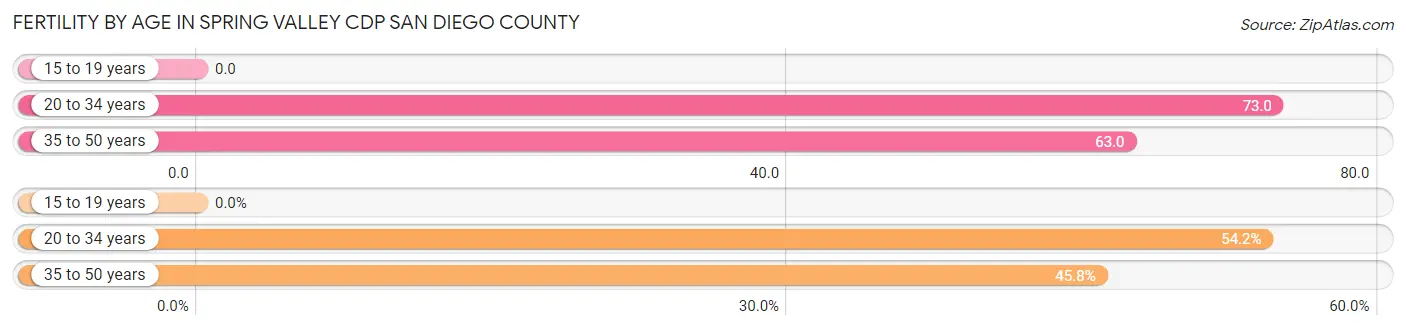
| Age Bracket | Women with Births | Births / 1,000 Women |
| 15 to 19 years | 0 (0.0%) | 0.0 |
| 20 to 34 years | 270 (54.2%) | 73.0 |
| 35 to 50 years | 228 (45.8%) | 63.0 |
| Total | 498 (100.0%) | 59.0 |
Fertility by Age by Marriage Status in Spring Valley CDP San Diego County
67.3% of women with births (498) in Spring Valley CDP San Diego County are married. The highest percentage of unmarried women with births falls into 35 to 50 years age bracket with 40.4% of them unmarried at the time of birth, while the lowest percentage of unmarried women with births belong to 20 to 34 years age bracket with 26.3% of them unmarried.
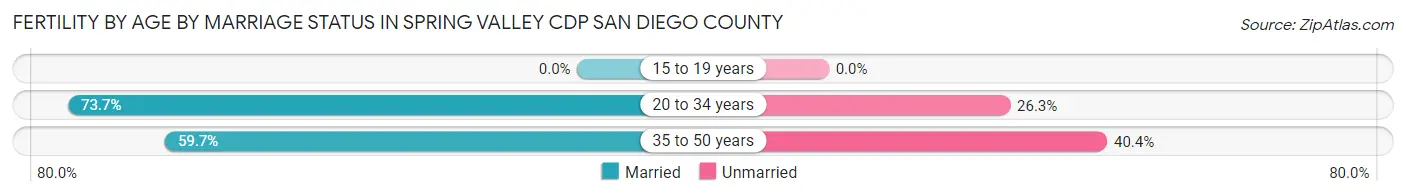
| Age Bracket | Married | Unmarried |
| 15 to 19 years | 0 (0.0%) | 0 (0.0%) |
| 20 to 34 years | 199 (73.7%) | 71 (26.3%) |
| 35 to 50 years | 136 (59.7%) | 92 (40.4%) |
| Total | 335 (67.3%) | 163 (32.7%) |
Fertility by Education in Spring Valley CDP San Diego County
Average fertility rate in Spring Valley CDP San Diego County is 59.0 births per 1,000 women. Women with the education attainment of bachelor's degree have the highest fertility rate of 142.0 births per 1,000 women, while women with the education attainment of college or associate's degree have the lowest fertility at 25.0 births per 1,000 women. Women with the education attainment of bachelor's degree represent 36.5% of all women with births.
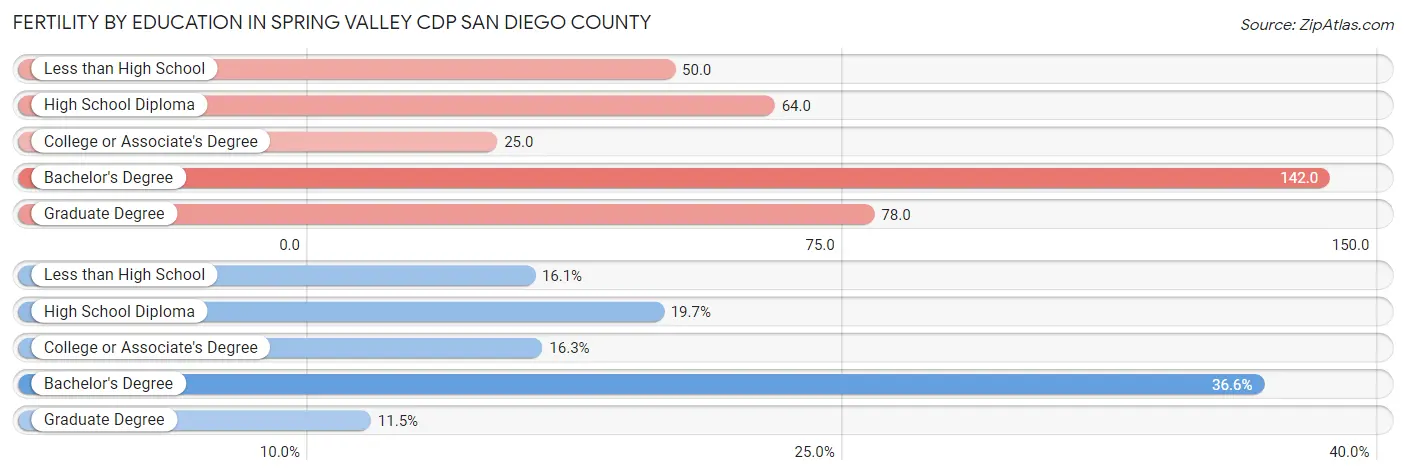
| Educational Attainment | Women with Births | Births / 1,000 Women |
| Less than High School | 80 (16.1%) | 50.0 |
| High School Diploma | 98 (19.7%) | 64.0 |
| College or Associate's Degree | 81 (16.3%) | 25.0 |
| Bachelor's Degree | 182 (36.5%) | 142.0 |
| Graduate Degree | 57 (11.5%) | 78.0 |
| Total | 498 (100.0%) | 59.0 |
Fertility by Education by Marriage Status in Spring Valley CDP San Diego County
32.7% of women with births in Spring Valley CDP San Diego County are unmarried. Women with the educational attainment of less than high school are most likely to be married with 100.0% of them married at childbirth, while women with the educational attainment of college or associate's degree are least likely to be married with 80.2% of them unmarried at childbirth.
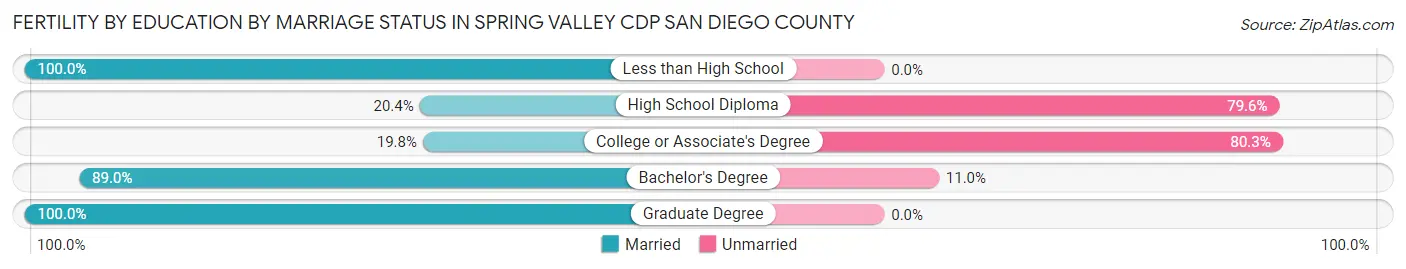
| Educational Attainment | Married | Unmarried |
| Less than High School | 80 (100.0%) | 0 (0.0%) |
| High School Diploma | 20 (20.4%) | 78 (79.6%) |
| College or Associate's Degree | 16 (19.8%) | 65 (80.2%) |
| Bachelor's Degree | 162 (89.0%) | 20 (11.0%) |
| Graduate Degree | 57 (100.0%) | 0 (0.0%) |
| Total | 335 (67.3%) | 163 (32.7%) |
Employment Characteristics in Spring Valley CDP San Diego County
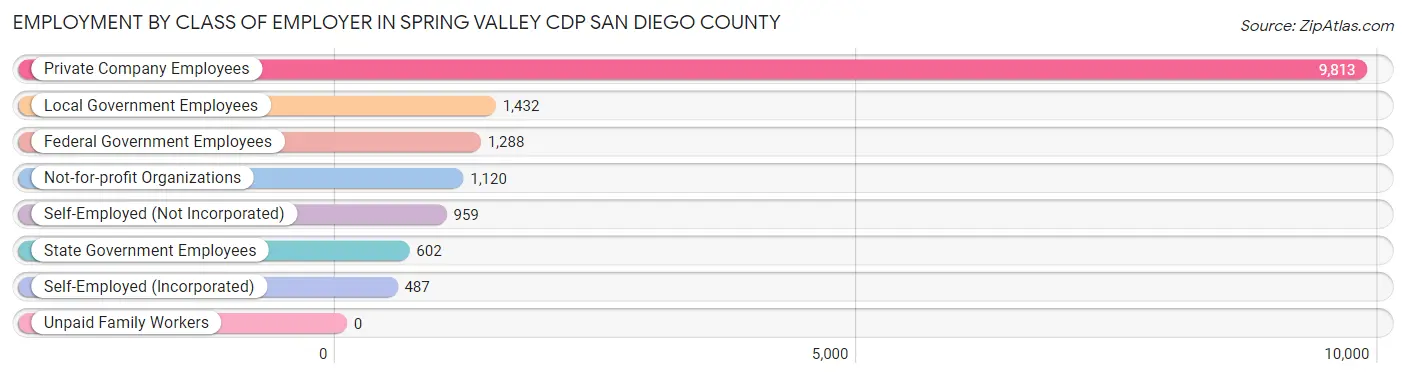
Employment by Class of Employer in Spring Valley CDP San Diego County
Among the 15,701 employed individuals in Spring Valley CDP San Diego County, private company employees (9,813 | 62.5%), local government employees (1,432 | 9.1%), and federal government employees (1,288 | 8.2%) make up the most common classes of employment.
| Employer Class | # Employees | % Employees |
| Private Company Employees | 9,813 | 62.5% |
| Self-Employed (Incorporated) | 487 | 3.1% |
| Self-Employed (Not Incorporated) | 959 | 6.1% |
| Not-for-profit Organizations | 1,120 | 7.1% |
| Local Government Employees | 1,432 | 9.1% |
| State Government Employees | 602 | 3.8% |
| Federal Government Employees | 1,288 | 8.2% |
| Unpaid Family Workers | 0 | 0.0% |
| Total | 15,701 | 100.0% |
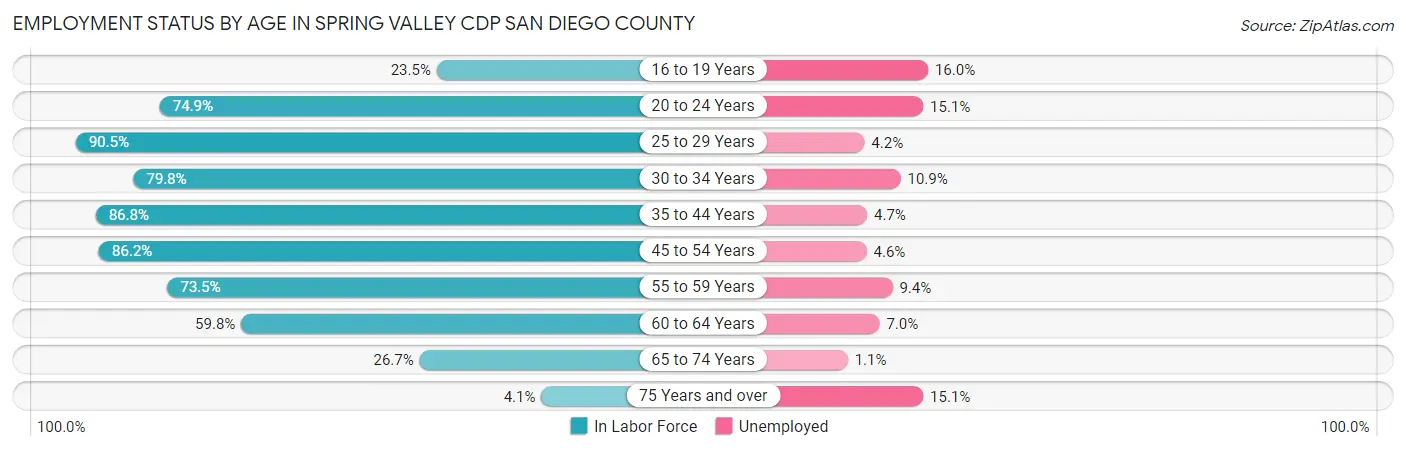
Employment Status by Age in Spring Valley CDP San Diego County
According to the labor force statistics for Spring Valley CDP San Diego County, out of the total population over 16 years of age (25,574), 67.4% or 17,237 individuals are in the labor force, with 7.1% or 1,224 of them unemployed. The age group with the highest labor force participation rate is 25 to 29 years, with 90.5% or 2,437 individuals in the labor force. Within the labor force, the 16 to 19 years age range has the highest percentage of unemployed individuals, with 16.0% or 71 of them being unemployed.
| Age Bracket | In Labor Force | Unemployed |
| 16 to 19 Years | 444 (23.5%) | 71 (16.0%) |
| 20 to 24 Years | 1,707 (74.9%) | 258 (15.1%) |
| 25 to 29 Years | 2,437 (90.5%) | 102 (4.2%) |
| 30 to 34 Years | 1,820 (79.8%) | 198 (10.9%) |
| 35 to 44 Years | 4,195 (86.8%) | 197 (4.7%) |
| 45 to 54 Years | 3,339 (86.2%) | 154 (4.6%) |
| 55 to 59 Years | 1,527 (73.5%) | 144 (9.4%) |
| 60 to 64 Years | 996 (59.8%) | 70 (7.0%) |
| 65 to 74 Years | 718 (26.7%) | 8 (1.1%) |
| 75 Years and over | 53 (4.1%) | 8 (15.1%) |
| Total | 17,237 (67.4%) | 1,224 (7.1%) |
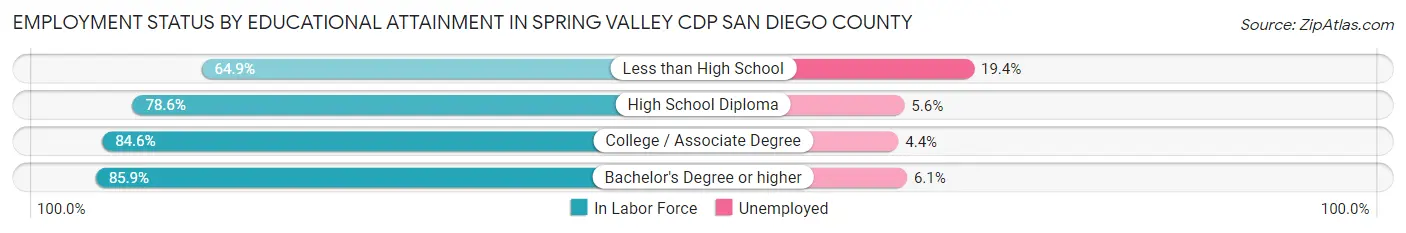
Employment Status by Educational Attainment in Spring Valley CDP San Diego County
According to labor force statistics for Spring Valley CDP San Diego County, 82.2% of individuals (14,323) out of the total population between 25 and 64 years of age (17,424) are in the labor force, with 6.1% or 874 of them being unemployed. The group with the highest labor force participation rate are those with the educational attainment of bachelor's degree or higher, with 85.9% or 4,156 individuals in the labor force. Within the labor force, individuals with less than high school education have the highest percentage of unemployment, with 19.4% or 176 of them being unemployed.
| Educational Attainment | In Labor Force | Unemployed |
| Less than High School | 905 (64.9%) | 270 (19.4%) |
| High School Diploma | 2,738 (78.6%) | 195 (5.6%) |
| College / Associate Degree | 6,521 (84.6%) | 339 (4.4%) |
| Bachelor's Degree or higher | 4,156 (85.9%) | 295 (6.1%) |
| Total | 14,323 (82.2%) | 1,063 (6.1%) |
Employment Occupations by Sex in Spring Valley CDP San Diego County
Management, Business, Science and Arts Occupations
The most common Management, Business, Science and Arts occupations in Spring Valley CDP San Diego County are Community & Social Service (1,532 | 9.9%), Management (1,120 | 7.2%), Health Diagnosing & Treating (894 | 5.8%), Computers, Engineering & Science (856 | 5.5%), and Education Instruction & Library (699 | 4.5%).
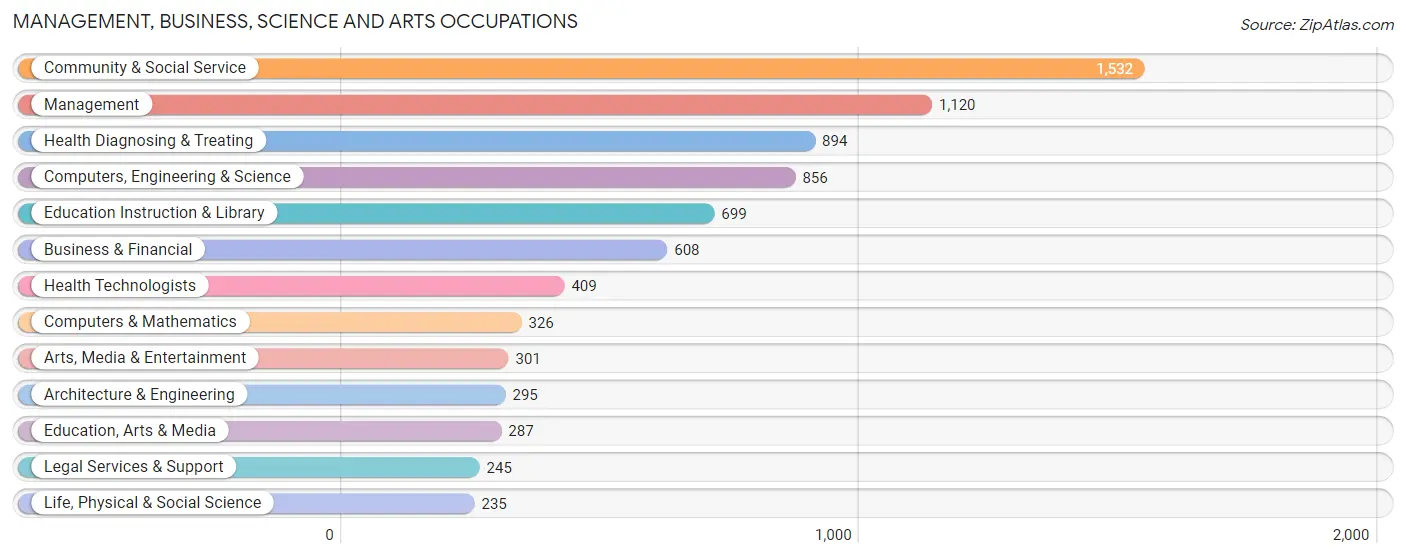
Management, Business, Science and Arts Occupations by Sex
Within the Management, Business, Science and Arts occupations in Spring Valley CDP San Diego County, the most male-oriented occupations are Architecture & Engineering (94.6%), Computers, Engineering & Science (74.3%), and Computers & Mathematics (68.4%), while the most female-oriented occupations are Health Diagnosing & Treating (84.1%), Arts, Media & Entertainment (79.7%), and Education Instruction & Library (75.5%).
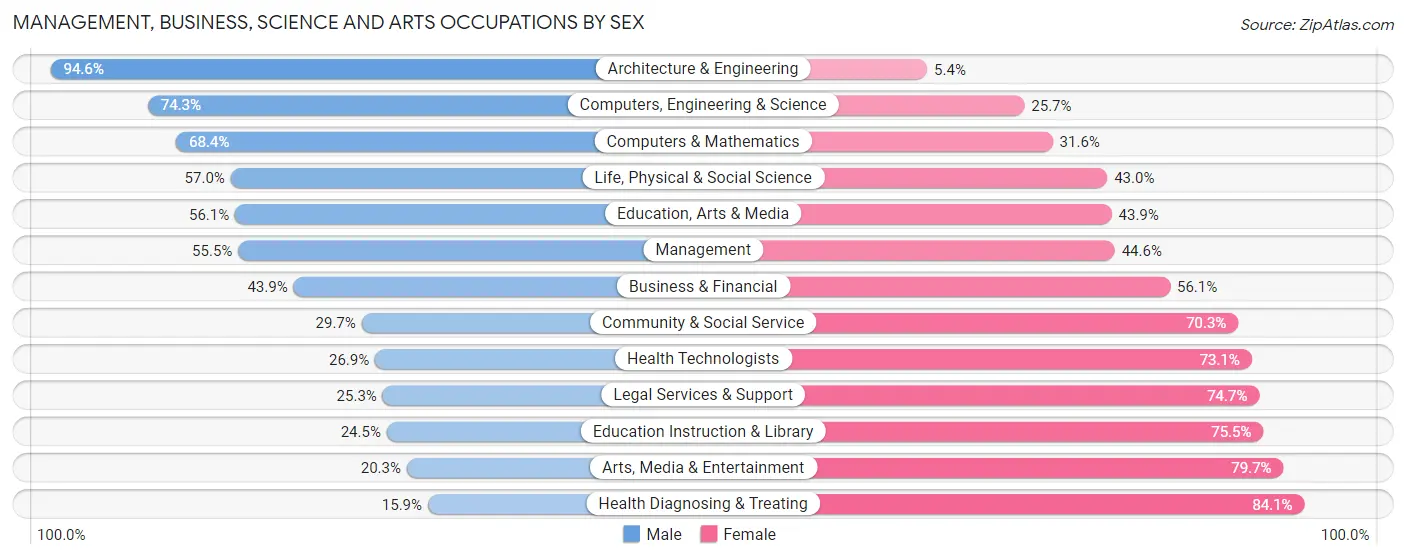
| Occupation | Male | Female |
| Management | 621 (55.4%) | 499 (44.6%) |
| Business & Financial | 267 (43.9%) | 341 (56.1%) |
| Computers, Engineering & Science | 636 (74.3%) | 220 (25.7%) |
| Computers & Mathematics | 223 (68.4%) | 103 (31.6%) |
| Architecture & Engineering | 279 (94.6%) | 16 (5.4%) |
| Life, Physical & Social Science | 134 (57.0%) | 101 (43.0%) |
| Community & Social Service | 455 (29.7%) | 1,077 (70.3%) |
| Education, Arts & Media | 161 (56.1%) | 126 (43.9%) |
| Legal Services & Support | 62 (25.3%) | 183 (74.7%) |
| Education Instruction & Library | 171 (24.5%) | 528 (75.5%) |
| Arts, Media & Entertainment | 61 (20.3%) | 240 (79.7%) |
| Health Diagnosing & Treating | 142 (15.9%) | 752 (84.1%) |
| Health Technologists | 110 (26.9%) | 299 (73.1%) |
| Total (Category) | 2,121 (42.3%) | 2,889 (57.7%) |
| Total (Overall) | 8,607 (55.4%) | 6,930 (44.6%) |
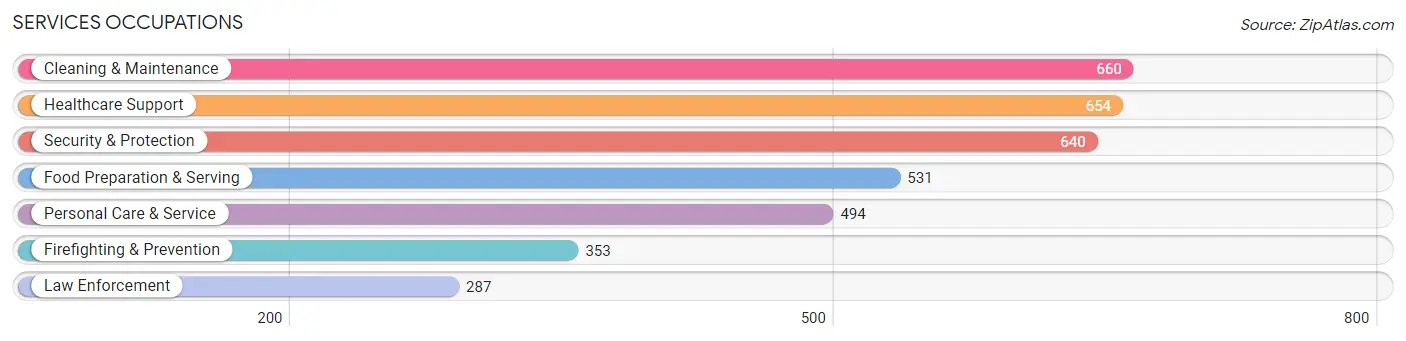
Services Occupations
The most common Services occupations in Spring Valley CDP San Diego County are Cleaning & Maintenance (660 | 4.3%), Healthcare Support (654 | 4.2%), Security & Protection (640 | 4.1%), Food Preparation & Serving (531 | 3.4%), and Personal Care & Service (494 | 3.2%).
Services Occupations by Sex
Within the Services occupations in Spring Valley CDP San Diego County, the most male-oriented occupations are Law Enforcement (80.5%), Security & Protection (69.2%), and Firefighting & Prevention (60.1%), while the most female-oriented occupations are Healthcare Support (69.3%), Personal Care & Service (69.2%), and Food Preparation & Serving (51.4%).
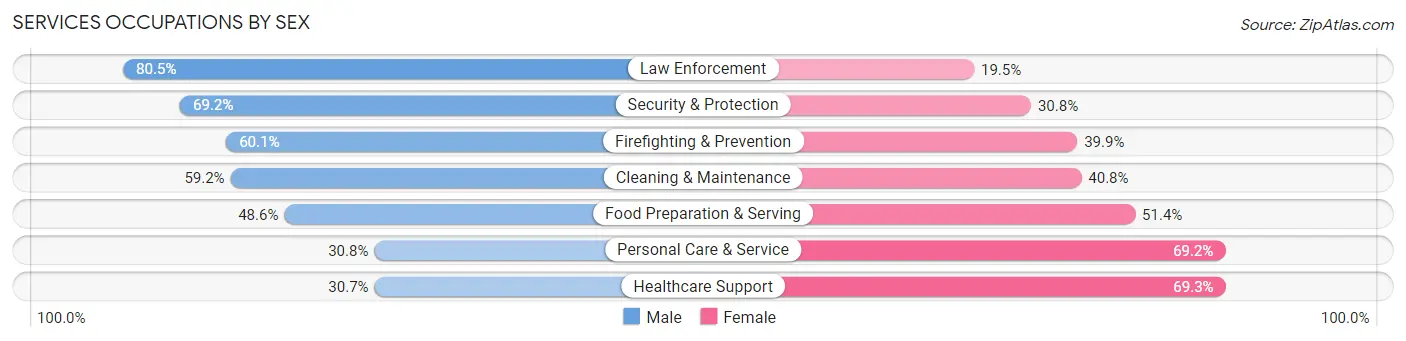
| Occupation | Male | Female |
| Healthcare Support | 201 (30.7%) | 453 (69.3%) |
| Security & Protection | 443 (69.2%) | 197 (30.8%) |
| Firefighting & Prevention | 212 (60.1%) | 141 (39.9%) |
| Law Enforcement | 231 (80.5%) | 56 (19.5%) |
| Food Preparation & Serving | 258 (48.6%) | 273 (51.4%) |
| Cleaning & Maintenance | 391 (59.2%) | 269 (40.8%) |
| Personal Care & Service | 152 (30.8%) | 342 (69.2%) |
| Total (Category) | 1,445 (48.5%) | 1,534 (51.5%) |
| Total (Overall) | 8,607 (55.4%) | 6,930 (44.6%) |
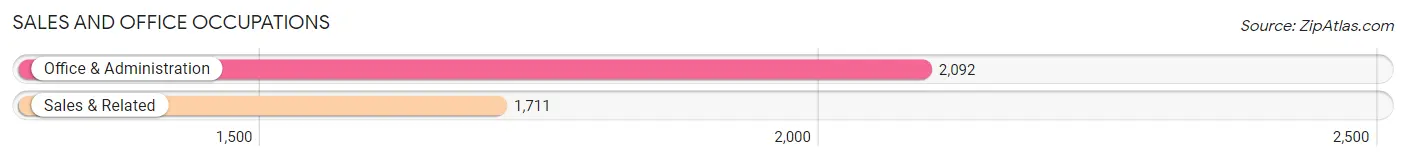
Sales and Office Occupations
The most common Sales and Office occupations in Spring Valley CDP San Diego County are Office & Administration (2,092 | 13.5%), and Sales & Related (1,711 | 11.0%).
Sales and Office Occupations by Sex
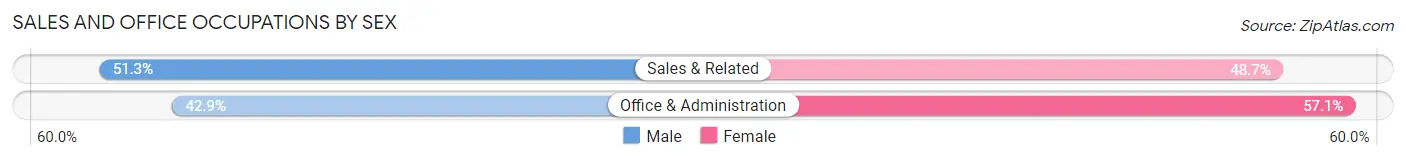
| Occupation | Male | Female |
| Sales & Related | 878 (51.3%) | 833 (48.7%) |
| Office & Administration | 898 (42.9%) | 1,194 (57.1%) |
| Total (Category) | 1,776 (46.7%) | 2,027 (53.3%) |
| Total (Overall) | 8,607 (55.4%) | 6,930 (44.6%) |
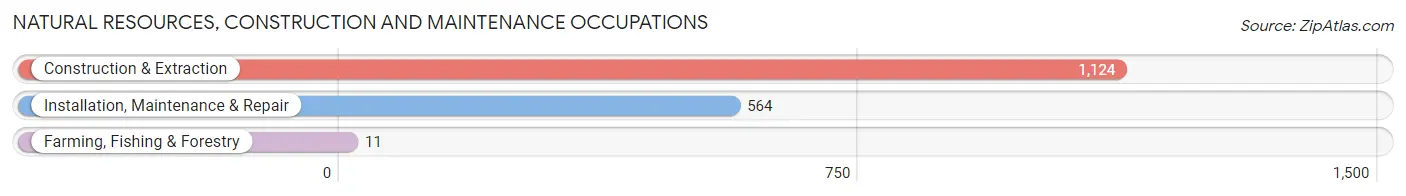
Natural Resources, Construction and Maintenance Occupations
The most common Natural Resources, Construction and Maintenance occupations in Spring Valley CDP San Diego County are Construction & Extraction (1,124 | 7.2%), Installation, Maintenance & Repair (564 | 3.6%), and Farming, Fishing & Forestry (11 | 0.1%).
Natural Resources, Construction and Maintenance Occupations by Sex
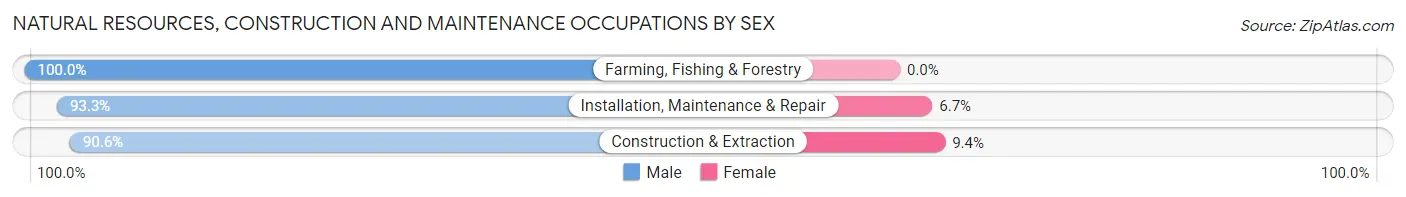
| Occupation | Male | Female |
| Farming, Fishing & Forestry | 11 (100.0%) | 0 (0.0%) |
| Construction & Extraction | 1,018 (90.6%) | 106 (9.4%) |
| Installation, Maintenance & Repair | 526 (93.3%) | 38 (6.7%) |
| Total (Category) | 1,555 (91.5%) | 144 (8.5%) |
| Total (Overall) | 8,607 (55.4%) | 6,930 (44.6%) |
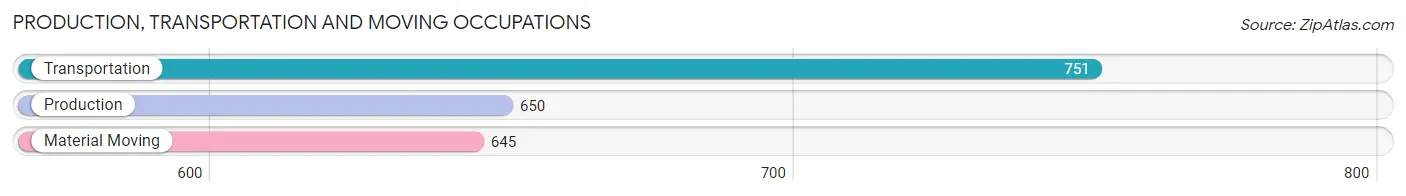
Production, Transportation and Moving Occupations
The most common Production, Transportation and Moving occupations in Spring Valley CDP San Diego County are Transportation (751 | 4.8%), Production (650 | 4.2%), and Material Moving (645 | 4.2%).
Production, Transportation and Moving Occupations by Sex
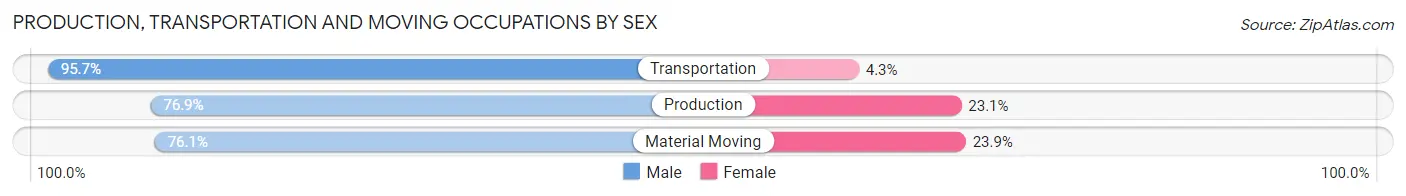
| Occupation | Male | Female |
| Production | 500 (76.9%) | 150 (23.1%) |
| Transportation | 719 (95.7%) | 32 (4.3%) |
| Material Moving | 491 (76.1%) | 154 (23.9%) |
| Total (Category) | 1,710 (83.6%) | 336 (16.4%) |
| Total (Overall) | 8,607 (55.4%) | 6,930 (44.6%) |
Employment Industries by Sex in Spring Valley CDP San Diego County
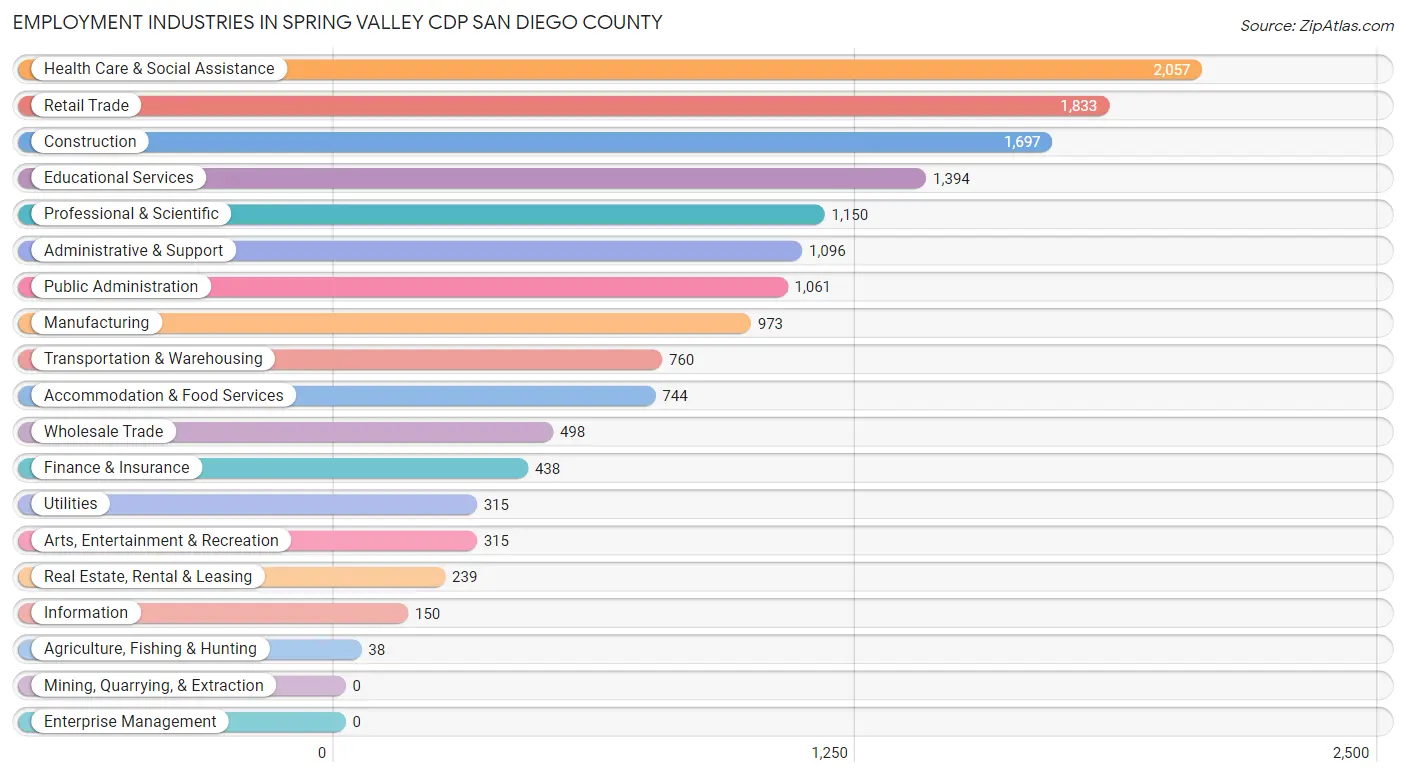
Employment Industries in Spring Valley CDP San Diego County
The major employment industries in Spring Valley CDP San Diego County include Health Care & Social Assistance (2,057 | 13.2%), Retail Trade (1,833 | 11.8%), Construction (1,697 | 10.9%), Educational Services (1,394 | 9.0%), and Professional & Scientific (1,150 | 7.4%).
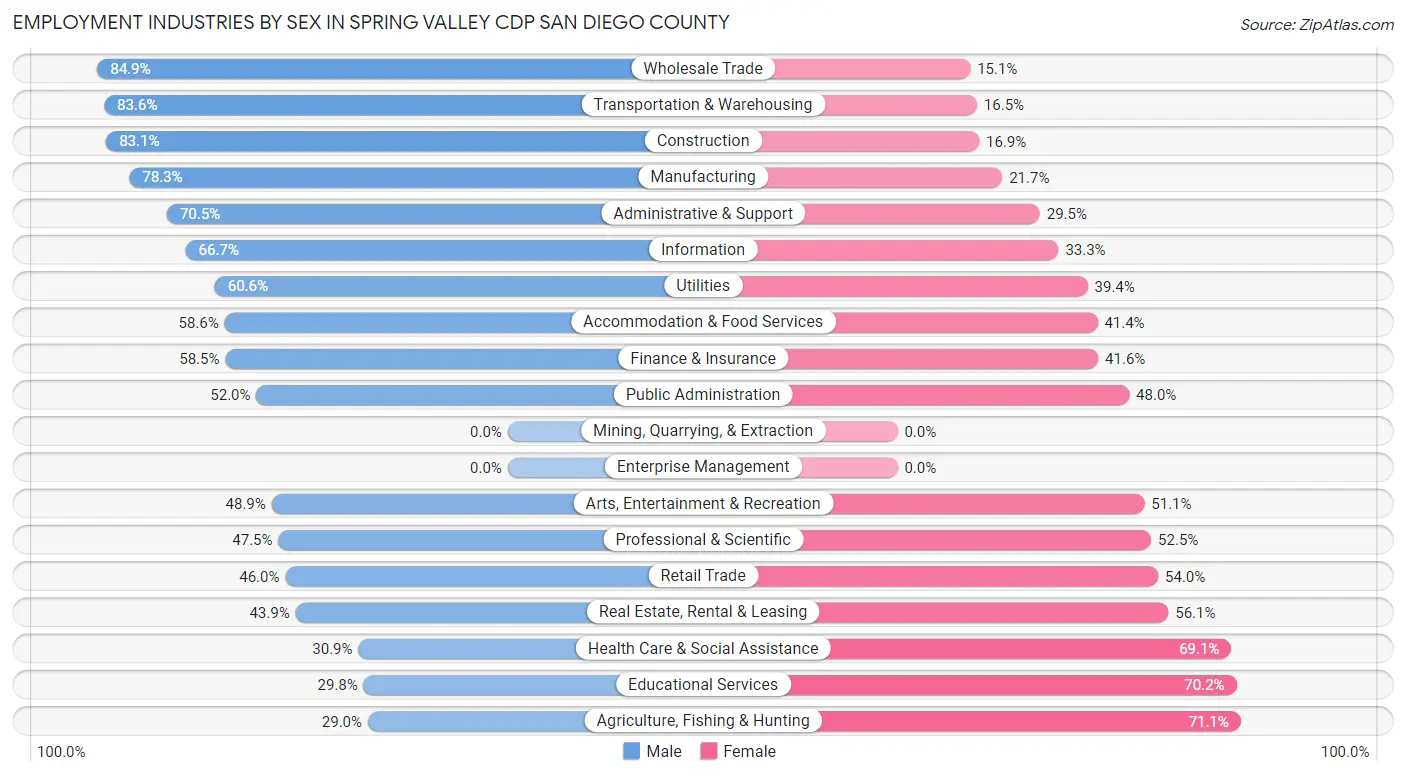
Employment Industries by Sex in Spring Valley CDP San Diego County
The Spring Valley CDP San Diego County industries that see more men than women are Wholesale Trade (84.9%), Transportation & Warehousing (83.6%), and Construction (83.1%), whereas the industries that tend to have a higher number of women are Agriculture, Fishing & Hunting (71.1%), Educational Services (70.2%), and Health Care & Social Assistance (69.1%).
| Industry | Male | Female |
| Agriculture, Fishing & Hunting | 11 (28.9%) | 27 (71.1%) |
| Mining, Quarrying, & Extraction | 0 (0.0%) | 0 (0.0%) |
| Construction | 1,410 (83.1%) | 287 (16.9%) |
| Manufacturing | 762 (78.3%) | 211 (21.7%) |
| Wholesale Trade | 423 (84.9%) | 75 (15.1%) |
| Retail Trade | 844 (46.0%) | 989 (54.0%) |
| Transportation & Warehousing | 635 (83.6%) | 125 (16.5%) |
| Utilities | 191 (60.6%) | 124 (39.4%) |
| Information | 100 (66.7%) | 50 (33.3%) |
| Finance & Insurance | 256 (58.5%) | 182 (41.5%) |
| Real Estate, Rental & Leasing | 105 (43.9%) | 134 (56.1%) |
| Professional & Scientific | 546 (47.5%) | 604 (52.5%) |
| Enterprise Management | 0 (0.0%) | 0 (0.0%) |
| Administrative & Support | 773 (70.5%) | 323 (29.5%) |
| Educational Services | 416 (29.8%) | 978 (70.2%) |
| Health Care & Social Assistance | 636 (30.9%) | 1,421 (69.1%) |
| Arts, Entertainment & Recreation | 154 (48.9%) | 161 (51.1%) |
| Accommodation & Food Services | 436 (58.6%) | 308 (41.4%) |
| Public Administration | 552 (52.0%) | 509 (48.0%) |
| Total | 8,607 (55.4%) | 6,930 (44.6%) |
Education in Spring Valley CDP San Diego County
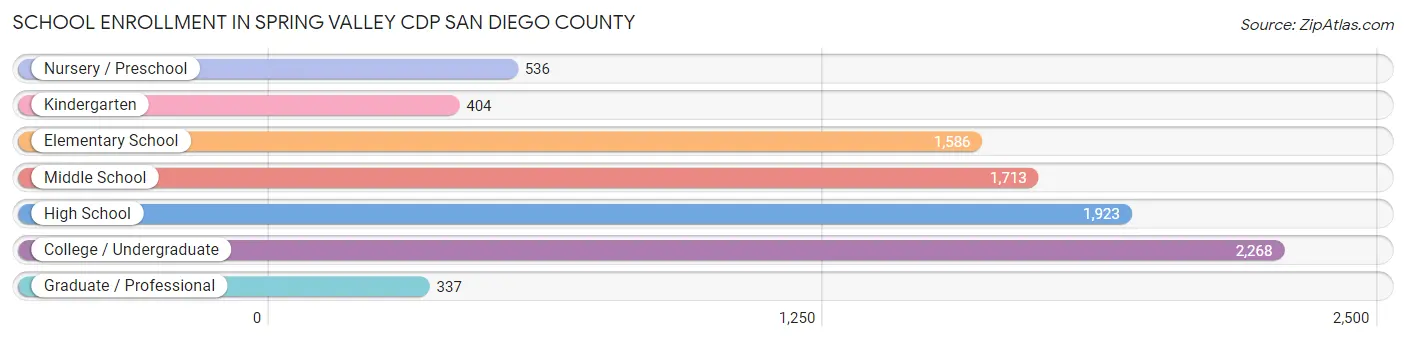
School Enrollment in Spring Valley CDP San Diego County
The most common levels of schooling among the 8,767 students in Spring Valley CDP San Diego County are college / undergraduate (2,268 | 25.9%), high school (1,923 | 21.9%), and middle school (1,713 | 19.5%).
| School Level | # Students | % Students |
| Nursery / Preschool | 536 | 6.1% |
| Kindergarten | 404 | 4.6% |
| Elementary School | 1,586 | 18.1% |
| Middle School | 1,713 | 19.5% |
| High School | 1,923 | 21.9% |
| College / Undergraduate | 2,268 | 25.9% |
| Graduate / Professional | 337 | 3.8% |
| Total | 8,767 | 100.0% |
School Enrollment by Age by Funding Source in Spring Valley CDP San Diego County
Out of a total of 8,767 students who are enrolled in schools in Spring Valley CDP San Diego County, 1,376 (15.7%) attend a private institution, while the remaining 7,391 (84.3%) are enrolled in public schools. The age group of 35 years and over has the highest likelihood of being enrolled in private schools, with 176 (29.1% in the age bracket) enrolled. Conversely, the age group of 15 to 17 year olds has the lowest likelihood of being enrolled in a private school, with 1,373 (96.3% in the age bracket) attending a public institution.
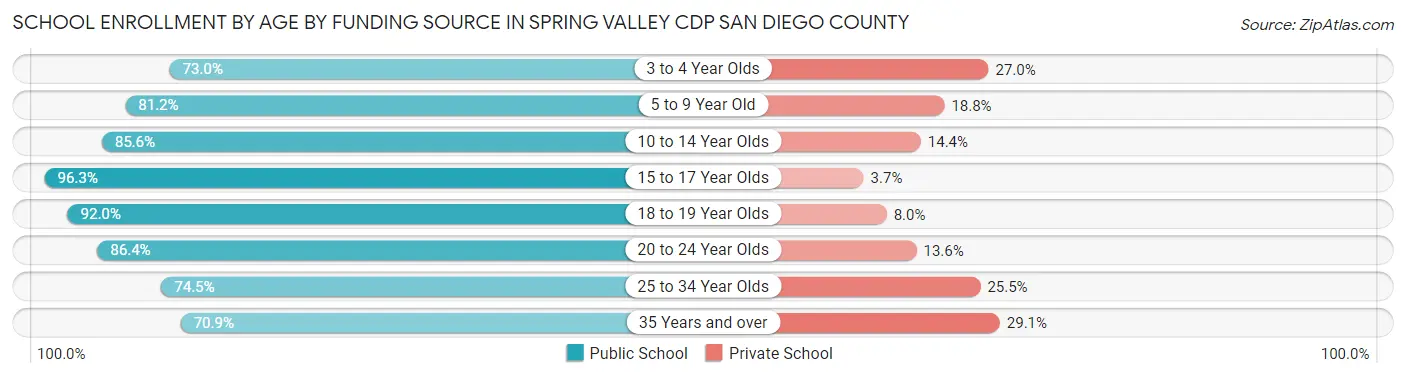
| Age Bracket | Public School | Private School |
| 3 to 4 Year Olds | 403 (73.0%) | 149 (27.0%) |
| 5 to 9 Year Old | 1,316 (81.2%) | 304 (18.8%) |
| 10 to 14 Year Olds | 1,876 (85.6%) | 315 (14.4%) |
| 15 to 17 Year Olds | 1,373 (96.3%) | 53 (3.7%) |
| 18 to 19 Year Olds | 654 (92.0%) | 57 (8.0%) |
| 20 to 24 Year Olds | 758 (86.4%) | 119 (13.6%) |
| 25 to 34 Year Olds | 585 (74.5%) | 200 (25.5%) |
| 35 Years and over | 429 (70.9%) | 176 (29.1%) |
| Total | 7,391 (84.3%) | 1,376 (15.7%) |
Educational Attainment by Field of Study in Spring Valley CDP San Diego County
Business (1,330 | 19.6%), engineering (682 | 10.1%), arts & humanities (599 | 8.8%), social sciences (539 | 8.0%), and education (512 | 7.5%) are the most common fields of study among 6,780 individuals in Spring Valley CDP San Diego County who have obtained a bachelor's degree or higher.
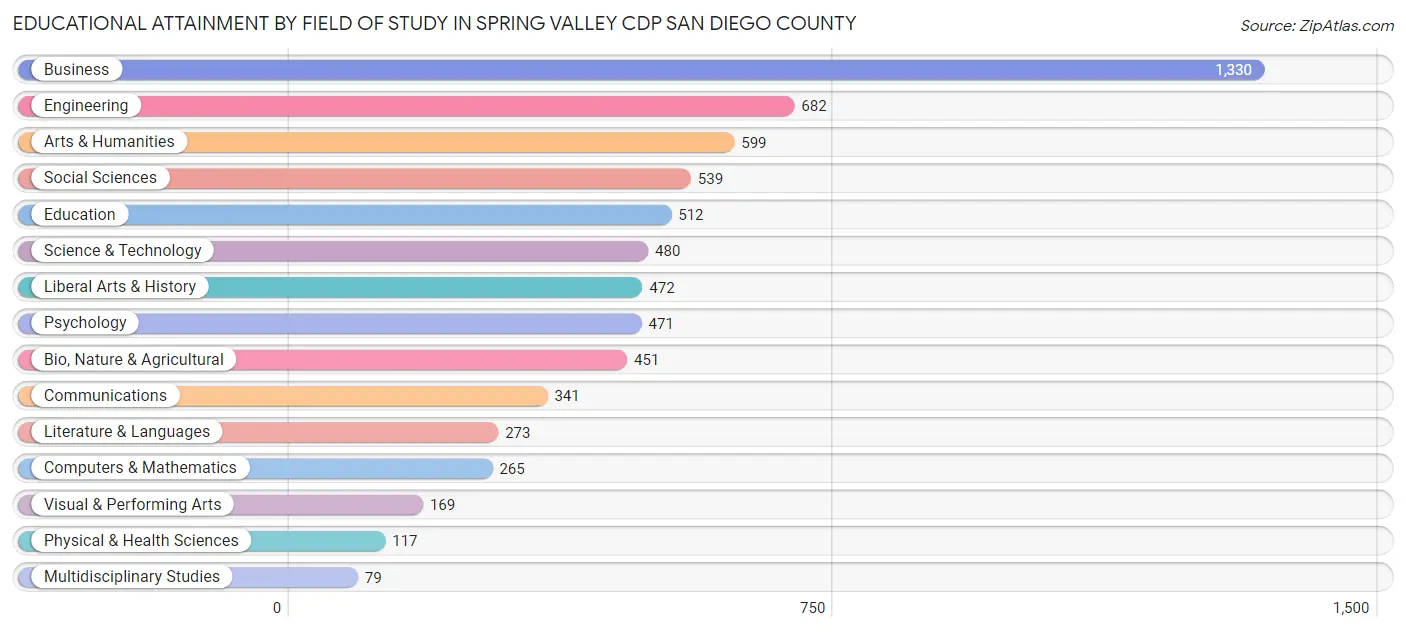
| Field of Study | # Graduates | % Graduates |
| Computers & Mathematics | 265 | 3.9% |
| Bio, Nature & Agricultural | 451 | 6.7% |
| Physical & Health Sciences | 117 | 1.7% |
| Psychology | 471 | 7.0% |
| Social Sciences | 539 | 8.0% |
| Engineering | 682 | 10.1% |
| Multidisciplinary Studies | 79 | 1.2% |
| Science & Technology | 480 | 7.1% |
| Business | 1,330 | 19.6% |
| Education | 512 | 7.5% |
| Literature & Languages | 273 | 4.0% |
| Liberal Arts & History | 472 | 7.0% |
| Visual & Performing Arts | 169 | 2.5% |
| Communications | 341 | 5.0% |
| Arts & Humanities | 599 | 8.8% |
| Total | 6,780 | 100.0% |
Transportation & Commute in Spring Valley CDP San Diego County
Vehicle Availability by Sex in Spring Valley CDP San Diego County
The most prevalent vehicle ownership categories in Spring Valley CDP San Diego County are males with 2 vehicles (3,622, accounting for 41.4%) and females with 2 vehicles (2,883, making up 52.2%).
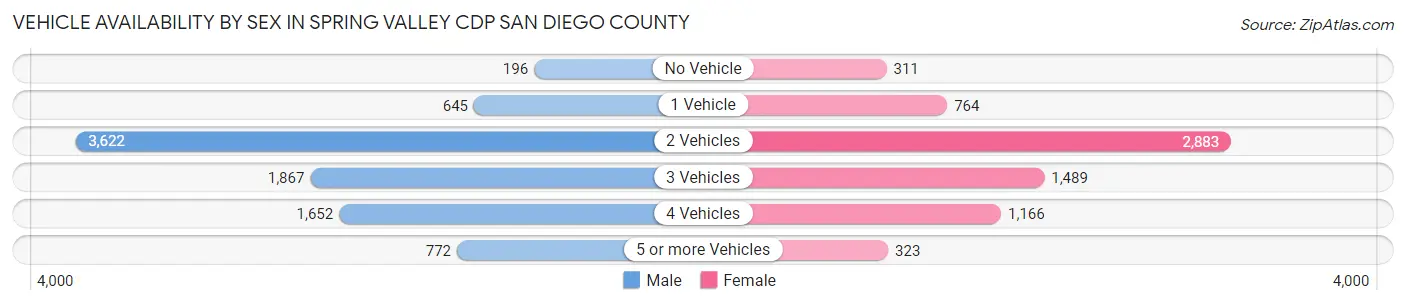
| Vehicles Available | Male | Female |
| No Vehicle | 196 (2.2%) | 311 (4.5%) |
| 1 Vehicle | 645 (7.4%) | 764 (11.0%) |
| 2 Vehicles | 3,622 (41.4%) | 2,883 (41.6%) |
| 3 Vehicles | 1,867 (21.3%) | 1,489 (21.5%) |
| 4 Vehicles | 1,652 (18.9%) | 1,166 (16.8%) |
| 5 or more Vehicles | 772 (8.8%) | 323 (4.7%) |
| Total | 8,754 (100.0%) | 6,936 (100.0%) |
Commute Time in Spring Valley CDP San Diego County
The most frequently occuring commute durations in Spring Valley CDP San Diego County are 20 to 24 minutes (3,178 commuters, 22.3%), 30 to 34 minutes (2,937 commuters, 20.6%), and 15 to 19 minutes (2,099 commuters, 14.7%).
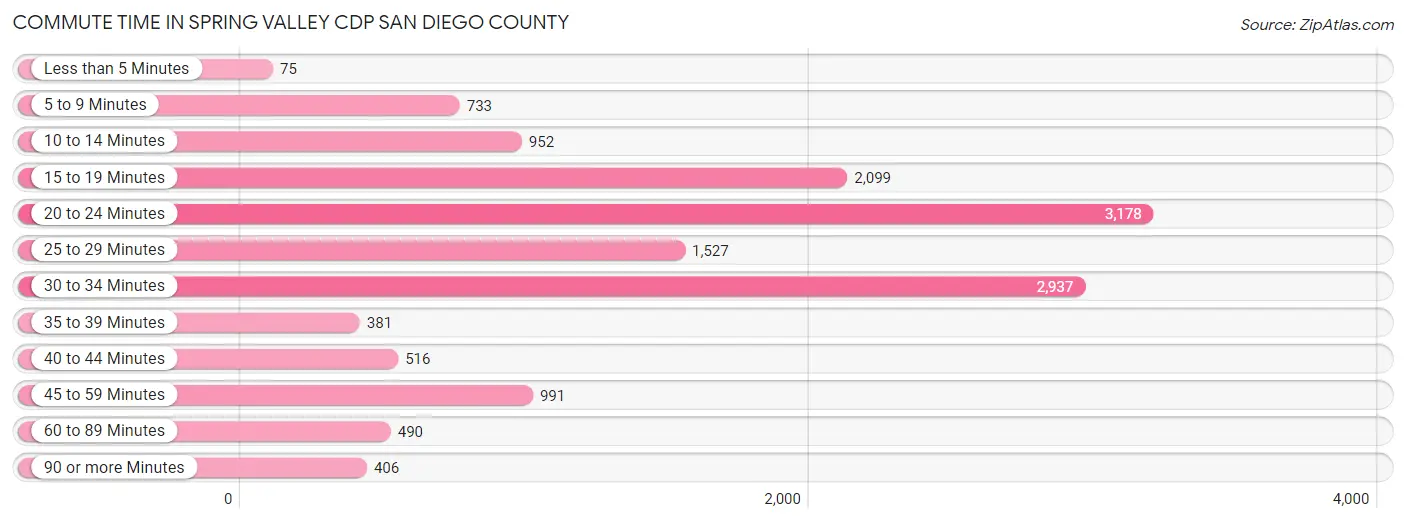
| Commute Time | # Commuters | % Commuters |
| Less than 5 Minutes | 75 | 0.5% |
| 5 to 9 Minutes | 733 | 5.1% |
| 10 to 14 Minutes | 952 | 6.7% |
| 15 to 19 Minutes | 2,099 | 14.7% |
| 20 to 24 Minutes | 3,178 | 22.3% |
| 25 to 29 Minutes | 1,527 | 10.7% |
| 30 to 34 Minutes | 2,937 | 20.6% |
| 35 to 39 Minutes | 381 | 2.7% |
| 40 to 44 Minutes | 516 | 3.6% |
| 45 to 59 Minutes | 991 | 6.9% |
| 60 to 89 Minutes | 490 | 3.4% |
| 90 or more Minutes | 406 | 2.8% |
Commute Time by Sex in Spring Valley CDP San Diego County
The most common commute times in Spring Valley CDP San Diego County are 20 to 24 minutes (1,841 commuters, 23.2%) for males and 20 to 24 minutes (1,337 commuters, 21.1%) for females.
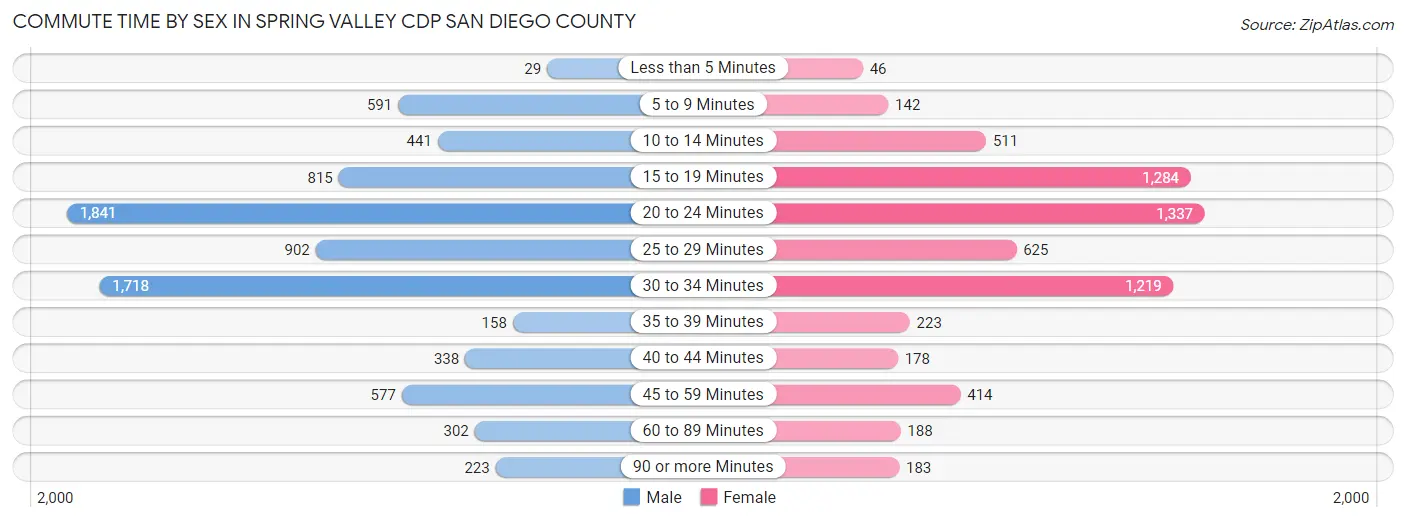
| Commute Time | Male | Female |
| Less than 5 Minutes | 29 (0.4%) | 46 (0.7%) |
| 5 to 9 Minutes | 591 (7.4%) | 142 (2.2%) |
| 10 to 14 Minutes | 441 (5.6%) | 511 (8.1%) |
| 15 to 19 Minutes | 815 (10.3%) | 1,284 (20.2%) |
| 20 to 24 Minutes | 1,841 (23.2%) | 1,337 (21.1%) |
| 25 to 29 Minutes | 902 (11.4%) | 625 (9.8%) |
| 30 to 34 Minutes | 1,718 (21.6%) | 1,219 (19.2%) |
| 35 to 39 Minutes | 158 (2.0%) | 223 (3.5%) |
| 40 to 44 Minutes | 338 (4.3%) | 178 (2.8%) |
| 45 to 59 Minutes | 577 (7.3%) | 414 (6.5%) |
| 60 to 89 Minutes | 302 (3.8%) | 188 (3.0%) |
| 90 or more Minutes | 223 (2.8%) | 183 (2.9%) |
Time of Departure to Work by Sex in Spring Valley CDP San Diego County
The most frequent times of departure to work in Spring Valley CDP San Diego County are 8:00 AM to 8:29 AM (929, 11.7%) for males and 7:00 AM to 7:29 AM (919, 14.5%) for females.
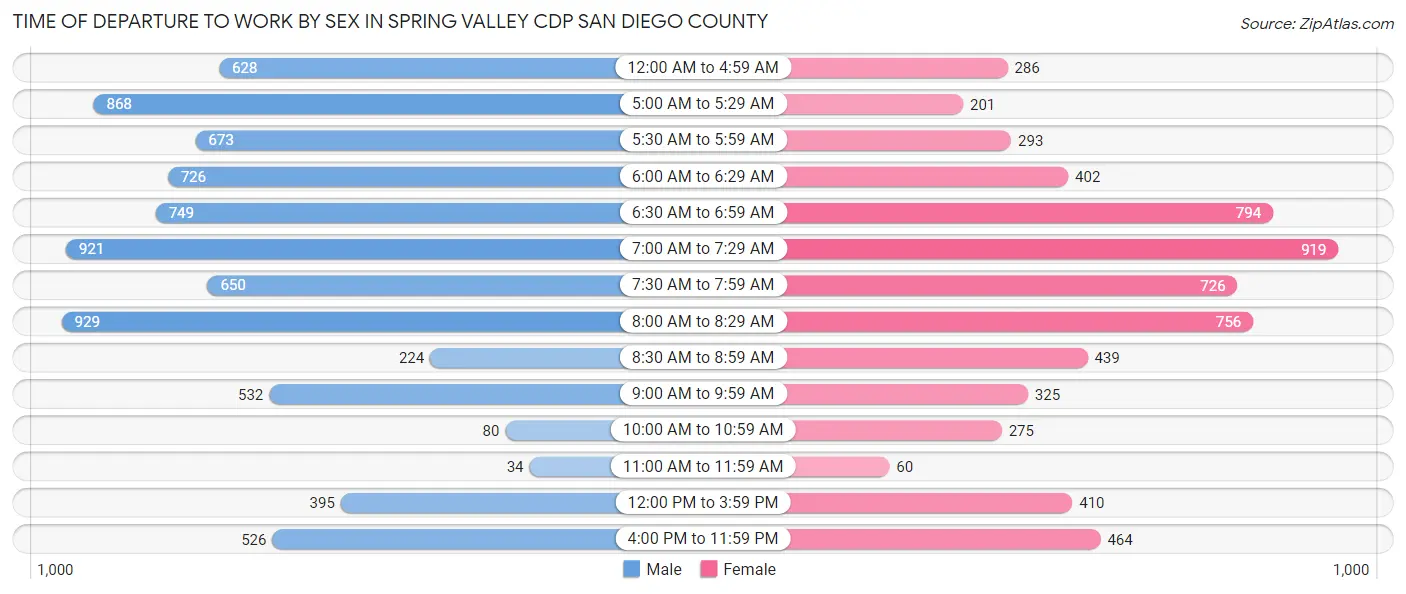
| Time of Departure | Male | Female |
| 12:00 AM to 4:59 AM | 628 (7.9%) | 286 (4.5%) |
| 5:00 AM to 5:29 AM | 868 (10.9%) | 201 (3.2%) |
| 5:30 AM to 5:59 AM | 673 (8.5%) | 293 (4.6%) |
| 6:00 AM to 6:29 AM | 726 (9.1%) | 402 (6.3%) |
| 6:30 AM to 6:59 AM | 749 (9.4%) | 794 (12.5%) |
| 7:00 AM to 7:29 AM | 921 (11.6%) | 919 (14.5%) |
| 7:30 AM to 7:59 AM | 650 (8.2%) | 726 (11.4%) |
| 8:00 AM to 8:29 AM | 929 (11.7%) | 756 (11.9%) |
| 8:30 AM to 8:59 AM | 224 (2.8%) | 439 (6.9%) |
| 9:00 AM to 9:59 AM | 532 (6.7%) | 325 (5.1%) |
| 10:00 AM to 10:59 AM | 80 (1.0%) | 275 (4.3%) |
| 11:00 AM to 11:59 AM | 34 (0.4%) | 60 (0.9%) |
| 12:00 PM to 3:59 PM | 395 (5.0%) | 410 (6.5%) |
| 4:00 PM to 11:59 PM | 526 (6.6%) | 464 (7.3%) |
| Total | 7,935 (100.0%) | 6,350 (100.0%) |
Housing Occupancy in Spring Valley CDP San Diego County
Occupancy by Ownership in Spring Valley CDP San Diego County
Of the total 9,818 dwellings in Spring Valley CDP San Diego County, owner-occupied units account for 6,126 (62.4%), while renter-occupied units make up 3,692 (37.6%).
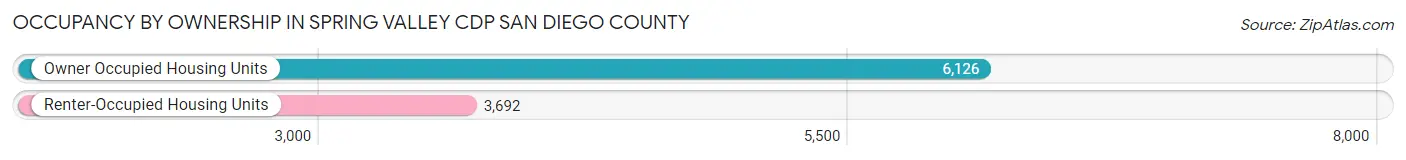
| Occupancy | # Housing Units | % Housing Units |
| Owner Occupied Housing Units | 6,126 | 62.4% |
| Renter-Occupied Housing Units | 3,692 | 37.6% |
| Total Occupied Housing Units | 9,818 | 100.0% |
Occupancy by Household Size in Spring Valley CDP San Diego County
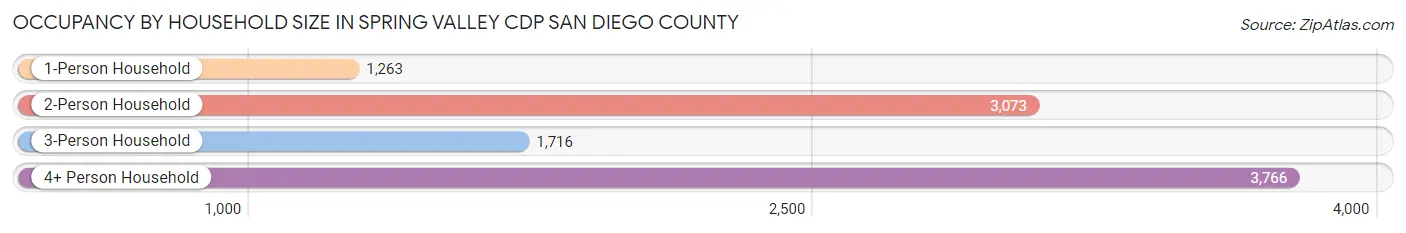
| Household Size | # Housing Units | % Housing Units |
| 1-Person Household | 1,263 | 12.9% |
| 2-Person Household | 3,073 | 31.3% |
| 3-Person Household | 1,716 | 17.5% |
| 4+ Person Household | 3,766 | 38.4% |
| Total Housing Units | 9,818 | 100.0% |
Occupancy by Ownership by Household Size in Spring Valley CDP San Diego County
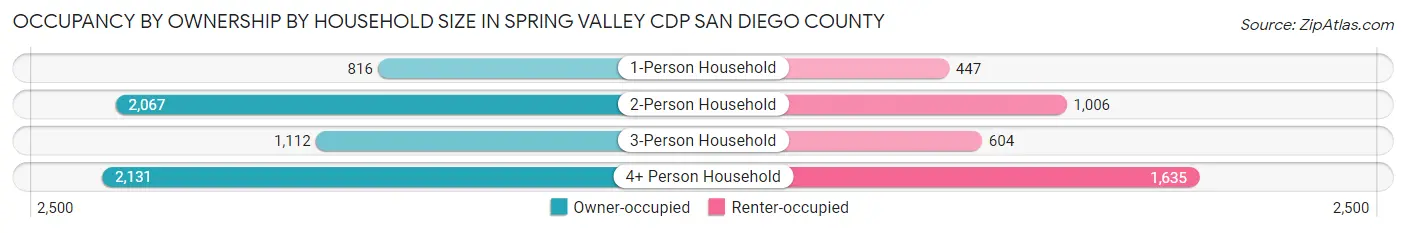
| Household Size | Owner-occupied | Renter-occupied |
| 1-Person Household | 816 (64.6%) | 447 (35.4%) |
| 2-Person Household | 2,067 (67.3%) | 1,006 (32.7%) |
| 3-Person Household | 1,112 (64.8%) | 604 (35.2%) |
| 4+ Person Household | 2,131 (56.6%) | 1,635 (43.4%) |
| Total Housing Units | 6,126 (62.4%) | 3,692 (37.6%) |
Occupancy by Educational Attainment in Spring Valley CDP San Diego County
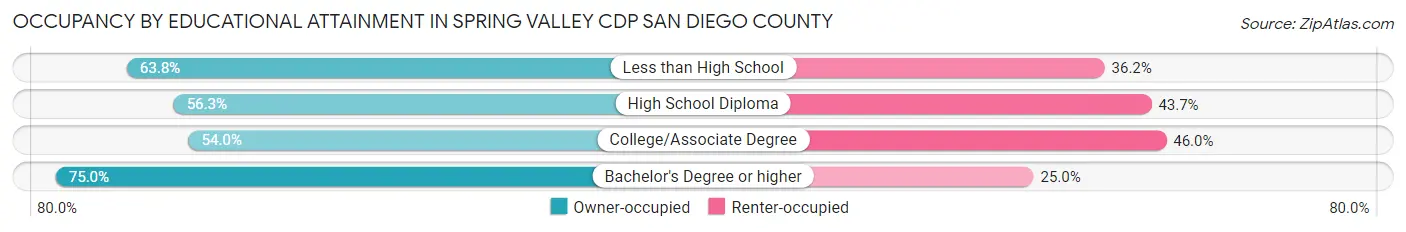
| Household Size | Owner-occupied | Renter-occupied |
| Less than High School | 470 (63.8%) | 267 (36.2%) |
| High School Diploma | 835 (56.3%) | 647 (43.7%) |
| College/Associate Degree | 2,260 (54.0%) | 1,926 (46.0%) |
| Bachelor's Degree or higher | 2,561 (75.0%) | 852 (25.0%) |
Occupancy by Age of Householder in Spring Valley CDP San Diego County
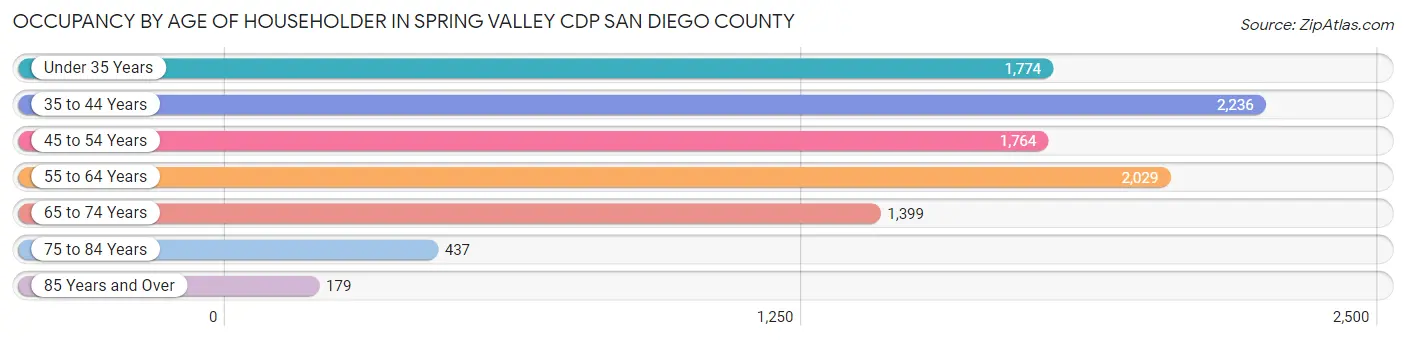
| Age Bracket | # Households | % Households |
| Under 35 Years | 1,774 | 18.1% |
| 35 to 44 Years | 2,236 | 22.8% |
| 45 to 54 Years | 1,764 | 18.0% |
| 55 to 64 Years | 2,029 | 20.7% |
| 65 to 74 Years | 1,399 | 14.2% |
| 75 to 84 Years | 437 | 4.4% |
| 85 Years and Over | 179 | 1.8% |
| Total | 9,818 | 100.0% |
Housing Finances in Spring Valley CDP San Diego County
Median Income by Occupancy in Spring Valley CDP San Diego County
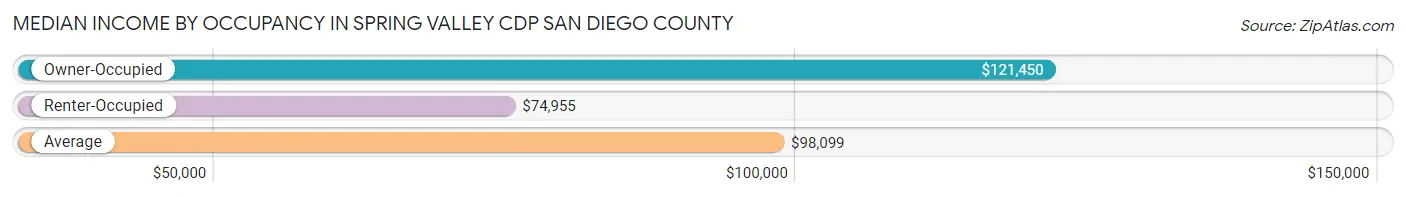
| Occupancy Type | # Households | Median Income |
| Owner-Occupied | 6,126 (62.4%) | $121,450 |
| Renter-Occupied | 3,692 (37.6%) | $74,955 |
| Average | 9,818 (100.0%) | $98,099 |
Occupancy by Householder Income Bracket in Spring Valley CDP San Diego County
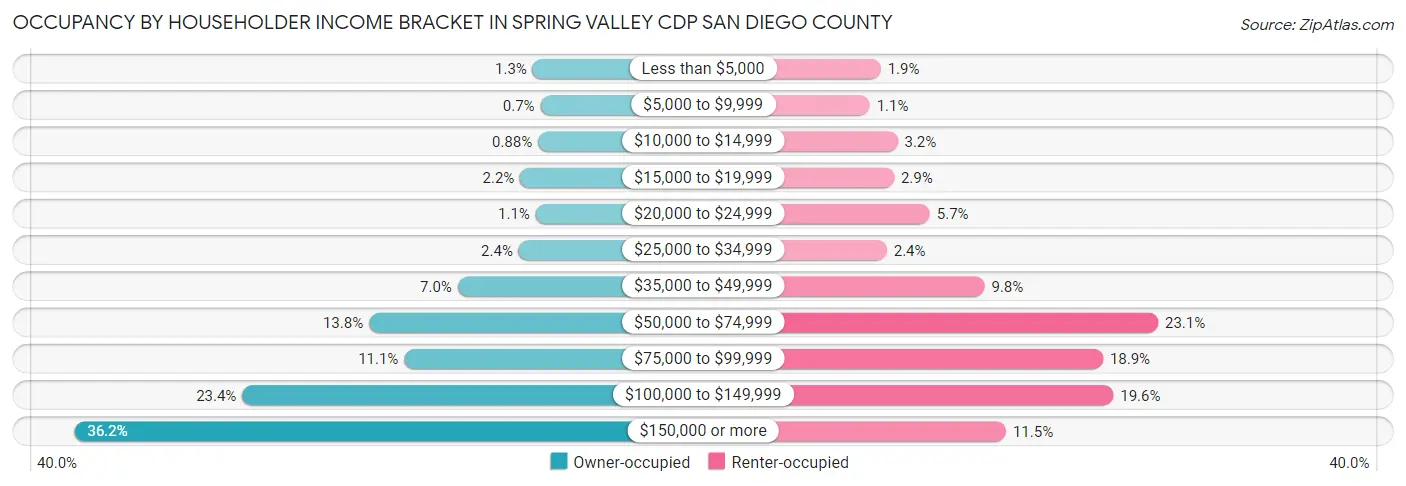
| Income Bracket | Owner-occupied | Renter-occupied |
| Less than $5,000 | 79 (1.3%) | 71 (1.9%) |
| $5,000 to $9,999 | 43 (0.7%) | 40 (1.1%) |
| $10,000 to $14,999 | 54 (0.9%) | 118 (3.2%) |
| $15,000 to $19,999 | 137 (2.2%) | 108 (2.9%) |
| $20,000 to $24,999 | 65 (1.1%) | 209 (5.7%) |
| $25,000 to $34,999 | 144 (2.4%) | 88 (2.4%) |
| $35,000 to $49,999 | 429 (7.0%) | 363 (9.8%) |
| $50,000 to $74,999 | 843 (13.8%) | 851 (23.1%) |
| $75,000 to $99,999 | 679 (11.1%) | 696 (18.9%) |
| $100,000 to $149,999 | 1,435 (23.4%) | 725 (19.6%) |
| $150,000 or more | 2,218 (36.2%) | 423 (11.5%) |
| Total | 6,126 (100.0%) | 3,692 (100.0%) |
Monthly Housing Cost Tiers in Spring Valley CDP San Diego County
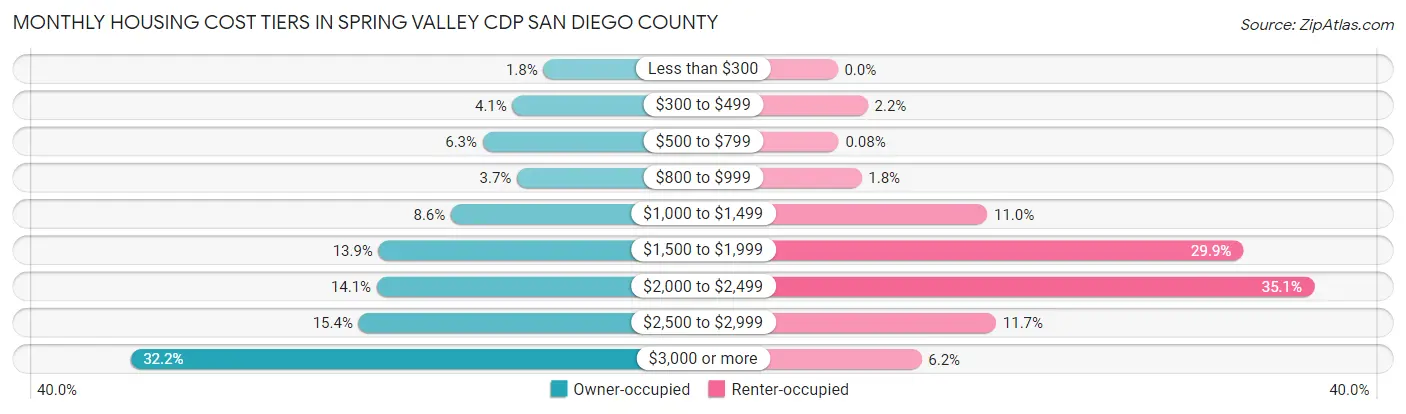
| Monthly Cost | Owner-occupied | Renter-occupied |
| Less than $300 | 109 (1.8%) | 0 (0.0%) |
| $300 to $499 | 249 (4.1%) | 82 (2.2%) |
| $500 to $799 | 383 (6.2%) | 3 (0.1%) |
| $800 to $999 | 228 (3.7%) | 65 (1.8%) |
| $1,000 to $1,499 | 526 (8.6%) | 407 (11.0%) |
| $1,500 to $1,999 | 853 (13.9%) | 1,103 (29.9%) |
| $2,000 to $2,499 | 861 (14.1%) | 1,295 (35.1%) |
| $2,500 to $2,999 | 943 (15.4%) | 431 (11.7%) |
| $3,000 or more | 1,974 (32.2%) | 228 (6.2%) |
| Total | 6,126 (100.0%) | 3,692 (100.0%) |
Physical Housing Characteristics in Spring Valley CDP San Diego County
Housing Structures in Spring Valley CDP San Diego County
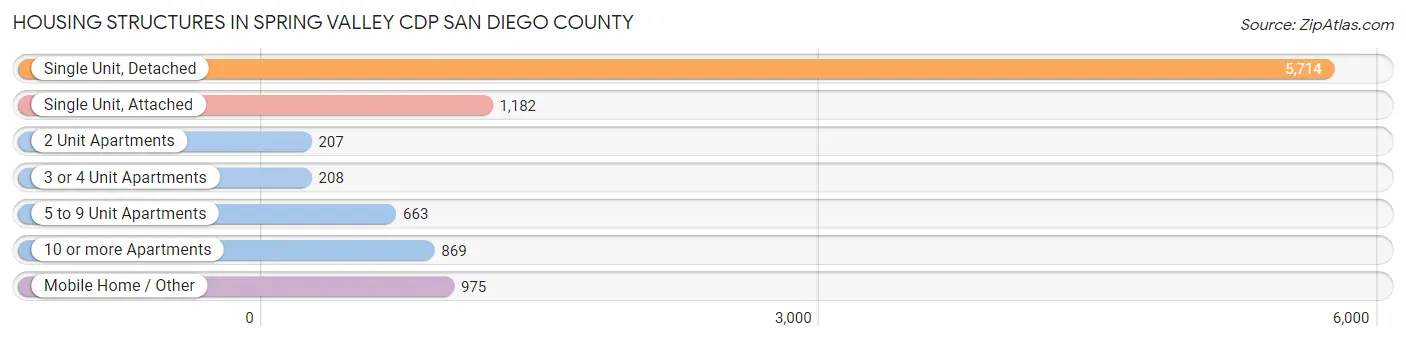
| Structure Type | # Housing Units | % Housing Units |
| Single Unit, Detached | 5,714 | 58.2% |
| Single Unit, Attached | 1,182 | 12.0% |
| 2 Unit Apartments | 207 | 2.1% |
| 3 or 4 Unit Apartments | 208 | 2.1% |
| 5 to 9 Unit Apartments | 663 | 6.8% |
| 10 or more Apartments | 869 | 8.8% |
| Mobile Home / Other | 975 | 9.9% |
| Total | 9,818 | 100.0% |
Housing Structures by Occupancy in Spring Valley CDP San Diego County
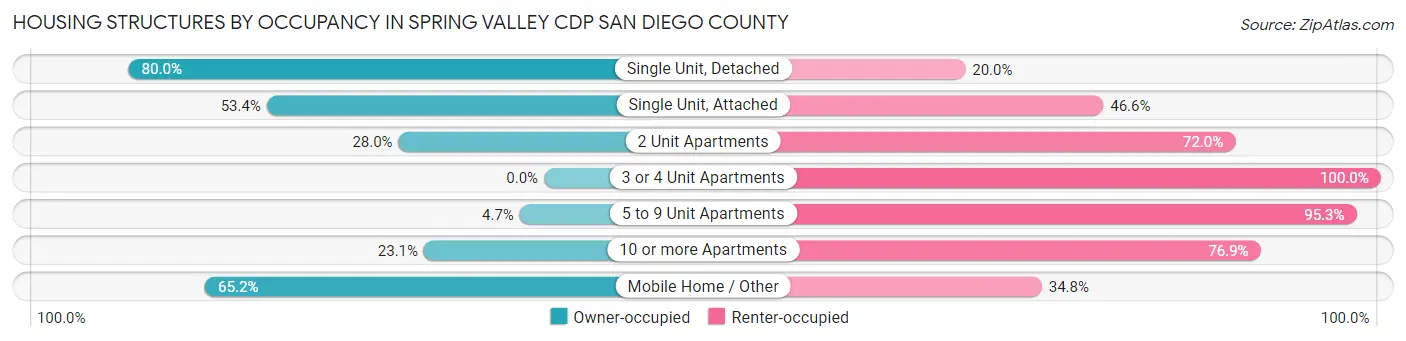
| Structure Type | Owner-occupied | Renter-occupied |
| Single Unit, Detached | 4,569 (80.0%) | 1,145 (20.0%) |
| Single Unit, Attached | 631 (53.4%) | 551 (46.6%) |
| 2 Unit Apartments | 58 (28.0%) | 149 (72.0%) |
| 3 or 4 Unit Apartments | 0 (0.0%) | 208 (100.0%) |
| 5 to 9 Unit Apartments | 31 (4.7%) | 632 (95.3%) |
| 10 or more Apartments | 201 (23.1%) | 668 (76.9%) |
| Mobile Home / Other | 636 (65.2%) | 339 (34.8%) |
| Total | 6,126 (62.4%) | 3,692 (37.6%) |
Housing Structures by Number of Rooms in Spring Valley CDP San Diego County
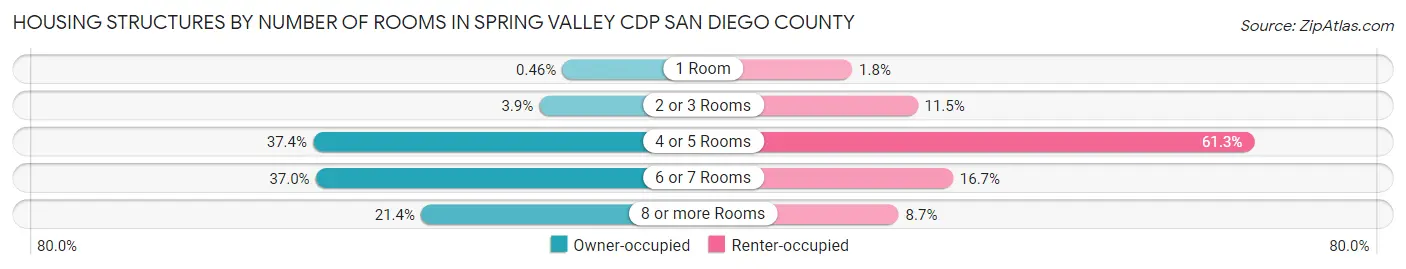
| Number of Rooms | Owner-occupied | Renter-occupied |
| 1 Room | 28 (0.5%) | 67 (1.8%) |
| 2 or 3 Rooms | 237 (3.9%) | 424 (11.5%) |
| 4 or 5 Rooms | 2,288 (37.3%) | 2,263 (61.3%) |
| 6 or 7 Rooms | 2,264 (37.0%) | 617 (16.7%) |
| 8 or more Rooms | 1,309 (21.4%) | 321 (8.7%) |
| Total | 6,126 (100.0%) | 3,692 (100.0%) |
Housing Structure by Heating Type in Spring Valley CDP San Diego County
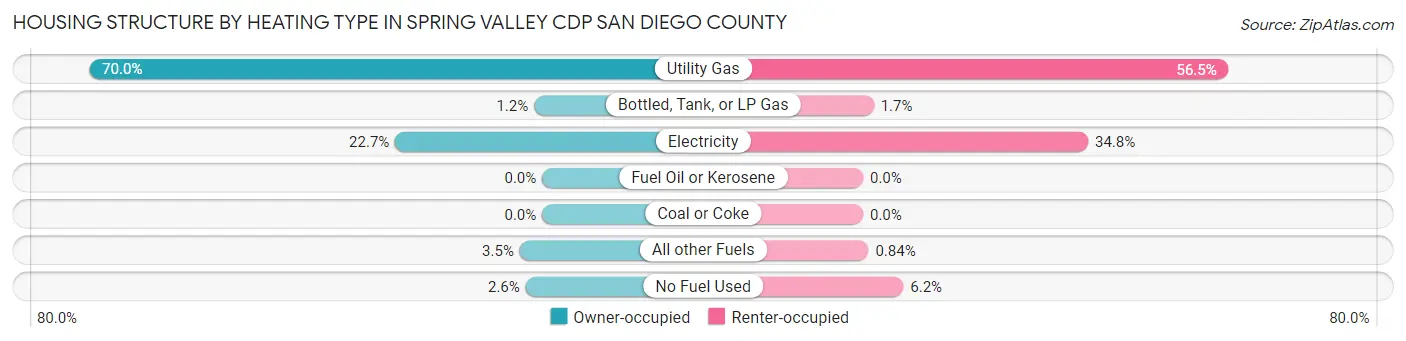
| Heating Type | Owner-occupied | Renter-occupied |
| Utility Gas | 4,290 (70.0%) | 2,086 (56.5%) |
| Bottled, Tank, or LP Gas | 76 (1.2%) | 61 (1.7%) |
| Electricity | 1,392 (22.7%) | 1,284 (34.8%) |
| Fuel Oil or Kerosene | 0 (0.0%) | 0 (0.0%) |
| Coal or Coke | 0 (0.0%) | 0 (0.0%) |
| All other Fuels | 212 (3.5%) | 31 (0.8%) |
| No Fuel Used | 156 (2.5%) | 230 (6.2%) |
| Total | 6,126 (100.0%) | 3,692 (100.0%) |
Household Vehicle Usage in Spring Valley CDP San Diego County
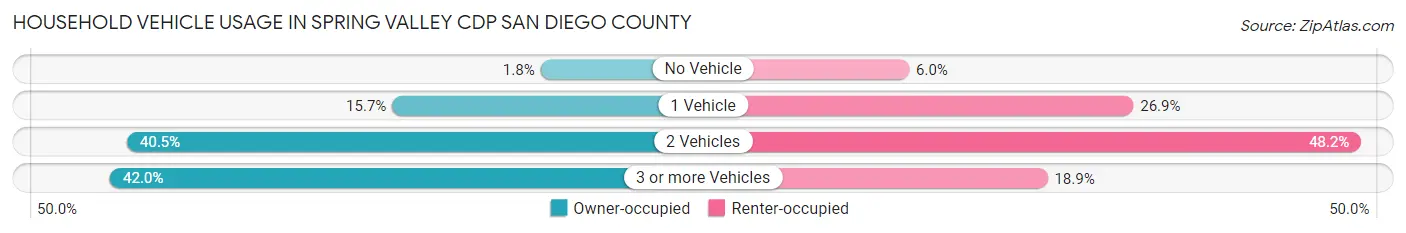
| Vehicles per Household | Owner-occupied | Renter-occupied |
| No Vehicle | 113 (1.8%) | 221 (6.0%) |
| 1 Vehicle | 961 (15.7%) | 994 (26.9%) |
| 2 Vehicles | 2,478 (40.5%) | 1,779 (48.2%) |
| 3 or more Vehicles | 2,574 (42.0%) | 698 (18.9%) |
| Total | 6,126 (100.0%) | 3,692 (100.0%) |
Real Estate & Mortgages in Spring Valley CDP San Diego County
Real Estate and Mortgage Overview in Spring Valley CDP San Diego County
| Characteristic | Without Mortgage | With Mortgage |
| Housing Units | 1,441 | 4,685 |
| Median Property Value | $418,400 | $629,700 |
| Median Household Income | $60,417 | $1,960 |
| Monthly Housing Costs | $788 | $1,966 |
| Real Estate Taxes | $2,614 | $123 |
Property Value by Mortgage Status in Spring Valley CDP San Diego County
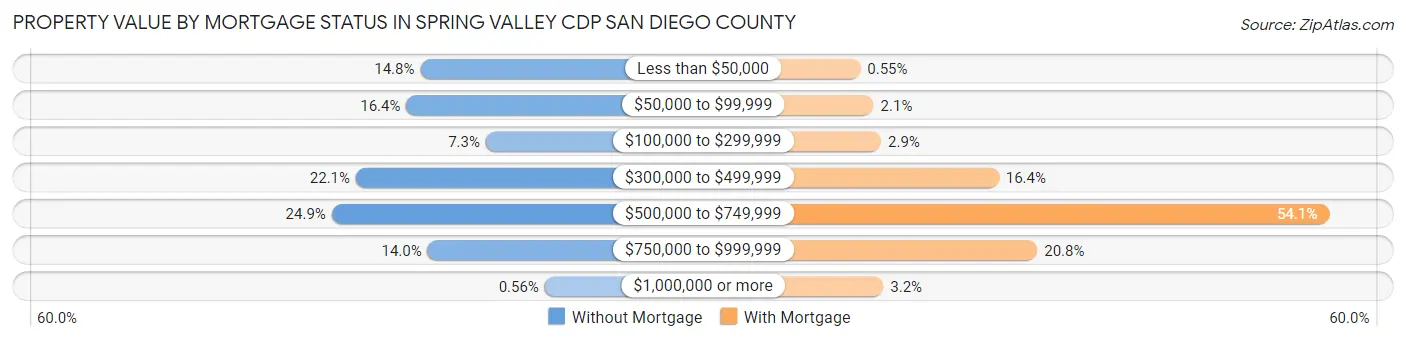
| Property Value | Without Mortgage | With Mortgage |
| Less than $50,000 | 213 (14.8%) | 26 (0.5%) |
| $50,000 to $99,999 | 236 (16.4%) | 97 (2.1%) |
| $100,000 to $299,999 | 105 (7.3%) | 137 (2.9%) |
| $300,000 to $499,999 | 319 (22.1%) | 767 (16.4%) |
| $500,000 to $749,999 | 359 (24.9%) | 2,536 (54.1%) |
| $750,000 to $999,999 | 201 (14.0%) | 973 (20.8%) |
| $1,000,000 or more | 8 (0.6%) | 149 (3.2%) |
| Total | 1,441 (100.0%) | 4,685 (100.0%) |
Household Income by Mortgage Status in Spring Valley CDP San Diego County
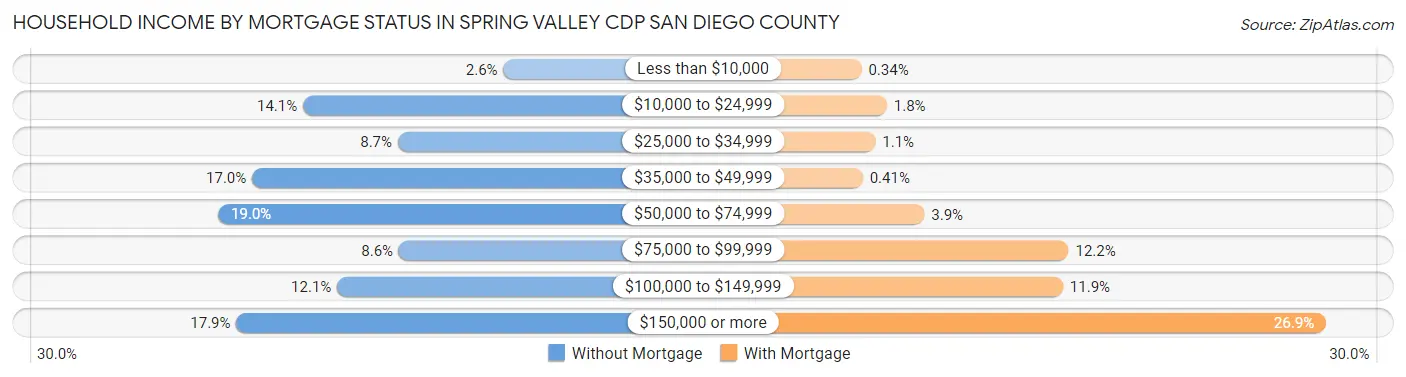
| Household Income | Without Mortgage | With Mortgage |
| Less than $10,000 | 38 (2.6%) | 16 (0.3%) |
| $10,000 to $24,999 | 203 (14.1%) | 84 (1.8%) |
| $25,000 to $34,999 | 125 (8.7%) | 53 (1.1%) |
| $35,000 to $49,999 | 245 (17.0%) | 19 (0.4%) |
| $50,000 to $74,999 | 273 (19.0%) | 184 (3.9%) |
| $75,000 to $99,999 | 124 (8.6%) | 570 (12.2%) |
| $100,000 to $149,999 | 175 (12.1%) | 555 (11.8%) |
| $150,000 or more | 258 (17.9%) | 1,260 (26.9%) |
| Total | 1,441 (100.0%) | 4,685 (100.0%) |
Property Value to Household Income Ratio in Spring Valley CDP San Diego County
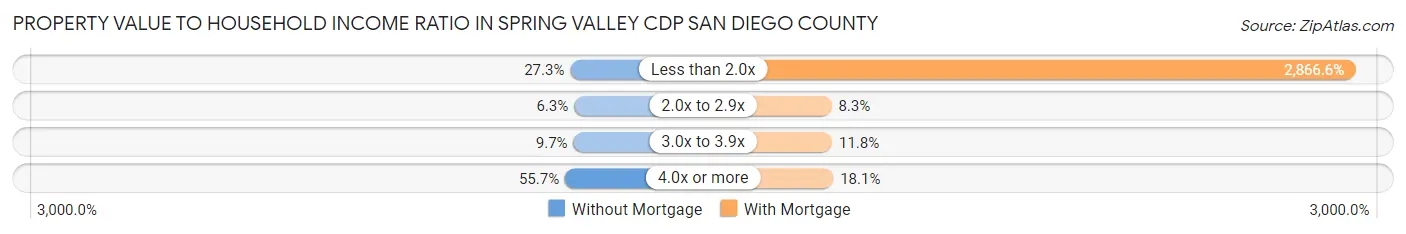
| Value-to-Income Ratio | Without Mortgage | With Mortgage |
| Less than 2.0x | 393 (27.3%) | 134,302 (2,866.6%) |
| 2.0x to 2.9x | 90 (6.2%) | 388 (8.3%) |
| 3.0x to 3.9x | 140 (9.7%) | 551 (11.8%) |
| 4.0x or more | 802 (55.7%) | 847 (18.1%) |
| Total | 1,441 (100.0%) | 4,685 (100.0%) |
Real Estate Taxes by Mortgage Status in Spring Valley CDP San Diego County
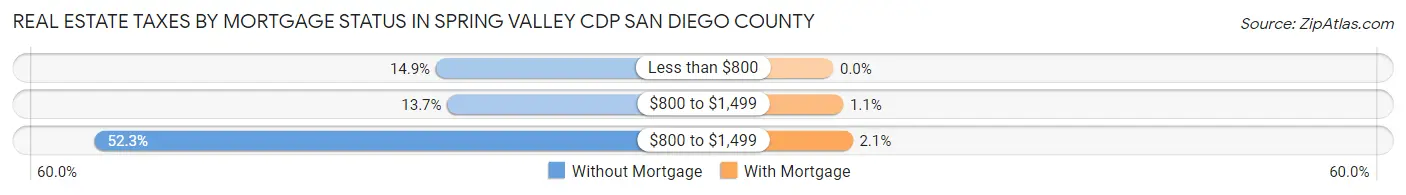
| Property Taxes | Without Mortgage | With Mortgage |
| Less than $800 | 215 (14.9%) | 0 (0.0%) |
| $800 to $1,499 | 197 (13.7%) | 51 (1.1%) |
| $800 to $1,499 | 754 (52.3%) | 100 (2.1%) |
| Total | 1,441 (100.0%) | 4,685 (100.0%) |
Health & Disability in Spring Valley CDP San Diego County
Health Insurance Coverage by Age in Spring Valley CDP San Diego County
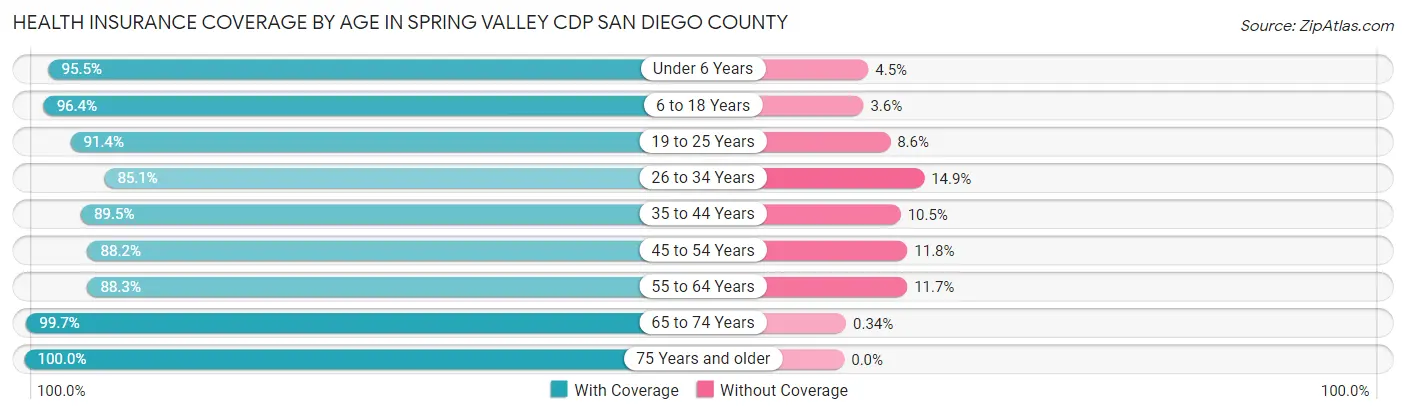
| Age Bracket | With Coverage | Without Coverage |
| Under 6 Years | 2,810 (95.5%) | 132 (4.5%) |
| 6 to 18 Years | 5,166 (96.4%) | 192 (3.6%) |
| 19 to 25 Years | 2,964 (91.4%) | 278 (8.6%) |
| 26 to 34 Years | 3,633 (85.1%) | 636 (14.9%) |
| 35 to 44 Years | 4,090 (89.5%) | 481 (10.5%) |
| 45 to 54 Years | 3,393 (88.2%) | 452 (11.8%) |
| 55 to 64 Years | 3,304 (88.3%) | 439 (11.7%) |
| 65 to 74 Years | 2,650 (99.7%) | 9 (0.3%) |
| 75 Years and older | 1,219 (100.0%) | 0 (0.0%) |
| Total | 29,229 (91.8%) | 2,619 (8.2%) |
Health Insurance Coverage by Citizenship Status in Spring Valley CDP San Diego County
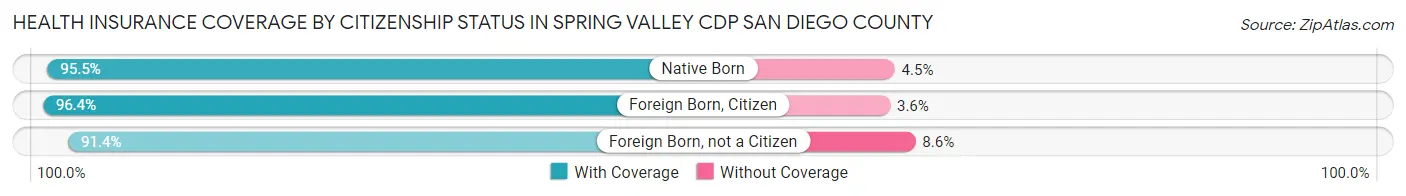
| Citizenship Status | With Coverage | Without Coverage |
| Native Born | 2,810 (95.5%) | 132 (4.5%) |
| Foreign Born, Citizen | 5,166 (96.4%) | 192 (3.6%) |
| Foreign Born, not a Citizen | 2,964 (91.4%) | 278 (8.6%) |
Health Insurance Coverage by Household Income in Spring Valley CDP San Diego County
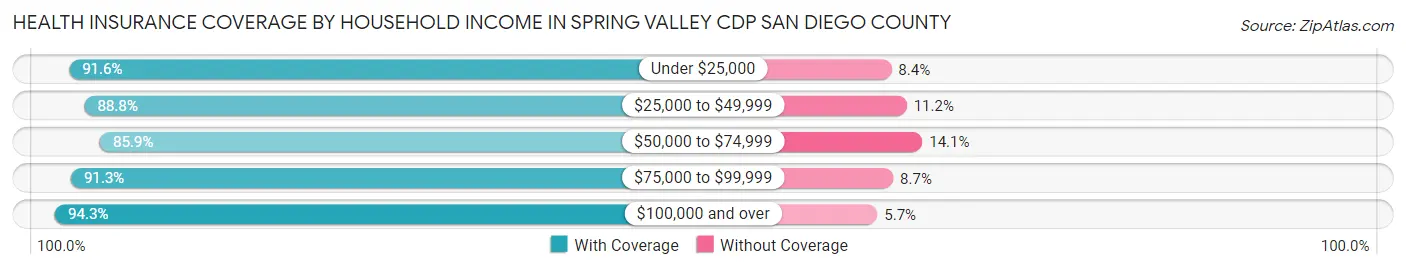
| Household Income | With Coverage | Without Coverage |
| Under $25,000 | 2,367 (91.6%) | 216 (8.4%) |
| $25,000 to $49,999 | 2,617 (88.8%) | 331 (11.2%) |
| $50,000 to $74,999 | 4,446 (85.9%) | 732 (14.1%) |
| $75,000 to $99,999 | 4,057 (91.3%) | 386 (8.7%) |
| $100,000 and over | 15,652 (94.3%) | 951 (5.7%) |
Public vs Private Health Insurance Coverage by Age in Spring Valley CDP San Diego County
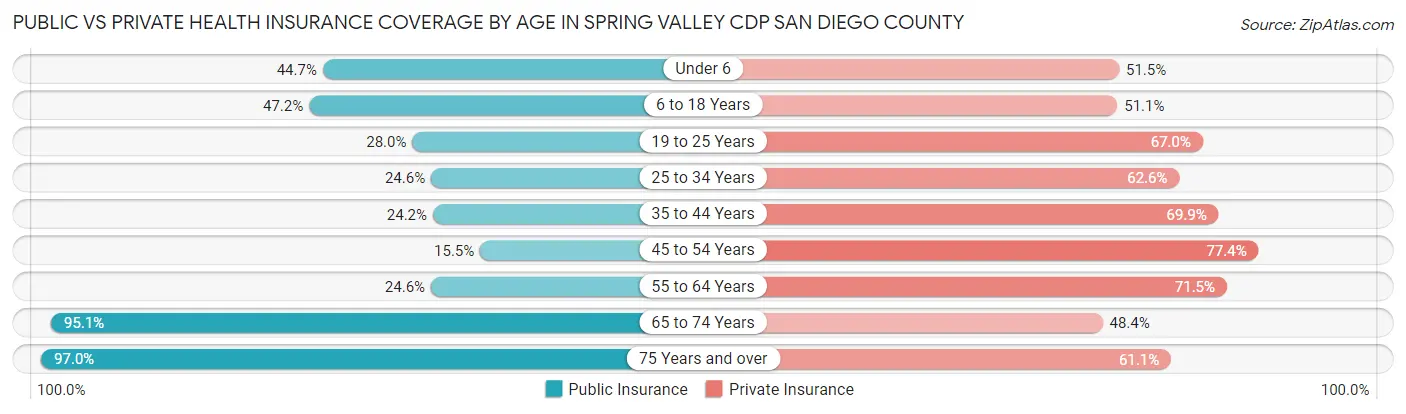
| Age Bracket | Public Insurance | Private Insurance |
| Under 6 | 1,314 (44.7%) | 1,514 (51.5%) |
| 6 to 18 Years | 2,529 (47.2%) | 2,740 (51.1%) |
| 19 to 25 Years | 909 (28.0%) | 2,172 (67.0%) |
| 25 to 34 Years | 1,049 (24.6%) | 2,674 (62.6%) |
| 35 to 44 Years | 1,107 (24.2%) | 3,197 (69.9%) |
| 45 to 54 Years | 594 (15.4%) | 2,974 (77.3%) |
| 55 to 64 Years | 920 (24.6%) | 2,675 (71.5%) |
| 65 to 74 Years | 2,529 (95.1%) | 1,287 (48.4%) |
| 75 Years and over | 1,182 (97.0%) | 745 (61.1%) |
| Total | 12,133 (38.1%) | 19,978 (62.7%) |
Disability Status by Sex by Age in Spring Valley CDP San Diego County
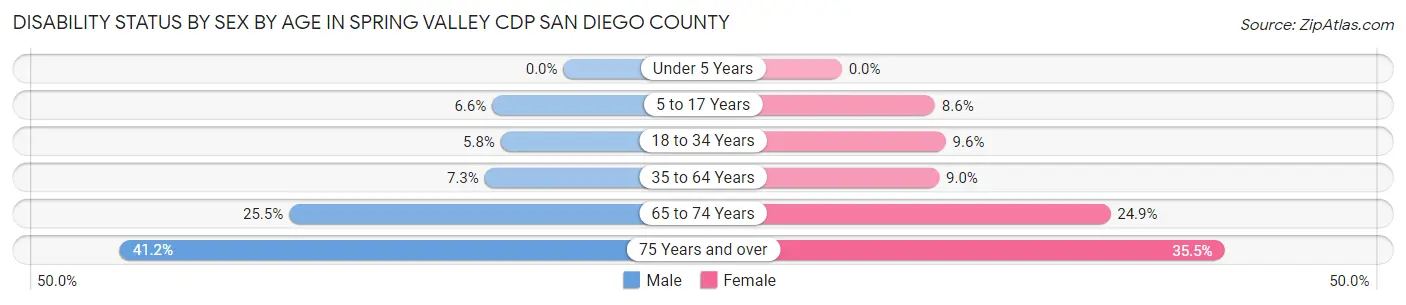
| Age Bracket | Male | Female |
| Under 5 Years | 0 (0.0%) | 0 (0.0%) |
| 5 to 17 Years | 173 (6.6%) | 245 (8.6%) |
| 18 to 34 Years | 231 (5.8%) | 377 (9.6%) |
| 35 to 64 Years | 444 (7.3%) | 550 (9.0%) |
| 65 to 74 Years | 349 (25.5%) | 321 (24.9%) |
| 75 Years and over | 205 (41.2%) | 256 (35.5%) |
Disability Class by Sex by Age in Spring Valley CDP San Diego County
Disability Class: Hearing Difficulty
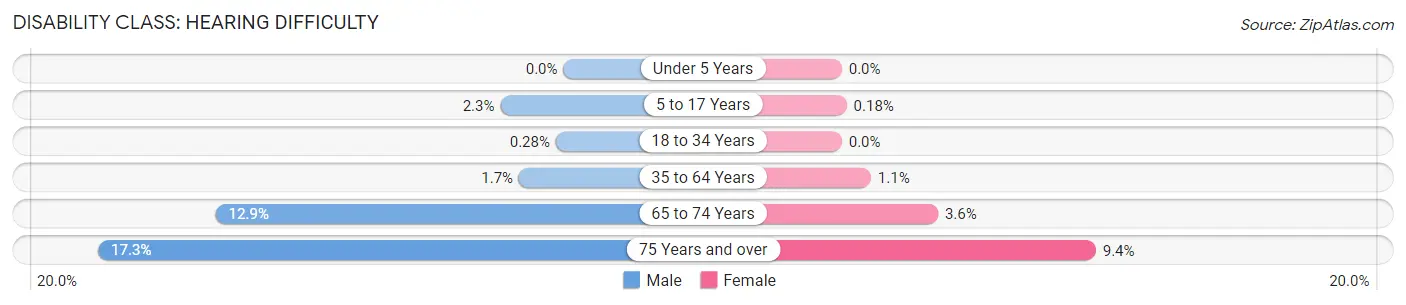
| Age Bracket | Male | Female |
| Under 5 Years | 0 (0.0%) | 0 (0.0%) |
| 5 to 17 Years | 61 (2.3%) | 5 (0.2%) |
| 18 to 34 Years | 11 (0.3%) | 0 (0.0%) |
| 35 to 64 Years | 100 (1.7%) | 66 (1.1%) |
| 65 to 74 Years | 177 (12.9%) | 46 (3.6%) |
| 75 Years and over | 86 (17.3%) | 68 (9.4%) |
Disability Class: Vision Difficulty
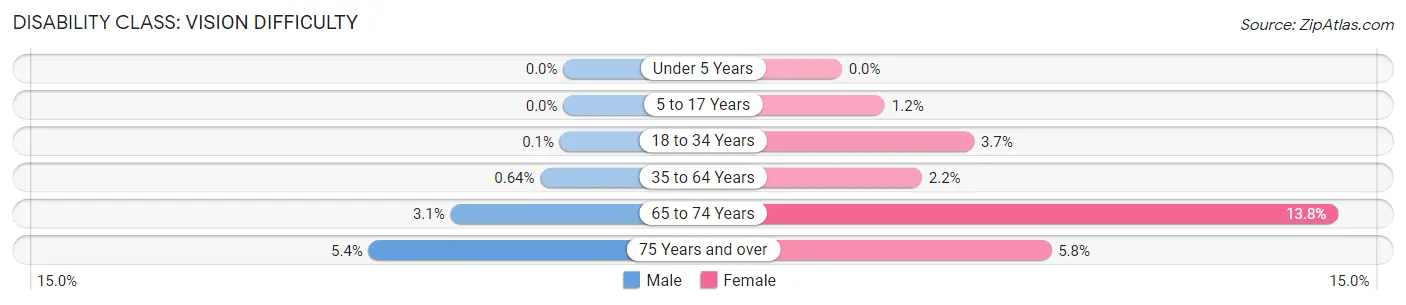
| Age Bracket | Male | Female |
| Under 5 Years | 0 (0.0%) | 0 (0.0%) |
| 5 to 17 Years | 0 (0.0%) | 34 (1.2%) |
| 18 to 34 Years | 4 (0.1%) | 144 (3.7%) |
| 35 to 64 Years | 39 (0.6%) | 136 (2.2%) |
| 65 to 74 Years | 43 (3.1%) | 178 (13.8%) |
| 75 Years and over | 27 (5.4%) | 42 (5.8%) |
Disability Class: Cognitive Difficulty
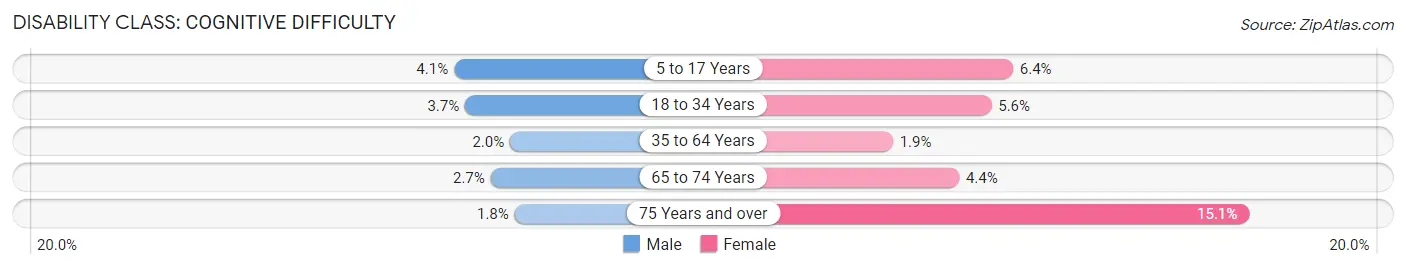
| Age Bracket | Male | Female |
| 5 to 17 Years | 106 (4.1%) | 180 (6.4%) |
| 18 to 34 Years | 145 (3.6%) | 217 (5.6%) |
| 35 to 64 Years | 120 (2.0%) | 115 (1.9%) |
| 65 to 74 Years | 37 (2.7%) | 56 (4.3%) |
| 75 Years and over | 9 (1.8%) | 109 (15.1%) |
Disability Class: Ambulatory Difficulty
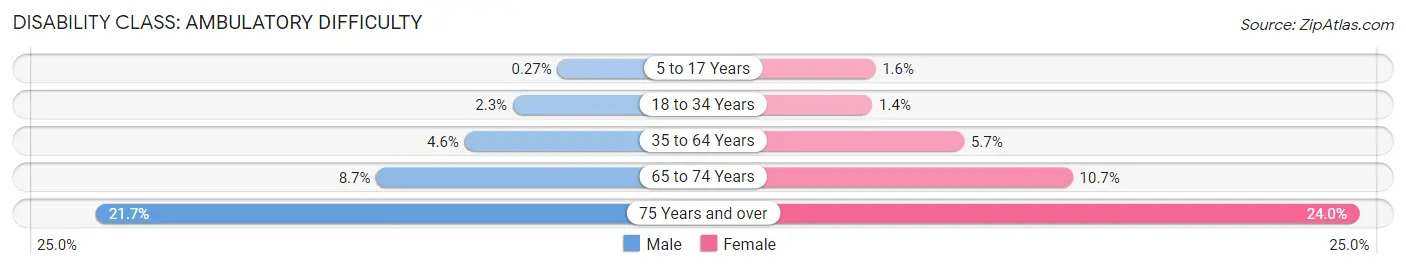
| Age Bracket | Male | Female |
| 5 to 17 Years | 7 (0.3%) | 44 (1.5%) |
| 18 to 34 Years | 93 (2.3%) | 55 (1.4%) |
| 35 to 64 Years | 278 (4.6%) | 345 (5.7%) |
| 65 to 74 Years | 119 (8.7%) | 138 (10.7%) |
| 75 Years and over | 108 (21.7%) | 173 (24.0%) |
Disability Class: Self-Care Difficulty
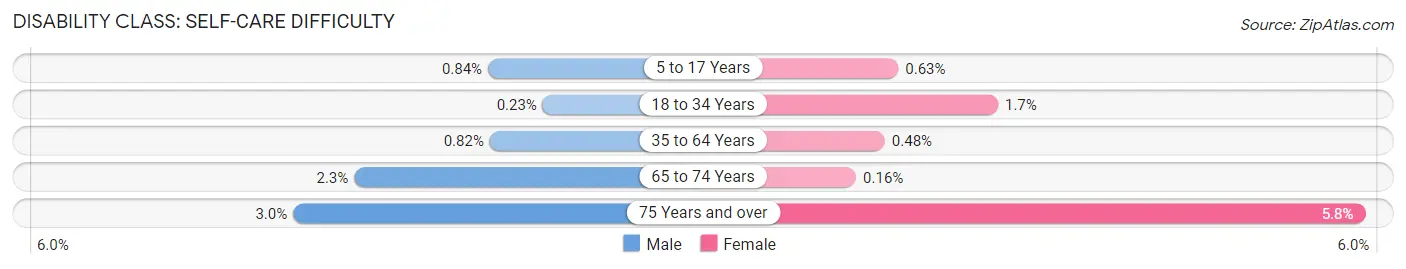
| Age Bracket | Male | Female |
| 5 to 17 Years | 22 (0.8%) | 18 (0.6%) |
| 18 to 34 Years | 9 (0.2%) | 68 (1.7%) |
| 35 to 64 Years | 50 (0.8%) | 29 (0.5%) |
| 65 to 74 Years | 32 (2.3%) | 2 (0.2%) |
| 75 Years and over | 15 (3.0%) | 42 (5.8%) |
Technology Access in Spring Valley CDP San Diego County
Computing Device Access in Spring Valley CDP San Diego County
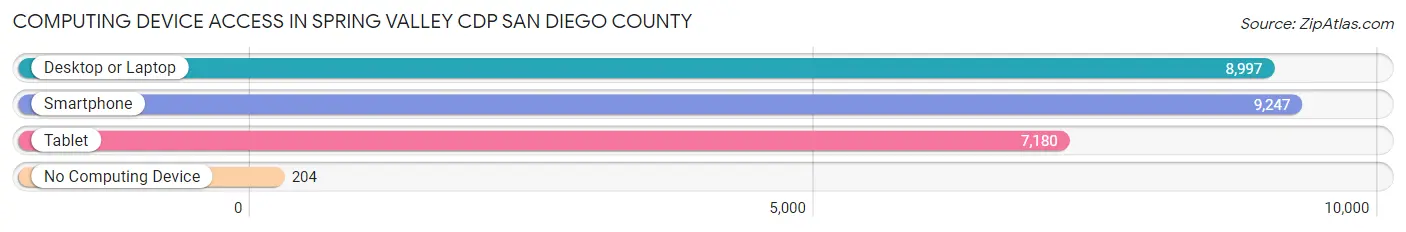
| Device Type | # Households | % Households |
| Desktop or Laptop | 8,997 | 91.6% |
| Smartphone | 9,247 | 94.2% |
| Tablet | 7,180 | 73.1% |
| No Computing Device | 204 | 2.1% |
| Total | 9,818 | 100.0% |
Internet Access in Spring Valley CDP San Diego County
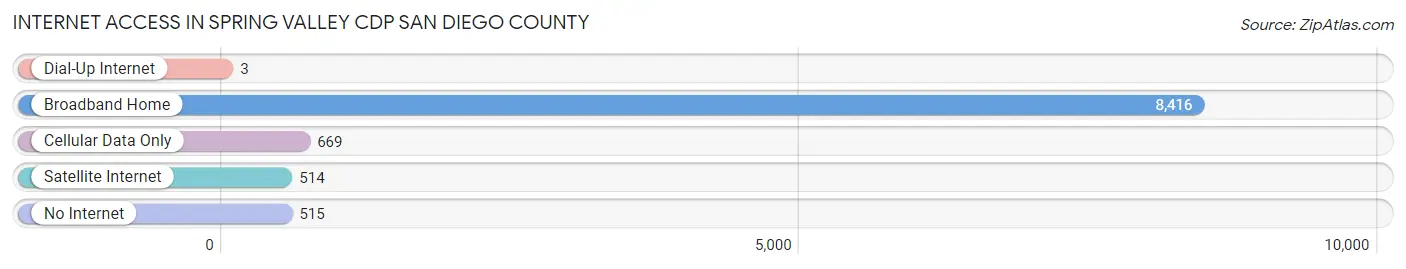
| Internet Type | # Households | % Households |
| Dial-Up Internet | 3 | 0.0% |
| Broadband Home | 8,416 | 85.7% |
| Cellular Data Only | 669 | 6.8% |
| Satellite Internet | 514 | 5.2% |
| No Internet | 515 | 5.2% |
| Total | 9,818 | 100.0% |
Spring Valley CDP San Diego County Summary
History
The area now known as Spring Valley CDP, San Diego County, California was originally inhabited by the Kumeyaay people. The Kumeyaay were a semi-nomadic people who lived in the area for thousands of years before the arrival of Europeans. The first Europeans to arrive in the area were Spanish missionaries and soldiers in the late 1700s. The Spanish established several missions in the area, including Mission San Diego de Alcalá, which was founded in 1769.
In the early 1800s, the area was part of Mexico, and after the Mexican-American War in 1848, it became part of the United States. The area was then part of San Diego County, which was established in 1850.
In the late 1800s, the area began to be developed for agriculture. The first settlers in the area were farmers who grew citrus, grapes, and other crops. The area was also home to several dairy farms.
In the early 1900s, the area began to be developed for residential use. The first subdivision in the area was called Spring Valley, and it was developed in the 1920s. The area was attractive to people looking for affordable housing, and it quickly grew in population.
In the 1950s, the area began to be developed for industrial use. Several factories were built in the area, and the population continued to grow.
In the 1970s, the area began to be developed for commercial use. Several shopping centers and other businesses were built in the area, and the population continued to grow.
In the 1980s, the area began to be developed for recreational use. Several parks and other recreational facilities were built in the area, and the population continued to grow.
Geography
Spring Valley CDP is located in San Diego County, California. It is situated in the southeastern part of the county, about 15 miles east of downtown San Diego. The area is bordered by the cities of La Mesa, Lemon Grove, and El Cajon.
The area is mostly flat, with some rolling hills. The elevation ranges from sea level to about 500 feet. The climate is mild, with temperatures ranging from the mid-50s to the mid-80s.
Economy
The economy of Spring Valley CDP is largely based on retail, services, and manufacturing. The area is home to several shopping centers, restaurants, and other businesses. There are also several factories in the area, which produce a variety of products.
The area is also home to several government offices, including the San Diego County Sheriff's Department and the San Diego County Fire Department.
Demographics
As of the 2010 census, the population of Spring Valley CDP was 28,205. The population is mostly Hispanic, with about 70% of the population identifying as Hispanic or Latino. The median household income is $50,845, and the median age is 33.
Conclusion
Spring Valley CDP, San Diego County, California is a diverse and vibrant community. The area has a long history of agriculture and residential development, and it is now home to several businesses, factories, and government offices. The population is mostly Hispanic, and the median household income is $50,845. The area is also home to several parks and other recreational facilities, making it an attractive place to live.
Common Questions
What is Per Capita Income in Spring Valley CDP San Diego County?
Per Capita income in Spring Valley CDP San Diego County is $36,862.
What is the Median Family Income in Spring Valley CDP San Diego County?
Median Family Income in Spring Valley CDP San Diego County is $100,346.
What is the Median Household income in Spring Valley CDP San Diego County?
Median Household Income in Spring Valley CDP San Diego County is $98,099.
What is Income or Wage Gap in Spring Valley CDP San Diego County?
Income or Wage Gap in Spring Valley CDP San Diego County is 24.8%.
Women in Spring Valley CDP San Diego County earn 75.2 cents for every dollar earned by a man.
What is Family Income Deficit in Spring Valley CDP San Diego County?
Family Income Deficit in Spring Valley CDP San Diego County is $11,583.
Families that are below poverty line in Spring Valley CDP San Diego County earn $11,583 less on average than the poverty threshold level.
What is Inequality or Gini Index in Spring Valley CDP San Diego County?
Inequality or Gini Index in Spring Valley CDP San Diego County is 0.39.
What is the Total Population of Spring Valley CDP San Diego County?
Total Population of Spring Valley CDP San Diego County is 32,496.
What is the Total Male Population of Spring Valley CDP San Diego County?
Total Male Population of Spring Valley CDP San Diego County is 16,045.
What is the Total Female Population of Spring Valley CDP San Diego County?
Total Female Population of Spring Valley CDP San Diego County is 16,451.
What is the Ratio of Males per 100 Females in Spring Valley CDP San Diego County?
There are 97.53 Males per 100 Females in Spring Valley CDP San Diego County.
What is the Ratio of Females per 100 Males in Spring Valley CDP San Diego County?
There are 102.53 Females per 100 Males in Spring Valley CDP San Diego County.
What is the Median Population Age in Spring Valley CDP San Diego County?
Median Population Age in Spring Valley CDP San Diego County is 35.4 Years.
What is the Average Family Size in Spring Valley CDP San Diego County
Average Family Size in Spring Valley CDP San Diego County is 3.6 People.
What is the Average Household Size in Spring Valley CDP San Diego County
Average Household Size in Spring Valley CDP San Diego County is 3.3 People.
How Large is the Labor Force in Spring Valley CDP San Diego County?
There are 17,237 People in the Labor Forcein in Spring Valley CDP San Diego County.
What is the Percentage of People in the Labor Force in Spring Valley CDP San Diego County?
67.4% of People are in the Labor Force in Spring Valley CDP San Diego County.
What is the Unemployment Rate in Spring Valley CDP San Diego County?
Unemployment Rate in Spring Valley CDP San Diego County is 7.1%.