Corning, CA Map & Demographics
Corning Map
Corning Overview
$21,082
PER CAPITA INCOME
$60,579
AVG FAMILY INCOME
$54,766
AVG HOUSEHOLD INCOME
28.8%
WAGE / INCOME GAP [ % ]
71.2¢/ $1
WAGE / INCOME GAP [ $ ]
0.38
INEQUALITY / GINI INDEX
8,196
TOTAL POPULATION
3,772
MALE POPULATION
4,424
FEMALE POPULATION
85.26
MALES / 100 FEMALES
117.29
FEMALES / 100 MALES
33.3
MEDIAN AGE
3.5
AVG FAMILY SIZE
3.1
AVG HOUSEHOLD SIZE
3,740
LABOR FORCE [ PEOPLE ]
59.9%
PERCENT IN LABOR FORCE
3.6%
UNEMPLOYMENT RATE
Corning Zip Codes
Corning Area Codes
Income in Corning
Income Overview in Corning
Per Capita Income in Corning is $21,082, while median incomes of families and households are $60,579 and $54,766 respectively.
| Characteristic | Number | Measure |
| Per Capita Income | 8,196 | $21,082 |
| Median Family Income | 1,989 | $60,579 |
| Mean Family Income | 1,989 | $68,419 |
| Median Household Income | 2,640 | $54,766 |
| Mean Household Income | 2,640 | $63,248 |
| Income Deficit | 1,989 | $0 |
| Wage / Income Gap (%) | 8,196 | 28.84% |
| Wage / Income Gap ($) | 8,196 | 71.16¢ per $1 |
| Gini / Inequality Index | 8,196 | 0.38 |
Earnings by Sex in Corning
Average Earnings in Corning are $29,844, $36,388 for men and $25,893 for women, a difference of 28.8%.
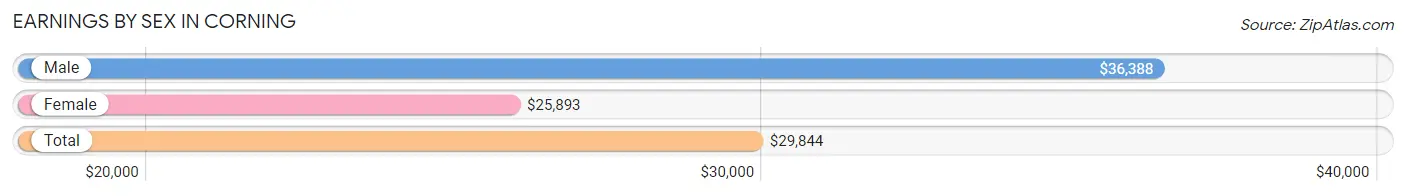
| Sex | Number | Average Earnings |
| Male | 2,023 (51.1%) | $36,388 |
| Female | 1,938 (48.9%) | $25,893 |
| Total | 3,961 (100.0%) | $29,844 |
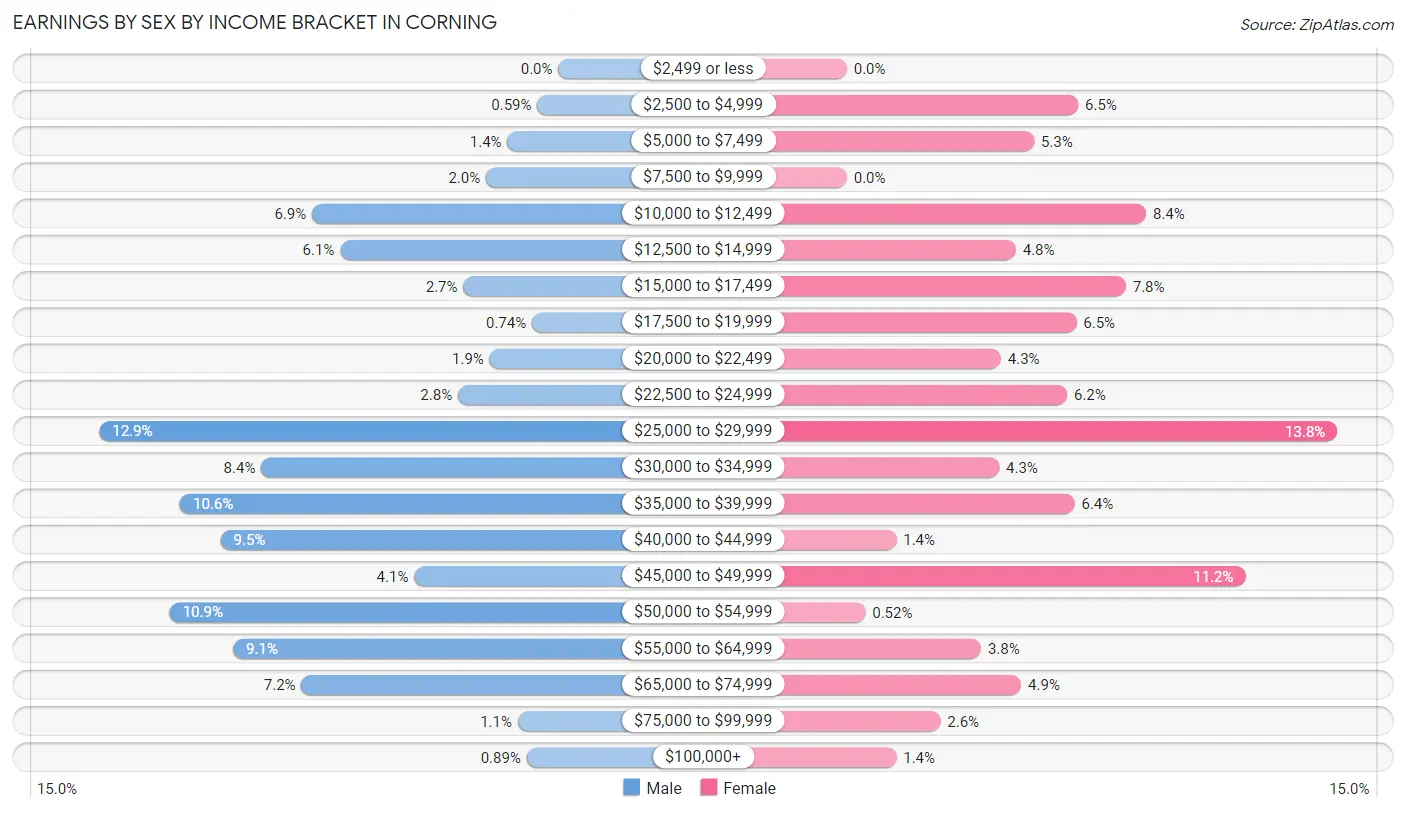
Earnings by Sex by Income Bracket in Corning
The most common earnings brackets in Corning are $25,000 to $29,999 for men (261 | 12.9%) and $25,000 to $29,999 for women (267 | 13.8%).
| Income | Male | Female |
| $2,499 or less | 0 (0.0%) | 0 (0.0%) |
| $2,500 to $4,999 | 12 (0.6%) | 126 (6.5%) |
| $5,000 to $7,499 | 29 (1.4%) | 102 (5.3%) |
| $7,500 to $9,999 | 41 (2.0%) | 0 (0.0%) |
| $10,000 to $12,499 | 140 (6.9%) | 163 (8.4%) |
| $12,500 to $14,999 | 124 (6.1%) | 92 (4.8%) |
| $15,000 to $17,499 | 54 (2.7%) | 152 (7.8%) |
| $17,500 to $19,999 | 15 (0.7%) | 125 (6.5%) |
| $20,000 to $22,499 | 39 (1.9%) | 84 (4.3%) |
| $22,500 to $24,999 | 57 (2.8%) | 120 (6.2%) |
| $25,000 to $29,999 | 261 (12.9%) | 267 (13.8%) |
| $30,000 to $34,999 | 169 (8.4%) | 83 (4.3%) |
| $35,000 to $39,999 | 215 (10.6%) | 124 (6.4%) |
| $40,000 to $44,999 | 192 (9.5%) | 27 (1.4%) |
| $45,000 to $49,999 | 82 (4.1%) | 217 (11.2%) |
| $50,000 to $54,999 | 221 (10.9%) | 10 (0.5%) |
| $55,000 to $64,999 | 185 (9.1%) | 73 (3.8%) |
| $65,000 to $74,999 | 146 (7.2%) | 95 (4.9%) |
| $75,000 to $99,999 | 23 (1.1%) | 51 (2.6%) |
| $100,000+ | 18 (0.9%) | 27 (1.4%) |
| Total | 2,023 (100.0%) | 1,938 (100.0%) |
Earnings by Sex by Educational Attainment in Corning
Average earnings in Corning are $40,340 for men and $28,192 for women, a difference of 30.1%. Men with an educational attainment of bachelor's degree enjoy the highest average annual earnings of $54,946, while those with less than high school education earn the least with $29,286. Women with an educational attainment of college or associate's degree earn the most with the average annual earnings of $39,451, while those with high school diploma education have the smallest earnings of $19,800.
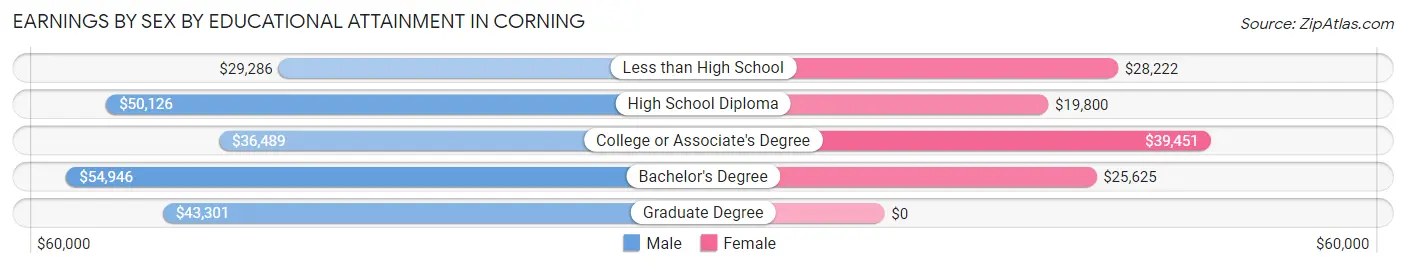
| Educational Attainment | Male Income | Female Income |
| Less than High School | $29,286 | $28,222 |
| High School Diploma | $50,126 | $19,800 |
| College or Associate's Degree | $36,489 | $39,451 |
| Bachelor's Degree | $54,946 | $25,625 |
| Graduate Degree | $43,301 | $0 |
| Total | $40,340 | $28,192 |
Family Income in Corning
Family Income Brackets in Corning
According to the Corning family income data, there are 469 families falling into the $50,000 to $74,999 income range, which is the most common income bracket and makes up 23.6% of all families.
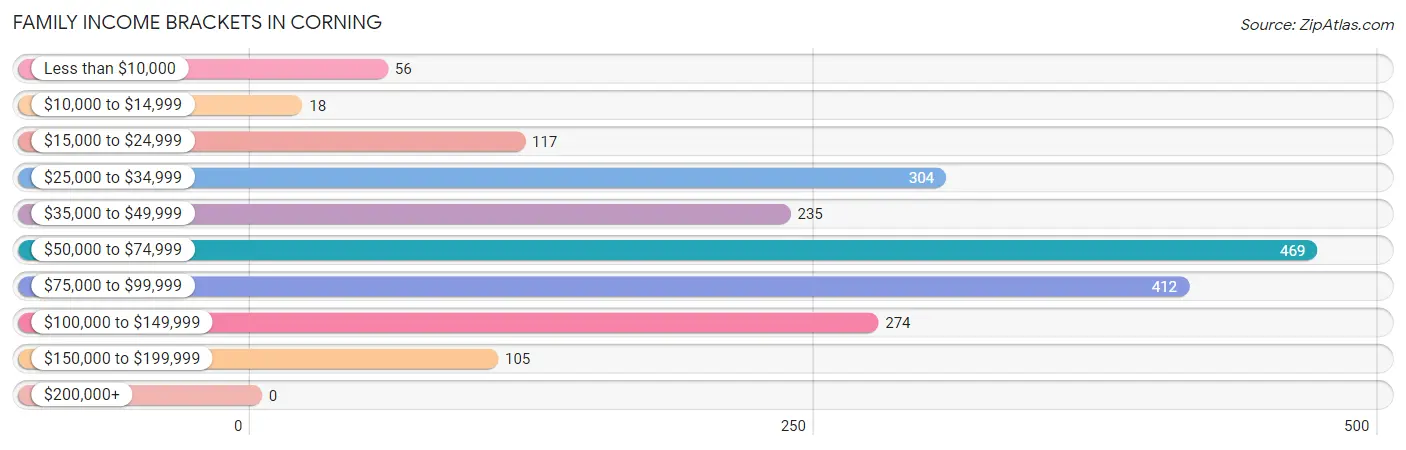
| Income Bracket | # Families | % Families |
| Less than $10,000 | 56 | 2.8% |
| $10,000 to $14,999 | 18 | 0.9% |
| $15,000 to $24,999 | 117 | 5.9% |
| $25,000 to $34,999 | 304 | 15.3% |
| $35,000 to $49,999 | 235 | 11.8% |
| $50,000 to $74,999 | 469 | 23.6% |
| $75,000 to $99,999 | 412 | 20.7% |
| $100,000 to $149,999 | 274 | 13.8% |
| $150,000 to $199,999 | 105 | 5.3% |
| $200,000+ | 0 | 0.0% |
Family Income by Famaliy Size in Corning
5-person families (190 | 9.6%) account for the highest median family income in Corning with $110,987 per family, while 3-person families (372 | 18.7%) have the highest median income of $29,467 per family member.
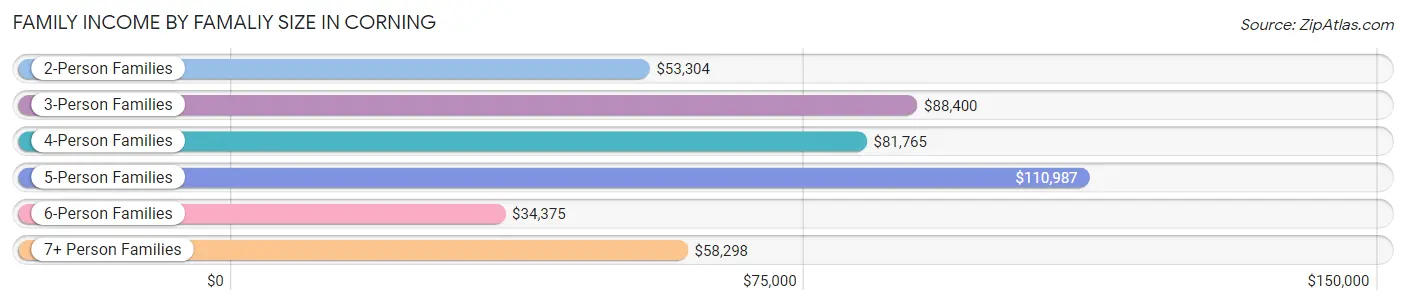
| Income Bracket | # Families | Median Income |
| 2-Person Families | 821 (41.3%) | $53,304 |
| 3-Person Families | 372 (18.7%) | $88,400 |
| 4-Person Families | 368 (18.5%) | $81,765 |
| 5-Person Families | 190 (9.6%) | $110,987 |
| 6-Person Families | 69 (3.5%) | $34,375 |
| 7+ Person Families | 169 (8.5%) | $58,298 |
| Total | 1,989 (100.0%) | $60,579 |
Family Income by Number of Earners in Corning
The median family income in Corning is $60,579, with families comprising 3+ earners (380) having the highest median family income of $112,434, while families with no earners (262) have the lowest median family income of $34,342, accounting for 19.1% and 13.2% of families, respectively.
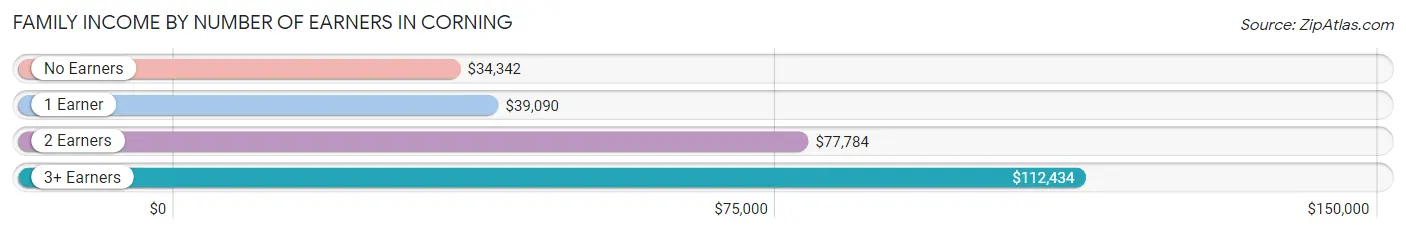
| Number of Earners | # Families | Median Income |
| No Earners | 262 (13.2%) | $34,342 |
| 1 Earner | 599 (30.1%) | $39,090 |
| 2 Earners | 748 (37.6%) | $77,784 |
| 3+ Earners | 380 (19.1%) | $112,434 |
| Total | 1,989 (100.0%) | $60,579 |
Household Income in Corning
Household Income Brackets in Corning
With 618 households falling in the category, the $50,000 to $74,999 income range is the most frequent in Corning, accounting for 23.4% of all households. In contrast, only 11 households (0.4%) fall into the $200,000+ income bracket, making it the least populous group.
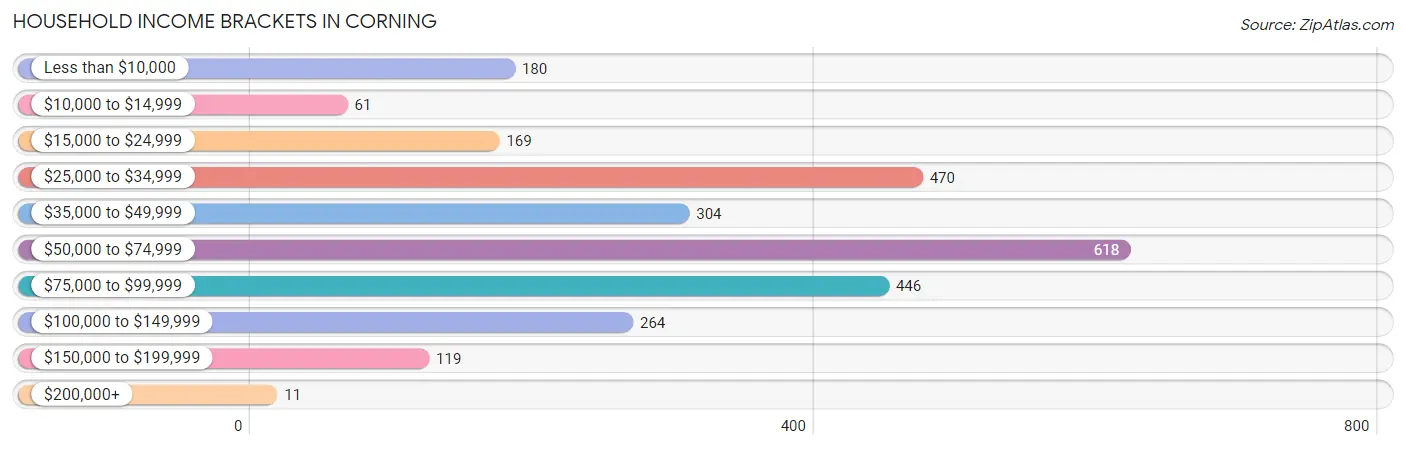
| Income Bracket | # Households | % Households |
| Less than $10,000 | 180 | 6.8% |
| $10,000 to $14,999 | 61 | 2.3% |
| $15,000 to $24,999 | 169 | 6.4% |
| $25,000 to $34,999 | 470 | 17.8% |
| $35,000 to $49,999 | 304 | 11.5% |
| $50,000 to $74,999 | 618 | 23.4% |
| $75,000 to $99,999 | 446 | 16.9% |
| $100,000 to $149,999 | 264 | 10.0% |
| $150,000 to $199,999 | 119 | 4.5% |
| $200,000+ | 11 | 0.4% |
Household Income by Householder Age in Corning
The median household income in Corning is $54,766, with the highest median household income of $63,450 found in the 25 to 44 years age bracket for the primary householder. A total of 1,069 households (40.5%) fall into this category. Meanwhile, the 65+ years age bracket for the primary householder has the lowest median household income of $33,857, with 648 households (24.5%) in this group.
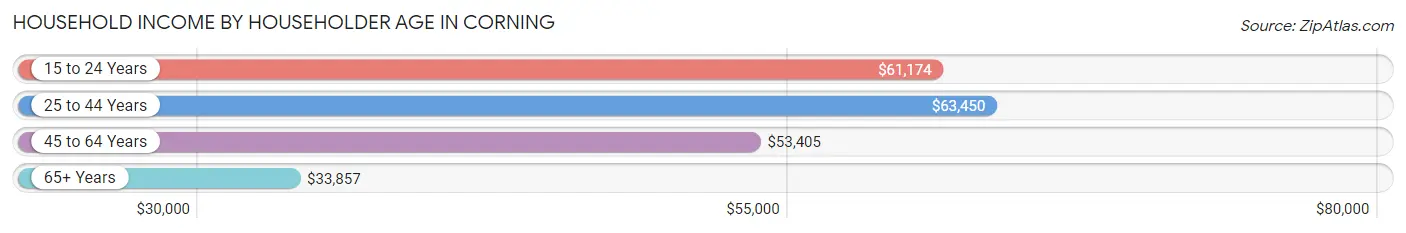
| Income Bracket | # Households | Median Income |
| 15 to 24 Years | 51 (1.9%) | $61,174 |
| 25 to 44 Years | 1,069 (40.5%) | $63,450 |
| 45 to 64 Years | 872 (33.0%) | $53,405 |
| 65+ Years | 648 (24.5%) | $33,857 |
| Total | 2,640 (100.0%) | $54,766 |
Poverty in Corning
Income Below Poverty by Sex and Age in Corning
With 13.5% poverty level for males and 15.9% for females among the residents of Corning, 16 and 17 year old males and 16 and 17 year old females are the most vulnerable to poverty, with 27 males (56.2%) and 66 females (57.4%) in their respective age groups living below the poverty level.
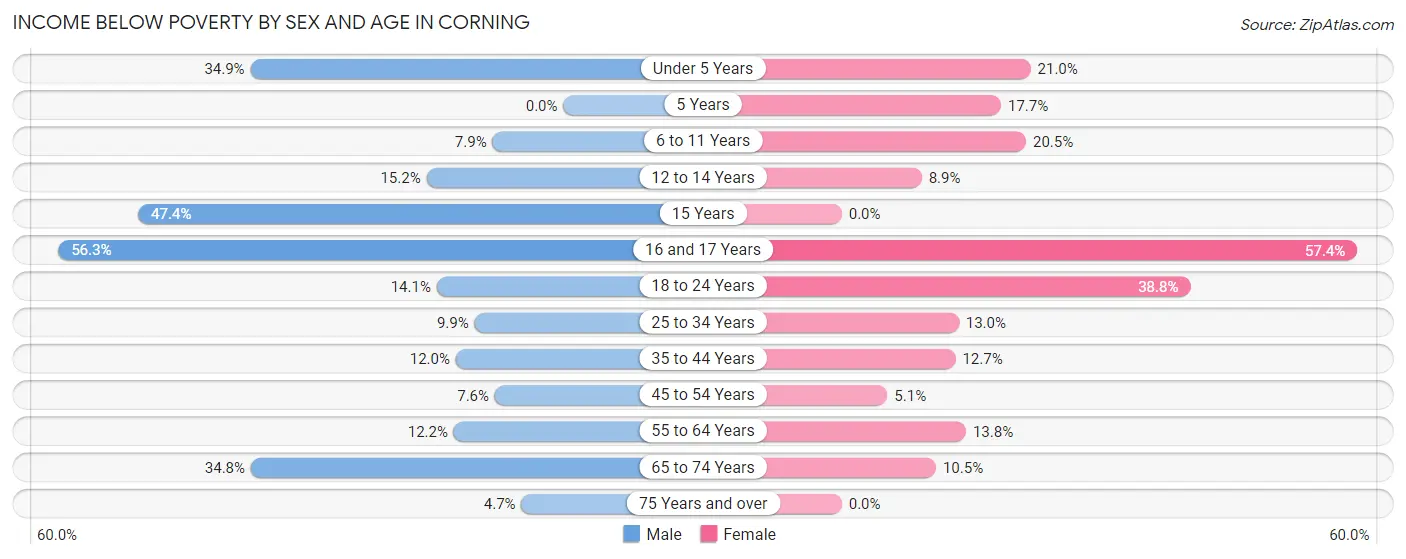
| Age Bracket | Male | Female |
| Under 5 Years | 23 (34.8%) | 94 (21.0%) |
| 5 Years | 0 (0.0%) | 22 (17.7%) |
| 6 to 11 Years | 28 (7.9%) | 55 (20.5%) |
| 12 to 14 Years | 32 (15.2%) | 17 (8.9%) |
| 15 Years | 27 (47.4%) | 0 (0.0%) |
| 16 and 17 Years | 27 (56.2%) | 66 (57.4%) |
| 18 to 24 Years | 54 (14.1%) | 116 (38.8%) |
| 25 to 34 Years | 80 (9.9%) | 110 (13.0%) |
| 35 to 44 Years | 49 (12.0%) | 68 (12.7%) |
| 45 to 54 Years | 28 (7.6%) | 16 (5.1%) |
| 55 to 64 Years | 60 (12.2%) | 96 (13.8%) |
| 65 to 74 Years | 79 (34.8%) | 41 (10.5%) |
| 75 Years and over | 7 (4.7%) | 0 (0.0%) |
| Total | 494 (13.5%) | 701 (15.9%) |
Income Above Poverty by Sex and Age in Corning
According to the poverty statistics in Corning, males aged 5 years and females aged 15 years are the age groups that are most secure financially, with 100.0% of males and 100.0% of females in these age groups living above the poverty line.
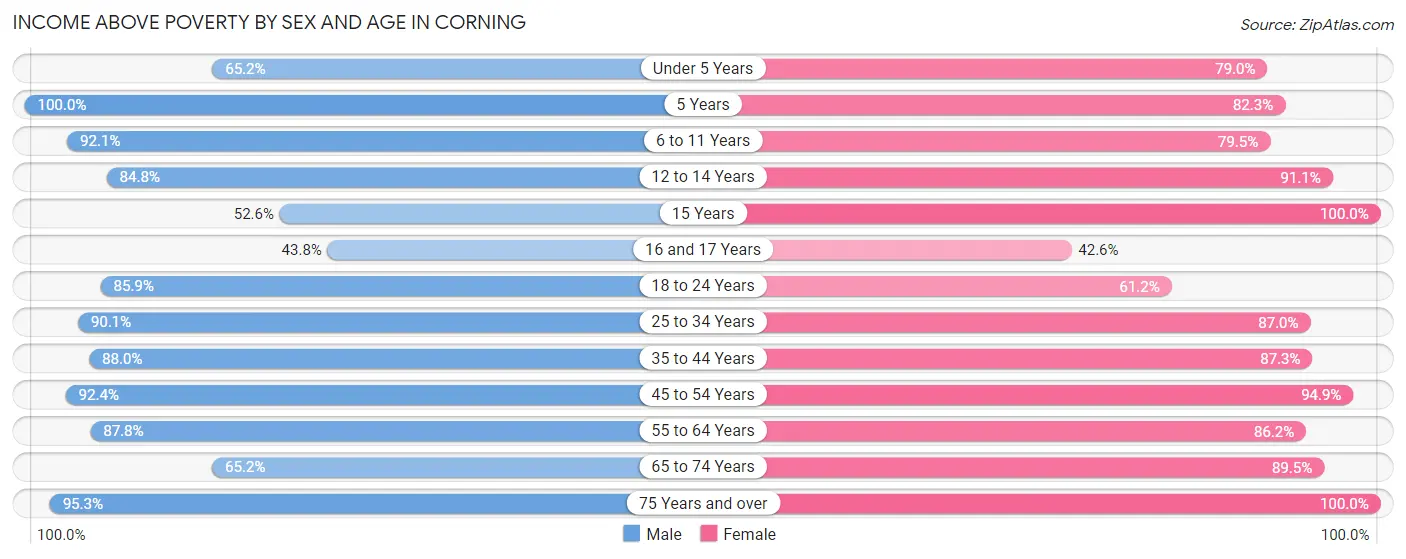
| Age Bracket | Male | Female |
| Under 5 Years | 43 (65.1%) | 353 (79.0%) |
| 5 Years | 84 (100.0%) | 102 (82.3%) |
| 6 to 11 Years | 327 (92.1%) | 213 (79.5%) |
| 12 to 14 Years | 178 (84.8%) | 174 (91.1%) |
| 15 Years | 30 (52.6%) | 35 (100.0%) |
| 16 and 17 Years | 21 (43.8%) | 49 (42.6%) |
| 18 to 24 Years | 329 (85.9%) | 183 (61.2%) |
| 25 to 34 Years | 729 (90.1%) | 734 (87.0%) |
| 35 to 44 Years | 360 (88.0%) | 469 (87.3%) |
| 45 to 54 Years | 339 (92.4%) | 299 (94.9%) |
| 55 to 64 Years | 432 (87.8%) | 598 (86.2%) |
| 65 to 74 Years | 148 (65.2%) | 350 (89.5%) |
| 75 Years and over | 143 (95.3%) | 164 (100.0%) |
| Total | 3,163 (86.5%) | 3,723 (84.2%) |
Income Below Poverty Among Married-Couple Families in Corning
The poverty statistics for married-couple families in Corning show that 7.4% or 99 of the total 1,344 families live below the poverty line. Families with 1 or 2 children have the highest poverty rate of 15.7%, comprising of 87 families. On the other hand, families with no children have the lowest poverty rate of 0.0%, which includes 0 families.
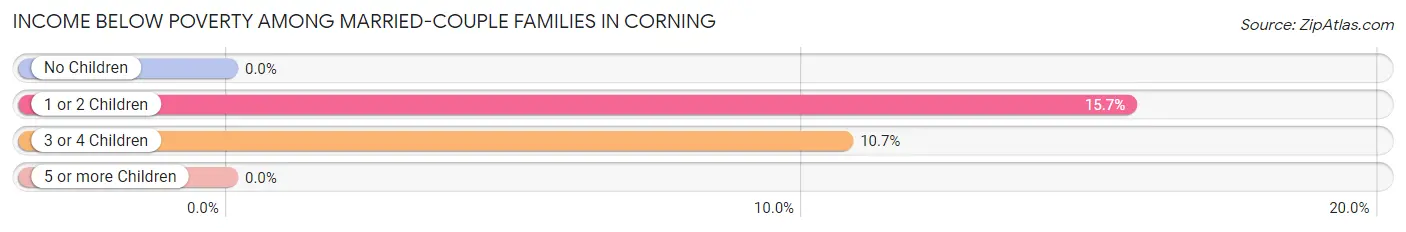
| Children | Above Poverty | Below Poverty |
| No Children | 628 (100.0%) | 0 (0.0%) |
| 1 or 2 Children | 469 (84.4%) | 87 (15.7%) |
| 3 or 4 Children | 100 (89.3%) | 12 (10.7%) |
| 5 or more Children | 48 (100.0%) | 0 (0.0%) |
| Total | 1,245 (92.6%) | 99 (7.4%) |
Income Below Poverty Among Single-Parent Households in Corning
According to the poverty data in Corning, 8.6% or 17 single-father households and 24.8% or 111 single-mother households are living below the poverty line. Among single-father households, those with 1 or 2 children have the highest poverty rate, with 17 households (41.5%) experiencing poverty. Likewise, among single-mother households, those with 3 or 4 children have the highest poverty rate, with 30 households (62.5%) falling below the poverty line.
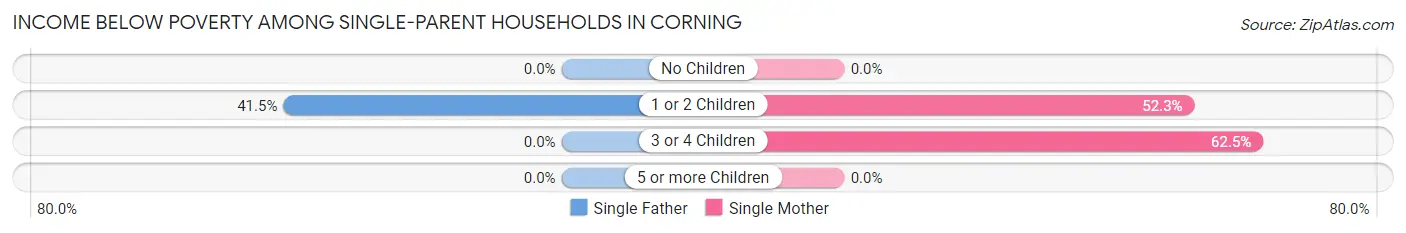
| Children | Single Father | Single Mother |
| No Children | 0 (0.0%) | 0 (0.0%) |
| 1 or 2 Children | 17 (41.5%) | 81 (52.3%) |
| 3 or 4 Children | 0 (0.0%) | 30 (62.5%) |
| 5 or more Children | 0 (0.0%) | 0 (0.0%) |
| Total | 17 (8.6%) | 111 (24.8%) |
Income Below Poverty Among Married-Couple vs Single-Parent Households in Corning
The poverty data for Corning shows that 99 of the married-couple family households (7.4%) and 128 of the single-parent households (19.8%) are living below the poverty level. Within the married-couple family households, those with 1 or 2 children have the highest poverty rate, with 87 households (15.7%) falling below the poverty line. Among the single-parent households, those with 3 or 4 children have the highest poverty rate, with 30 household (62.5%) living below poverty.
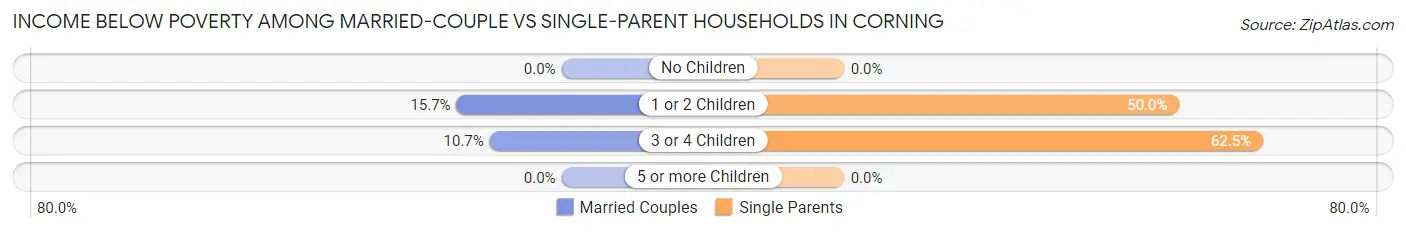
| Children | Married-Couple Families | Single-Parent Households |
| No Children | 0 (0.0%) | 0 (0.0%) |
| 1 or 2 Children | 87 (15.7%) | 98 (50.0%) |
| 3 or 4 Children | 12 (10.7%) | 30 (62.5%) |
| 5 or more Children | 0 (0.0%) | 0 (0.0%) |
| Total | 99 (7.4%) | 128 (19.8%) |
Race in Corning
The most populous races in Corning are White / Caucasian (5,118 | 62.5%), Hispanic or Latino (4,458 | 54.4%), and Some other Race (1,408 | 17.2%).
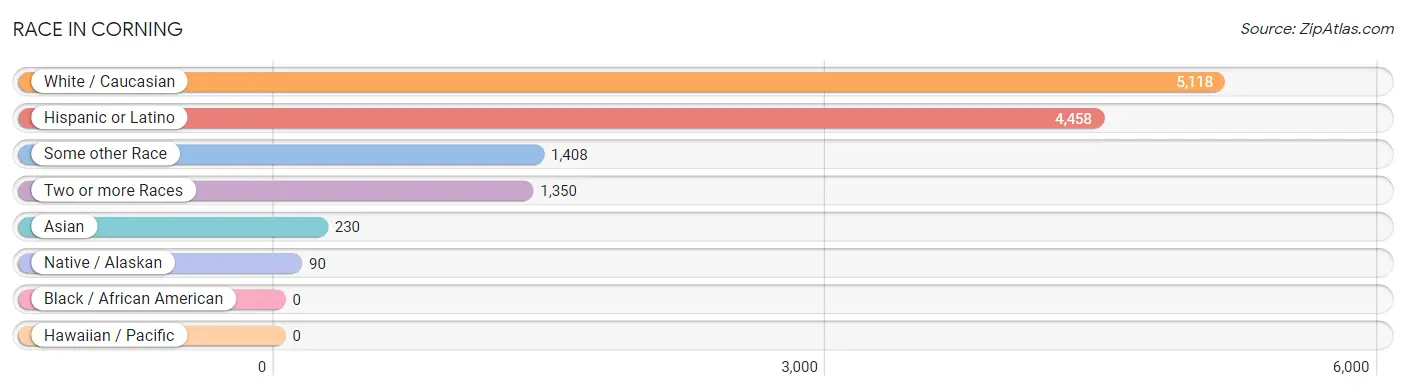
| Race | # Population | % Population |
| Asian | 230 | 2.8% |
| Black / African American | 0 | 0.0% |
| Hawaiian / Pacific | 0 | 0.0% |
| Hispanic or Latino | 4,458 | 54.4% |
| Native / Alaskan | 90 | 1.1% |
| White / Caucasian | 5,118 | 62.5% |
| Two or more Races | 1,350 | 16.5% |
| Some other Race | 1,408 | 17.2% |
| Total | 8,196 | 100.0% |
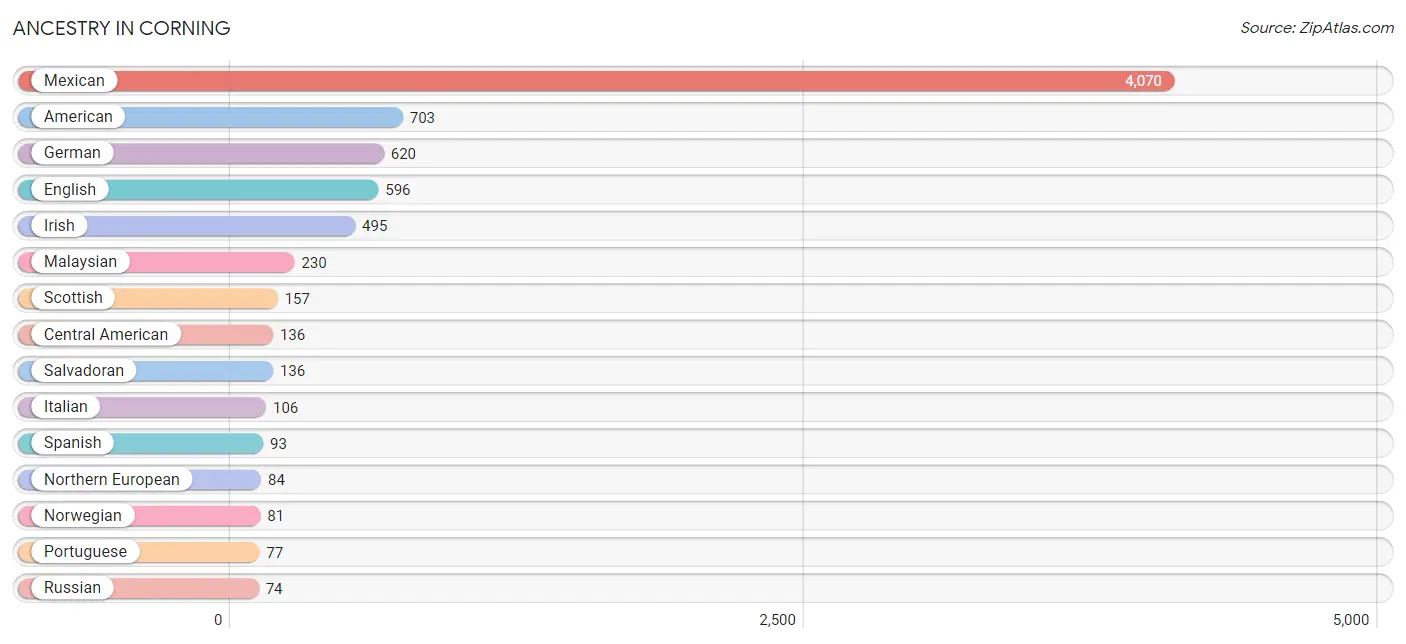
Ancestry in Corning
The most populous ancestries reported in Corning are Mexican (4,070 | 49.7%), American (703 | 8.6%), German (620 | 7.6%), English (596 | 7.3%), and Irish (495 | 6.0%), together accounting for 79.1% of all Corning residents.
| Ancestry | # Population | % Population |
| American | 703 | 8.6% |
| Blackfeet | 11 | 0.1% |
| British | 36 | 0.4% |
| Burmese | 10 | 0.1% |
| Central American | 136 | 1.7% |
| Cherokee | 11 | 0.1% |
| Colombian | 44 | 0.5% |
| Dutch | 10 | 0.1% |
| English | 596 | 7.3% |
| French | 53 | 0.6% |
| German | 620 | 7.6% |
| Greek | 17 | 0.2% |
| Irish | 495 | 6.0% |
| Italian | 106 | 1.3% |
| Korean | 2 | 0.0% |
| Malaysian | 230 | 2.8% |
| Mexican | 4,070 | 49.7% |
| Northern European | 84 | 1.0% |
| Norwegian | 81 | 1.0% |
| Polish | 42 | 0.5% |
| Portuguese | 77 | 0.9% |
| Puerto Rican | 62 | 0.8% |
| Russian | 74 | 0.9% |
| Salvadoran | 136 | 1.7% |
| Scotch-Irish | 50 | 0.6% |
| Scottish | 157 | 1.9% |
| South American | 44 | 0.5% |
| Spaniard | 47 | 0.6% |
| Spanish | 93 | 1.1% |
| Welsh | 30 | 0.4% | View All 30 Rows |
Immigrants in Corning
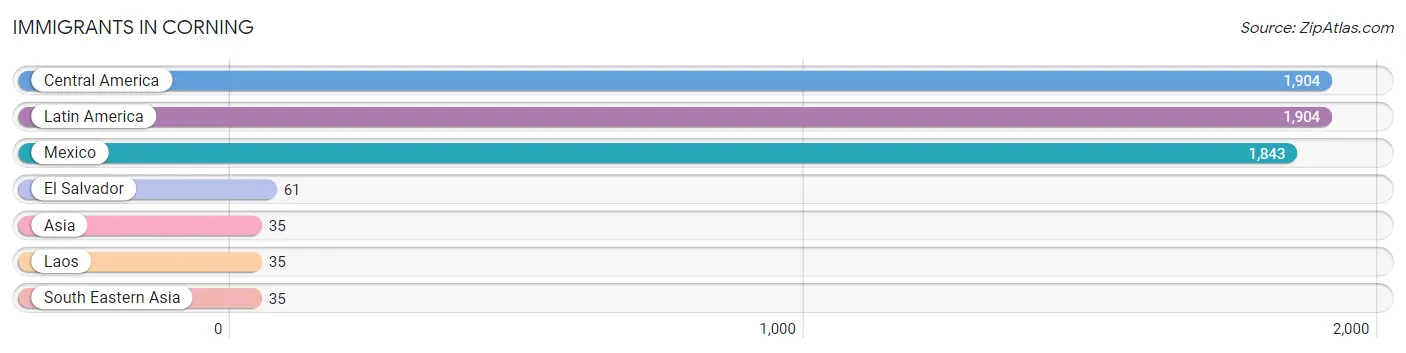
The most numerous immigrant groups reported in Corning came from Central America (1,904 | 23.2%), Latin America (1,904 | 23.2%), Mexico (1,843 | 22.5%), El Salvador (61 | 0.7%), and Asia (35 | 0.4%), together accounting for 70.1% of all Corning residents.
| Immigration Origin | # Population | % Population |
| Asia | 35 | 0.4% |
| Central America | 1,904 | 23.2% |
| El Salvador | 61 | 0.7% |
| Laos | 35 | 0.4% |
| Latin America | 1,904 | 23.2% |
| Mexico | 1,843 | 22.5% |
| South Eastern Asia | 35 | 0.4% | View All 7 Rows |
Sex and Age in Corning
Sex and Age in Corning
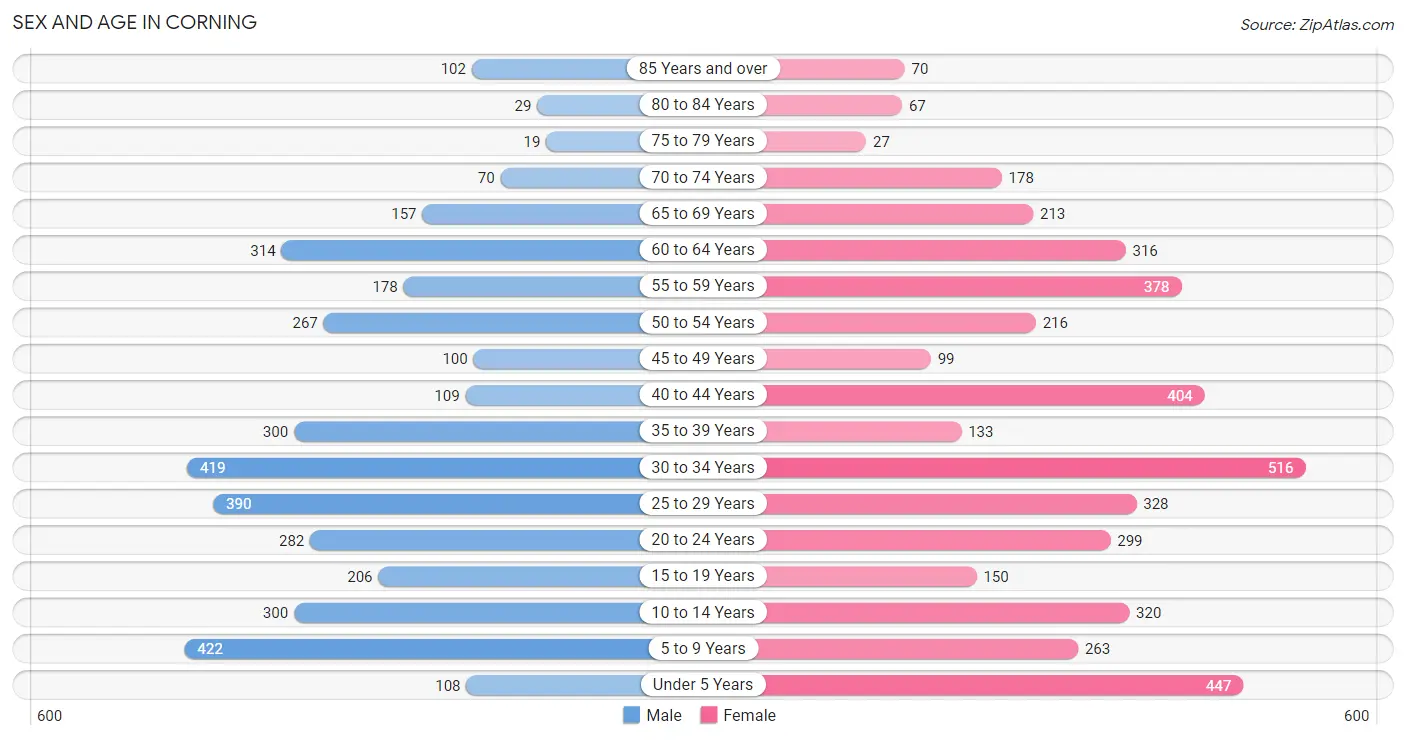
The most populous age groups in Corning are 5 to 9 Years (422 | 11.2%) for men and 30 to 34 Years (516 | 11.7%) for women.
| Age Bracket | Male | Female |
| Under 5 Years | 108 (2.9%) | 447 (10.1%) |
| 5 to 9 Years | 422 (11.2%) | 263 (5.9%) |
| 10 to 14 Years | 300 (8.0%) | 320 (7.2%) |
| 15 to 19 Years | 206 (5.5%) | 150 (3.4%) |
| 20 to 24 Years | 282 (7.5%) | 299 (6.8%) |
| 25 to 29 Years | 390 (10.3%) | 328 (7.4%) |
| 30 to 34 Years | 419 (11.1%) | 516 (11.7%) |
| 35 to 39 Years | 300 (8.0%) | 133 (3.0%) |
| 40 to 44 Years | 109 (2.9%) | 404 (9.1%) |
| 45 to 49 Years | 100 (2.6%) | 99 (2.2%) |
| 50 to 54 Years | 267 (7.1%) | 216 (4.9%) |
| 55 to 59 Years | 178 (4.7%) | 378 (8.5%) |
| 60 to 64 Years | 314 (8.3%) | 316 (7.1%) |
| 65 to 69 Years | 157 (4.2%) | 213 (4.8%) |
| 70 to 74 Years | 70 (1.9%) | 178 (4.0%) |
| 75 to 79 Years | 19 (0.5%) | 27 (0.6%) |
| 80 to 84 Years | 29 (0.8%) | 67 (1.5%) |
| 85 Years and over | 102 (2.7%) | 70 (1.6%) |
| Total | 3,772 (100.0%) | 4,424 (100.0%) |
Families and Households in Corning
Median Family Size in Corning
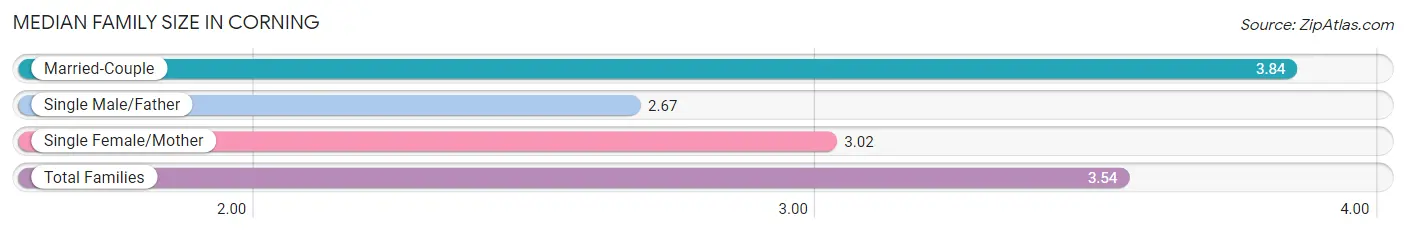
The median family size in Corning is 3.54 persons per family, with married-couple families (1,344 | 67.6%) accounting for the largest median family size of 3.84 persons per family. On the other hand, single male/father families (198 | 10.0%) represent the smallest median family size with 2.67 persons per family.
| Family Type | # Families | Family Size |
| Married-Couple | 1,344 (67.6%) | 3.84 |
| Single Male/Father | 198 (10.0%) | 2.67 |
| Single Female/Mother | 447 (22.5%) | 3.02 |
| Total Families | 1,989 (100.0%) | 3.54 |
Median Household Size in Corning
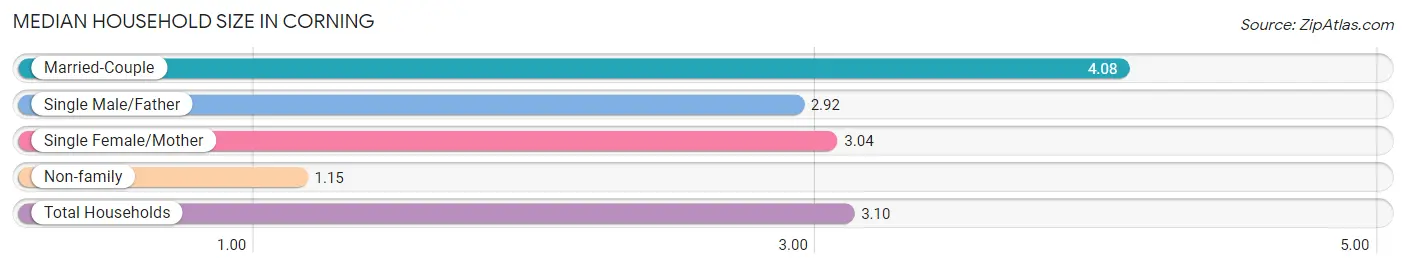
The median household size in Corning is 3.10 persons per household, with married-couple households (1,344 | 50.9%) accounting for the largest median household size of 4.08 persons per household. non-family households (651 | 24.7%) represent the smallest median household size with 1.15 persons per household.
| Household Type | # Households | Household Size |
| Married-Couple | 1,344 (50.9%) | 4.08 |
| Single Male/Father | 198 (7.5%) | 2.92 |
| Single Female/Mother | 447 (16.9%) | 3.04 |
| Non-family | 651 (24.7%) | 1.15 |
| Total Households | 2,640 (100.0%) | 3.10 |
Household Size by Marriage Status in Corning
Out of a total of 2,640 households in Corning, 1,989 (75.3%) are family households, while 651 (24.7%) are nonfamily households. The most numerous type of family households are 2-person households, comprising 756, and the most common type of nonfamily households are 1-person households, comprising 593.
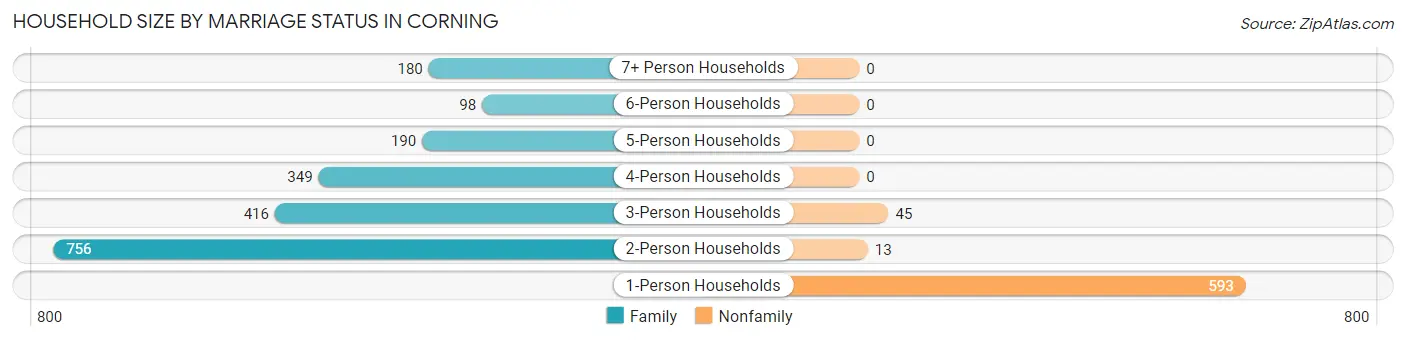
| Household Size | Family Households | Nonfamily Households |
| 1-Person Households | - | 593 (22.5%) |
| 2-Person Households | 756 (28.6%) | 13 (0.5%) |
| 3-Person Households | 416 (15.8%) | 45 (1.7%) |
| 4-Person Households | 349 (13.2%) | 0 (0.0%) |
| 5-Person Households | 190 (7.2%) | 0 (0.0%) |
| 6-Person Households | 98 (3.7%) | 0 (0.0%) |
| 7+ Person Households | 180 (6.8%) | 0 (0.0%) |
| Total | 1,989 (75.3%) | 651 (24.7%) |
Female Fertility in Corning
Fertility by Age in Corning
Average fertility rate in Corning is 71.0 births per 1,000 women. Women in the age bracket of 20 to 34 years have the highest fertility rate with 121.0 births per 1,000 women. Women in the age bracket of 20 to 34 years acount for 100.0% of all women with births.
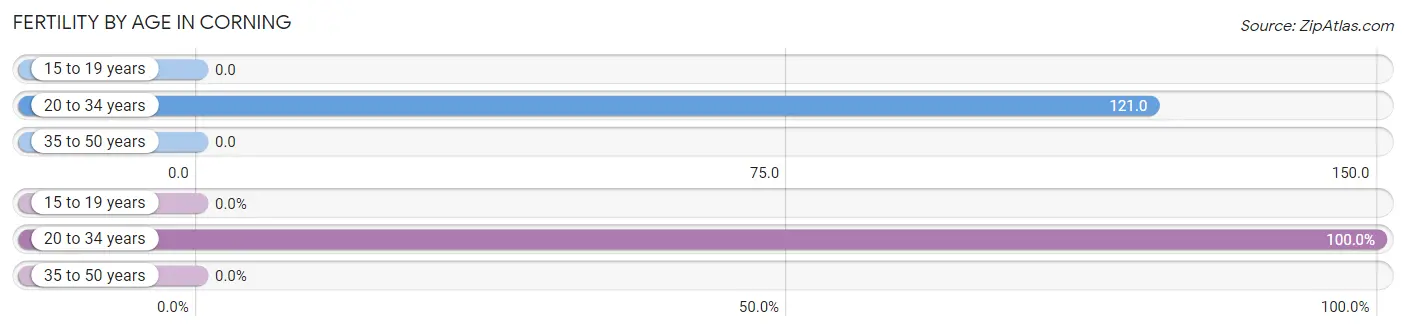
| Age Bracket | Women with Births | Births / 1,000 Women |
| 15 to 19 years | 0 (0.0%) | 0.0 |
| 20 to 34 years | 138 (100.0%) | 121.0 |
| 35 to 50 years | 0 (0.0%) | 0.0 |
| Total | 138 (100.0%) | 71.0 |
Fertility by Age by Marriage Status in Corning
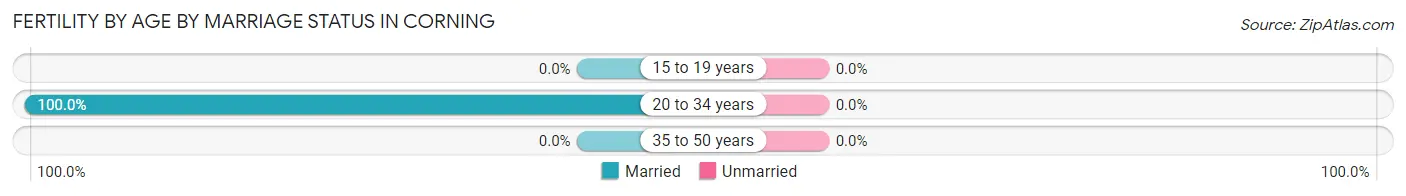
| Age Bracket | Married | Unmarried |
| 15 to 19 years | 0 (0.0%) | 0 (0.0%) |
| 20 to 34 years | 138 (100.0%) | 0 (0.0%) |
| 35 to 50 years | 0 (0.0%) | 0 (0.0%) |
| Total | 138 (100.0%) | 0 (0.0%) |
Fertility by Education in Corning
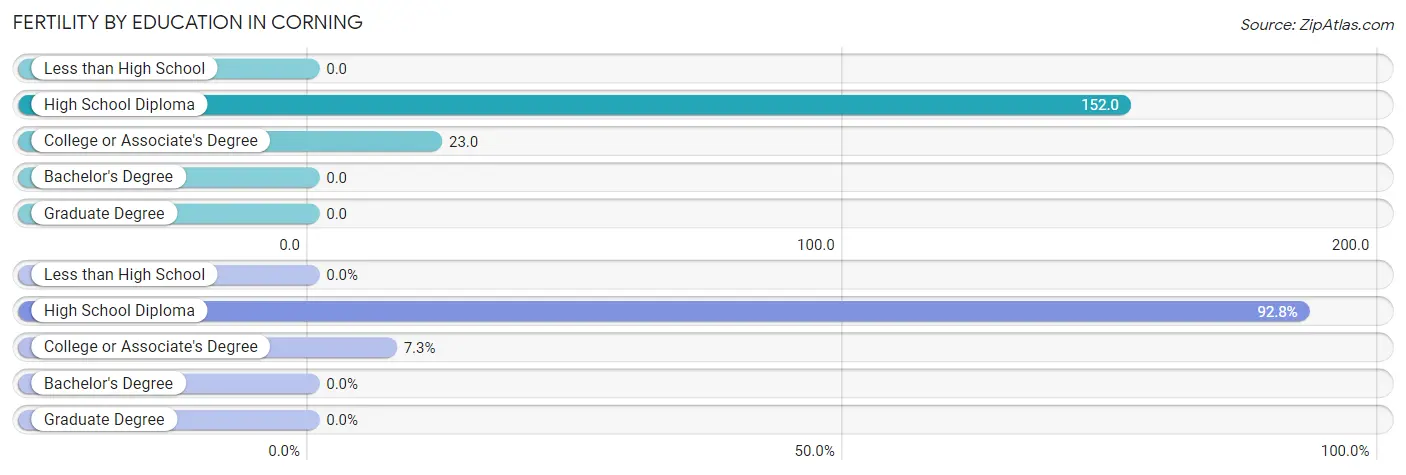
| Educational Attainment | Women with Births | Births / 1,000 Women |
| Less than High School | 0 (0.0%) | 0.0 |
| High School Diploma | 128 (92.7%) | 152.0 |
| College or Associate's Degree | 10 (7.2%) | 23.0 |
| Bachelor's Degree | 0 (0.0%) | 0.0 |
| Graduate Degree | 0 (0.0%) | 0.0 |
| Total | 138 (100.0%) | 71.0 |
Fertility by Education by Marriage Status in Corning
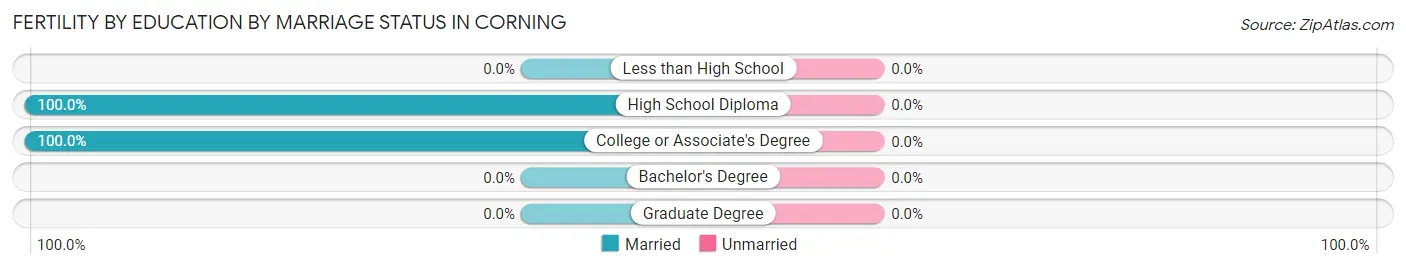
| Educational Attainment | Married | Unmarried |
| Less than High School | 0 (0.0%) | 0 (0.0%) |
| High School Diploma | 128 (100.0%) | 0 (0.0%) |
| College or Associate's Degree | 10 (100.0%) | 0 (0.0%) |
| Bachelor's Degree | 0 (0.0%) | 0 (0.0%) |
| Graduate Degree | 0 (0.0%) | 0 (0.0%) |
| Total | 138 (100.0%) | 0 (0.0%) |
Employment Characteristics in Corning
Employment by Class of Employer in Corning
Among the 3,518 employed individuals in Corning, private company employees (2,258 | 64.2%), local government employees (553 | 15.7%), and state government employees (182 | 5.2%) make up the most common classes of employment.
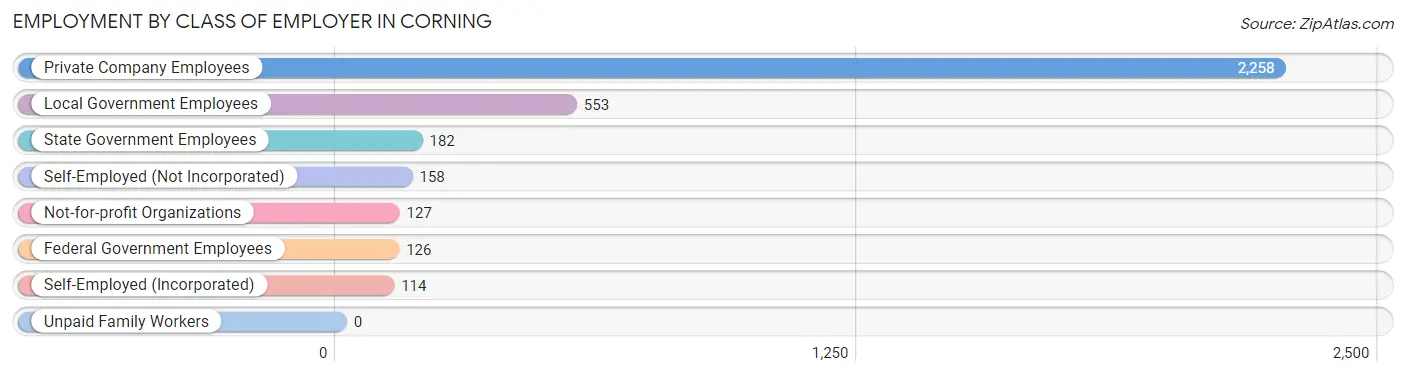
| Employer Class | # Employees | % Employees |
| Private Company Employees | 2,258 | 64.2% |
| Self-Employed (Incorporated) | 114 | 3.2% |
| Self-Employed (Not Incorporated) | 158 | 4.5% |
| Not-for-profit Organizations | 127 | 3.6% |
| Local Government Employees | 553 | 15.7% |
| State Government Employees | 182 | 5.2% |
| Federal Government Employees | 126 | 3.6% |
| Unpaid Family Workers | 0 | 0.0% |
| Total | 3,518 | 100.0% |
Employment Status by Age in Corning
According to the labor force statistics for Corning, out of the total population over 16 years of age (6,244), 59.9% or 3,740 individuals are in the labor force, with 3.6% or 135 of them unemployed. The age group with the highest labor force participation rate is 45 to 54 years, with 88.4% or 603 individuals in the labor force. Within the labor force, the 25 to 29 years age range has the highest percentage of unemployed individuals, with 9.7% or 60 of them being unemployed.
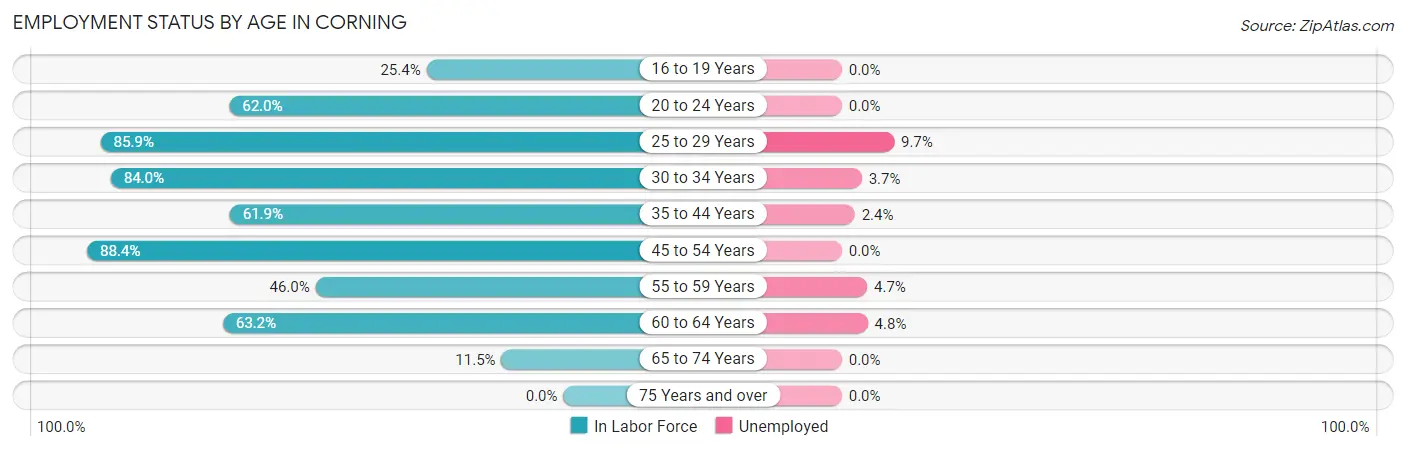
| Age Bracket | In Labor Force | Unemployed |
| 16 to 19 Years | 67 (25.4%) | 0 (0.0%) |
| 20 to 24 Years | 360 (62.0%) | 0 (0.0%) |
| 25 to 29 Years | 617 (85.9%) | 60 (9.7%) |
| 30 to 34 Years | 785 (84.0%) | 29 (3.7%) |
| 35 to 44 Years | 586 (61.9%) | 14 (2.4%) |
| 45 to 54 Years | 603 (88.4%) | 0 (0.0%) |
| 55 to 59 Years | 256 (46.0%) | 12 (4.7%) |
| 60 to 64 Years | 398 (63.2%) | 19 (4.8%) |
| 65 to 74 Years | 71 (11.5%) | 0 (0.0%) |
| 75 Years and over | 0 (0.0%) | 0 (0.0%) |
| Total | 3,740 (59.9%) | 135 (3.6%) |
Employment Status by Educational Attainment in Corning
According to labor force statistics for Corning, 72.6% of individuals (3,243) out of the total population between 25 and 64 years of age (4,467) are in the labor force, with 4.1% or 133 of them being unemployed. The group with the highest labor force participation rate are those with the educational attainment of college / associate degree, with 79.3% or 1,113 individuals in the labor force. Within the labor force, individuals with college / associate degree education have the highest percentage of unemployment, with 4.5% or 50 of them being unemployed.
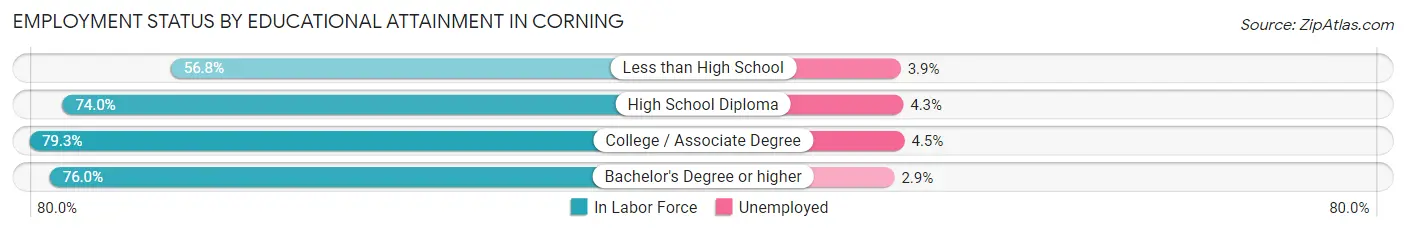
| Educational Attainment | In Labor Force | Unemployed |
| Less than High School | 482 (56.8%) | 33 (3.9%) |
| High School Diploma | 1,242 (74.0%) | 72 (4.3%) |
| College / Associate Degree | 1,113 (79.3%) | 63 (4.5%) |
| Bachelor's Degree or higher | 409 (76.0%) | 16 (2.9%) |
| Total | 3,243 (72.6%) | 183 (4.1%) |
Employment Occupations by Sex in Corning
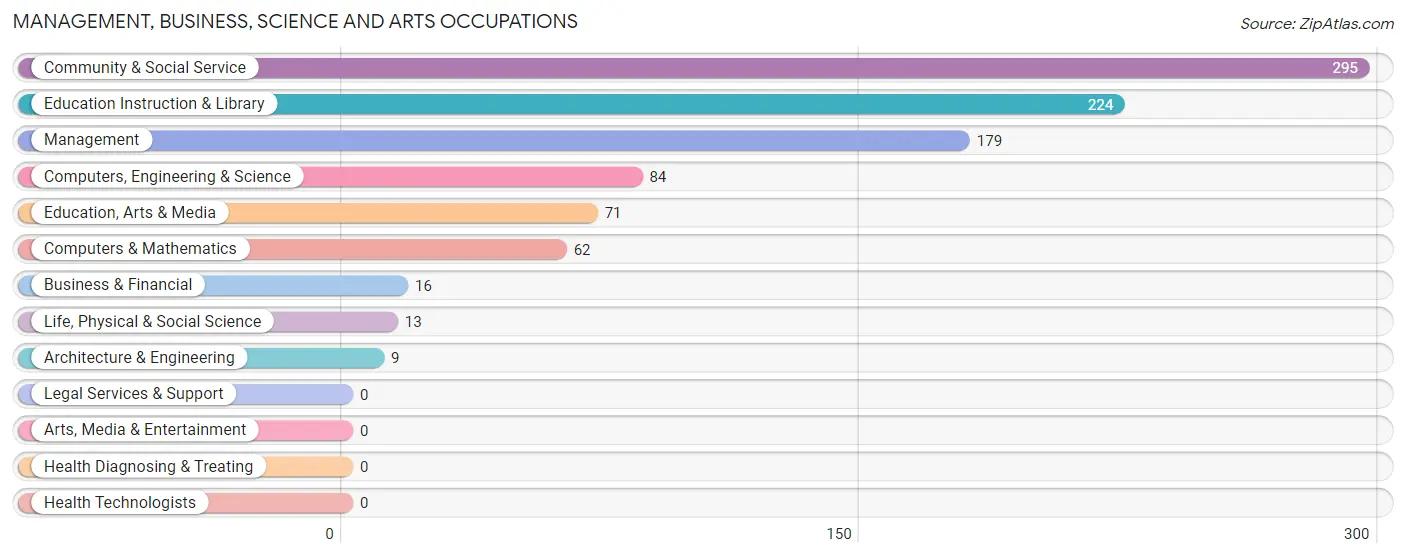
Management, Business, Science and Arts Occupations
The most common Management, Business, Science and Arts occupations in Corning are Community & Social Service (295 | 8.2%), Education Instruction & Library (224 | 6.2%), Management (179 | 5.0%), Computers, Engineering & Science (84 | 2.3%), and Education, Arts & Media (71 | 2.0%).
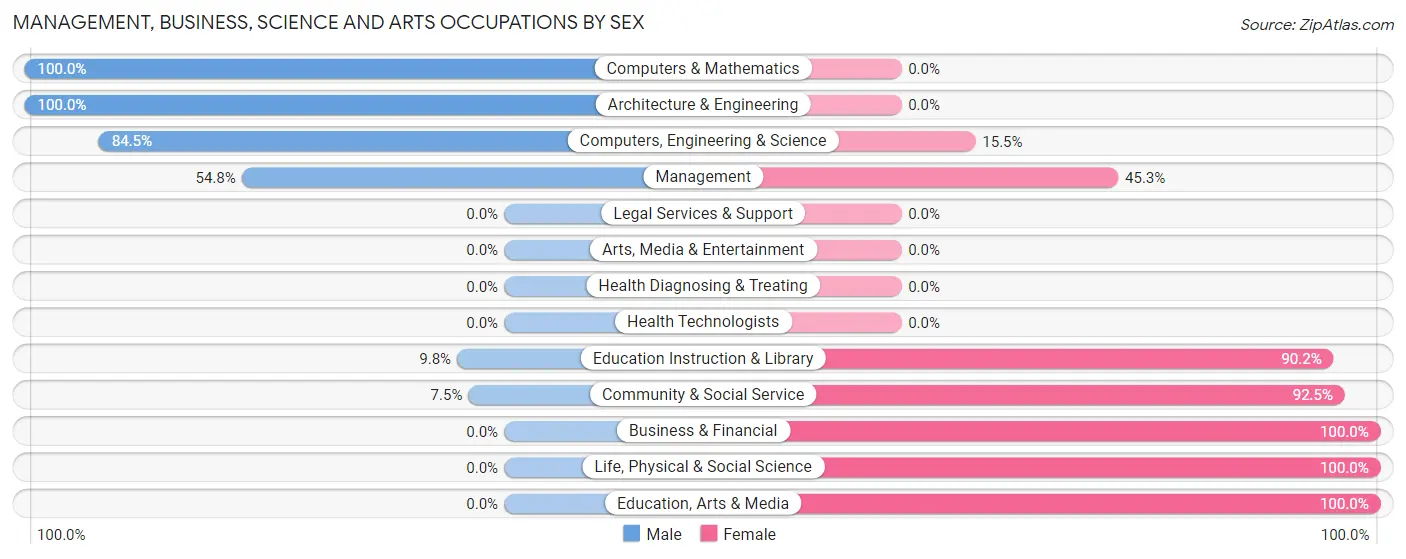
Management, Business, Science and Arts Occupations by Sex
Within the Management, Business, Science and Arts occupations in Corning, the most male-oriented occupations are Computers & Mathematics (100.0%), Architecture & Engineering (100.0%), and Computers, Engineering & Science (84.5%), while the most female-oriented occupations are Business & Financial (100.0%), Life, Physical & Social Science (100.0%), and Education, Arts & Media (100.0%).
| Occupation | Male | Female |
| Management | 98 (54.7%) | 81 (45.3%) |
| Business & Financial | 0 (0.0%) | 16 (100.0%) |
| Computers, Engineering & Science | 71 (84.5%) | 13 (15.5%) |
| Computers & Mathematics | 62 (100.0%) | 0 (0.0%) |
| Architecture & Engineering | 9 (100.0%) | 0 (0.0%) |
| Life, Physical & Social Science | 0 (0.0%) | 13 (100.0%) |
| Community & Social Service | 22 (7.5%) | 273 (92.5%) |
| Education, Arts & Media | 0 (0.0%) | 71 (100.0%) |
| Legal Services & Support | 0 (0.0%) | 0 (0.0%) |
| Education Instruction & Library | 22 (9.8%) | 202 (90.2%) |
| Arts, Media & Entertainment | 0 (0.0%) | 0 (0.0%) |
| Health Diagnosing & Treating | 0 (0.0%) | 0 (0.0%) |
| Health Technologists | 0 (0.0%) | 0 (0.0%) |
| Total (Category) | 191 (33.3%) | 383 (66.7%) |
| Total (Overall) | 1,860 (51.5%) | 1,749 (48.5%) |
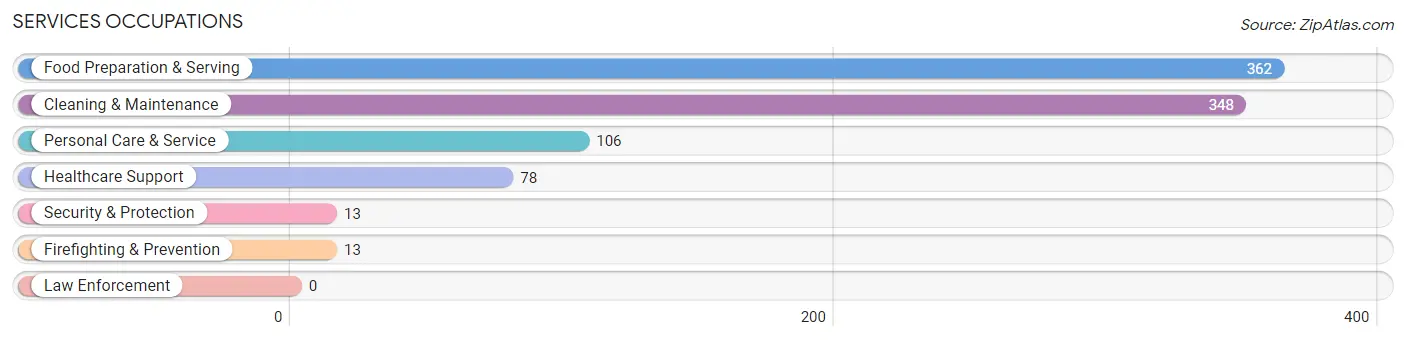
Services Occupations
The most common Services occupations in Corning are Food Preparation & Serving (362 | 10.0%), Cleaning & Maintenance (348 | 9.6%), Personal Care & Service (106 | 2.9%), Healthcare Support (78 | 2.2%), and Security & Protection (13 | 0.4%).
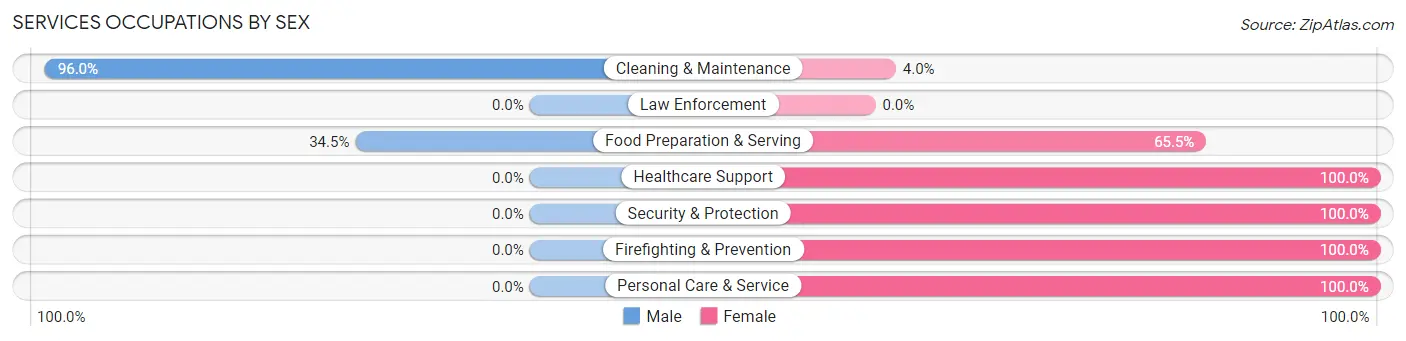
Services Occupations by Sex
Within the Services occupations in Corning, the most male-oriented occupations are Cleaning & Maintenance (96.0%), and Food Preparation & Serving (34.5%), while the most female-oriented occupations are Healthcare Support (100.0%), Security & Protection (100.0%), and Firefighting & Prevention (100.0%).
| Occupation | Male | Female |
| Healthcare Support | 0 (0.0%) | 78 (100.0%) |
| Security & Protection | 0 (0.0%) | 13 (100.0%) |
| Firefighting & Prevention | 0 (0.0%) | 13 (100.0%) |
| Law Enforcement | 0 (0.0%) | 0 (0.0%) |
| Food Preparation & Serving | 125 (34.5%) | 237 (65.5%) |
| Cleaning & Maintenance | 334 (96.0%) | 14 (4.0%) |
| Personal Care & Service | 0 (0.0%) | 106 (100.0%) |
| Total (Category) | 459 (50.6%) | 448 (49.4%) |
| Total (Overall) | 1,860 (51.5%) | 1,749 (48.5%) |
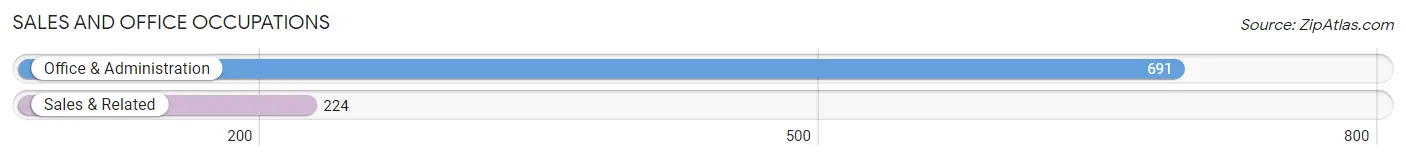
Sales and Office Occupations
The most common Sales and Office occupations in Corning are Office & Administration (691 | 19.2%), and Sales & Related (224 | 6.2%).
Sales and Office Occupations by Sex
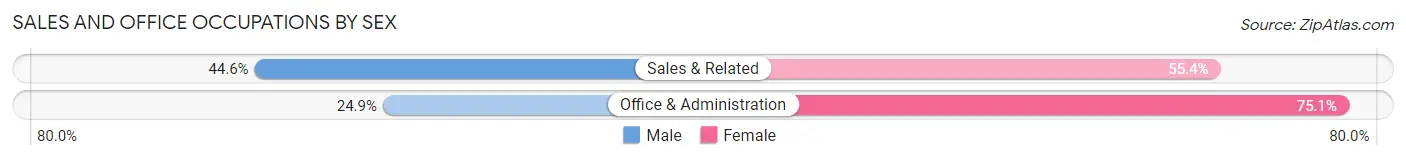
| Occupation | Male | Female |
| Sales & Related | 100 (44.6%) | 124 (55.4%) |
| Office & Administration | 172 (24.9%) | 519 (75.1%) |
| Total (Category) | 272 (29.7%) | 643 (70.3%) |
| Total (Overall) | 1,860 (51.5%) | 1,749 (48.5%) |
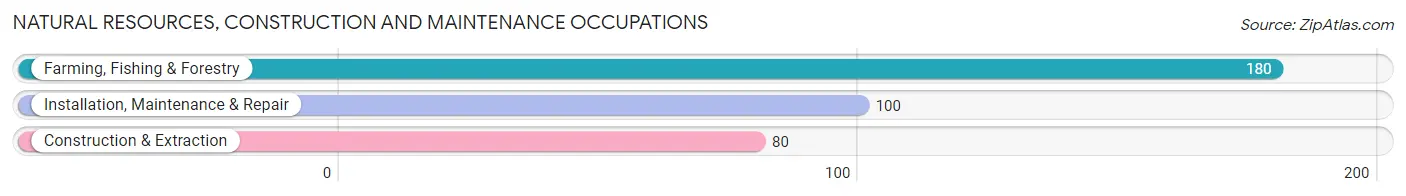
Natural Resources, Construction and Maintenance Occupations
The most common Natural Resources, Construction and Maintenance occupations in Corning are Farming, Fishing & Forestry (180 | 5.0%), Installation, Maintenance & Repair (100 | 2.8%), and Construction & Extraction (80 | 2.2%).
Natural Resources, Construction and Maintenance Occupations by Sex
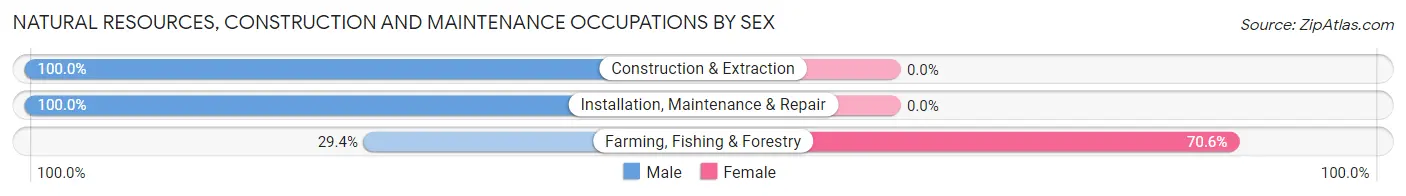
| Occupation | Male | Female |
| Farming, Fishing & Forestry | 53 (29.4%) | 127 (70.6%) |
| Construction & Extraction | 80 (100.0%) | 0 (0.0%) |
| Installation, Maintenance & Repair | 100 (100.0%) | 0 (0.0%) |
| Total (Category) | 233 (64.7%) | 127 (35.3%) |
| Total (Overall) | 1,860 (51.5%) | 1,749 (48.5%) |
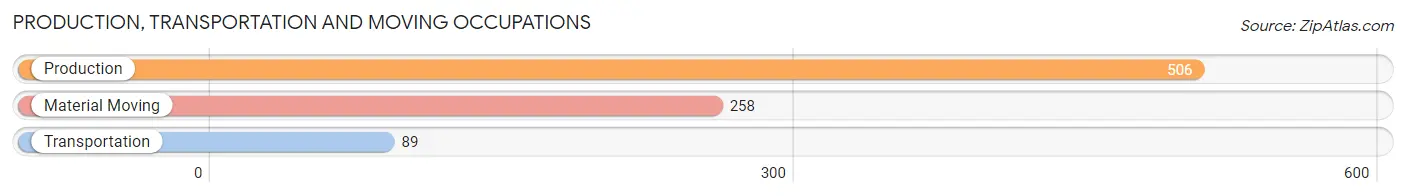
Production, Transportation and Moving Occupations
The most common Production, Transportation and Moving occupations in Corning are Production (506 | 14.0%), Material Moving (258 | 7.1%), and Transportation (89 | 2.5%).
Production, Transportation and Moving Occupations by Sex
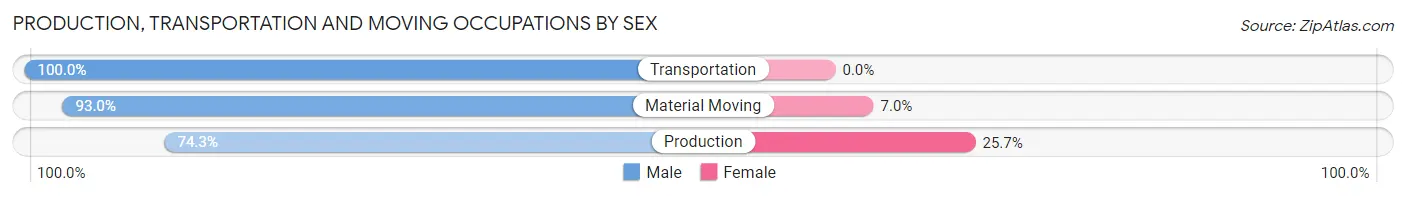
| Occupation | Male | Female |
| Production | 376 (74.3%) | 130 (25.7%) |
| Transportation | 89 (100.0%) | 0 (0.0%) |
| Material Moving | 240 (93.0%) | 18 (7.0%) |
| Total (Category) | 705 (82.7%) | 148 (17.3%) |
| Total (Overall) | 1,860 (51.5%) | 1,749 (48.5%) |
Employment Industries by Sex in Corning
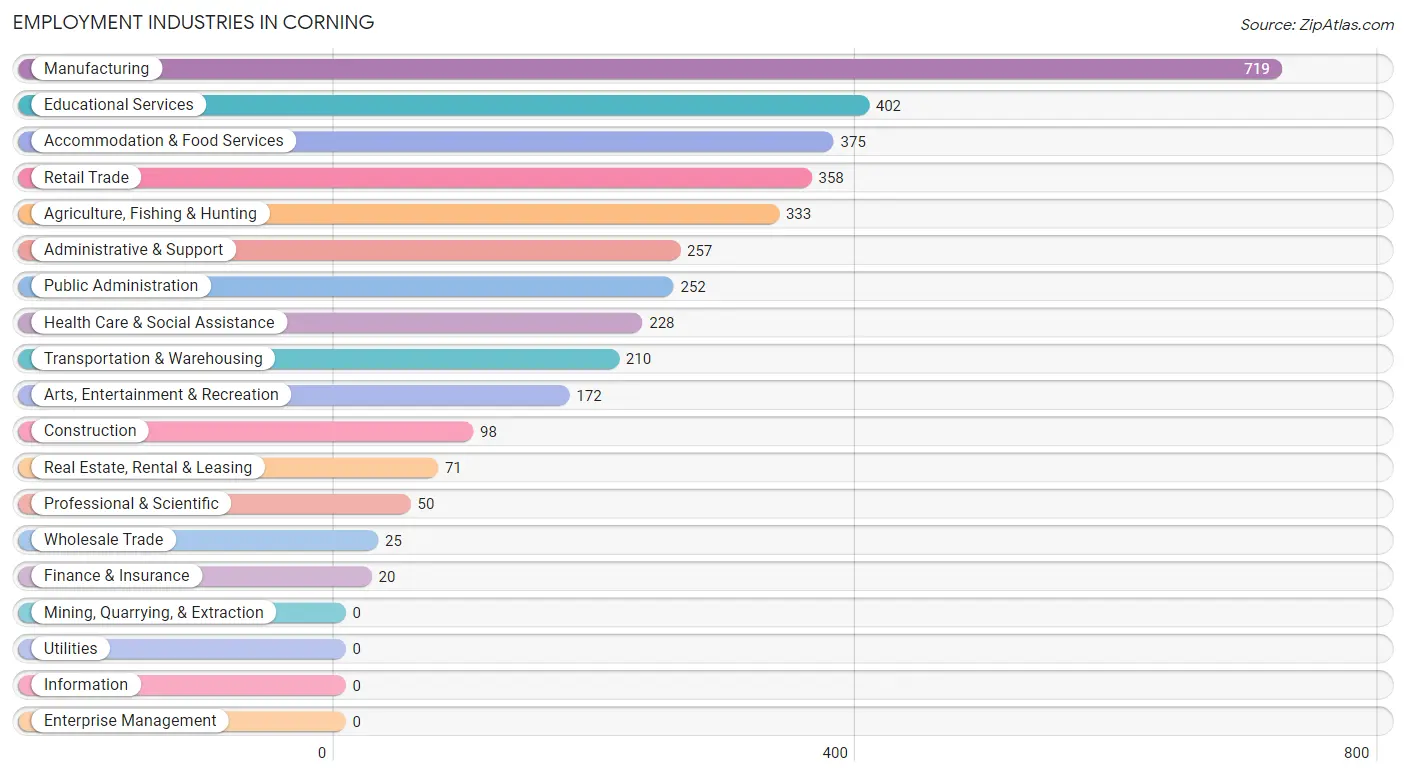
Employment Industries in Corning
The major employment industries in Corning include Manufacturing (719 | 19.9%), Educational Services (402 | 11.1%), Accommodation & Food Services (375 | 10.4%), Retail Trade (358 | 9.9%), and Agriculture, Fishing & Hunting (333 | 9.2%).
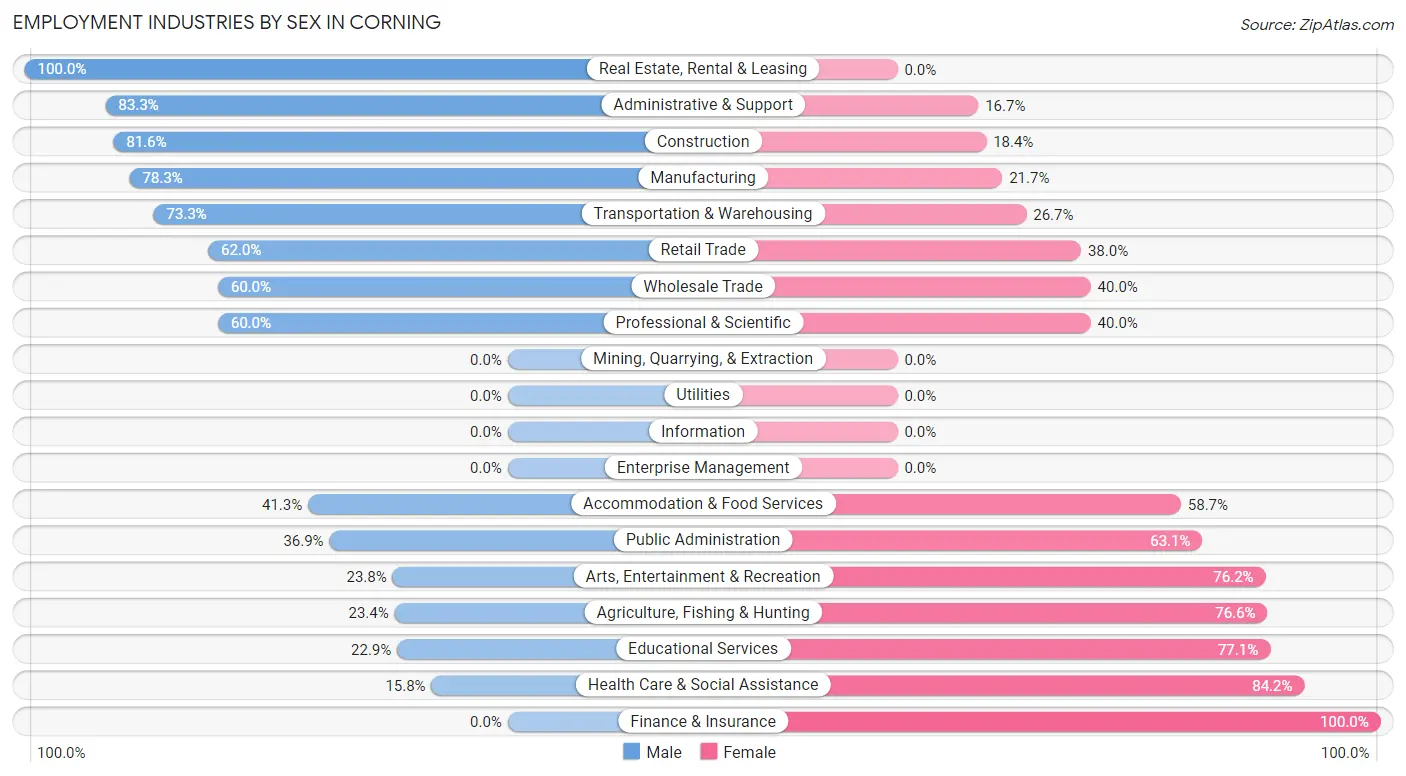
Employment Industries by Sex in Corning
The Corning industries that see more men than women are Real Estate, Rental & Leasing (100.0%), Administrative & Support (83.3%), and Construction (81.6%), whereas the industries that tend to have a higher number of women are Finance & Insurance (100.0%), Health Care & Social Assistance (84.2%), and Educational Services (77.1%).
| Industry | Male | Female |
| Agriculture, Fishing & Hunting | 78 (23.4%) | 255 (76.6%) |
| Mining, Quarrying, & Extraction | 0 (0.0%) | 0 (0.0%) |
| Construction | 80 (81.6%) | 18 (18.4%) |
| Manufacturing | 563 (78.3%) | 156 (21.7%) |
| Wholesale Trade | 15 (60.0%) | 10 (40.0%) |
| Retail Trade | 222 (62.0%) | 136 (38.0%) |
| Transportation & Warehousing | 154 (73.3%) | 56 (26.7%) |
| Utilities | 0 (0.0%) | 0 (0.0%) |
| Information | 0 (0.0%) | 0 (0.0%) |
| Finance & Insurance | 0 (0.0%) | 20 (100.0%) |
| Real Estate, Rental & Leasing | 71 (100.0%) | 0 (0.0%) |
| Professional & Scientific | 30 (60.0%) | 20 (40.0%) |
| Enterprise Management | 0 (0.0%) | 0 (0.0%) |
| Administrative & Support | 214 (83.3%) | 43 (16.7%) |
| Educational Services | 92 (22.9%) | 310 (77.1%) |
| Health Care & Social Assistance | 36 (15.8%) | 192 (84.2%) |
| Arts, Entertainment & Recreation | 41 (23.8%) | 131 (76.2%) |
| Accommodation & Food Services | 155 (41.3%) | 220 (58.7%) |
| Public Administration | 93 (36.9%) | 159 (63.1%) |
| Total | 1,860 (51.5%) | 1,749 (48.5%) |
Education in Corning
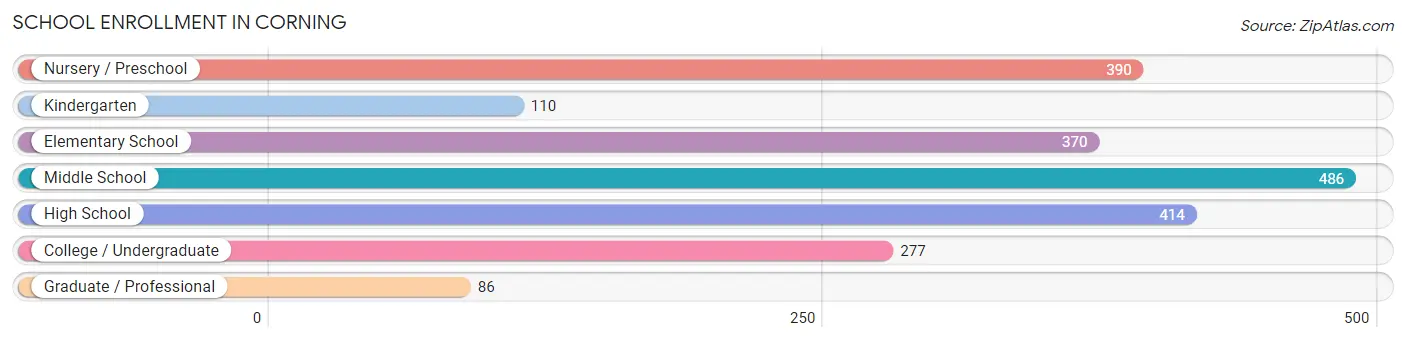
School Enrollment in Corning
The most common levels of schooling among the 2,133 students in Corning are middle school (486 | 22.8%), high school (414 | 19.4%), and nursery / preschool (390 | 18.3%).
| School Level | # Students | % Students |
| Nursery / Preschool | 390 | 18.3% |
| Kindergarten | 110 | 5.2% |
| Elementary School | 370 | 17.3% |
| Middle School | 486 | 22.8% |
| High School | 414 | 19.4% |
| College / Undergraduate | 277 | 13.0% |
| Graduate / Professional | 86 | 4.0% |
| Total | 2,133 | 100.0% |
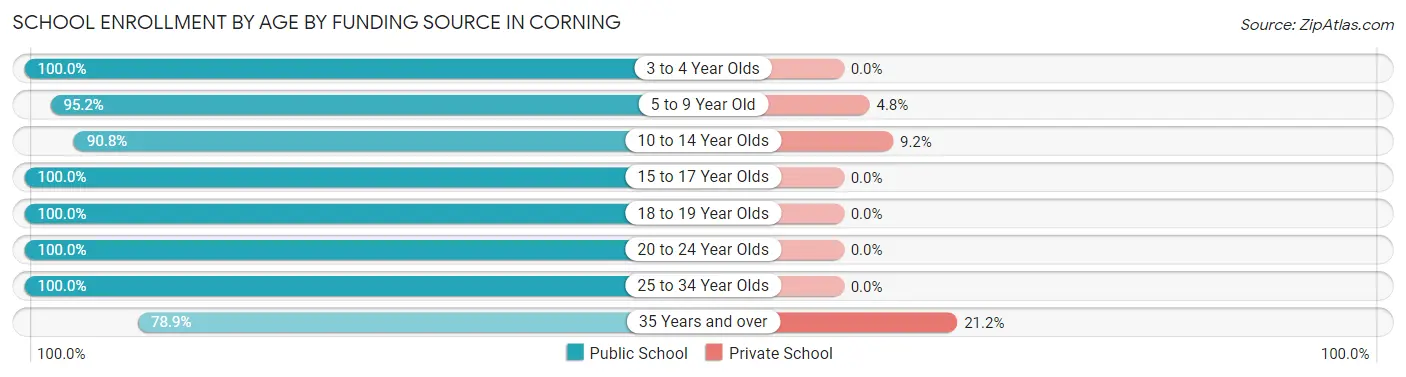
School Enrollment by Age by Funding Source in Corning
Out of a total of 2,133 students who are enrolled in schools in Corning, 100 (4.7%) attend a private institution, while the remaining 2,033 (95.3%) are enrolled in public schools. The age group of 35 years and over has the highest likelihood of being enrolled in private schools, with 11 (21.1% in the age bracket) enrolled. Conversely, the age group of 3 to 4 year olds has the lowest likelihood of being enrolled in a private school, with 192 (100.0% in the age bracket) attending a public institution.
| Age Bracket | Public School | Private School |
| 3 to 4 Year Olds | 192 (100.0%) | 0 (0.0%) |
| 5 to 9 Year Old | 632 (95.2%) | 32 (4.8%) |
| 10 to 14 Year Olds | 563 (90.8%) | 57 (9.2%) |
| 15 to 17 Year Olds | 225 (100.0%) | 0 (0.0%) |
| 18 to 19 Year Olds | 76 (100.0%) | 0 (0.0%) |
| 20 to 24 Year Olds | 73 (100.0%) | 0 (0.0%) |
| 25 to 34 Year Olds | 231 (100.0%) | 0 (0.0%) |
| 35 Years and over | 41 (78.8%) | 11 (21.1%) |
| Total | 2,033 (95.3%) | 100 (4.7%) |
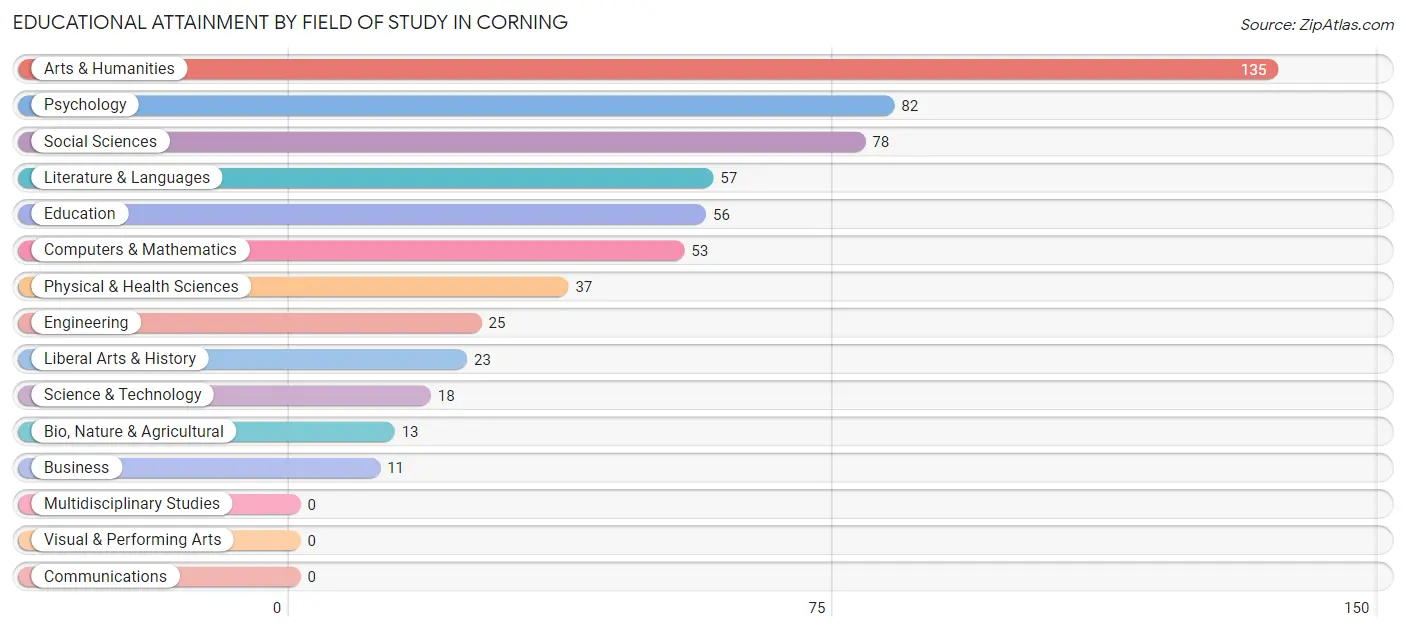
Educational Attainment by Field of Study in Corning
Arts & humanities (135 | 23.0%), psychology (82 | 14.0%), social sciences (78 | 13.3%), literature & languages (57 | 9.7%), and education (56 | 9.5%) are the most common fields of study among 588 individuals in Corning who have obtained a bachelor's degree or higher.
| Field of Study | # Graduates | % Graduates |
| Computers & Mathematics | 53 | 9.0% |
| Bio, Nature & Agricultural | 13 | 2.2% |
| Physical & Health Sciences | 37 | 6.3% |
| Psychology | 82 | 14.0% |
| Social Sciences | 78 | 13.3% |
| Engineering | 25 | 4.3% |
| Multidisciplinary Studies | 0 | 0.0% |
| Science & Technology | 18 | 3.1% |
| Business | 11 | 1.9% |
| Education | 56 | 9.5% |
| Literature & Languages | 57 | 9.7% |
| Liberal Arts & History | 23 | 3.9% |
| Visual & Performing Arts | 0 | 0.0% |
| Communications | 0 | 0.0% |
| Arts & Humanities | 135 | 23.0% |
| Total | 588 | 100.0% |
Transportation & Commute in Corning
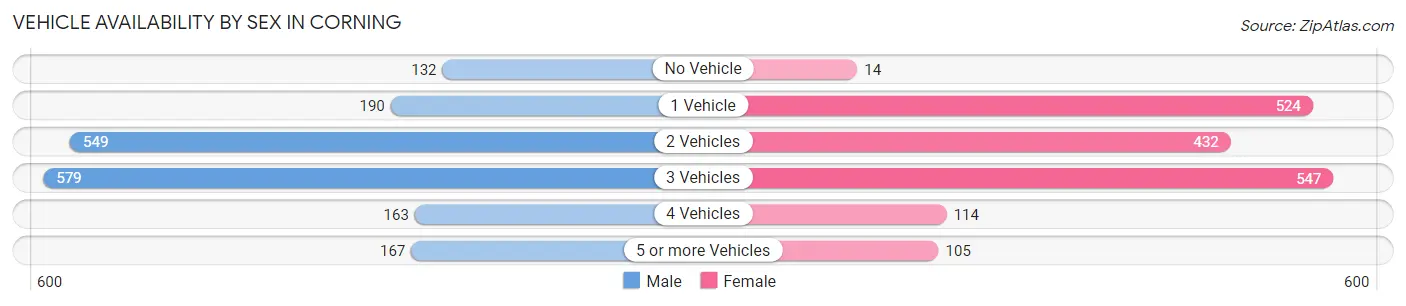
Vehicle Availability by Sex in Corning
The most prevalent vehicle ownership categories in Corning are males with 3 vehicles (579, accounting for 32.5%) and females with 3 vehicles (547, making up 33.4%).
| Vehicles Available | Male | Female |
| No Vehicle | 132 (7.4%) | 14 (0.8%) |
| 1 Vehicle | 190 (10.7%) | 524 (30.2%) |
| 2 Vehicles | 549 (30.8%) | 432 (24.9%) |
| 3 Vehicles | 579 (32.5%) | 547 (31.5%) |
| 4 Vehicles | 163 (9.2%) | 114 (6.6%) |
| 5 or more Vehicles | 167 (9.4%) | 105 (6.0%) |
| Total | 1,780 (100.0%) | 1,736 (100.0%) |
Commute Time in Corning
The most frequently occuring commute durations in Corning are 5 to 9 minutes (1,004 commuters, 29.3%), 15 to 19 minutes (518 commuters, 15.1%), and 10 to 14 minutes (399 commuters, 11.7%).
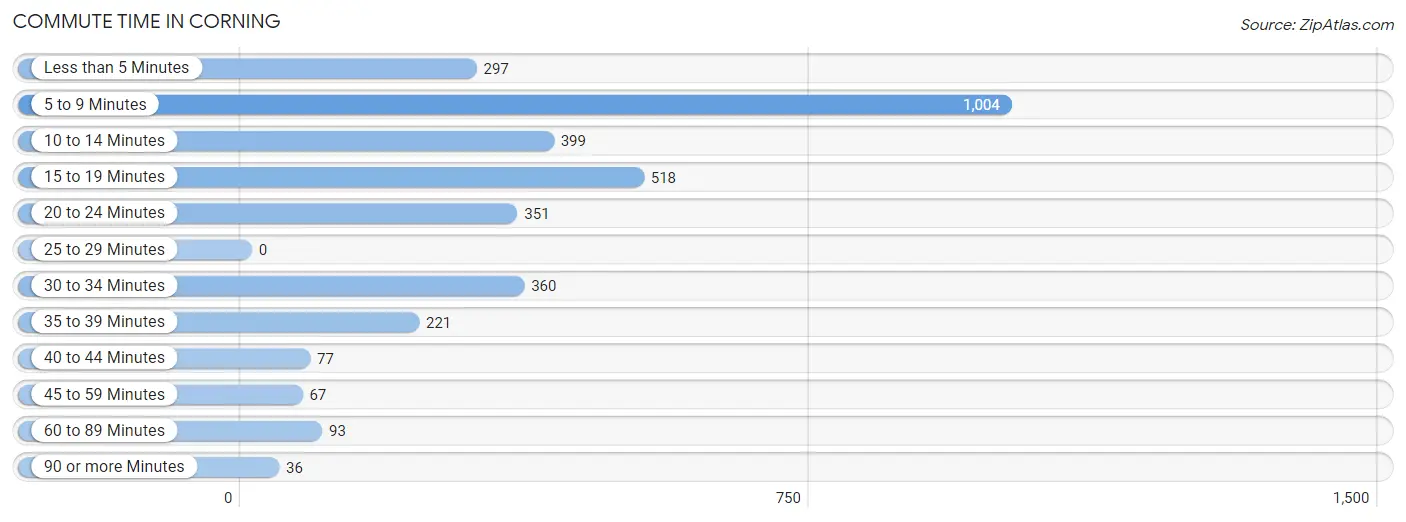
| Commute Time | # Commuters | % Commuters |
| Less than 5 Minutes | 297 | 8.7% |
| 5 to 9 Minutes | 1,004 | 29.3% |
| 10 to 14 Minutes | 399 | 11.7% |
| 15 to 19 Minutes | 518 | 15.1% |
| 20 to 24 Minutes | 351 | 10.2% |
| 25 to 29 Minutes | 0 | 0.0% |
| 30 to 34 Minutes | 360 | 10.5% |
| 35 to 39 Minutes | 221 | 6.5% |
| 40 to 44 Minutes | 77 | 2.2% |
| 45 to 59 Minutes | 67 | 2.0% |
| 60 to 89 Minutes | 93 | 2.7% |
| 90 or more Minutes | 36 | 1.1% |
Commute Time by Sex in Corning
The most common commute times in Corning are 5 to 9 minutes (444 commuters, 25.1%) for males and 5 to 9 minutes (560 commuters, 33.9%) for females.
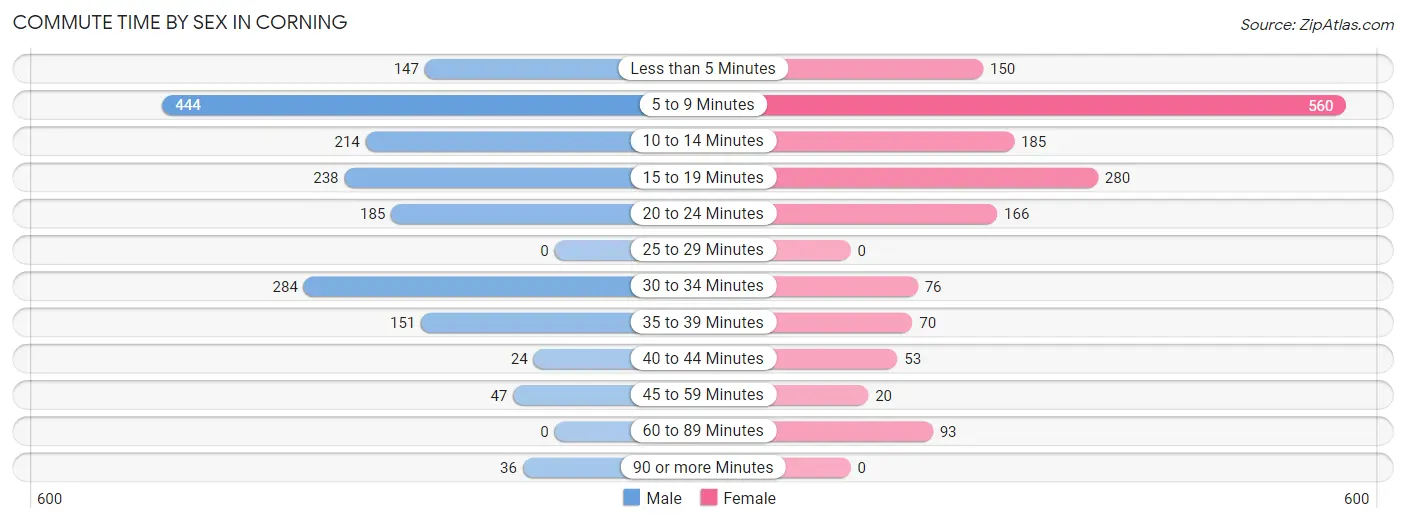
| Commute Time | Male | Female |
| Less than 5 Minutes | 147 (8.3%) | 150 (9.1%) |
| 5 to 9 Minutes | 444 (25.1%) | 560 (33.9%) |
| 10 to 14 Minutes | 214 (12.1%) | 185 (11.2%) |
| 15 to 19 Minutes | 238 (13.5%) | 280 (16.9%) |
| 20 to 24 Minutes | 185 (10.4%) | 166 (10.0%) |
| 25 to 29 Minutes | 0 (0.0%) | 0 (0.0%) |
| 30 to 34 Minutes | 284 (16.1%) | 76 (4.6%) |
| 35 to 39 Minutes | 151 (8.5%) | 70 (4.2%) |
| 40 to 44 Minutes | 24 (1.4%) | 53 (3.2%) |
| 45 to 59 Minutes | 47 (2.7%) | 20 (1.2%) |
| 60 to 89 Minutes | 0 (0.0%) | 93 (5.6%) |
| 90 or more Minutes | 36 (2.0%) | 0 (0.0%) |
Time of Departure to Work by Sex in Corning
The most frequent times of departure to work in Corning are 12:00 AM to 4:59 AM (420, 23.7%) for males and 7:00 AM to 7:29 AM (369, 22.3%) for females.
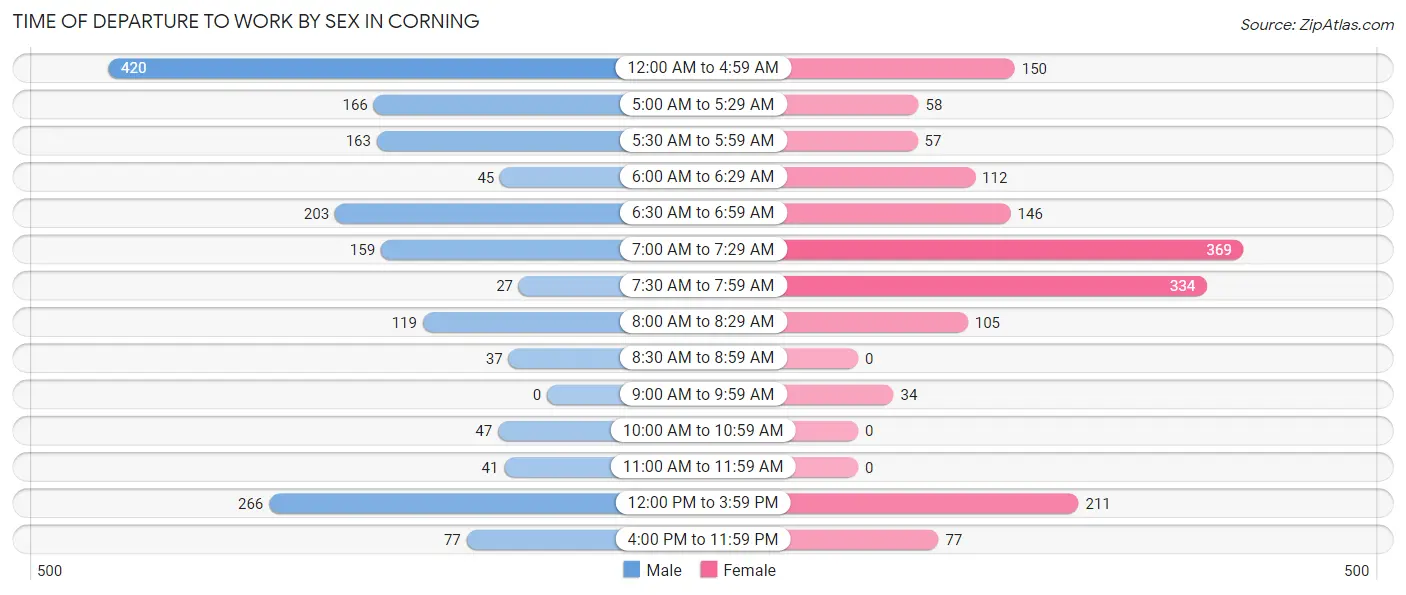
| Time of Departure | Male | Female |
| 12:00 AM to 4:59 AM | 420 (23.7%) | 150 (9.1%) |
| 5:00 AM to 5:29 AM | 166 (9.4%) | 58 (3.5%) |
| 5:30 AM to 5:59 AM | 163 (9.2%) | 57 (3.5%) |
| 6:00 AM to 6:29 AM | 45 (2.5%) | 112 (6.8%) |
| 6:30 AM to 6:59 AM | 203 (11.5%) | 146 (8.8%) |
| 7:00 AM to 7:29 AM | 159 (9.0%) | 369 (22.3%) |
| 7:30 AM to 7:59 AM | 27 (1.5%) | 334 (20.2%) |
| 8:00 AM to 8:29 AM | 119 (6.7%) | 105 (6.4%) |
| 8:30 AM to 8:59 AM | 37 (2.1%) | 0 (0.0%) |
| 9:00 AM to 9:59 AM | 0 (0.0%) | 34 (2.1%) |
| 10:00 AM to 10:59 AM | 47 (2.7%) | 0 (0.0%) |
| 11:00 AM to 11:59 AM | 41 (2.3%) | 0 (0.0%) |
| 12:00 PM to 3:59 PM | 266 (15.0%) | 211 (12.8%) |
| 4:00 PM to 11:59 PM | 77 (4.3%) | 77 (4.7%) |
| Total | 1,770 (100.0%) | 1,653 (100.0%) |
Housing Occupancy in Corning
Occupancy by Ownership in Corning
Of the total 2,640 dwellings in Corning, owner-occupied units account for 1,379 (52.2%), while renter-occupied units make up 1,261 (47.8%).
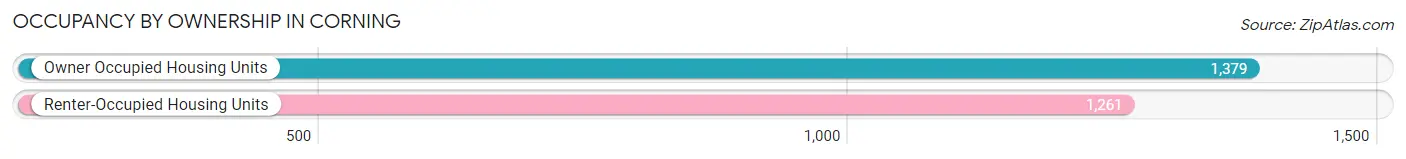
| Occupancy | # Housing Units | % Housing Units |
| Owner Occupied Housing Units | 1,379 | 52.2% |
| Renter-Occupied Housing Units | 1,261 | 47.8% |
| Total Occupied Housing Units | 2,640 | 100.0% |
Occupancy by Household Size in Corning
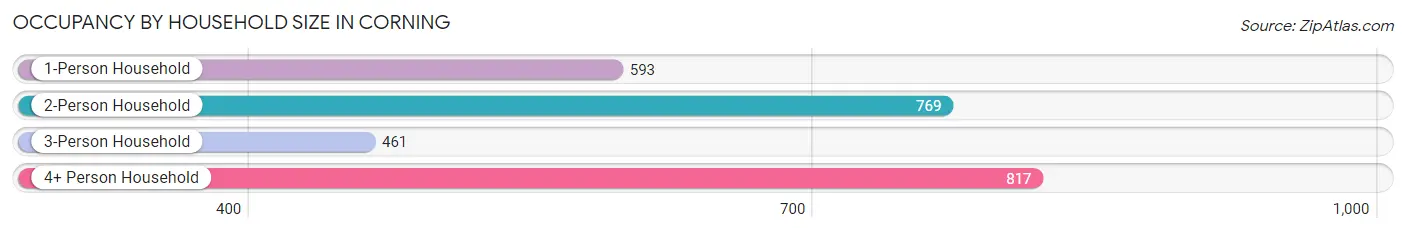
| Household Size | # Housing Units | % Housing Units |
| 1-Person Household | 593 | 22.5% |
| 2-Person Household | 769 | 29.1% |
| 3-Person Household | 461 | 17.5% |
| 4+ Person Household | 817 | 30.9% |
| Total Housing Units | 2,640 | 100.0% |
Occupancy by Ownership by Household Size in Corning
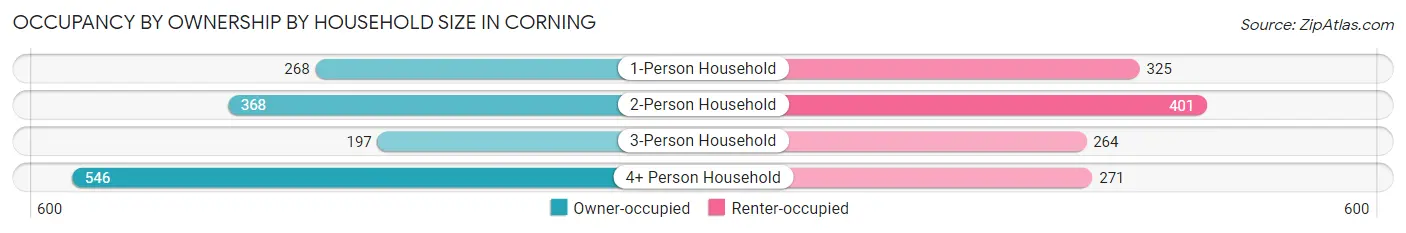
| Household Size | Owner-occupied | Renter-occupied |
| 1-Person Household | 268 (45.2%) | 325 (54.8%) |
| 2-Person Household | 368 (47.8%) | 401 (52.1%) |
| 3-Person Household | 197 (42.7%) | 264 (57.3%) |
| 4+ Person Household | 546 (66.8%) | 271 (33.2%) |
| Total Housing Units | 1,379 (52.2%) | 1,261 (47.8%) |
Occupancy by Educational Attainment in Corning
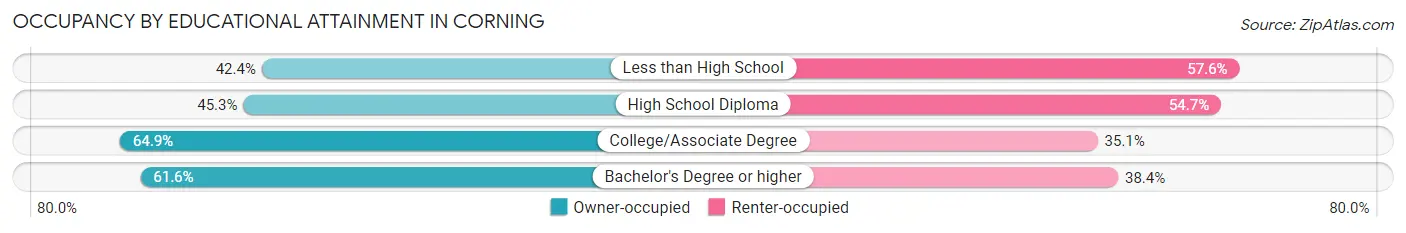
| Household Size | Owner-occupied | Renter-occupied |
| Less than High School | 287 (42.4%) | 390 (57.6%) |
| High School Diploma | 401 (45.3%) | 484 (54.7%) |
| College/Associate Degree | 532 (64.9%) | 288 (35.1%) |
| Bachelor's Degree or higher | 159 (61.6%) | 99 (38.4%) |
Occupancy by Age of Householder in Corning
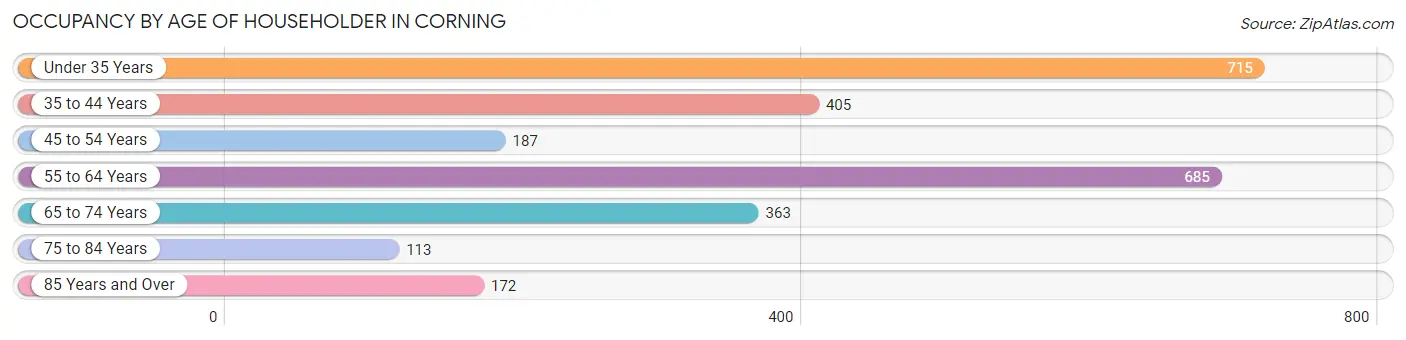
| Age Bracket | # Households | % Households |
| Under 35 Years | 715 | 27.1% |
| 35 to 44 Years | 405 | 15.3% |
| 45 to 54 Years | 187 | 7.1% |
| 55 to 64 Years | 685 | 26.0% |
| 65 to 74 Years | 363 | 13.8% |
| 75 to 84 Years | 113 | 4.3% |
| 85 Years and Over | 172 | 6.5% |
| Total | 2,640 | 100.0% |
Housing Finances in Corning
Median Income by Occupancy in Corning
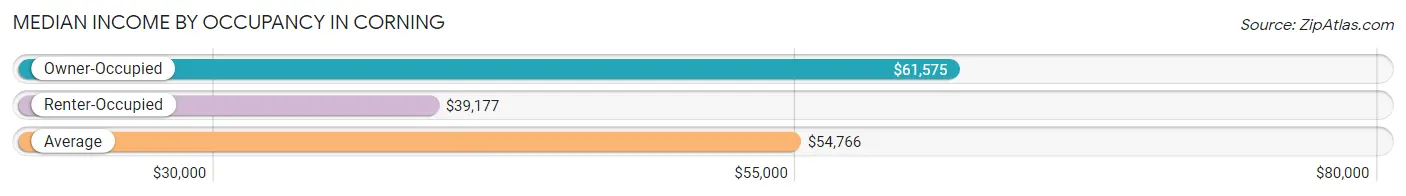
| Occupancy Type | # Households | Median Income |
| Owner-Occupied | 1,379 (52.2%) | $61,575 |
| Renter-Occupied | 1,261 (47.8%) | $39,177 |
| Average | 2,640 (100.0%) | $54,766 |
Occupancy by Householder Income Bracket in Corning
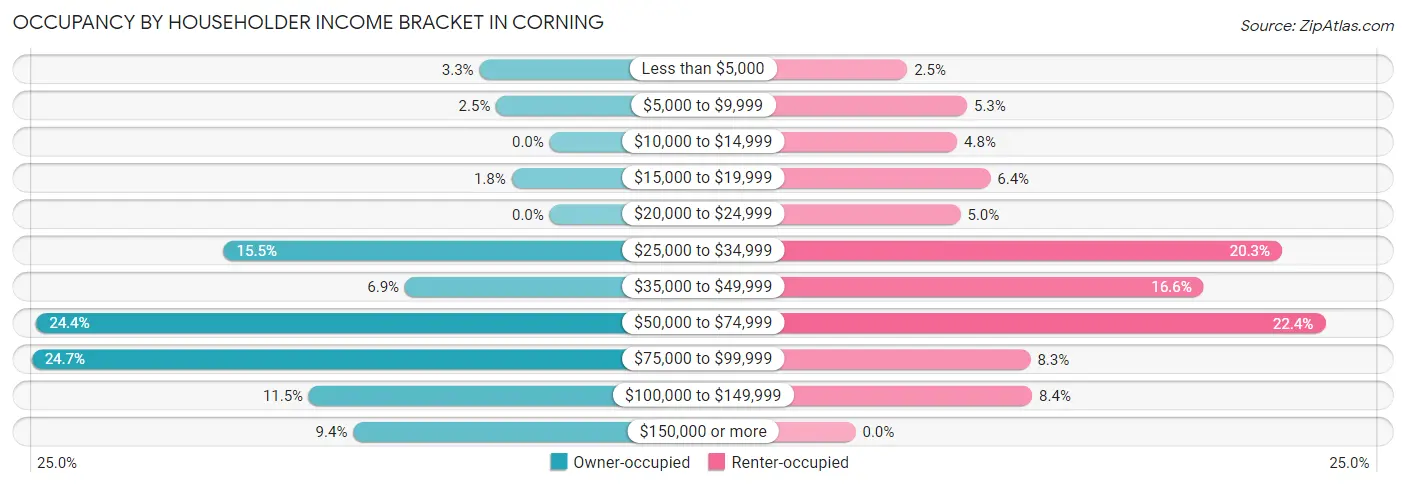
| Income Bracket | Owner-occupied | Renter-occupied |
| Less than $5,000 | 46 (3.3%) | 31 (2.5%) |
| $5,000 to $9,999 | 35 (2.5%) | 67 (5.3%) |
| $10,000 to $14,999 | 0 (0.0%) | 61 (4.8%) |
| $15,000 to $19,999 | 25 (1.8%) | 81 (6.4%) |
| $20,000 to $24,999 | 0 (0.0%) | 63 (5.0%) |
| $25,000 to $34,999 | 214 (15.5%) | 256 (20.3%) |
| $35,000 to $49,999 | 95 (6.9%) | 209 (16.6%) |
| $50,000 to $74,999 | 337 (24.4%) | 282 (22.4%) |
| $75,000 to $99,999 | 340 (24.7%) | 105 (8.3%) |
| $100,000 to $149,999 | 158 (11.5%) | 106 (8.4%) |
| $150,000 or more | 129 (9.3%) | 0 (0.0%) |
| Total | 1,379 (100.0%) | 1,261 (100.0%) |
Monthly Housing Cost Tiers in Corning
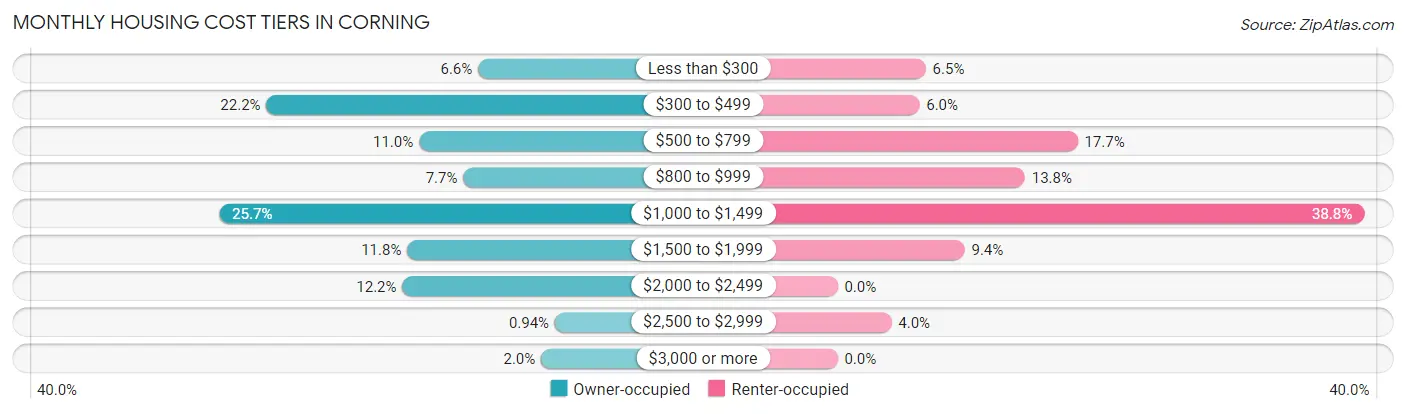
| Monthly Cost | Owner-occupied | Renter-occupied |
| Less than $300 | 91 (6.6%) | 82 (6.5%) |
| $300 to $499 | 306 (22.2%) | 76 (6.0%) |
| $500 to $799 | 151 (11.0%) | 223 (17.7%) |
| $800 to $999 | 106 (7.7%) | 174 (13.8%) |
| $1,000 to $1,499 | 354 (25.7%) | 489 (38.8%) |
| $1,500 to $1,999 | 163 (11.8%) | 118 (9.4%) |
| $2,000 to $2,499 | 168 (12.2%) | 0 (0.0%) |
| $2,500 to $2,999 | 13 (0.9%) | 50 (4.0%) |
| $3,000 or more | 27 (2.0%) | 0 (0.0%) |
| Total | 1,379 (100.0%) | 1,261 (100.0%) |
Physical Housing Characteristics in Corning
Housing Structures in Corning
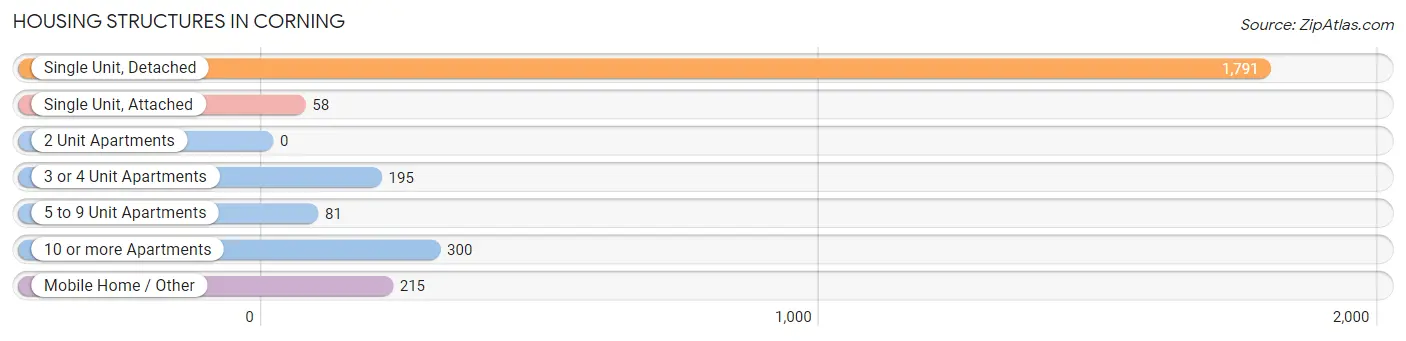
| Structure Type | # Housing Units | % Housing Units |
| Single Unit, Detached | 1,791 | 67.8% |
| Single Unit, Attached | 58 | 2.2% |
| 2 Unit Apartments | 0 | 0.0% |
| 3 or 4 Unit Apartments | 195 | 7.4% |
| 5 to 9 Unit Apartments | 81 | 3.1% |
| 10 or more Apartments | 300 | 11.4% |
| Mobile Home / Other | 215 | 8.1% |
| Total | 2,640 | 100.0% |
Housing Structures by Occupancy in Corning
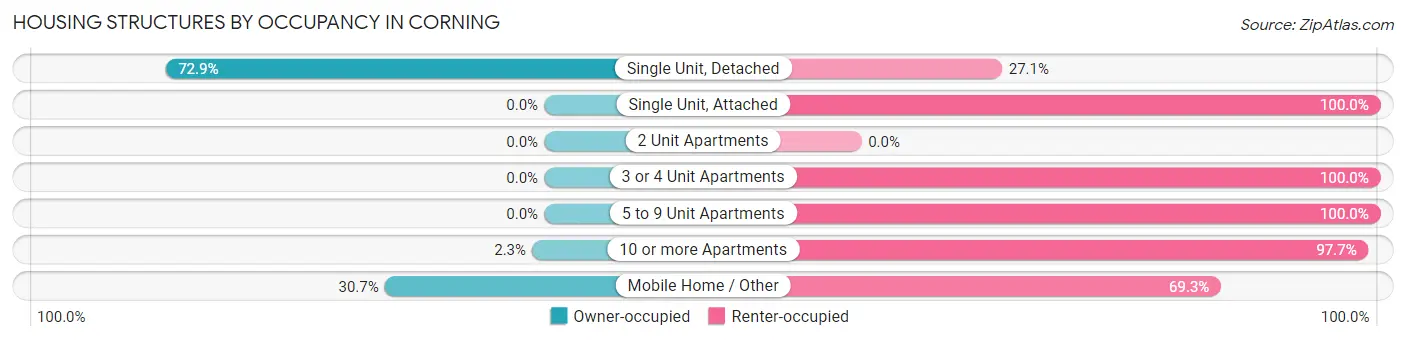
| Structure Type | Owner-occupied | Renter-occupied |
| Single Unit, Detached | 1,306 (72.9%) | 485 (27.1%) |
| Single Unit, Attached | 0 (0.0%) | 58 (100.0%) |
| 2 Unit Apartments | 0 (0.0%) | 0 (0.0%) |
| 3 or 4 Unit Apartments | 0 (0.0%) | 195 (100.0%) |
| 5 to 9 Unit Apartments | 0 (0.0%) | 81 (100.0%) |
| 10 or more Apartments | 7 (2.3%) | 293 (97.7%) |
| Mobile Home / Other | 66 (30.7%) | 149 (69.3%) |
| Total | 1,379 (52.2%) | 1,261 (47.8%) |
Housing Structures by Number of Rooms in Corning
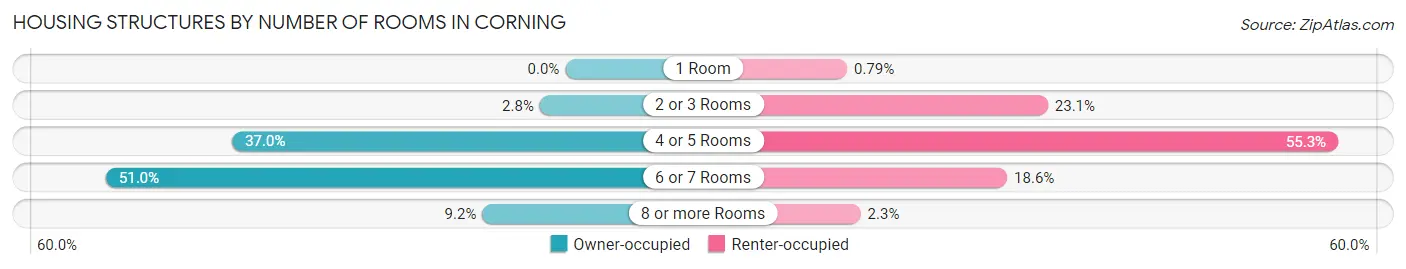
| Number of Rooms | Owner-occupied | Renter-occupied |
| 1 Room | 0 (0.0%) | 10 (0.8%) |
| 2 or 3 Rooms | 39 (2.8%) | 291 (23.1%) |
| 4 or 5 Rooms | 510 (37.0%) | 697 (55.3%) |
| 6 or 7 Rooms | 703 (51.0%) | 234 (18.6%) |
| 8 or more Rooms | 127 (9.2%) | 29 (2.3%) |
| Total | 1,379 (100.0%) | 1,261 (100.0%) |
Housing Structure by Heating Type in Corning
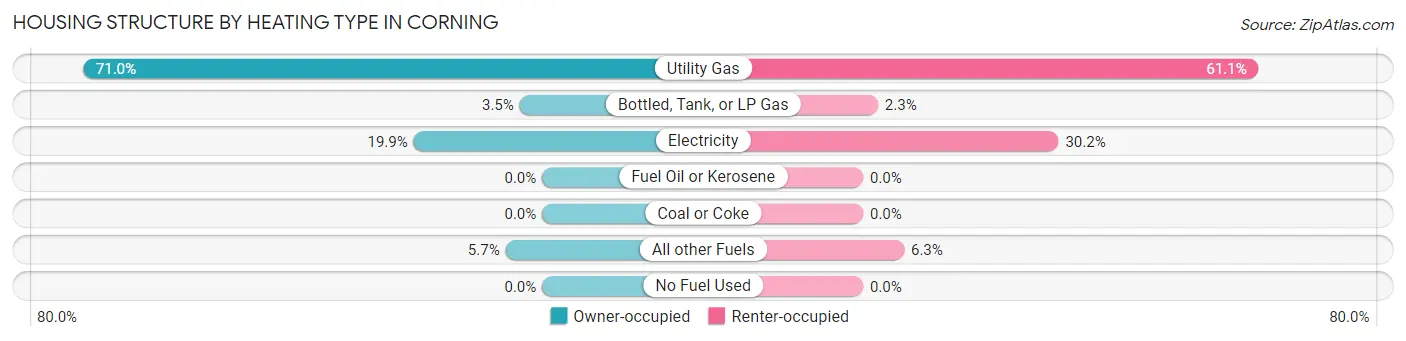
| Heating Type | Owner-occupied | Renter-occupied |
| Utility Gas | 979 (71.0%) | 771 (61.1%) |
| Bottled, Tank, or LP Gas | 48 (3.5%) | 29 (2.3%) |
| Electricity | 274 (19.9%) | 381 (30.2%) |
| Fuel Oil or Kerosene | 0 (0.0%) | 0 (0.0%) |
| Coal or Coke | 0 (0.0%) | 0 (0.0%) |
| All other Fuels | 78 (5.7%) | 80 (6.3%) |
| No Fuel Used | 0 (0.0%) | 0 (0.0%) |
| Total | 1,379 (100.0%) | 1,261 (100.0%) |
Household Vehicle Usage in Corning
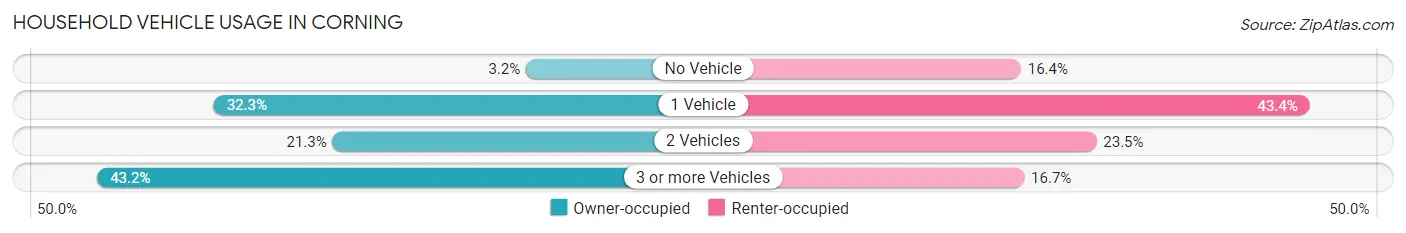
| Vehicles per Household | Owner-occupied | Renter-occupied |
| No Vehicle | 44 (3.2%) | 207 (16.4%) |
| 1 Vehicle | 446 (32.3%) | 547 (43.4%) |
| 2 Vehicles | 293 (21.2%) | 296 (23.5%) |
| 3 or more Vehicles | 596 (43.2%) | 211 (16.7%) |
| Total | 1,379 (100.0%) | 1,261 (100.0%) |
Real Estate & Mortgages in Corning
Real Estate and Mortgage Overview in Corning
| Characteristic | Without Mortgage | With Mortgage |
| Housing Units | 554 | 825 |
| Median Property Value | $219,100 | $262,600 |
| Median Household Income | $76,500 | $97 |
| Monthly Housing Costs | $414 | $27 |
| Real Estate Taxes | $1,047 | $23 |
Property Value by Mortgage Status in Corning
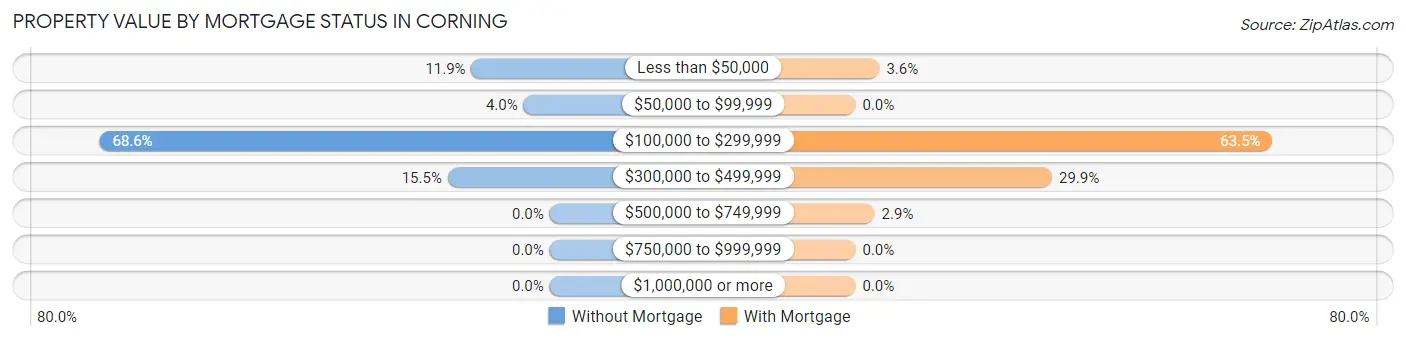
| Property Value | Without Mortgage | With Mortgage |
| Less than $50,000 | 66 (11.9%) | 30 (3.6%) |
| $50,000 to $99,999 | 22 (4.0%) | 0 (0.0%) |
| $100,000 to $299,999 | 380 (68.6%) | 524 (63.5%) |
| $300,000 to $499,999 | 86 (15.5%) | 247 (29.9%) |
| $500,000 to $749,999 | 0 (0.0%) | 24 (2.9%) |
| $750,000 to $999,999 | 0 (0.0%) | 0 (0.0%) |
| $1,000,000 or more | 0 (0.0%) | 0 (0.0%) |
| Total | 554 (100.0%) | 825 (100.0%) |
Household Income by Mortgage Status in Corning
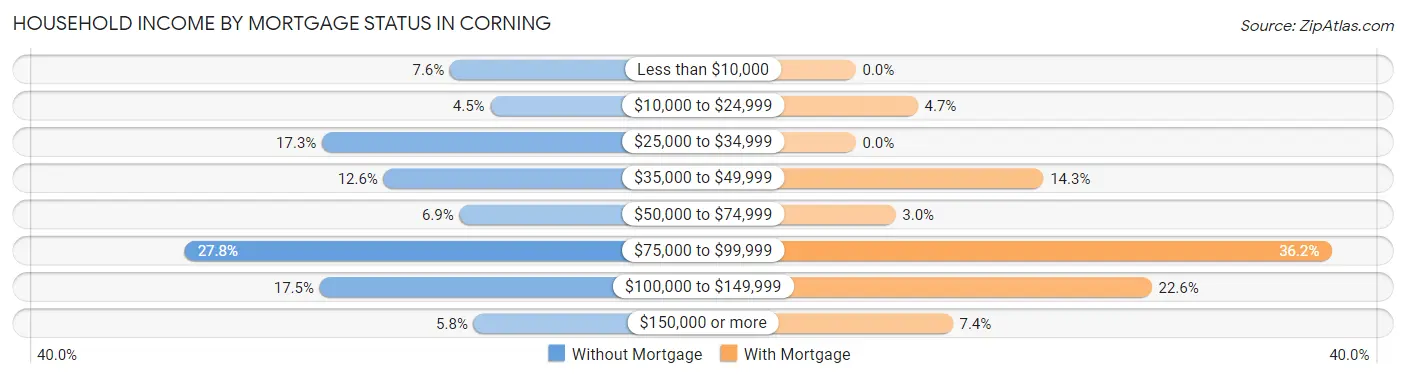
| Household Income | Without Mortgage | With Mortgage |
| Less than $10,000 | 42 (7.6%) | 0 (0.0%) |
| $10,000 to $24,999 | 25 (4.5%) | 39 (4.7%) |
| $25,000 to $34,999 | 96 (17.3%) | 0 (0.0%) |
| $35,000 to $49,999 | 70 (12.6%) | 118 (14.3%) |
| $50,000 to $74,999 | 38 (6.9%) | 25 (3.0%) |
| $75,000 to $99,999 | 154 (27.8%) | 299 (36.2%) |
| $100,000 to $149,999 | 97 (17.5%) | 186 (22.6%) |
| $150,000 or more | 32 (5.8%) | 61 (7.4%) |
| Total | 554 (100.0%) | 825 (100.0%) |
Property Value to Household Income Ratio in Corning
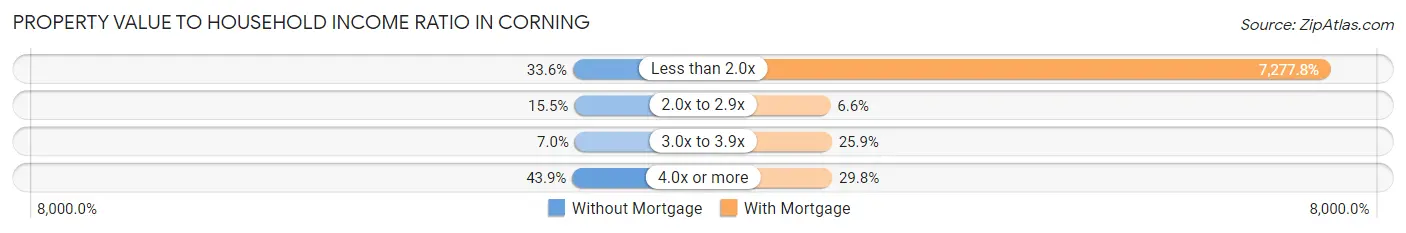
| Value-to-Income Ratio | Without Mortgage | With Mortgage |
| Less than 2.0x | 186 (33.6%) | 60,042 (7,277.8%) |
| 2.0x to 2.9x | 86 (15.5%) | 54 (6.6%) |
| 3.0x to 3.9x | 39 (7.0%) | 214 (25.9%) |
| 4.0x or more | 243 (43.9%) | 246 (29.8%) |
| Total | 554 (100.0%) | 825 (100.0%) |
Real Estate Taxes by Mortgage Status in Corning
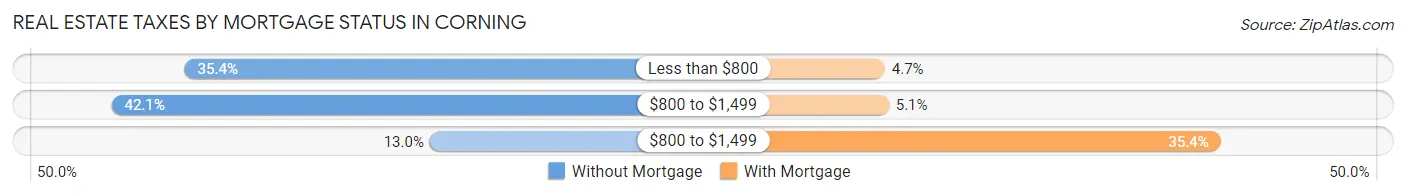
| Property Taxes | Without Mortgage | With Mortgage |
| Less than $800 | 196 (35.4%) | 39 (4.7%) |
| $800 to $1,499 | 233 (42.1%) | 42 (5.1%) |
| $800 to $1,499 | 72 (13.0%) | 292 (35.4%) |
| Total | 554 (100.0%) | 825 (100.0%) |
Health & Disability in Corning
Health Insurance Coverage by Age in Corning
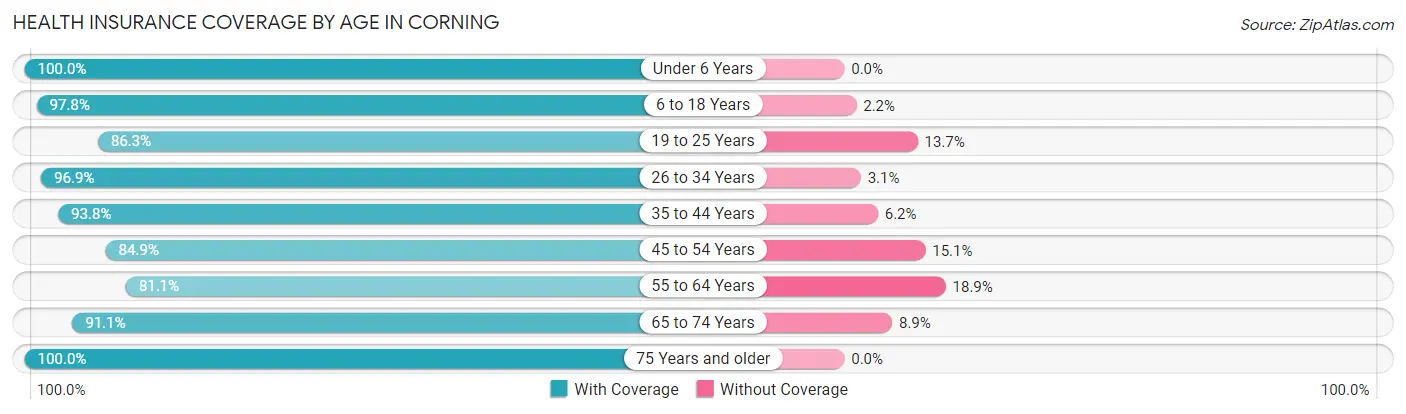
| Age Bracket | With Coverage | Without Coverage |
| Under 6 Years | 836 (100.0%) | 0 (0.0%) |
| 6 to 18 Years | 1,315 (97.8%) | 30 (2.2%) |
| 19 to 25 Years | 695 (86.3%) | 110 (13.7%) |
| 26 to 34 Years | 1,419 (96.9%) | 45 (3.1%) |
| 35 to 44 Years | 887 (93.8%) | 59 (6.2%) |
| 45 to 54 Years | 579 (84.9%) | 103 (15.1%) |
| 55 to 64 Years | 962 (81.1%) | 224 (18.9%) |
| 65 to 74 Years | 563 (91.1%) | 55 (8.9%) |
| 75 Years and older | 314 (100.0%) | 0 (0.0%) |
| Total | 7,570 (92.4%) | 626 (7.6%) |
Health Insurance Coverage by Citizenship Status in Corning
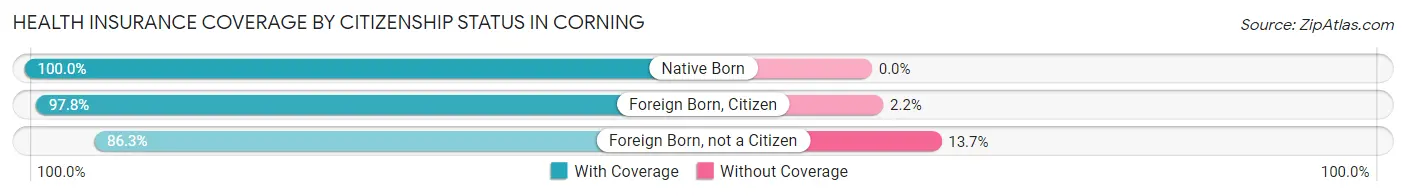
| Citizenship Status | With Coverage | Without Coverage |
| Native Born | 836 (100.0%) | 0 (0.0%) |
| Foreign Born, Citizen | 1,315 (97.8%) | 30 (2.2%) |
| Foreign Born, not a Citizen | 695 (86.3%) | 110 (13.7%) |
Health Insurance Coverage by Household Income in Corning
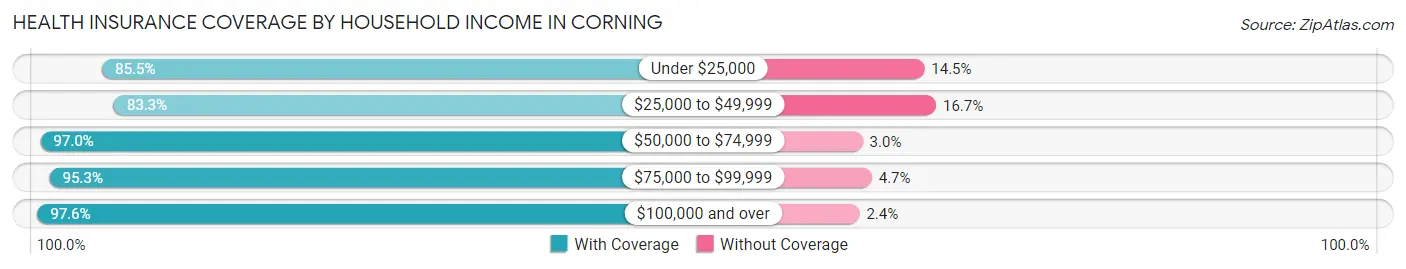
| Household Income | With Coverage | Without Coverage |
| Under $25,000 | 494 (85.5%) | 84 (14.5%) |
| $25,000 to $49,999 | 1,832 (83.3%) | 368 (16.7%) |
| $50,000 to $74,999 | 2,257 (97.0%) | 69 (3.0%) |
| $75,000 to $99,999 | 1,323 (95.3%) | 65 (4.7%) |
| $100,000 and over | 1,639 (97.6%) | 40 (2.4%) |
Public vs Private Health Insurance Coverage by Age in Corning
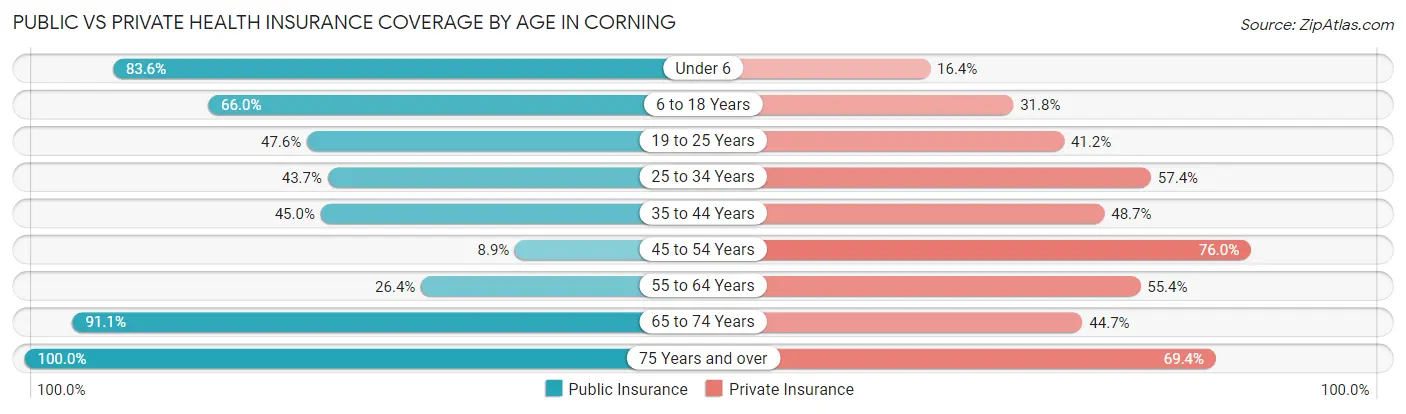
| Age Bracket | Public Insurance | Private Insurance |
| Under 6 | 699 (83.6%) | 137 (16.4%) |
| 6 to 18 Years | 887 (65.9%) | 428 (31.8%) |
| 19 to 25 Years | 383 (47.6%) | 332 (41.2%) |
| 25 to 34 Years | 640 (43.7%) | 840 (57.4%) |
| 35 to 44 Years | 426 (45.0%) | 461 (48.7%) |
| 45 to 54 Years | 61 (8.9%) | 518 (75.9%) |
| 55 to 64 Years | 313 (26.4%) | 657 (55.4%) |
| 65 to 74 Years | 563 (91.1%) | 276 (44.7%) |
| 75 Years and over | 314 (100.0%) | 218 (69.4%) |
| Total | 4,286 (52.3%) | 3,867 (47.2%) |
Disability Status by Sex by Age in Corning
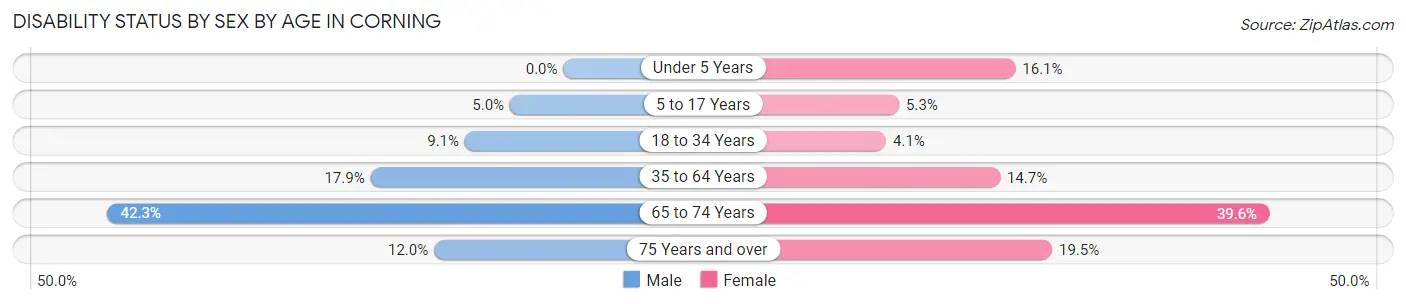
| Age Bracket | Male | Female |
| Under 5 Years | 0 (0.0%) | 72 (16.1%) |
| 5 to 17 Years | 41 (5.0%) | 39 (5.3%) |
| 18 to 34 Years | 109 (9.1%) | 47 (4.1%) |
| 35 to 64 Years | 227 (17.9%) | 227 (14.7%) |
| 65 to 74 Years | 96 (42.3%) | 155 (39.6%) |
| 75 Years and over | 18 (12.0%) | 32 (19.5%) |
Disability Class by Sex by Age in Corning
Disability Class: Hearing Difficulty
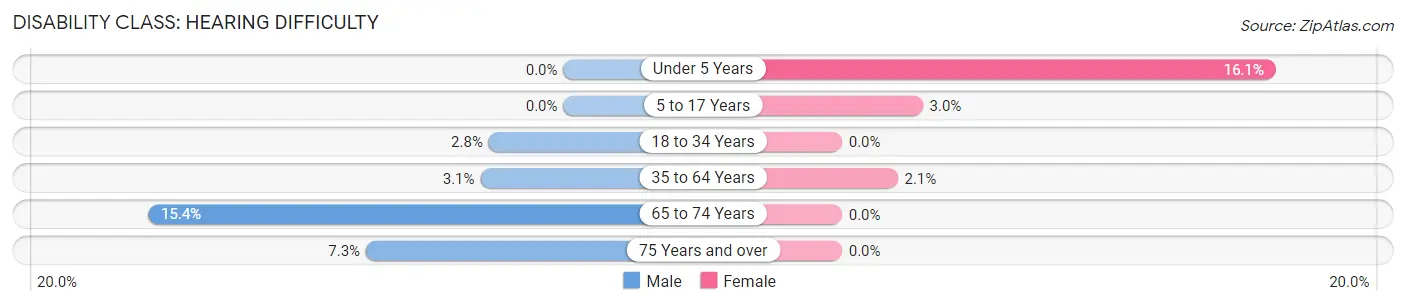
| Age Bracket | Male | Female |
| Under 5 Years | 0 (0.0%) | 72 (16.1%) |
| 5 to 17 Years | 0 (0.0%) | 22 (3.0%) |
| 18 to 34 Years | 33 (2.8%) | 0 (0.0%) |
| 35 to 64 Years | 39 (3.1%) | 32 (2.1%) |
| 65 to 74 Years | 35 (15.4%) | 0 (0.0%) |
| 75 Years and over | 11 (7.3%) | 0 (0.0%) |
Disability Class: Vision Difficulty
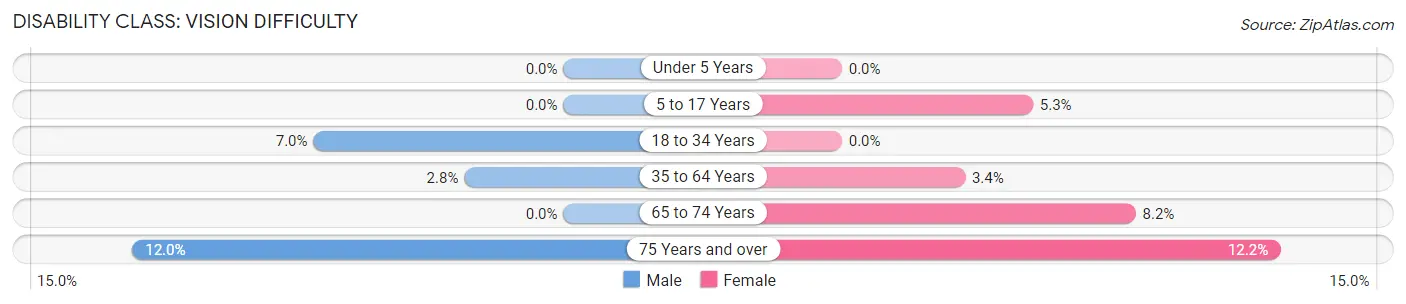
| Age Bracket | Male | Female |
| Under 5 Years | 0 (0.0%) | 0 (0.0%) |
| 5 to 17 Years | 0 (0.0%) | 39 (5.3%) |
| 18 to 34 Years | 83 (7.0%) | 0 (0.0%) |
| 35 to 64 Years | 35 (2.8%) | 53 (3.4%) |
| 65 to 74 Years | 0 (0.0%) | 32 (8.2%) |
| 75 Years and over | 18 (12.0%) | 20 (12.2%) |
Disability Class: Cognitive Difficulty
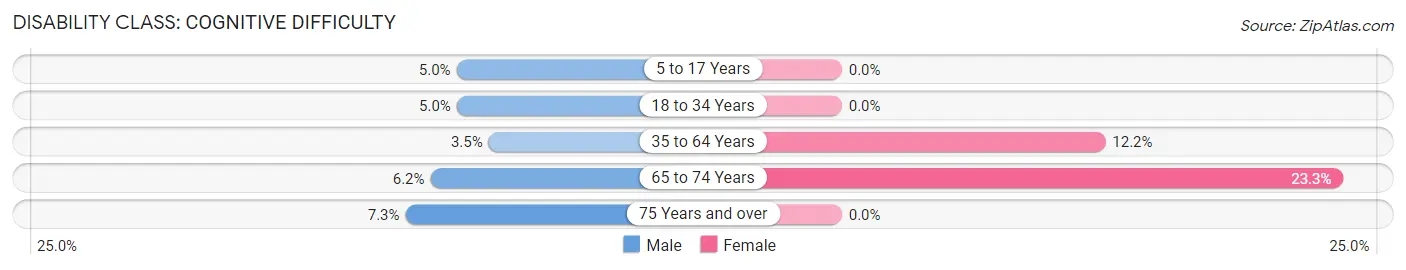
| Age Bracket | Male | Female |
| 5 to 17 Years | 41 (5.0%) | 0 (0.0%) |
| 18 to 34 Years | 59 (5.0%) | 0 (0.0%) |
| 35 to 64 Years | 44 (3.5%) | 189 (12.2%) |
| 65 to 74 Years | 14 (6.2%) | 91 (23.3%) |
| 75 Years and over | 11 (7.3%) | 0 (0.0%) |
Disability Class: Ambulatory Difficulty
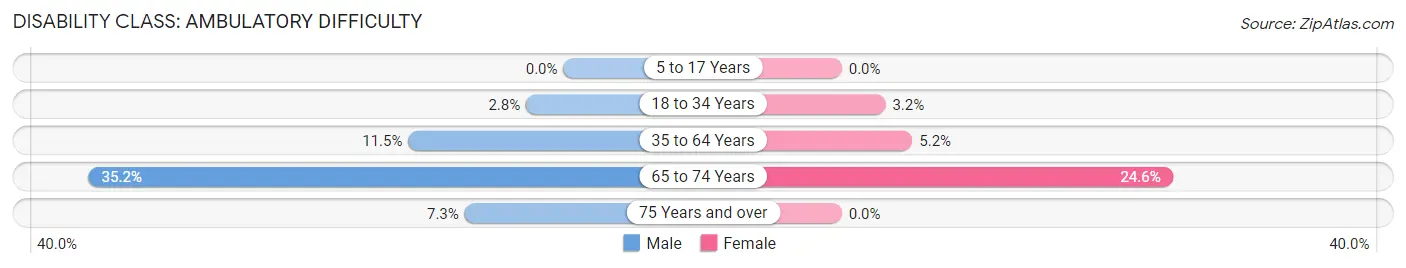
| Age Bracket | Male | Female |
| 5 to 17 Years | 0 (0.0%) | 0 (0.0%) |
| 18 to 34 Years | 33 (2.8%) | 37 (3.2%) |
| 35 to 64 Years | 146 (11.5%) | 81 (5.2%) |
| 65 to 74 Years | 80 (35.2%) | 96 (24.5%) |
| 75 Years and over | 11 (7.3%) | 0 (0.0%) |
Disability Class: Self-Care Difficulty
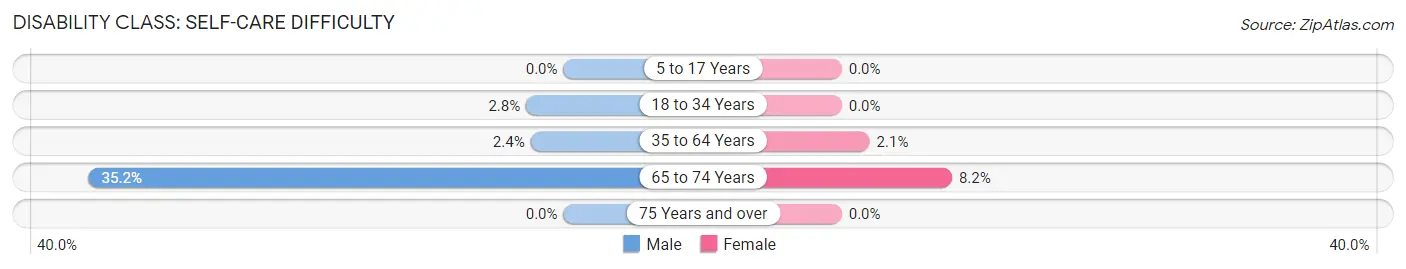
| Age Bracket | Male | Female |
| 5 to 17 Years | 0 (0.0%) | 0 (0.0%) |
| 18 to 34 Years | 33 (2.8%) | 0 (0.0%) |
| 35 to 64 Years | 31 (2.4%) | 32 (2.1%) |
| 65 to 74 Years | 80 (35.2%) | 32 (8.2%) |
| 75 Years and over | 0 (0.0%) | 0 (0.0%) |
Technology Access in Corning
Computing Device Access in Corning
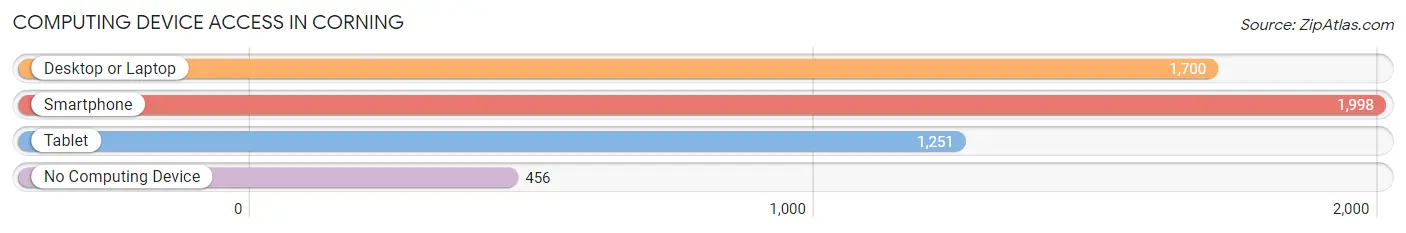
| Device Type | # Households | % Households |
| Desktop or Laptop | 1,700 | 64.4% |
| Smartphone | 1,998 | 75.7% |
| Tablet | 1,251 | 47.4% |
| No Computing Device | 456 | 17.3% |
| Total | 2,640 | 100.0% |
Internet Access in Corning
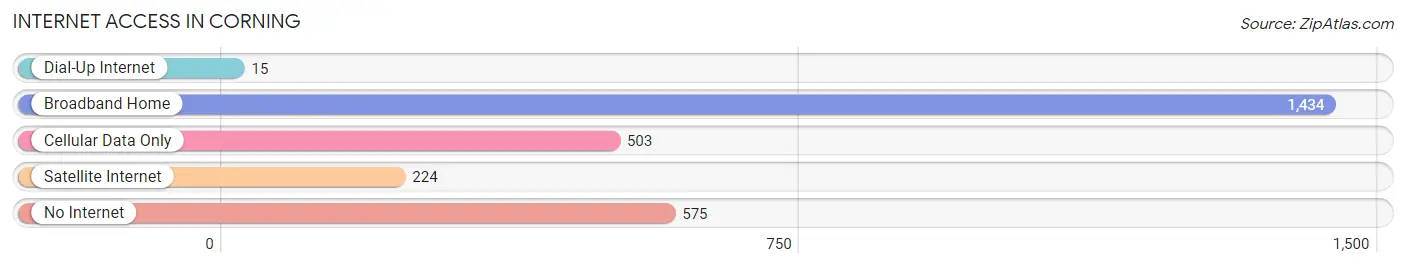
| Internet Type | # Households | % Households |
| Dial-Up Internet | 15 | 0.6% |
| Broadband Home | 1,434 | 54.3% |
| Cellular Data Only | 503 | 19.1% |
| Satellite Internet | 224 | 8.5% |
| No Internet | 575 | 21.8% |
| Total | 2,640 | 100.0% |
Corning Summary
Corning, California is a small city located in Tehama County, California, United States. It is situated in the northern part of the state, about halfway between Red Bluff and Chico. The city has a population of around 8,000 people and is the county seat of Tehama County.
History
Corning was founded in 1883 by the Southern Pacific Railroad. The city was named after Erastus Corning, a railroad executive. The city was incorporated in 1908 and has since grown to become the largest city in Tehama County.
Geography
Corning is located in the northern part of California, about halfway between Red Bluff and Chico. The city is situated in the Sacramento Valley, at an elevation of about 200 feet above sea level. The city is surrounded by rolling hills and is located near the Sacramento River. The climate in Corning is generally mild, with hot summers and cool winters.
Economy
Corning’s economy is largely based on agriculture. The city is home to a number of farms and ranches, which produce a variety of crops, including almonds, walnuts, tomatoes, and other fruits and vegetables. The city is also home to a number of manufacturing and industrial businesses, including a large lumber mill.
Demographics
As of the 2010 census, Corning had a population of 8,179 people. The racial makeup of the city was 75.3% White, 0.7% African American, 1.2% Native American, 0.7% Asian, 0.1% Pacific Islander, 19.2% from other races, and 3.0% from two or more races. Hispanic or Latino of any race were 33.2% of the population.
The median income for a household in Corning was $37,917, and the median income for a family was $45,917. The per capita income for the city was $17,917. About 17.2% of families and 21.2% of the population were below the poverty line, including 28.2% of those under age 18 and 11.2% of those age 65 or over.
Corning is a small city with a rich history and a diverse population. The city’s economy is largely based on agriculture, and the city is home to a number of manufacturing and industrial businesses. The city has a population of around 8,000 people and is the county seat of Tehama County.
Common Questions
What is Per Capita Income in Corning?
Per Capita income in Corning is $21,082.
What is the Median Family Income in Corning?
Median Family Income in Corning is $60,579.
What is the Median Household income in Corning?
Median Household Income in Corning is $54,766.
What is Income or Wage Gap in Corning?
Income or Wage Gap in Corning is 28.8%.
Women in Corning earn 71.2 cents for every dollar earned by a man.
What is Inequality or Gini Index in Corning?
Inequality or Gini Index in Corning is 0.38.
What is the Total Population of Corning?
Total Population of Corning is 8,196.
What is the Total Male Population of Corning?
Total Male Population of Corning is 3,772.
What is the Total Female Population of Corning?
Total Female Population of Corning is 4,424.
What is the Ratio of Males per 100 Females in Corning?
There are 85.26 Males per 100 Females in Corning.
What is the Ratio of Females per 100 Males in Corning?
There are 117.29 Females per 100 Males in Corning.
What is the Median Population Age in Corning?
Median Population Age in Corning is 33.3 Years.
What is the Average Family Size in Corning
Average Family Size in Corning is 3.5 People.
What is the Average Household Size in Corning
Average Household Size in Corning is 3.1 People.
How Large is the Labor Force in Corning?
There are 3,740 People in the Labor Forcein in Corning.
What is the Percentage of People in the Labor Force in Corning?
59.9% of People are in the Labor Force in Corning.
What is the Unemployment Rate in Corning?
Unemployment Rate in Corning is 3.6%.