Allendale, CA Map & Demographics
Allendale Map
Allendale Overview
$56,892
PER CAPITA INCOME
$129,524
AVG FAMILY INCOME
$105,250
AVG HOUSEHOLD INCOME
0.45
INEQUALITY / GINI INDEX
1,752
TOTAL POPULATION
823
MALE POPULATION
929
FEMALE POPULATION
88.59
MALES / 100 FEMALES
112.88
FEMALES / 100 MALES
55.0
MEDIAN AGE
3.0
AVG FAMILY SIZE
2.9
AVG HOUSEHOLD SIZE
854
LABOR FORCE [ PEOPLE ]
54.4%
PERCENT IN LABOR FORCE
5.4%
UNEMPLOYMENT RATE
Income in Allendale
Income Overview in Allendale
Per Capita Income in Allendale is $56,892, while median incomes of families and households are $129,524 and $105,250 respectively.
| Characteristic | Number | Measure |
| Per Capita Income | 1,752 | $56,892 |
| Median Family Income | 492 | $129,524 |
| Mean Family Income | 492 | $170,395 |
| Median Household Income | 607 | $105,250 |
| Mean Household Income | 607 | $157,677 |
| Income Deficit | 492 | $0 |
| Wage / Income Gap (%) | 1,752 | 0.00% |
| Wage / Income Gap ($) | 1,752 | 100.00¢ per $1 |
| Gini / Inequality Index | 1,752 | 0.45 |
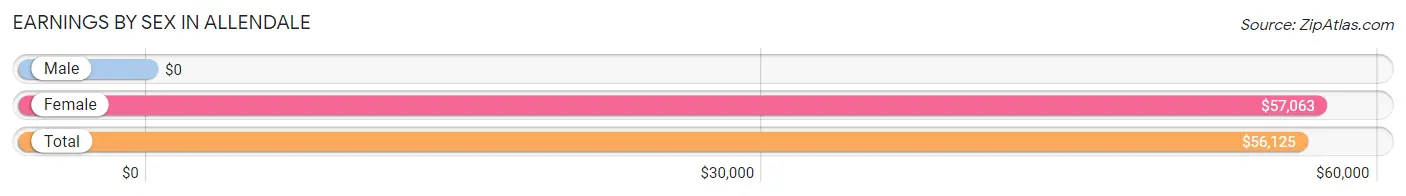
Earnings by Sex in Allendale
| Sex | Number | Average Earnings |
| Male | 489 (54.7%) | $0 |
| Female | 405 (45.3%) | $57,063 |
| Total | 894 (100.0%) | $56,125 |
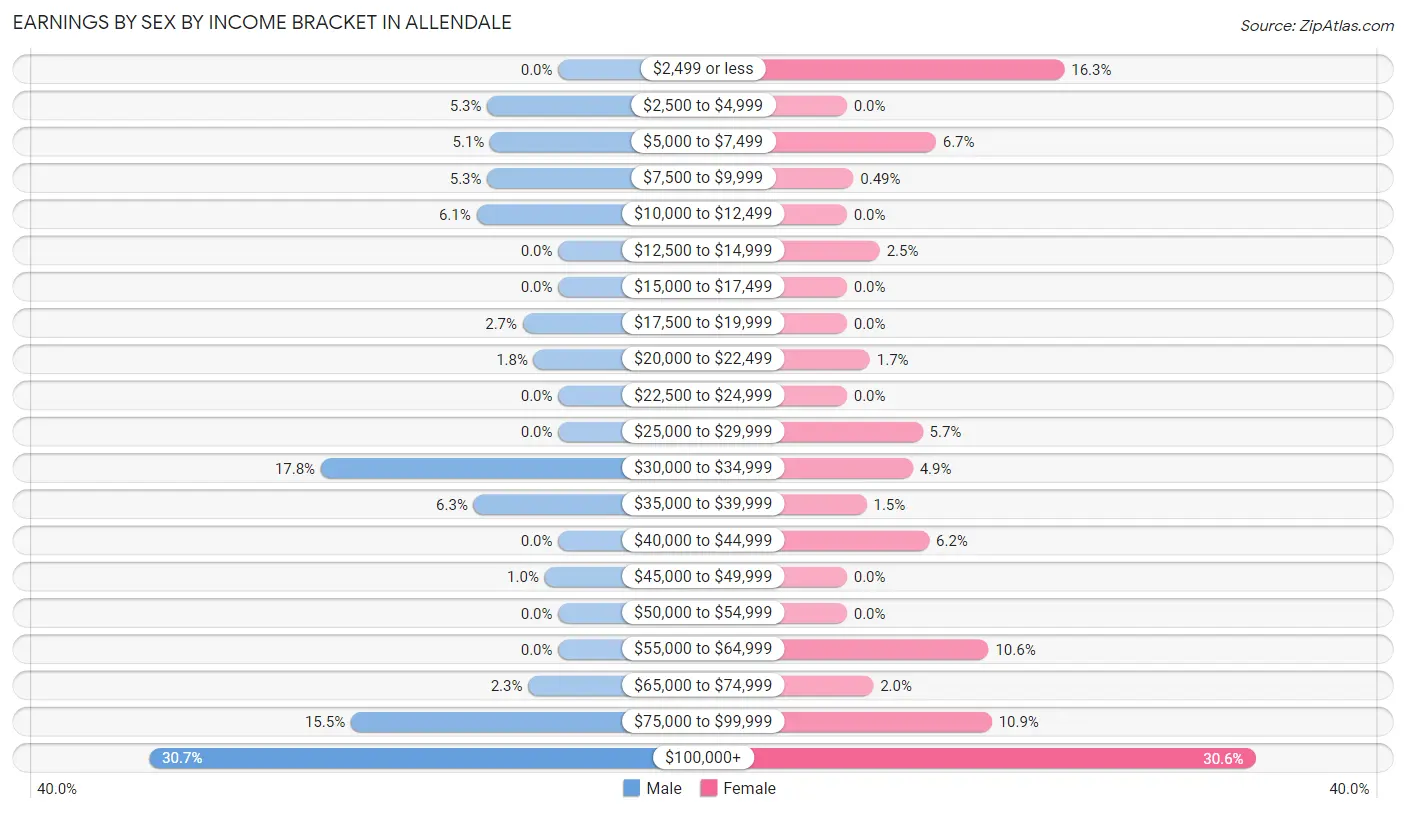
Earnings by Sex by Income Bracket in Allendale
The most common earnings brackets in Allendale are $100,000+ for men (150 | 30.7%) and $100,000+ for women (124 | 30.6%).
| Income | Male | Female |
| $2,499 or less | 0 (0.0%) | 66 (16.3%) |
| $2,500 to $4,999 | 26 (5.3%) | 0 (0.0%) |
| $5,000 to $7,499 | 25 (5.1%) | 27 (6.7%) |
| $7,500 to $9,999 | 26 (5.3%) | 2 (0.5%) |
| $10,000 to $12,499 | 30 (6.1%) | 0 (0.0%) |
| $12,500 to $14,999 | 0 (0.0%) | 10 (2.5%) |
| $15,000 to $17,499 | 0 (0.0%) | 0 (0.0%) |
| $17,500 to $19,999 | 13 (2.7%) | 0 (0.0%) |
| $20,000 to $22,499 | 9 (1.8%) | 7 (1.7%) |
| $22,500 to $24,999 | 0 (0.0%) | 0 (0.0%) |
| $25,000 to $29,999 | 0 (0.0%) | 23 (5.7%) |
| $30,000 to $34,999 | 87 (17.8%) | 20 (4.9%) |
| $35,000 to $39,999 | 31 (6.3%) | 6 (1.5%) |
| $40,000 to $44,999 | 0 (0.0%) | 25 (6.2%) |
| $45,000 to $49,999 | 5 (1.0%) | 0 (0.0%) |
| $50,000 to $54,999 | 0 (0.0%) | 0 (0.0%) |
| $55,000 to $64,999 | 0 (0.0%) | 43 (10.6%) |
| $65,000 to $74,999 | 11 (2.2%) | 8 (2.0%) |
| $75,000 to $99,999 | 76 (15.5%) | 44 (10.9%) |
| $100,000+ | 150 (30.7%) | 124 (30.6%) |
| Total | 489 (100.0%) | 405 (100.0%) |
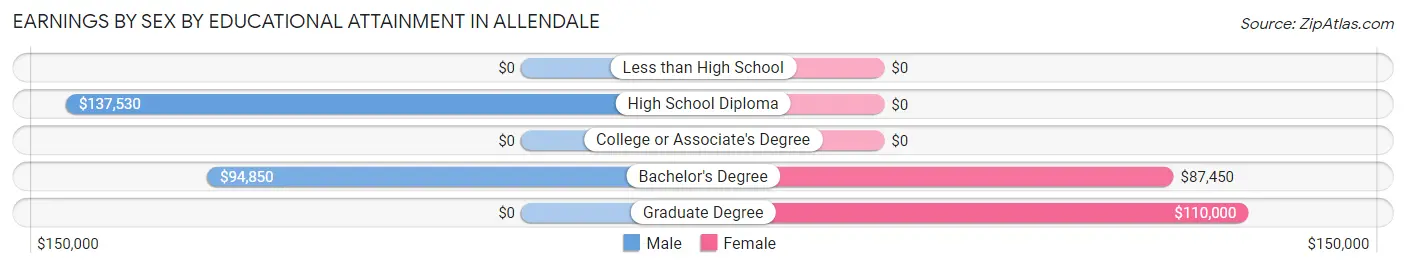
Earnings by Sex by Educational Attainment in Allendale
Average earnings in Allendale are $98,269 for men and $85,450 for women, a difference of 13.0%. Men with an educational attainment of high school diploma enjoy the highest average annual earnings of $137,530, while those with bachelor's degree education earn the least with $94,850. Women with an educational attainment of graduate degree earn the most with the average annual earnings of $110,000, while those with bachelor's degree education have the smallest earnings of $87,450.
| Educational Attainment | Male Income | Female Income |
| Less than High School | - | - |
| High School Diploma | $137,530 | $0 |
| College or Associate's Degree | - | - |
| Bachelor's Degree | $94,850 | $87,450 |
| Graduate Degree | - | - |
| Total | $98,269 | $85,450 |
Family Income in Allendale
Family Income Brackets in Allendale
According to the Allendale family income data, there are 141 families falling into the $200,000+ income range, which is the most common income bracket and makes up 28.7% of all families.
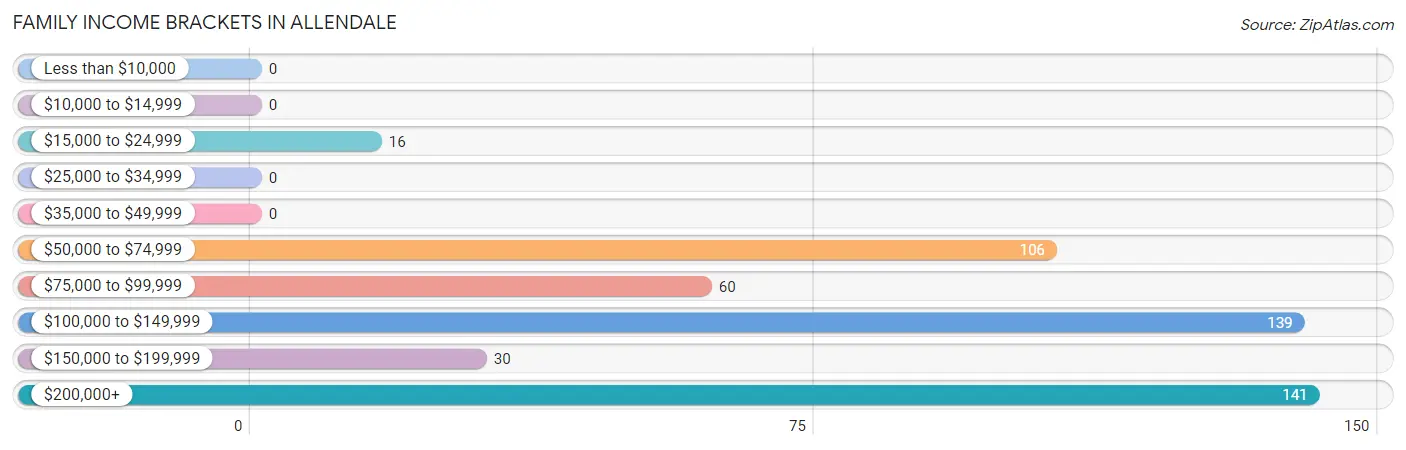
| Income Bracket | # Families | % Families |
| Less than $10,000 | 0 | 0.0% |
| $10,000 to $14,999 | 0 | 0.0% |
| $15,000 to $24,999 | 16 | 3.3% |
| $25,000 to $34,999 | 0 | 0.0% |
| $35,000 to $49,999 | 0 | 0.0% |
| $50,000 to $74,999 | 106 | 21.5% |
| $75,000 to $99,999 | 60 | 12.2% |
| $100,000 to $149,999 | 139 | 28.3% |
| $150,000 to $199,999 | 30 | 6.1% |
| $200,000+ | 141 | 28.7% |
Family Income by Famaliy Size in Allendale
3-person families (78 | 15.9%) account for the highest median family income in Allendale with $227,727 per family, while 3-person families (78 | 15.9%) have the highest median income of $75,909 per family member.
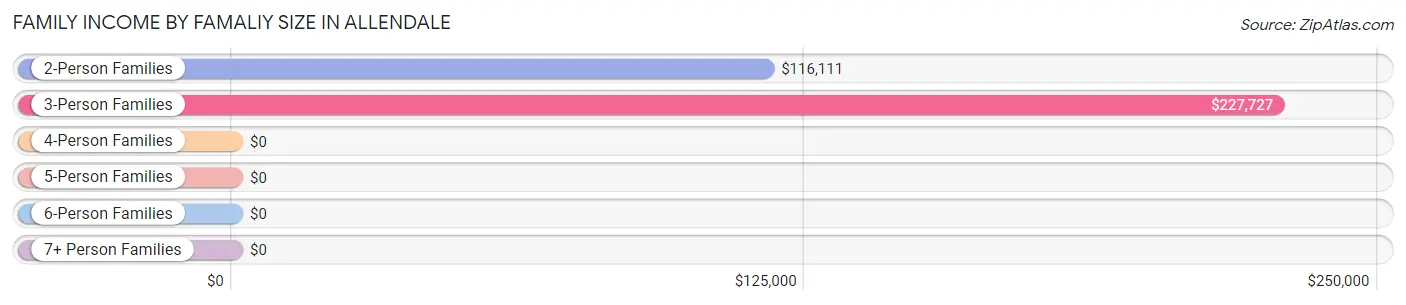
| Income Bracket | # Families | Median Income |
| 2-Person Families | 326 (66.3%) | $116,111 |
| 3-Person Families | 78 (15.9%) | $227,727 |
| 4-Person Families | 37 (7.5%) | $0 |
| 5-Person Families | 11 (2.2%) | $0 |
| 6-Person Families | 20 (4.1%) | $0 |
| 7+ Person Families | 20 (4.1%) | $0 |
| Total | 492 (100.0%) | $129,524 |
Family Income by Number of Earners in Allendale
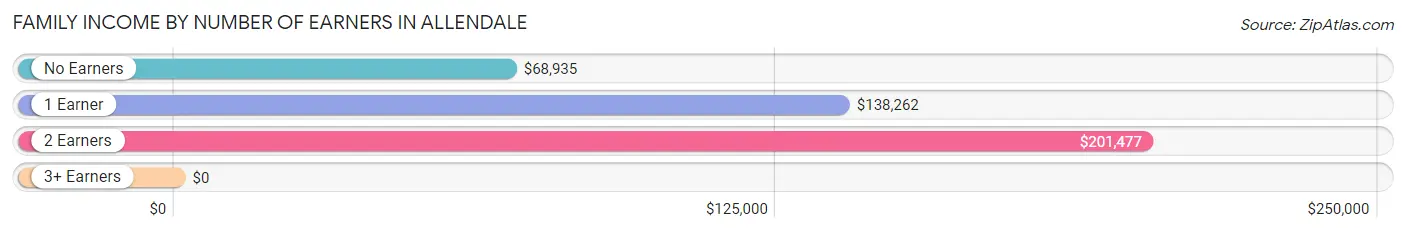
| Number of Earners | # Families | Median Income |
| No Earners | 114 (23.2%) | $68,935 |
| 1 Earner | 189 (38.4%) | $138,262 |
| 2 Earners | 113 (23.0%) | $201,477 |
| 3+ Earners | 76 (15.4%) | $0 |
| Total | 492 (100.0%) | $129,524 |
Household Income in Allendale
Household Income Brackets in Allendale
With 150 households falling in the category, the $200,000+ income range is the most frequent in Allendale, accounting for 24.7% of all households.
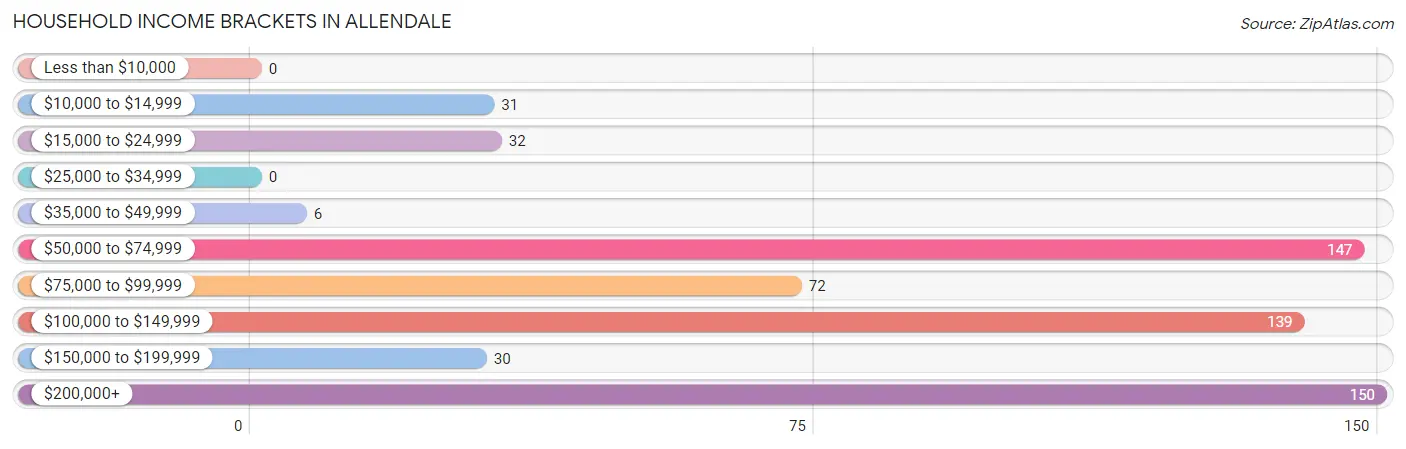
| Income Bracket | # Households | % Households |
| Less than $10,000 | 0 | 0.0% |
| $10,000 to $14,999 | 31 | 5.1% |
| $15,000 to $24,999 | 32 | 5.3% |
| $25,000 to $34,999 | 0 | 0.0% |
| $35,000 to $49,999 | 6 | 1.0% |
| $50,000 to $74,999 | 147 | 24.2% |
| $75,000 to $99,999 | 72 | 11.9% |
| $100,000 to $149,999 | 139 | 22.9% |
| $150,000 to $199,999 | 30 | 4.9% |
| $200,000+ | 150 | 24.7% |
Household Income by Householder Age in Allendale
The median household income in Allendale is $105,250, with the highest median household income of $138,598 found in the 25 to 44 years age bracket for the primary householder. A total of 108 households (17.8%) fall into this category. Meanwhile, the 15 to 24 years age bracket for the primary householder has the lowest median household income of $0, with 13 households (2.1%) in this group.
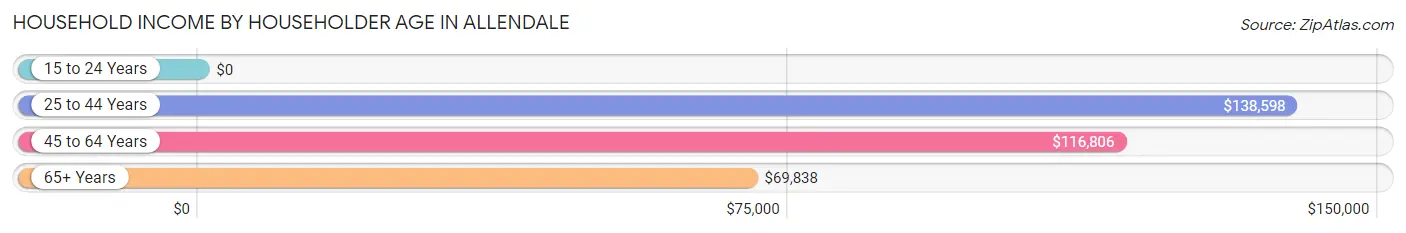
| Income Bracket | # Households | Median Income |
| 15 to 24 Years | 13 (2.1%) | $0 |
| 25 to 44 Years | 108 (17.8%) | $138,598 |
| 45 to 64 Years | 187 (30.8%) | $116,806 |
| 65+ Years | 299 (49.3%) | $69,838 |
| Total | 607 (100.0%) | $105,250 |
Poverty in Allendale
Income Below Poverty by Sex and Age in Allendale
With 5.8% poverty level for males and 12.5% for females among the residents of Allendale, 15 year old males and 16 and 17 year old females are the most vulnerable to poverty, with 35 males (100.0%) and 19 females (100.0%) in their respective age groups living below the poverty level.
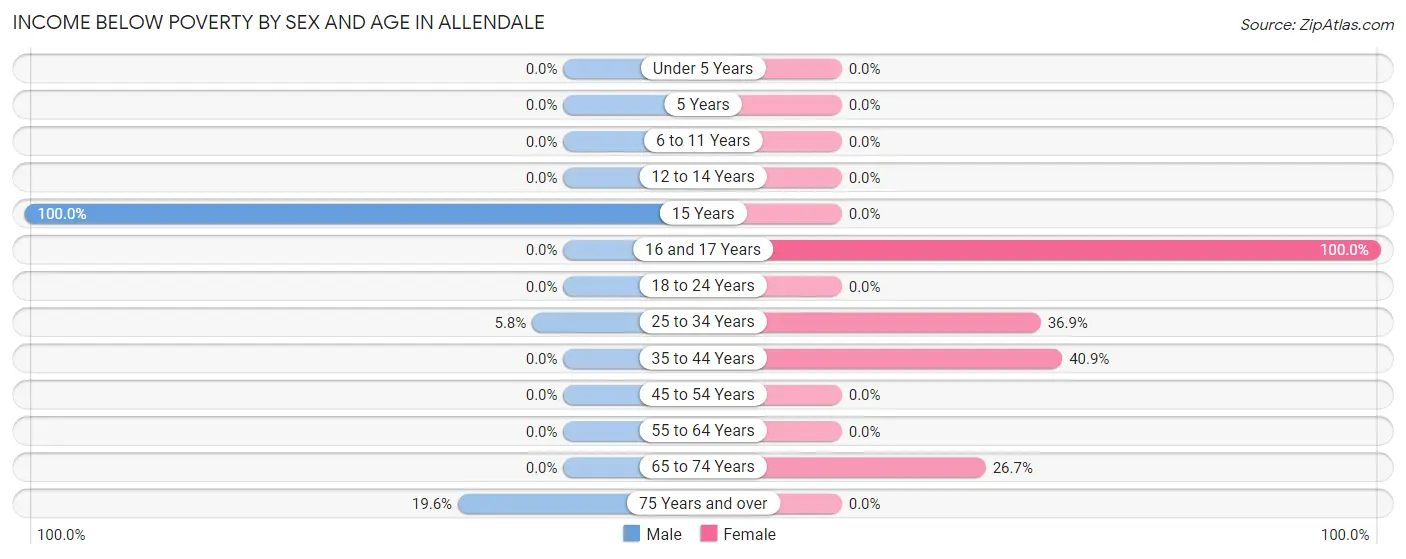
| Age Bracket | Male | Female |
| Under 5 Years | 0 (0.0%) | 0 (0.0%) |
| 5 Years | 0 (0.0%) | 0 (0.0%) |
| 6 to 11 Years | 0 (0.0%) | 0 (0.0%) |
| 12 to 14 Years | 0 (0.0%) | 0 (0.0%) |
| 15 Years | 35 (100.0%) | 0 (0.0%) |
| 16 and 17 Years | 0 (0.0%) | 19 (100.0%) |
| 18 to 24 Years | 0 (0.0%) | 0 (0.0%) |
| 25 to 34 Years | 4 (5.8%) | 48 (36.9%) |
| 35 to 44 Years | 0 (0.0%) | 18 (40.9%) |
| 45 to 54 Years | 0 (0.0%) | 0 (0.0%) |
| 55 to 64 Years | 0 (0.0%) | 0 (0.0%) |
| 65 to 74 Years | 0 (0.0%) | 31 (26.7%) |
| 75 Years and over | 9 (19.6%) | 0 (0.0%) |
| Total | 48 (5.8%) | 116 (12.5%) |
Income Above Poverty by Sex and Age in Allendale
According to the poverty statistics in Allendale, males aged under 5 years and females aged under 5 years are the age groups that are most secure financially, with 100.0% of males and 100.0% of females in these age groups living above the poverty line.
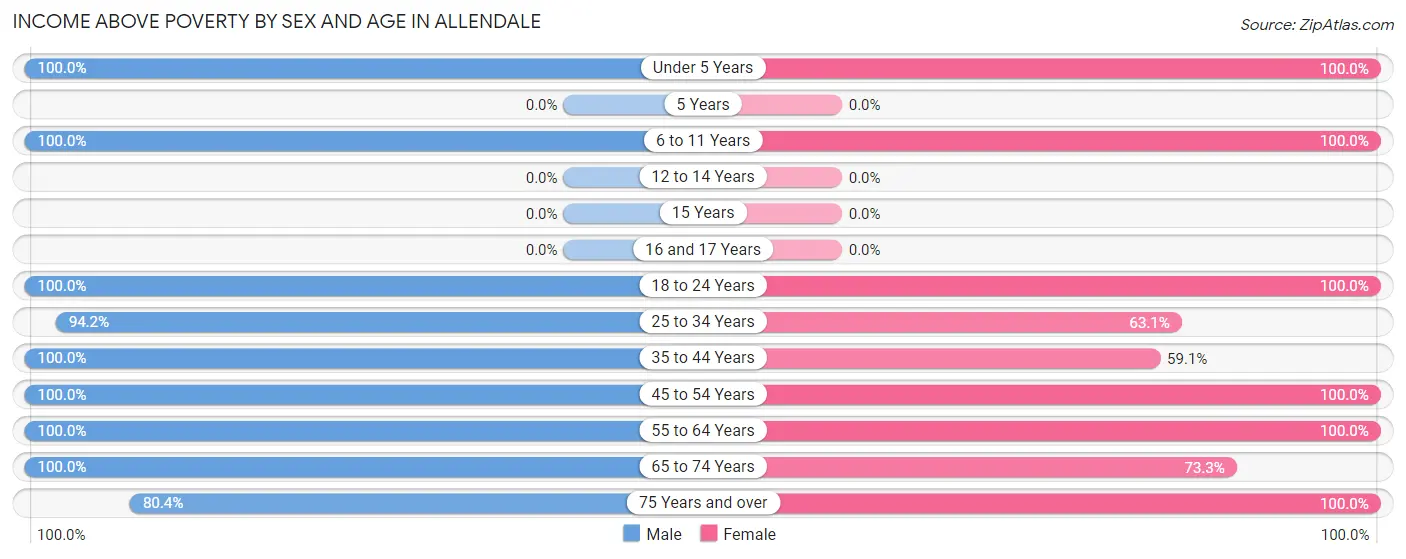
| Age Bracket | Male | Female |
| Under 5 Years | 34 (100.0%) | 64 (100.0%) |
| 5 Years | 0 (0.0%) | 0 (0.0%) |
| 6 to 11 Years | 36 (100.0%) | 14 (100.0%) |
| 12 to 14 Years | 0 (0.0%) | 0 (0.0%) |
| 15 Years | 0 (0.0%) | 0 (0.0%) |
| 16 and 17 Years | 0 (0.0%) | 0 (0.0%) |
| 18 to 24 Years | 184 (100.0%) | 91 (100.0%) |
| 25 to 34 Years | 65 (94.2%) | 82 (63.1%) |
| 35 to 44 Years | 73 (100.0%) | 26 (59.1%) |
| 45 to 54 Years | 33 (100.0%) | 48 (100.0%) |
| 55 to 64 Years | 184 (100.0%) | 203 (100.0%) |
| 65 to 74 Years | 129 (100.0%) | 85 (73.3%) |
| 75 Years and over | 37 (80.4%) | 200 (100.0%) |
| Total | 775 (94.2%) | 813 (87.5%) |
Income Below Poverty Among Married-Couple Families in Allendale
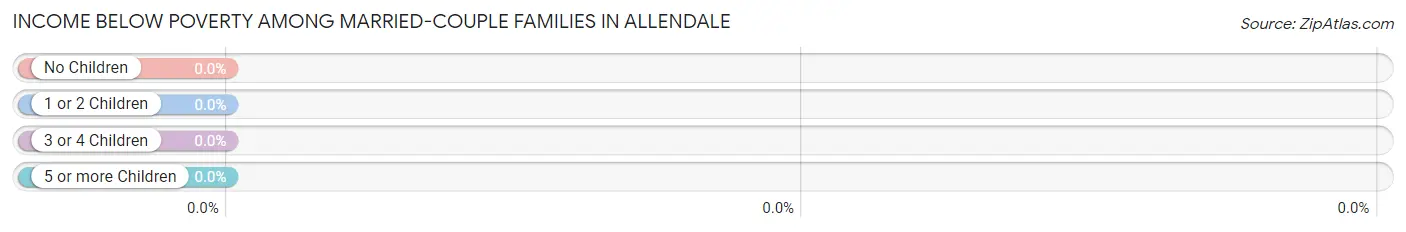
| Children | Above Poverty | Below Poverty |
| No Children | 274 (100.0%) | 0 (0.0%) |
| 1 or 2 Children | 11 (100.0%) | 0 (0.0%) |
| 3 or 4 Children | 20 (100.0%) | 0 (0.0%) |
| 5 or more Children | 0 (0.0%) | 0 (0.0%) |
| Total | 305 (100.0%) | 0 (0.0%) |
Income Below Poverty Among Single-Parent Households in Allendale
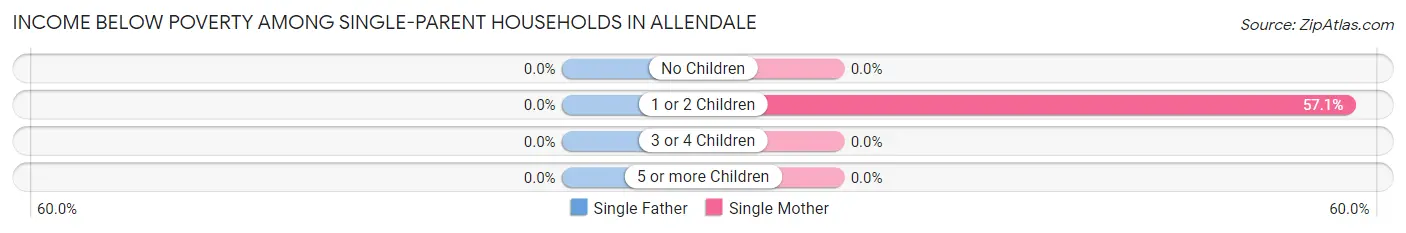
| Children | Single Father | Single Mother |
| No Children | 0 (0.0%) | 0 (0.0%) |
| 1 or 2 Children | 0 (0.0%) | 16 (57.1%) |
| 3 or 4 Children | 0 (0.0%) | 0 (0.0%) |
| 5 or more Children | 0 (0.0%) | 0 (0.0%) |
| Total | 0 (0.0%) | 16 (12.6%) |
Income Below Poverty Among Married-Couple vs Single-Parent Households in Allendale
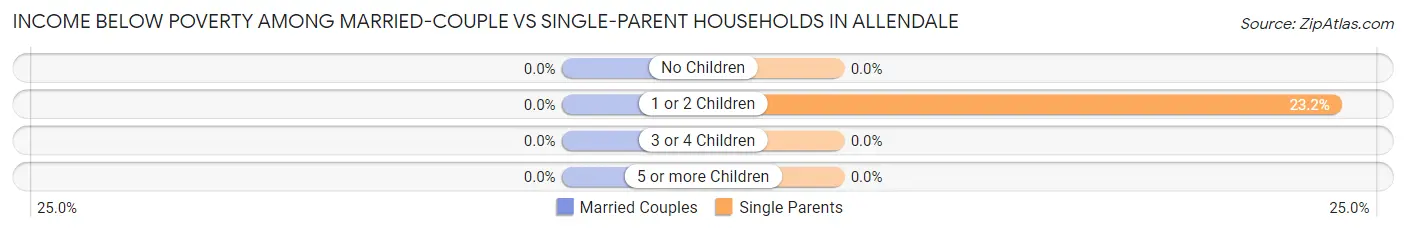
| Children | Married-Couple Families | Single-Parent Households |
| No Children | 0 (0.0%) | 0 (0.0%) |
| 1 or 2 Children | 0 (0.0%) | 16 (23.2%) |
| 3 or 4 Children | 0 (0.0%) | 0 (0.0%) |
| 5 or more Children | 0 (0.0%) | 0 (0.0%) |
| Total | 0 (0.0%) | 16 (8.6%) |
Race in Allendale
The most populous races in Allendale are White / Caucasian (1,261 | 72.0%), Hispanic or Latino (365 | 20.8%), and Two or more Races (207 | 11.8%).
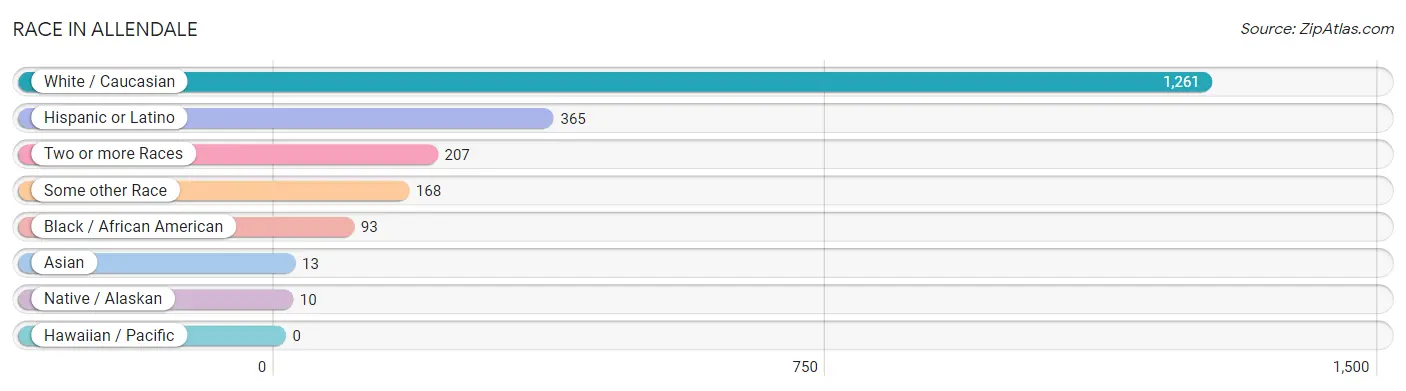
| Race | # Population | % Population |
| Asian | 13 | 0.7% |
| Black / African American | 93 | 5.3% |
| Hawaiian / Pacific | 0 | 0.0% |
| Hispanic or Latino | 365 | 20.8% |
| Native / Alaskan | 10 | 0.6% |
| White / Caucasian | 1,261 | 72.0% |
| Two or more Races | 207 | 11.8% |
| Some other Race | 168 | 9.6% |
| Total | 1,752 | 100.0% |
Ancestry in Allendale
The most populous ancestries reported in Allendale are Mexican (299 | 17.1%), European (246 | 14.0%), English (237 | 13.5%), German (205 | 11.7%), and Scottish (142 | 8.1%), together accounting for 64.5% of all Allendale residents.
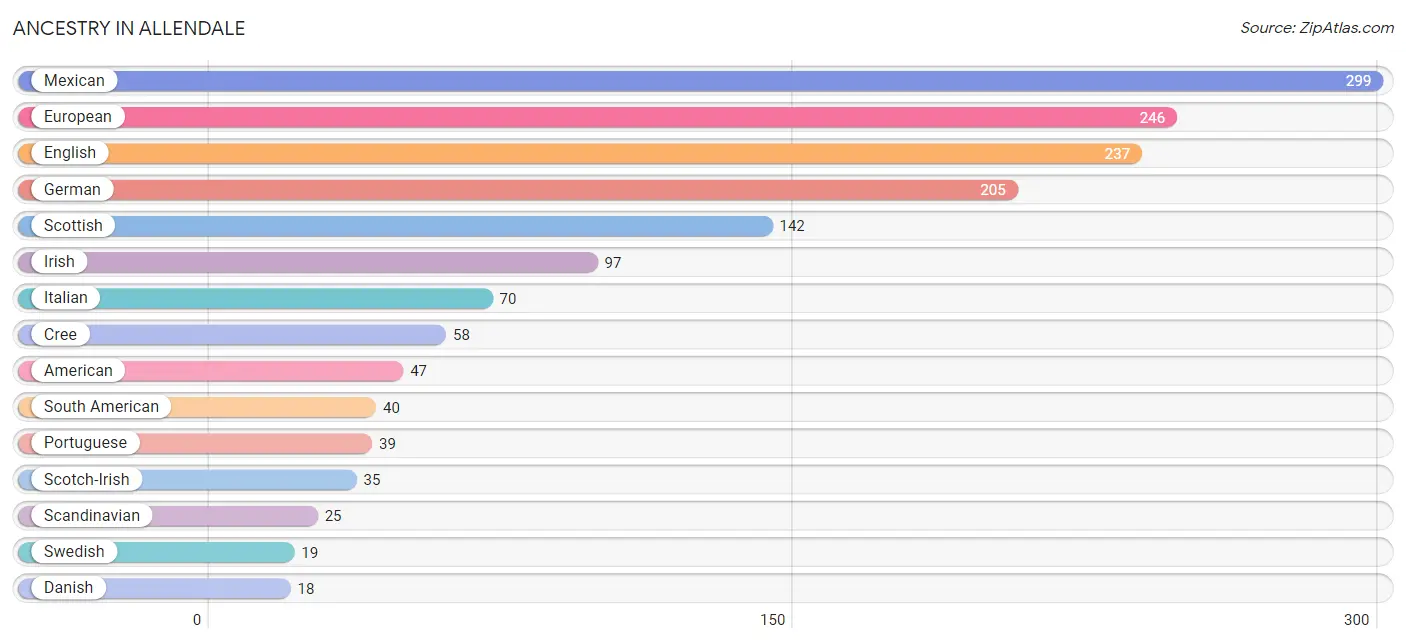
| Ancestry | # Population | % Population |
| American | 47 | 2.7% |
| Arab | 12 | 0.7% |
| Bhutanese | 11 | 0.6% |
| British | 9 | 0.5% |
| Central American | 10 | 0.6% |
| Cree | 58 | 3.3% |
| Danish | 18 | 1.0% |
| Dutch | 6 | 0.3% |
| English | 237 | 13.5% |
| European | 246 | 14.0% |
| French | 9 | 0.5% |
| German | 205 | 11.7% |
| Indian (Asian) | 13 | 0.7% |
| Irish | 97 | 5.5% |
| Italian | 70 | 4.0% |
| Lebanese | 12 | 0.7% |
| Mexican | 299 | 17.1% |
| Nicaraguan | 10 | 0.6% |
| Polish | 11 | 0.6% |
| Portuguese | 39 | 2.2% |
| Scandinavian | 25 | 1.4% |
| Scotch-Irish | 35 | 2.0% |
| Scottish | 142 | 8.1% |
| South American | 40 | 2.3% |
| Spanish | 16 | 0.9% |
| Swedish | 19 | 1.1% | View All 26 Rows |
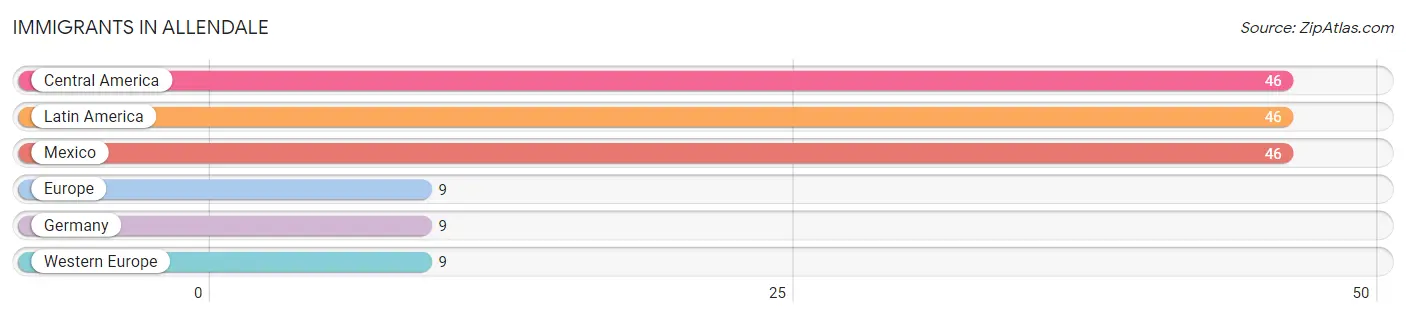
Immigrants in Allendale
The most numerous immigrant groups reported in Allendale came from Central America (46 | 2.6%), Latin America (46 | 2.6%), Mexico (46 | 2.6%), Europe (9 | 0.5%), and Germany (9 | 0.5%), together accounting for 8.9% of all Allendale residents.
| Immigration Origin | # Population | % Population |
| Central America | 46 | 2.6% |
| Europe | 9 | 0.5% |
| Germany | 9 | 0.5% |
| Latin America | 46 | 2.6% |
| Mexico | 46 | 2.6% |
| Western Europe | 9 | 0.5% | View All 6 Rows |
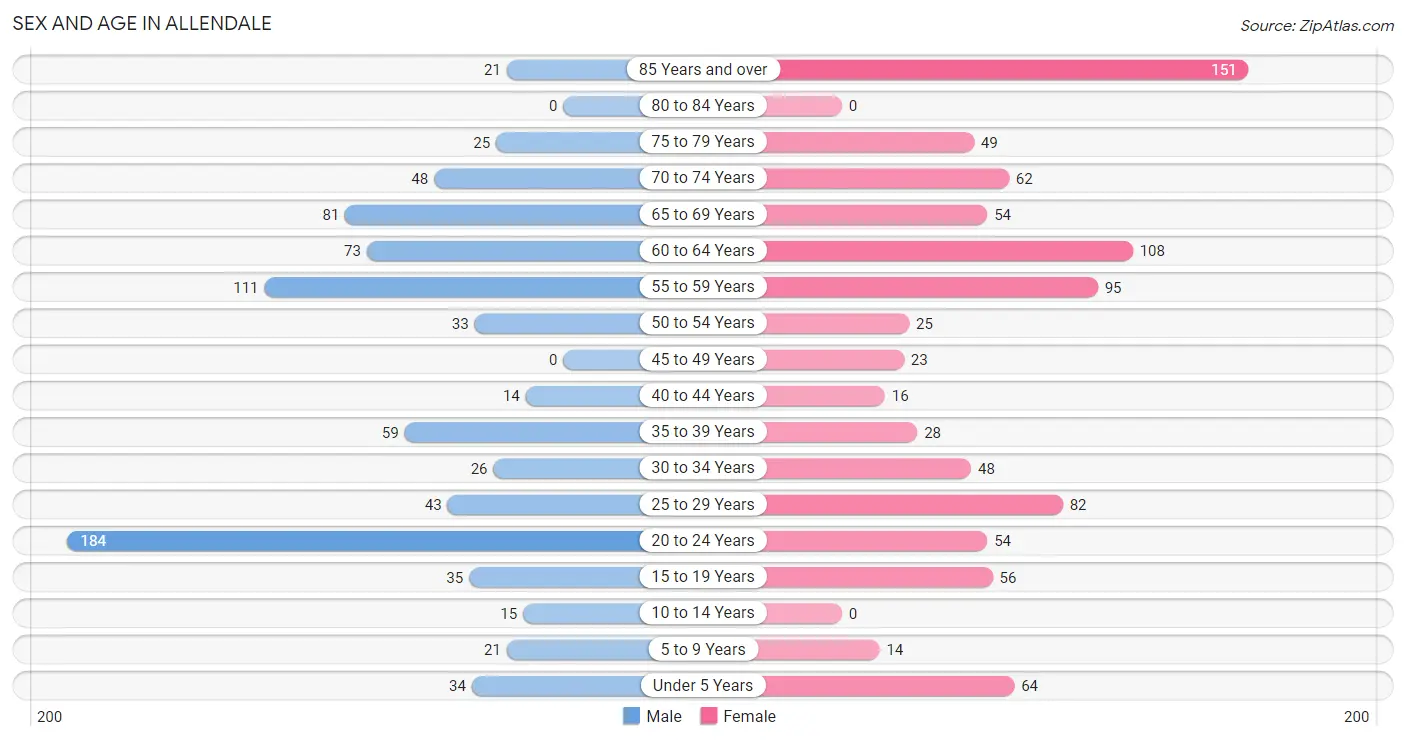
Sex and Age in Allendale
Sex and Age in Allendale
The most populous age groups in Allendale are 20 to 24 Years (184 | 22.4%) for men and 85 Years and over (151 | 16.3%) for women.
| Age Bracket | Male | Female |
| Under 5 Years | 34 (4.1%) | 64 (6.9%) |
| 5 to 9 Years | 21 (2.5%) | 14 (1.5%) |
| 10 to 14 Years | 15 (1.8%) | 0 (0.0%) |
| 15 to 19 Years | 35 (4.3%) | 56 (6.0%) |
| 20 to 24 Years | 184 (22.4%) | 54 (5.8%) |
| 25 to 29 Years | 43 (5.2%) | 82 (8.8%) |
| 30 to 34 Years | 26 (3.2%) | 48 (5.2%) |
| 35 to 39 Years | 59 (7.2%) | 28 (3.0%) |
| 40 to 44 Years | 14 (1.7%) | 16 (1.7%) |
| 45 to 49 Years | 0 (0.0%) | 23 (2.5%) |
| 50 to 54 Years | 33 (4.0%) | 25 (2.7%) |
| 55 to 59 Years | 111 (13.5%) | 95 (10.2%) |
| 60 to 64 Years | 73 (8.9%) | 108 (11.6%) |
| 65 to 69 Years | 81 (9.8%) | 54 (5.8%) |
| 70 to 74 Years | 48 (5.8%) | 62 (6.7%) |
| 75 to 79 Years | 25 (3.0%) | 49 (5.3%) |
| 80 to 84 Years | 0 (0.0%) | 0 (0.0%) |
| 85 Years and over | 21 (2.5%) | 151 (16.3%) |
| Total | 823 (100.0%) | 929 (100.0%) |
Families and Households in Allendale
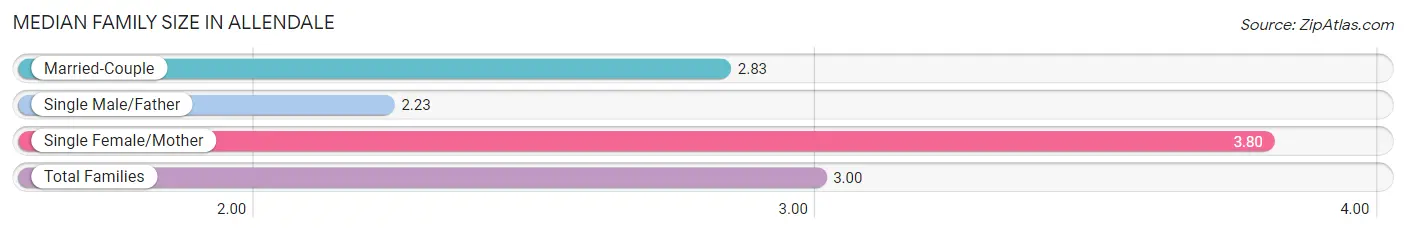
Median Family Size in Allendale
The median family size in Allendale is 3.00 persons per family, with single female/mother families (127 | 25.8%) accounting for the largest median family size of 3.8 persons per family. On the other hand, single male/father families (60 | 12.2%) represent the smallest median family size with 2.23 persons per family.
| Family Type | # Families | Family Size |
| Married-Couple | 305 (62.0%) | 2.83 |
| Single Male/Father | 60 (12.2%) | 2.23 |
| Single Female/Mother | 127 (25.8%) | 3.80 |
| Total Families | 492 (100.0%) | 3.00 |
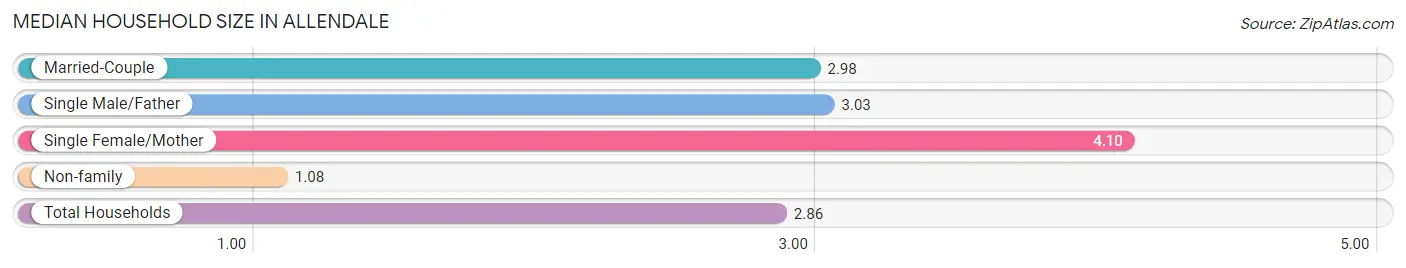
Median Household Size in Allendale
The median household size in Allendale is 2.86 persons per household, with single female/mother households (127 | 20.9%) accounting for the largest median household size of 4.1 persons per household. non-family households (115 | 19.0%) represent the smallest median household size with 1.08 persons per household.
| Household Type | # Households | Household Size |
| Married-Couple | 305 (50.2%) | 2.98 |
| Single Male/Father | 60 (9.9%) | 3.03 |
| Single Female/Mother | 127 (20.9%) | 4.10 |
| Non-family | 115 (19.0%) | 1.08 |
| Total Households | 607 (100.0%) | 2.86 |
Household Size by Marriage Status in Allendale
Out of a total of 607 households in Allendale, 492 (81.0%) are family households, while 115 (19.0%) are nonfamily households. The most numerous type of family households are 2-person households, comprising 285, and the most common type of nonfamily households are 1-person households, comprising 106.
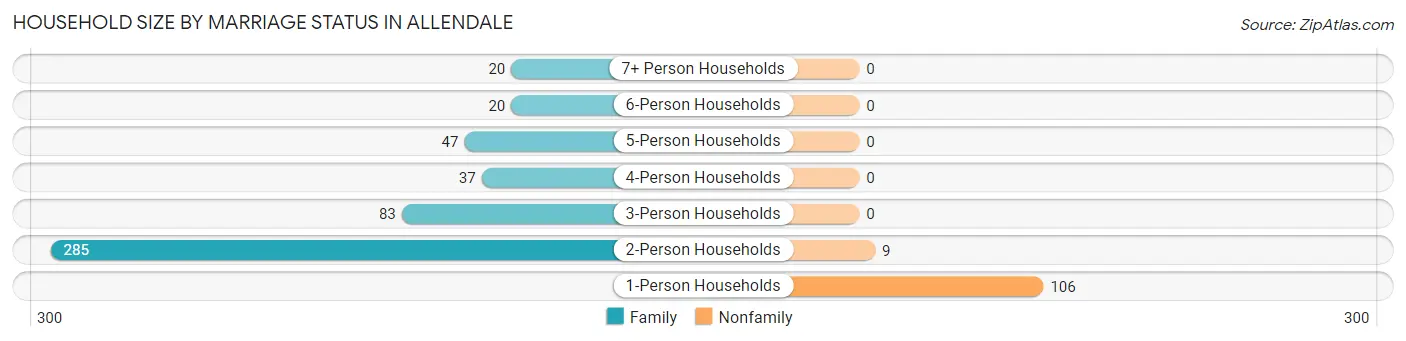
| Household Size | Family Households | Nonfamily Households |
| 1-Person Households | - | 106 (17.5%) |
| 2-Person Households | 285 (46.9%) | 9 (1.5%) |
| 3-Person Households | 83 (13.7%) | 0 (0.0%) |
| 4-Person Households | 37 (6.1%) | 0 (0.0%) |
| 5-Person Households | 47 (7.7%) | 0 (0.0%) |
| 6-Person Households | 20 (3.3%) | 0 (0.0%) |
| 7+ Person Households | 20 (3.3%) | 0 (0.0%) |
| Total | 492 (81.0%) | 115 (19.0%) |
Female Fertility in Allendale
Fertility by Age in Allendale
Average fertility rate in Allendale is 156.0 births per 1,000 women. Women in the age bracket of 20 to 34 years have the highest fertility rate with 261.0 births per 1,000 women. Women in the age bracket of 20 to 34 years acount for 100.0% of all women with births.
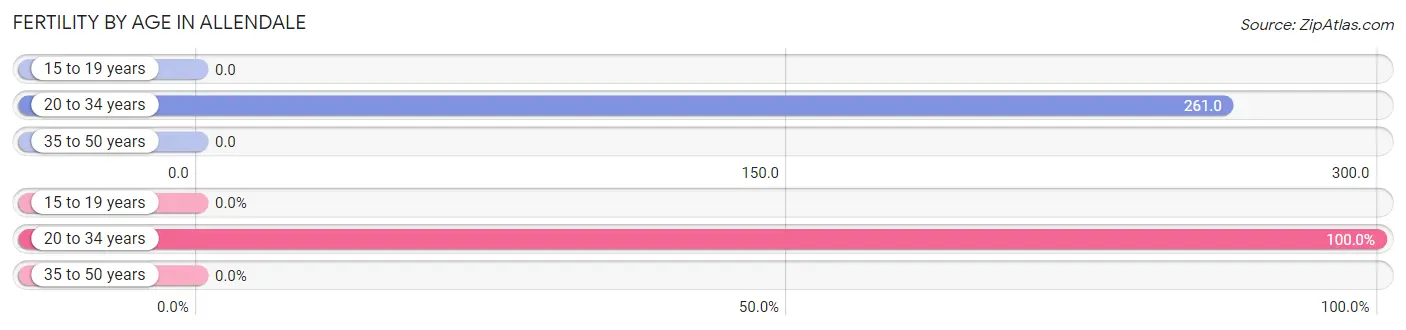
| Age Bracket | Women with Births | Births / 1,000 Women |
| 15 to 19 years | 0 (0.0%) | 0.0 |
| 20 to 34 years | 48 (100.0%) | 261.0 |
| 35 to 50 years | 0 (0.0%) | 0.0 |
| Total | 48 (100.0%) | 156.0 |
Fertility by Age by Marriage Status in Allendale
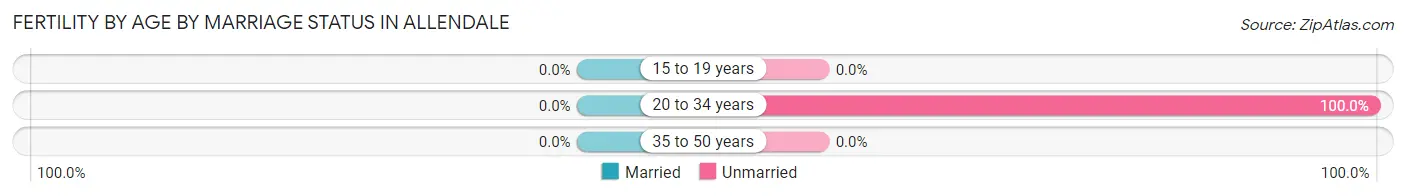
| Age Bracket | Married | Unmarried |
| 15 to 19 years | 0 (0.0%) | 0 (0.0%) |
| 20 to 34 years | 0 (0.0%) | 48 (100.0%) |
| 35 to 50 years | 0 (0.0%) | 0 (0.0%) |
| Total | 0 (0.0%) | 48 (100.0%) |
Fertility by Education in Allendale
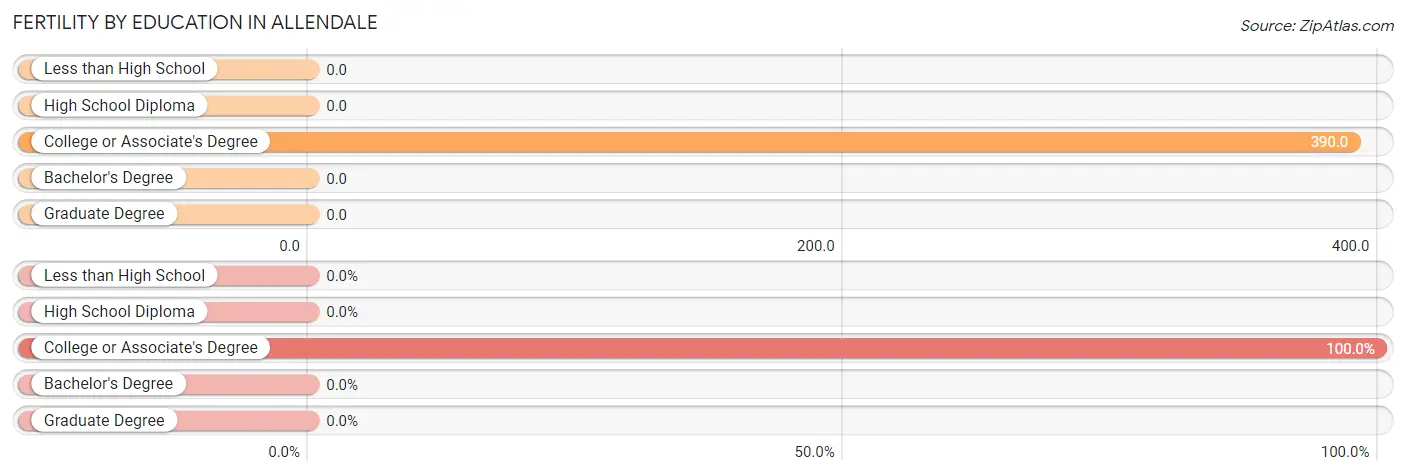
| Educational Attainment | Women with Births | Births / 1,000 Women |
| Less than High School | 0 (0.0%) | 0.0 |
| High School Diploma | 0 (0.0%) | 0.0 |
| College or Associate's Degree | 48 (100.0%) | 390.0 |
| Bachelor's Degree | 0 (0.0%) | 0.0 |
| Graduate Degree | 0 (0.0%) | 0.0 |
| Total | 48 (100.0%) | 156.0 |
Fertility by Education by Marriage Status in Allendale
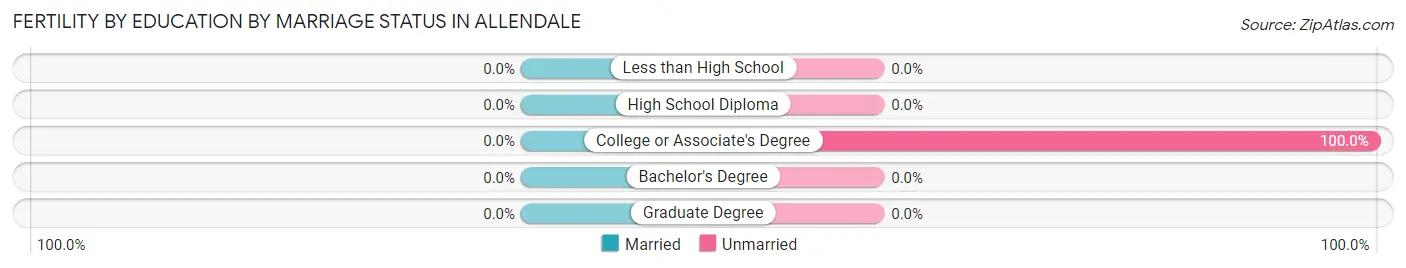
| Educational Attainment | Married | Unmarried |
| Less than High School | 0 (0.0%) | 0 (0.0%) |
| High School Diploma | 0 (0.0%) | 0 (0.0%) |
| College or Associate's Degree | 0 (0.0%) | 48 (100.0%) |
| Bachelor's Degree | 0 (0.0%) | 0 (0.0%) |
| Graduate Degree | 0 (0.0%) | 0 (0.0%) |
| Total | 0 (0.0%) | 48 (100.0%) |
Employment Characteristics in Allendale
Employment by Class of Employer in Allendale
Among the 806 employed individuals in Allendale, private company employees (577 | 71.6%), state government employees (71 | 8.8%), and not-for-profit organizations (51 | 6.3%) make up the most common classes of employment.
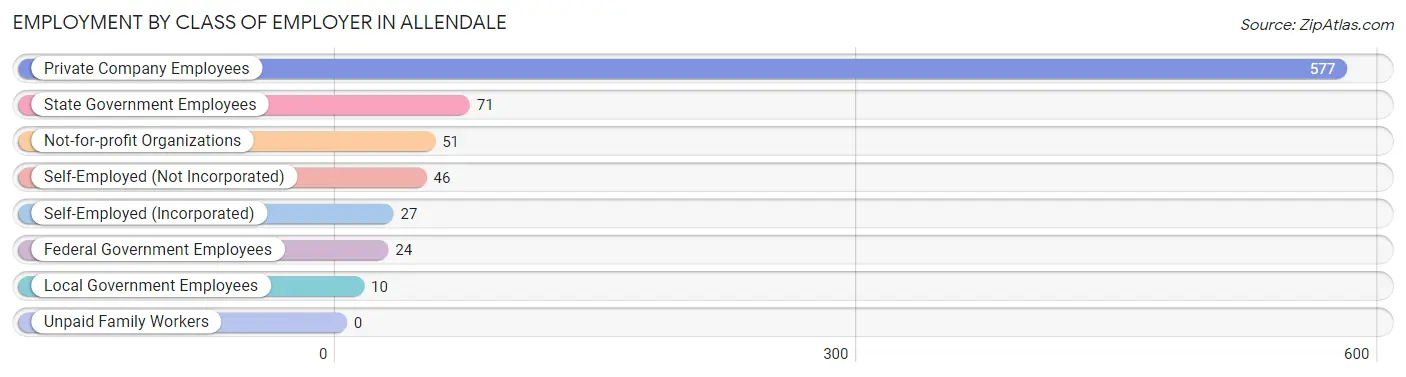
| Employer Class | # Employees | % Employees |
| Private Company Employees | 577 | 71.6% |
| Self-Employed (Incorporated) | 27 | 3.4% |
| Self-Employed (Not Incorporated) | 46 | 5.7% |
| Not-for-profit Organizations | 51 | 6.3% |
| Local Government Employees | 10 | 1.2% |
| State Government Employees | 71 | 8.8% |
| Federal Government Employees | 24 | 3.0% |
| Unpaid Family Workers | 0 | 0.0% |
| Total | 806 | 100.0% |
Employment Status by Age in Allendale
According to the labor force statistics for Allendale, out of the total population over 16 years of age (1,569), 54.4% or 854 individuals are in the labor force, with 5.4% or 46 of them unemployed. The age group with the highest labor force participation rate is 25 to 29 years, with 100.0% or 125 individuals in the labor force. Within the labor force, the 20 to 24 years age range has the highest percentage of unemployed individuals, with 15.1% or 30 of them being unemployed.
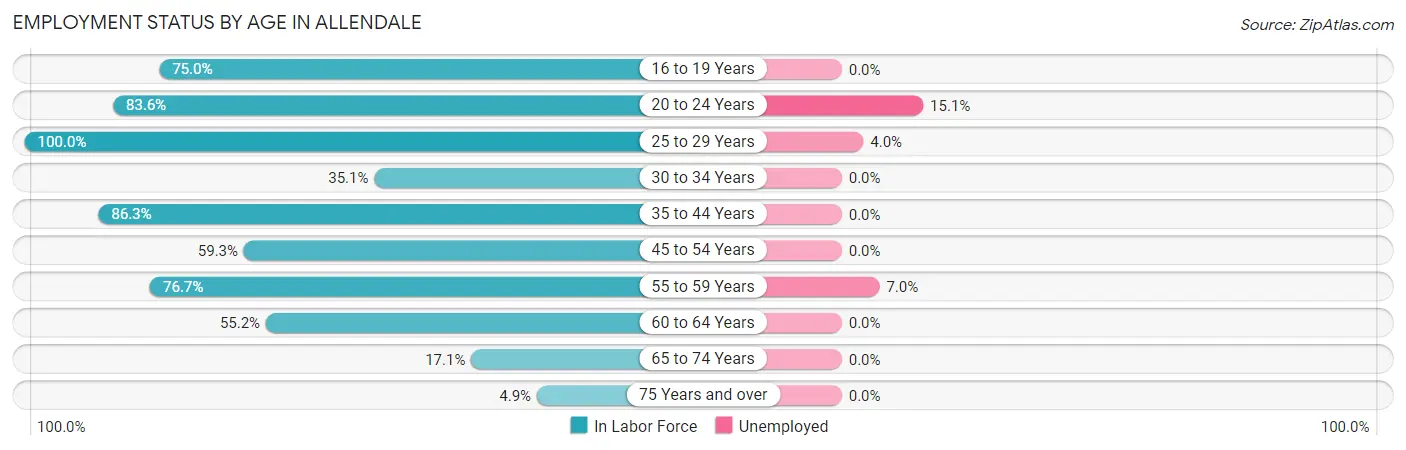
| Age Bracket | In Labor Force | Unemployed |
| 16 to 19 Years | 42 (75.0%) | 0 (0.0%) |
| 20 to 24 Years | 199 (83.6%) | 30 (15.1%) |
| 25 to 29 Years | 125 (100.0%) | 5 (4.0%) |
| 30 to 34 Years | 26 (35.1%) | 0 (0.0%) |
| 35 to 44 Years | 101 (86.3%) | 0 (0.0%) |
| 45 to 54 Years | 48 (59.3%) | 0 (0.0%) |
| 55 to 59 Years | 158 (76.7%) | 11 (7.0%) |
| 60 to 64 Years | 100 (55.2%) | 0 (0.0%) |
| 65 to 74 Years | 42 (17.1%) | 0 (0.0%) |
| 75 Years and over | 12 (4.9%) | 0 (0.0%) |
| Total | 854 (54.4%) | 46 (5.4%) |
Employment Status by Educational Attainment in Allendale
According to labor force statistics for Allendale, 71.2% of individuals (558) out of the total population between 25 and 64 years of age (784) are in the labor force, with 2.8% or 16 of them being unemployed. The group with the highest labor force participation rate are those with the educational attainment of less than high school, with 100.0% or 24 individuals in the labor force. Within the labor force, individuals with high school diploma education have the highest percentage of unemployment, with 8.5% or 11 of them being unemployed.
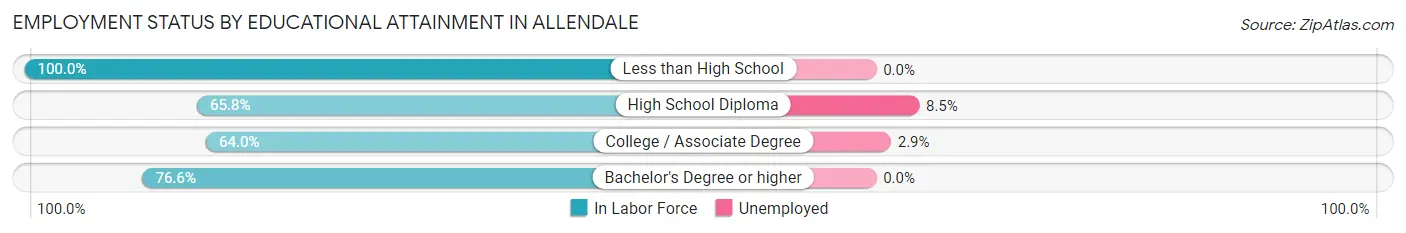
| Educational Attainment | In Labor Force | Unemployed |
| Less than High School | 24 (100.0%) | 0 (0.0%) |
| High School Diploma | 129 (65.8%) | 17 (8.5%) |
| College / Associate Degree | 137 (64.0%) | 6 (2.9%) |
| Bachelor's Degree or higher | 268 (76.6%) | 0 (0.0%) |
| Total | 558 (71.2%) | 22 (2.8%) |
Employment Occupations by Sex in Allendale
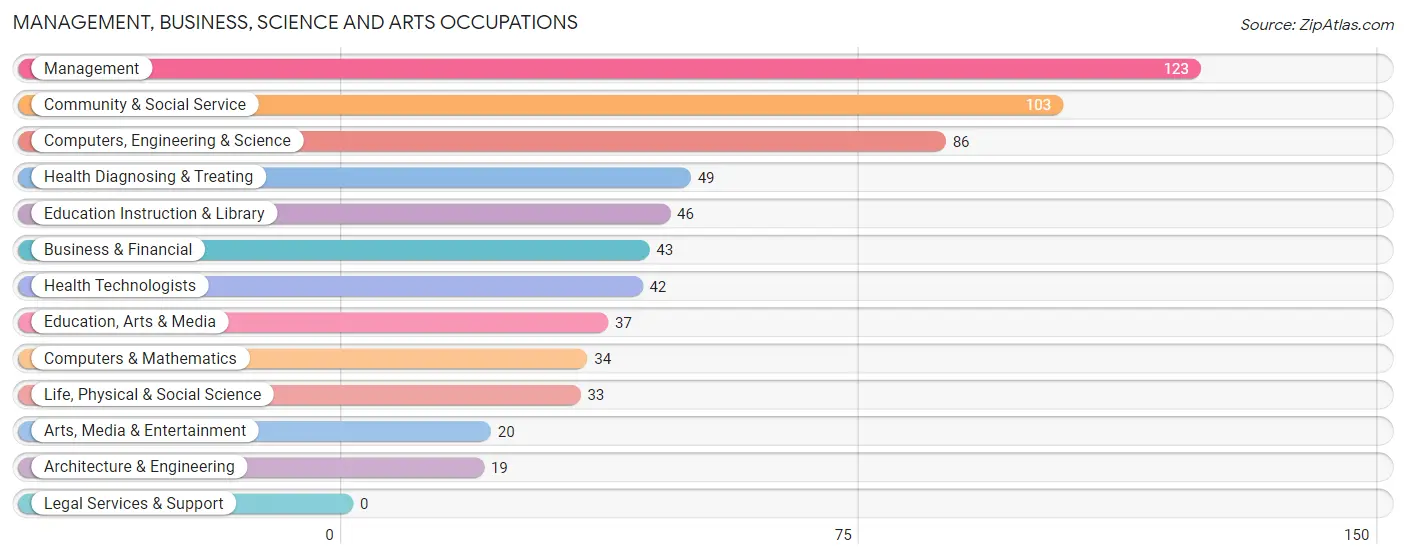
Management, Business, Science and Arts Occupations
The most common Management, Business, Science and Arts occupations in Allendale are Management (123 | 15.7%), Community & Social Service (103 | 13.1%), Computers, Engineering & Science (86 | 11.0%), Health Diagnosing & Treating (49 | 6.2%), and Education Instruction & Library (46 | 5.9%).
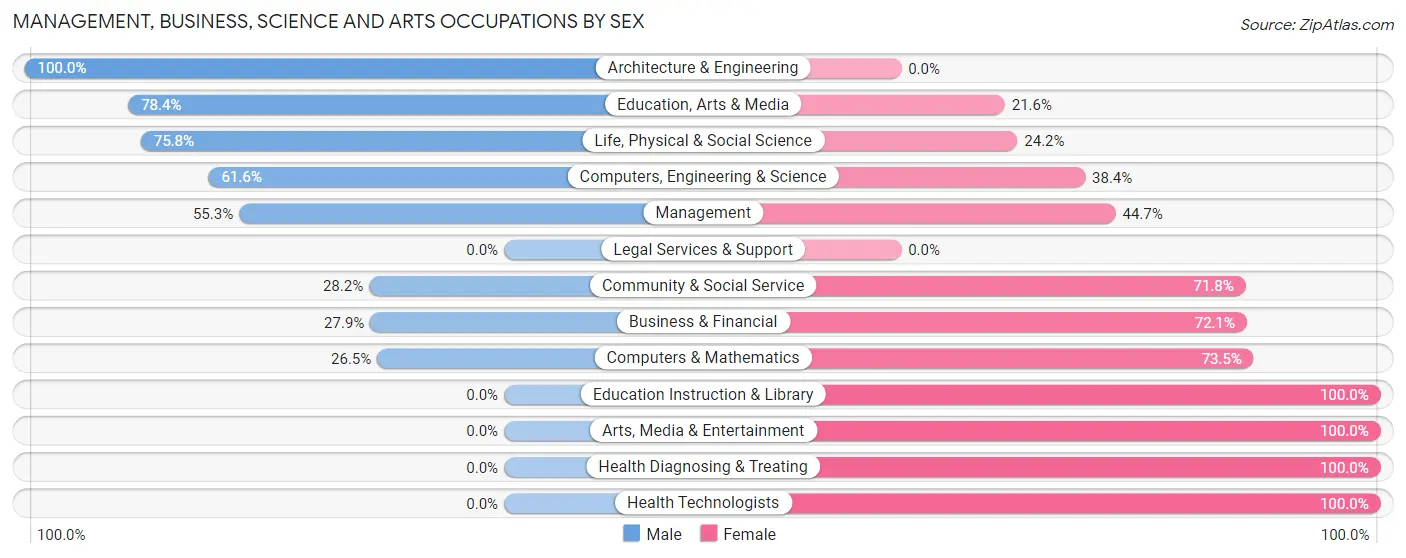
Management, Business, Science and Arts Occupations by Sex
Within the Management, Business, Science and Arts occupations in Allendale, the most male-oriented occupations are Architecture & Engineering (100.0%), Education, Arts & Media (78.4%), and Life, Physical & Social Science (75.8%), while the most female-oriented occupations are Education Instruction & Library (100.0%), Arts, Media & Entertainment (100.0%), and Health Diagnosing & Treating (100.0%).
| Occupation | Male | Female |
| Management | 68 (55.3%) | 55 (44.7%) |
| Business & Financial | 12 (27.9%) | 31 (72.1%) |
| Computers, Engineering & Science | 53 (61.6%) | 33 (38.4%) |
| Computers & Mathematics | 9 (26.5%) | 25 (73.5%) |
| Architecture & Engineering | 19 (100.0%) | 0 (0.0%) |
| Life, Physical & Social Science | 25 (75.8%) | 8 (24.2%) |
| Community & Social Service | 29 (28.2%) | 74 (71.8%) |
| Education, Arts & Media | 29 (78.4%) | 8 (21.6%) |
| Legal Services & Support | 0 (0.0%) | 0 (0.0%) |
| Education Instruction & Library | 0 (0.0%) | 46 (100.0%) |
| Arts, Media & Entertainment | 0 (0.0%) | 20 (100.0%) |
| Health Diagnosing & Treating | 0 (0.0%) | 49 (100.0%) |
| Health Technologists | 0 (0.0%) | 42 (100.0%) |
| Total (Category) | 162 (40.1%) | 242 (59.9%) |
| Total (Overall) | 389 (49.6%) | 395 (50.4%) |
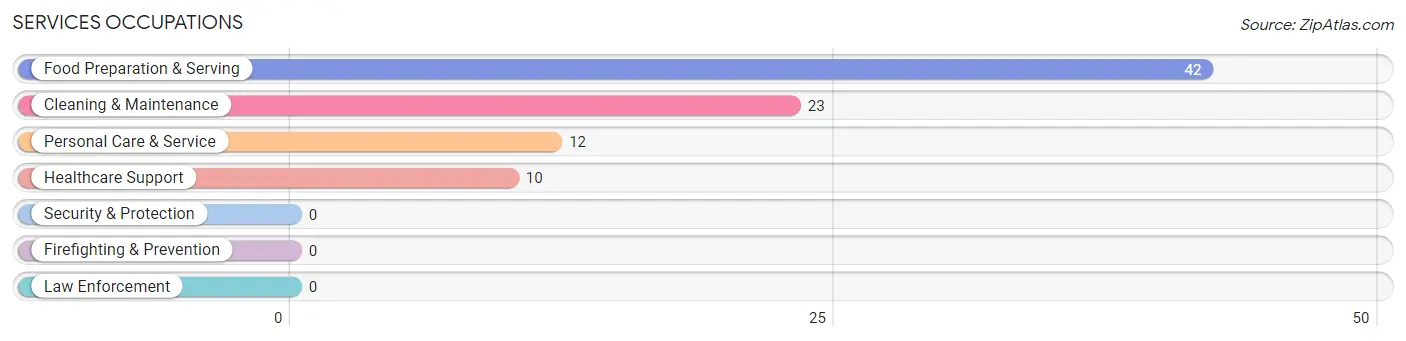
Services Occupations
The most common Services occupations in Allendale are Food Preparation & Serving (42 | 5.4%), Cleaning & Maintenance (23 | 2.9%), Personal Care & Service (12 | 1.5%), and Healthcare Support (10 | 1.3%).
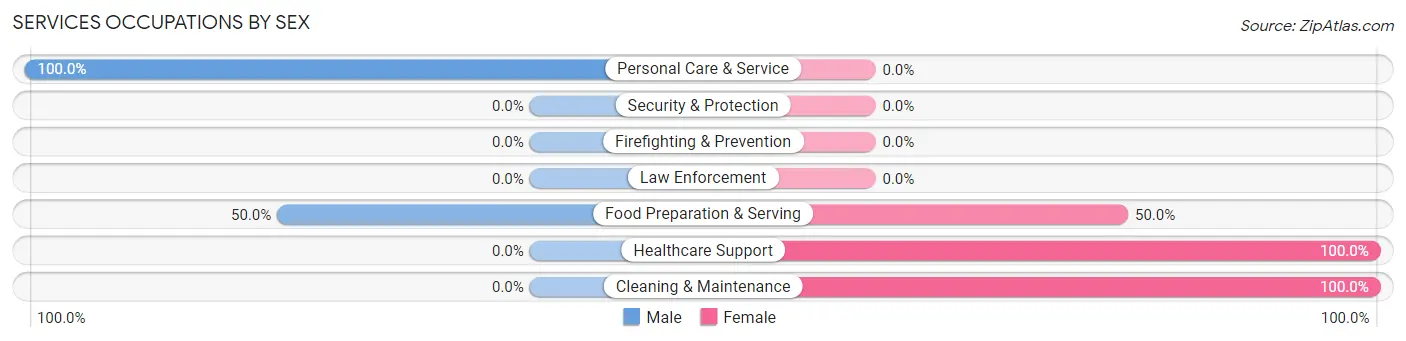
Services Occupations by Sex
Within the Services occupations in Allendale, the most male-oriented occupations are Personal Care & Service (100.0%), and Food Preparation & Serving (50.0%), while the most female-oriented occupations are Healthcare Support (100.0%), Cleaning & Maintenance (100.0%), and Food Preparation & Serving (50.0%).
| Occupation | Male | Female |
| Healthcare Support | 0 (0.0%) | 10 (100.0%) |
| Security & Protection | 0 (0.0%) | 0 (0.0%) |
| Firefighting & Prevention | 0 (0.0%) | 0 (0.0%) |
| Law Enforcement | 0 (0.0%) | 0 (0.0%) |
| Food Preparation & Serving | 21 (50.0%) | 21 (50.0%) |
| Cleaning & Maintenance | 0 (0.0%) | 23 (100.0%) |
| Personal Care & Service | 12 (100.0%) | 0 (0.0%) |
| Total (Category) | 33 (37.9%) | 54 (62.1%) |
| Total (Overall) | 389 (49.6%) | 395 (50.4%) |
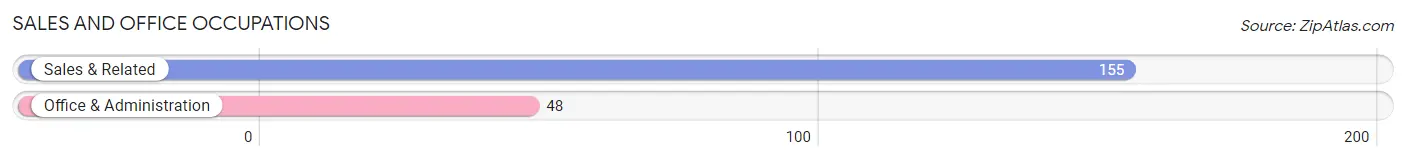
Sales and Office Occupations
The most common Sales and Office occupations in Allendale are Sales & Related (155 | 19.8%), and Office & Administration (48 | 6.1%).
Sales and Office Occupations by Sex
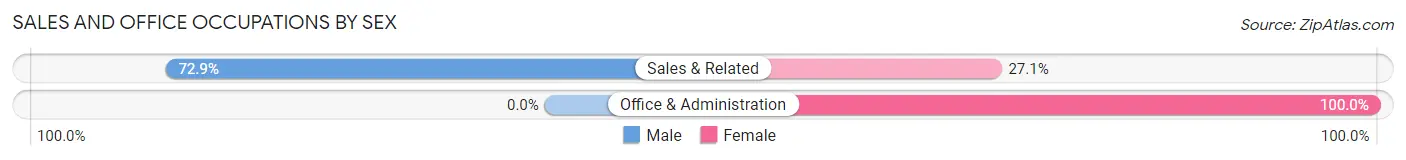
| Occupation | Male | Female |
| Sales & Related | 113 (72.9%) | 42 (27.1%) |
| Office & Administration | 0 (0.0%) | 48 (100.0%) |
| Total (Category) | 113 (55.7%) | 90 (44.3%) |
| Total (Overall) | 389 (49.6%) | 395 (50.4%) |
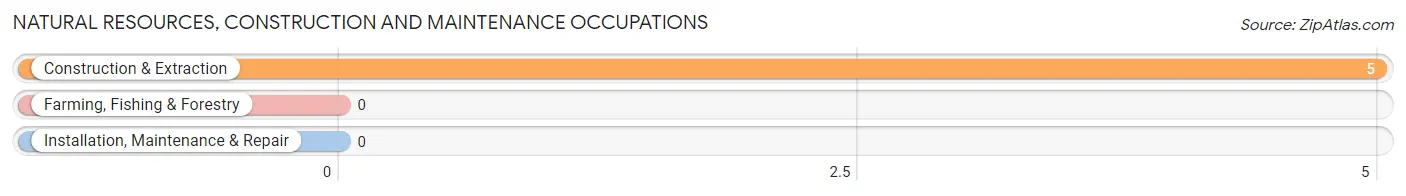
Natural Resources, Construction and Maintenance Occupations
The most common Natural Resources, Construction and Maintenance occupations in Allendale are , and Construction & Extraction (5 | 0.6%).
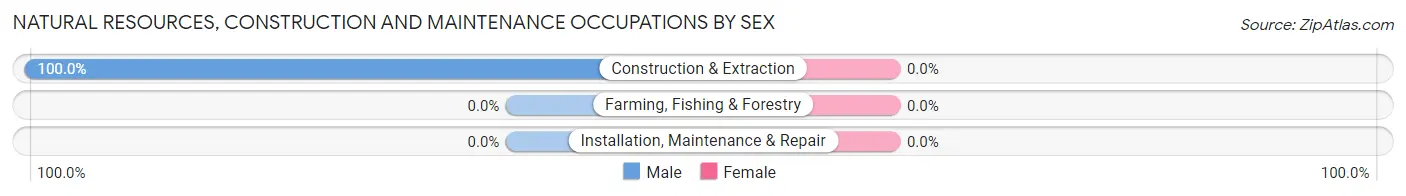
Natural Resources, Construction and Maintenance Occupations by Sex
| Occupation | Male | Female |
| Farming, Fishing & Forestry | 0 (0.0%) | 0 (0.0%) |
| Construction & Extraction | 5 (100.0%) | 0 (0.0%) |
| Installation, Maintenance & Repair | 0 (0.0%) | 0 (0.0%) |
| Total (Category) | 5 (100.0%) | 0 (0.0%) |
| Total (Overall) | 389 (49.6%) | 395 (50.4%) |
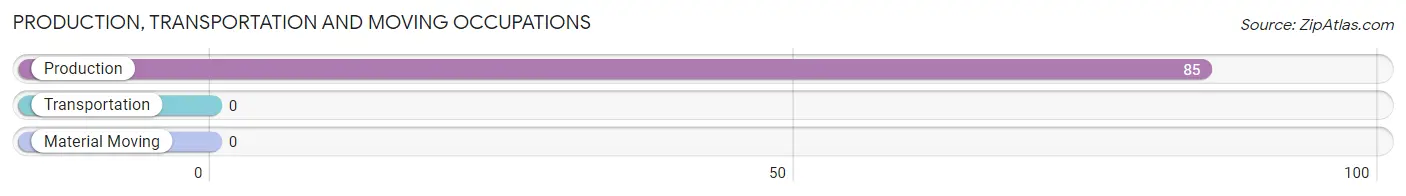
Production, Transportation and Moving Occupations
The most common Production, Transportation and Moving occupations in Allendale are , and Production (85 | 10.8%).
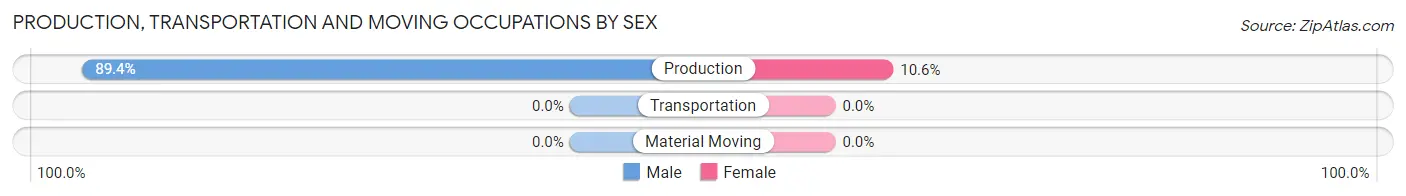
Production, Transportation and Moving Occupations by Sex
| Occupation | Male | Female |
| Production | 76 (89.4%) | 9 (10.6%) |
| Transportation | 0 (0.0%) | 0 (0.0%) |
| Material Moving | 0 (0.0%) | 0 (0.0%) |
| Total (Category) | 76 (89.4%) | 9 (10.6%) |
| Total (Overall) | 389 (49.6%) | 395 (50.4%) |
Employment Industries by Sex in Allendale
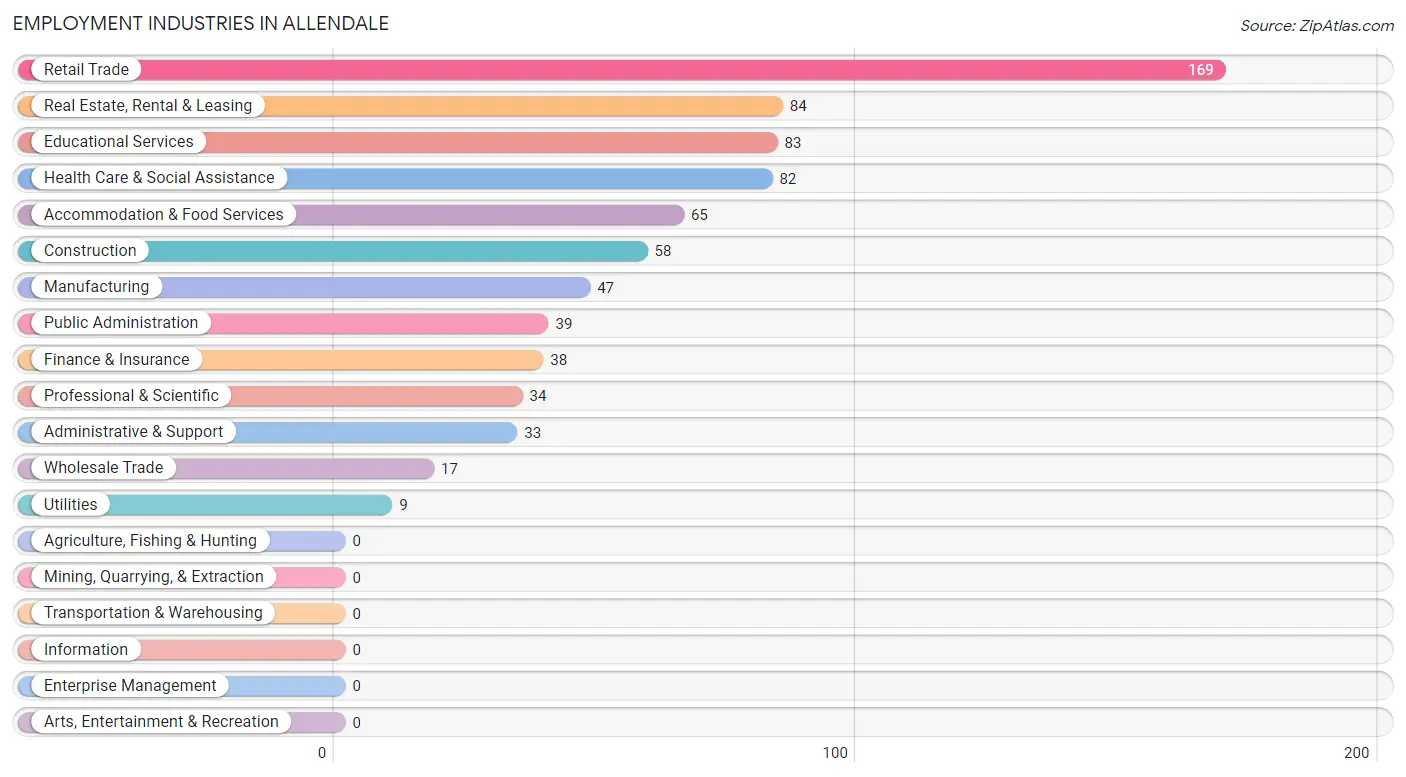
Employment Industries in Allendale
The major employment industries in Allendale include Retail Trade (169 | 21.6%), Real Estate, Rental & Leasing (84 | 10.7%), Educational Services (83 | 10.6%), Health Care & Social Assistance (82 | 10.5%), and Accommodation & Food Services (65 | 8.3%).
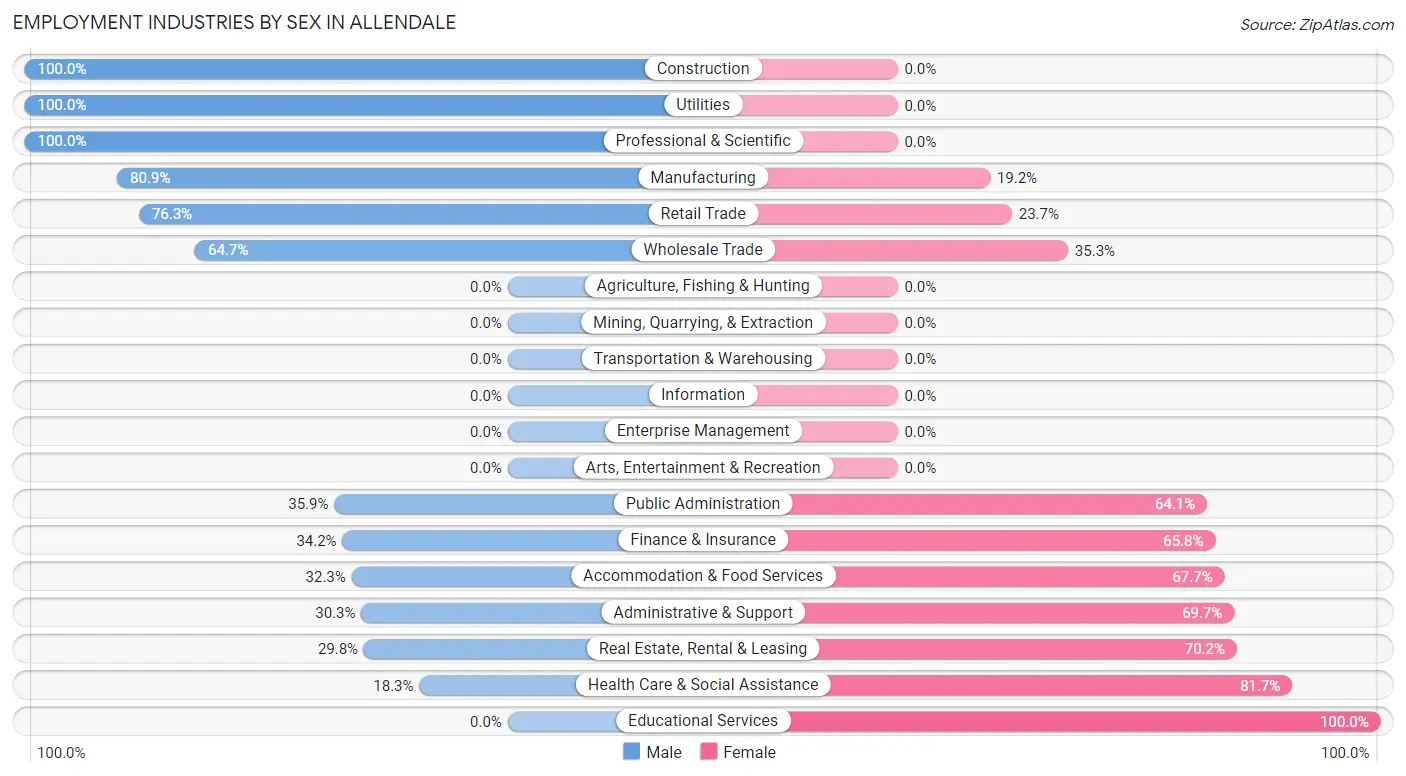
Employment Industries by Sex in Allendale
The Allendale industries that see more men than women are Construction (100.0%), Utilities (100.0%), and Professional & Scientific (100.0%), whereas the industries that tend to have a higher number of women are Educational Services (100.0%), Health Care & Social Assistance (81.7%), and Real Estate, Rental & Leasing (70.2%).
| Industry | Male | Female |
| Agriculture, Fishing & Hunting | 0 (0.0%) | 0 (0.0%) |
| Mining, Quarrying, & Extraction | 0 (0.0%) | 0 (0.0%) |
| Construction | 58 (100.0%) | 0 (0.0%) |
| Manufacturing | 38 (80.8%) | 9 (19.2%) |
| Wholesale Trade | 11 (64.7%) | 6 (35.3%) |
| Retail Trade | 129 (76.3%) | 40 (23.7%) |
| Transportation & Warehousing | 0 (0.0%) | 0 (0.0%) |
| Utilities | 9 (100.0%) | 0 (0.0%) |
| Information | 0 (0.0%) | 0 (0.0%) |
| Finance & Insurance | 13 (34.2%) | 25 (65.8%) |
| Real Estate, Rental & Leasing | 25 (29.8%) | 59 (70.2%) |
| Professional & Scientific | 34 (100.0%) | 0 (0.0%) |
| Enterprise Management | 0 (0.0%) | 0 (0.0%) |
| Administrative & Support | 10 (30.3%) | 23 (69.7%) |
| Educational Services | 0 (0.0%) | 83 (100.0%) |
| Health Care & Social Assistance | 15 (18.3%) | 67 (81.7%) |
| Arts, Entertainment & Recreation | 0 (0.0%) | 0 (0.0%) |
| Accommodation & Food Services | 21 (32.3%) | 44 (67.7%) |
| Public Administration | 14 (35.9%) | 25 (64.1%) |
| Total | 389 (49.6%) | 395 (50.4%) |
Education in Allendale
School Enrollment in Allendale
The most common levels of schooling among the 200 students in Allendale are college / undergraduate (74 | 37.0%), high school (54 | 27.0%), and elementary school (35 | 17.5%).
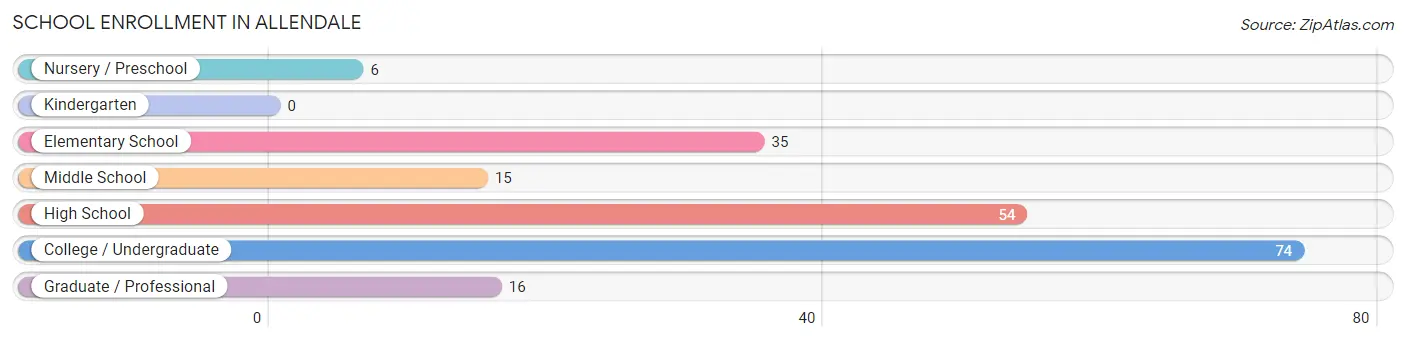
| School Level | # Students | % Students |
| Nursery / Preschool | 6 | 3.0% |
| Kindergarten | 0 | 0.0% |
| Elementary School | 35 | 17.5% |
| Middle School | 15 | 7.5% |
| High School | 54 | 27.0% |
| College / Undergraduate | 74 | 37.0% |
| Graduate / Professional | 16 | 8.0% |
| Total | 200 | 100.0% |
School Enrollment by Age by Funding Source in Allendale
Out of a total of 200 students who are enrolled in schools in Allendale, 53 (26.5%) attend a private institution, while the remaining 147 (73.5%) are enrolled in public schools. The age group of 35 years and over has the highest likelihood of being enrolled in private schools, with 16 (100.0% in the age bracket) enrolled. Conversely, the age group of 3 to 4 year olds has the lowest likelihood of being enrolled in a private school, with 6 (100.0% in the age bracket) attending a public institution.
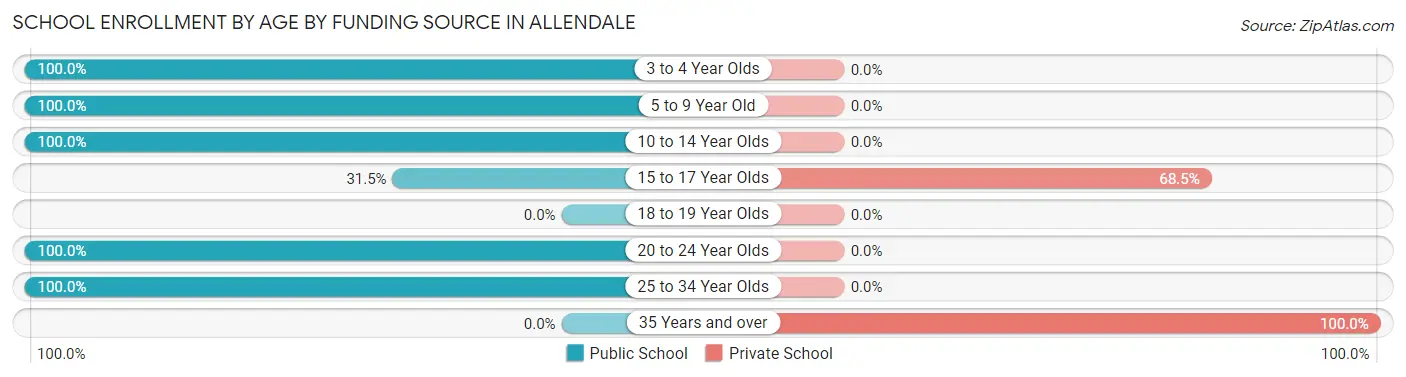
| Age Bracket | Public School | Private School |
| 3 to 4 Year Olds | 6 (100.0%) | 0 (0.0%) |
| 5 to 9 Year Old | 35 (100.0%) | 0 (0.0%) |
| 10 to 14 Year Olds | 15 (100.0%) | 0 (0.0%) |
| 15 to 17 Year Olds | 17 (31.5%) | 37 (68.5%) |
| 18 to 19 Year Olds | 0 (0.0%) | 0 (0.0%) |
| 20 to 24 Year Olds | 67 (100.0%) | 0 (0.0%) |
| 25 to 34 Year Olds | 7 (100.0%) | 0 (0.0%) |
| 35 Years and over | 0 (0.0%) | 16 (100.0%) |
| Total | 147 (73.5%) | 53 (26.5%) |
Educational Attainment by Field of Study in Allendale
Visual & performing arts (128 | 22.0%), physical & health sciences (76 | 13.0%), education (49 | 8.4%), business (44 | 7.5%), and arts & humanities (44 | 7.5%) are the most common fields of study among 583 individuals in Allendale who have obtained a bachelor's degree or higher.
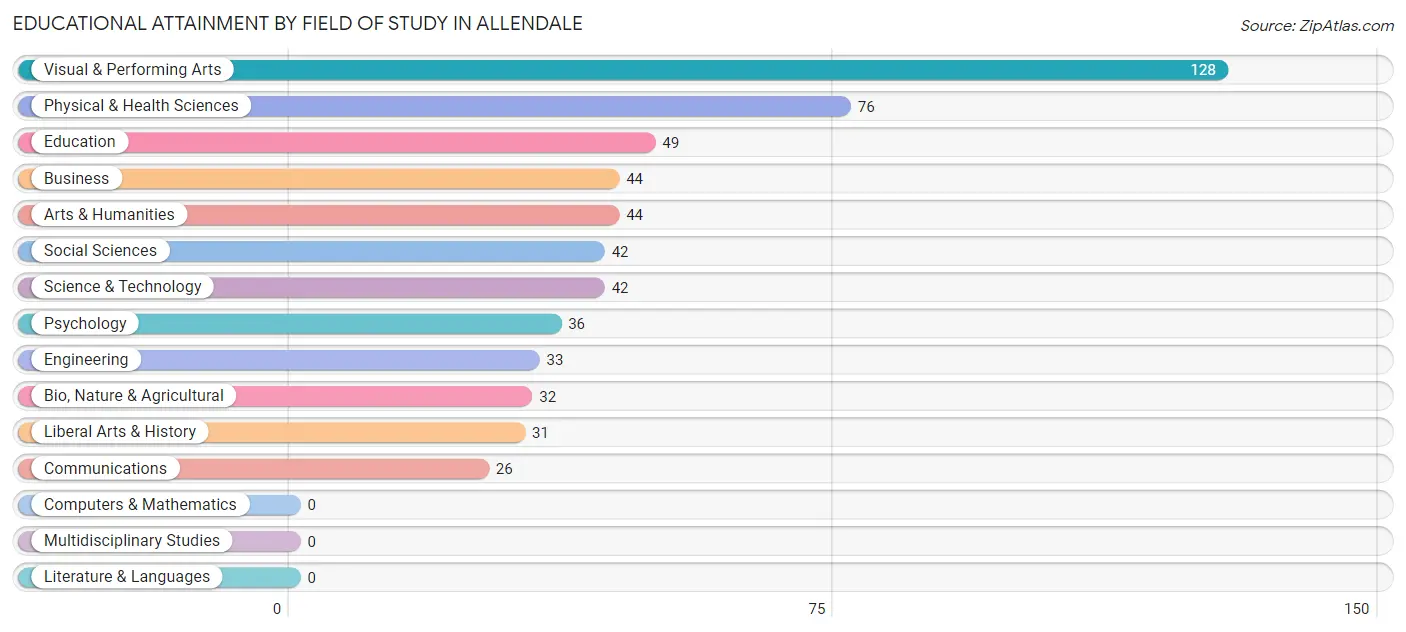
| Field of Study | # Graduates | % Graduates |
| Computers & Mathematics | 0 | 0.0% |
| Bio, Nature & Agricultural | 32 | 5.5% |
| Physical & Health Sciences | 76 | 13.0% |
| Psychology | 36 | 6.2% |
| Social Sciences | 42 | 7.2% |
| Engineering | 33 | 5.7% |
| Multidisciplinary Studies | 0 | 0.0% |
| Science & Technology | 42 | 7.2% |
| Business | 44 | 7.5% |
| Education | 49 | 8.4% |
| Literature & Languages | 0 | 0.0% |
| Liberal Arts & History | 31 | 5.3% |
| Visual & Performing Arts | 128 | 22.0% |
| Communications | 26 | 4.5% |
| Arts & Humanities | 44 | 7.5% |
| Total | 583 | 100.0% |
Transportation & Commute in Allendale
Vehicle Availability by Sex in Allendale
The most prevalent vehicle ownership categories in Allendale are males with 5 or more vehicles (132, accounting for 32.0%) and females with 5 or more vehicles (176, making up 33.6%).
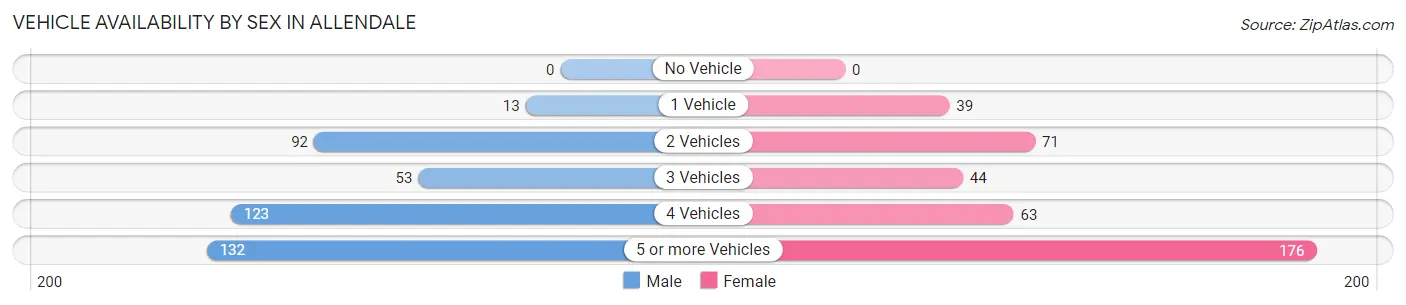
| Vehicles Available | Male | Female |
| No Vehicle | 0 (0.0%) | 0 (0.0%) |
| 1 Vehicle | 13 (3.2%) | 39 (9.9%) |
| 2 Vehicles | 92 (22.3%) | 71 (18.1%) |
| 3 Vehicles | 53 (12.8%) | 44 (11.2%) |
| 4 Vehicles | 123 (29.8%) | 63 (16.0%) |
| 5 or more Vehicles | 132 (32.0%) | 176 (44.8%) |
| Total | 413 (100.0%) | 393 (100.0%) |
Commute Time in Allendale
The most frequently occuring commute durations in Allendale are 5 to 9 minutes (140 commuters, 19.6%), 20 to 24 minutes (135 commuters, 18.9%), and 15 to 19 minutes (98 commuters, 13.7%).
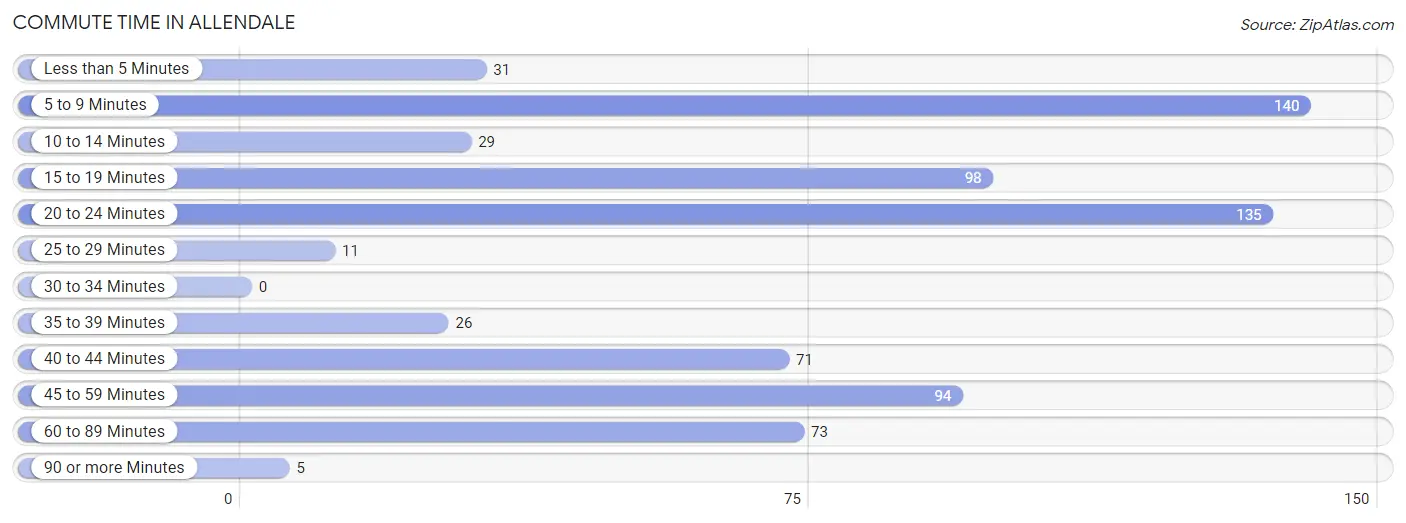
| Commute Time | # Commuters | % Commuters |
| Less than 5 Minutes | 31 | 4.3% |
| 5 to 9 Minutes | 140 | 19.6% |
| 10 to 14 Minutes | 29 | 4.1% |
| 15 to 19 Minutes | 98 | 13.7% |
| 20 to 24 Minutes | 135 | 18.9% |
| 25 to 29 Minutes | 11 | 1.5% |
| 30 to 34 Minutes | 0 | 0.0% |
| 35 to 39 Minutes | 26 | 3.6% |
| 40 to 44 Minutes | 71 | 10.0% |
| 45 to 59 Minutes | 94 | 13.2% |
| 60 to 89 Minutes | 73 | 10.2% |
| 90 or more Minutes | 5 | 0.7% |
Commute Time by Sex in Allendale
The most common commute times in Allendale are 20 to 24 minutes (96 commuters, 27.0%) for males and 5 to 9 minutes (89 commuters, 24.9%) for females.
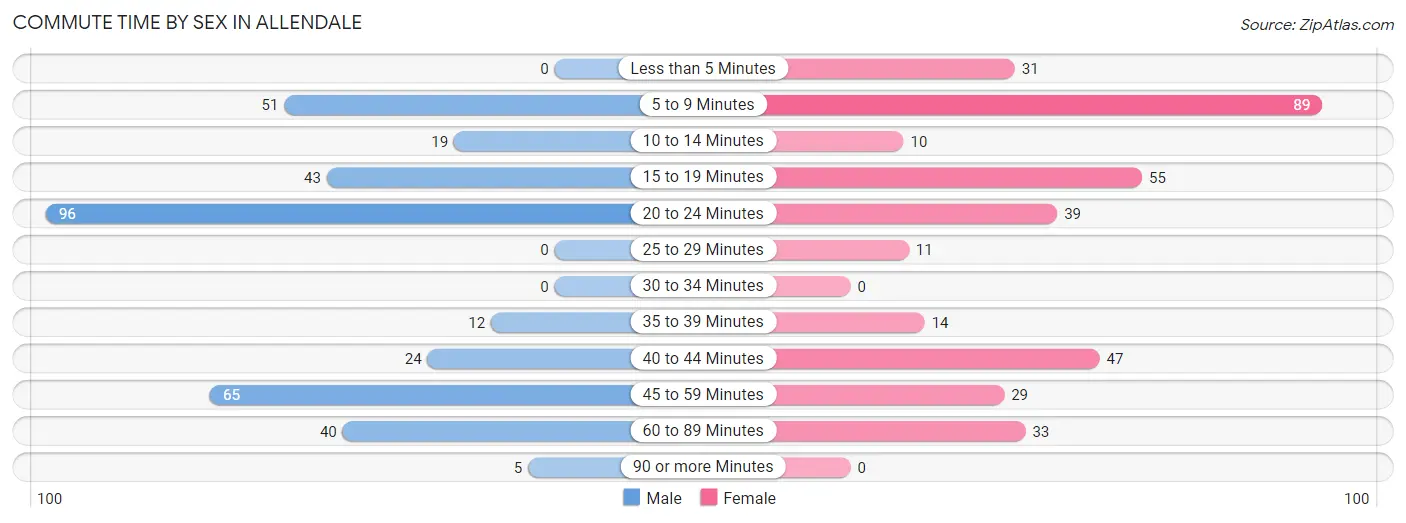
| Commute Time | Male | Female |
| Less than 5 Minutes | 0 (0.0%) | 31 (8.7%) |
| 5 to 9 Minutes | 51 (14.4%) | 89 (24.9%) |
| 10 to 14 Minutes | 19 (5.3%) | 10 (2.8%) |
| 15 to 19 Minutes | 43 (12.1%) | 55 (15.4%) |
| 20 to 24 Minutes | 96 (27.0%) | 39 (10.9%) |
| 25 to 29 Minutes | 0 (0.0%) | 11 (3.1%) |
| 30 to 34 Minutes | 0 (0.0%) | 0 (0.0%) |
| 35 to 39 Minutes | 12 (3.4%) | 14 (3.9%) |
| 40 to 44 Minutes | 24 (6.8%) | 47 (13.1%) |
| 45 to 59 Minutes | 65 (18.3%) | 29 (8.1%) |
| 60 to 89 Minutes | 40 (11.3%) | 33 (9.2%) |
| 90 or more Minutes | 5 (1.4%) | 0 (0.0%) |
Time of Departure to Work by Sex in Allendale
The most frequent times of departure to work in Allendale are 12:00 AM to 4:59 AM (95, 26.8%) for males and 7:00 AM to 7:29 AM (86, 24.0%) for females.
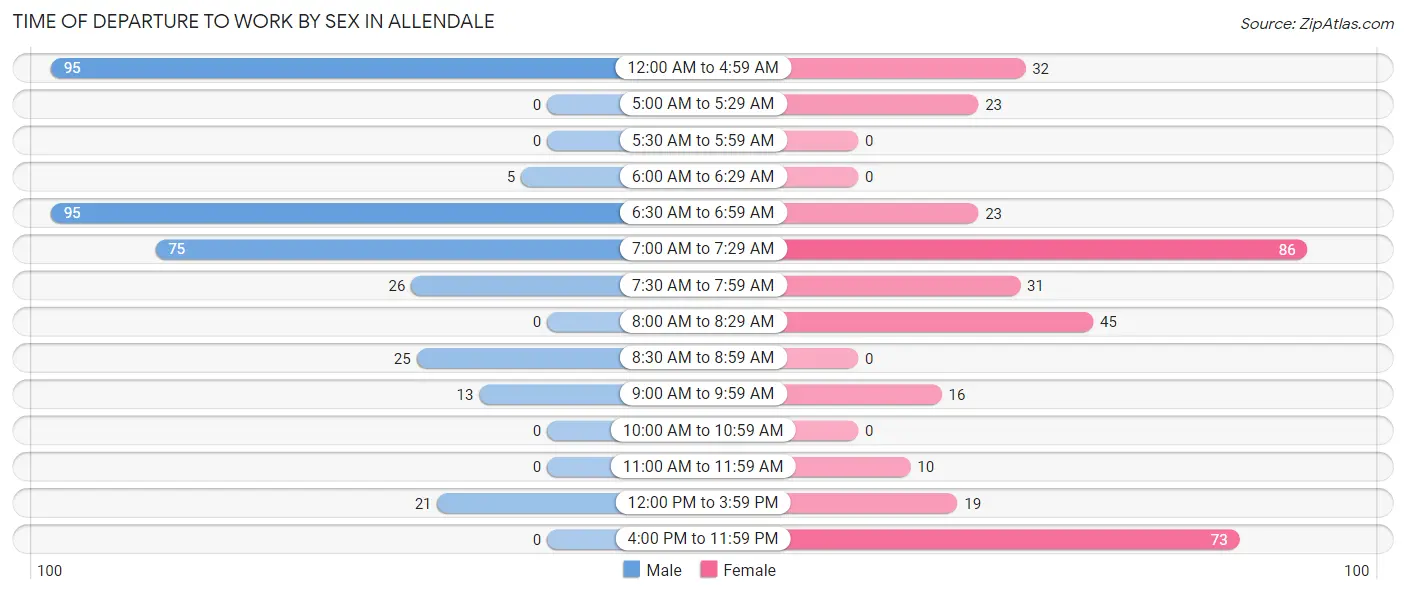
| Time of Departure | Male | Female |
| 12:00 AM to 4:59 AM | 95 (26.8%) | 32 (8.9%) |
| 5:00 AM to 5:29 AM | 0 (0.0%) | 23 (6.4%) |
| 5:30 AM to 5:59 AM | 0 (0.0%) | 0 (0.0%) |
| 6:00 AM to 6:29 AM | 5 (1.4%) | 0 (0.0%) |
| 6:30 AM to 6:59 AM | 95 (26.8%) | 23 (6.4%) |
| 7:00 AM to 7:29 AM | 75 (21.1%) | 86 (24.0%) |
| 7:30 AM to 7:59 AM | 26 (7.3%) | 31 (8.7%) |
| 8:00 AM to 8:29 AM | 0 (0.0%) | 45 (12.6%) |
| 8:30 AM to 8:59 AM | 25 (7.0%) | 0 (0.0%) |
| 9:00 AM to 9:59 AM | 13 (3.7%) | 16 (4.5%) |
| 10:00 AM to 10:59 AM | 0 (0.0%) | 0 (0.0%) |
| 11:00 AM to 11:59 AM | 0 (0.0%) | 10 (2.8%) |
| 12:00 PM to 3:59 PM | 21 (5.9%) | 19 (5.3%) |
| 4:00 PM to 11:59 PM | 0 (0.0%) | 73 (20.4%) |
| Total | 355 (100.0%) | 358 (100.0%) |
Housing Occupancy in Allendale
Occupancy by Ownership in Allendale
Of the total 607 dwellings in Allendale, owner-occupied units account for 506 (83.4%), while renter-occupied units make up 101 (16.6%).
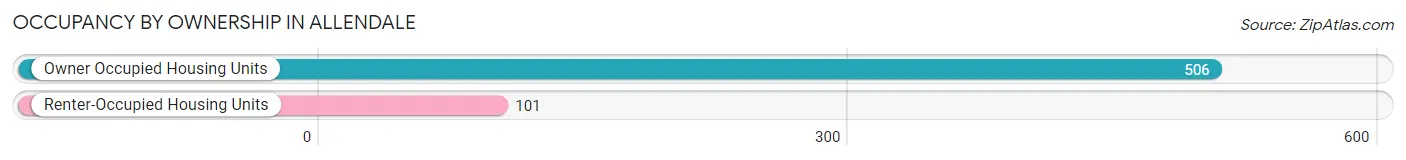
| Occupancy | # Housing Units | % Housing Units |
| Owner Occupied Housing Units | 506 | 83.4% |
| Renter-Occupied Housing Units | 101 | 16.6% |
| Total Occupied Housing Units | 607 | 100.0% |
Occupancy by Household Size in Allendale
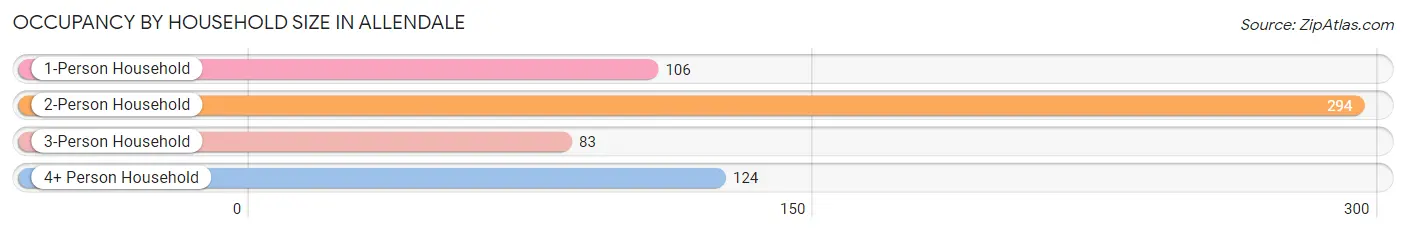
| Household Size | # Housing Units | % Housing Units |
| 1-Person Household | 106 | 17.5% |
| 2-Person Household | 294 | 48.4% |
| 3-Person Household | 83 | 13.7% |
| 4+ Person Household | 124 | 20.4% |
| Total Housing Units | 607 | 100.0% |
Occupancy by Ownership by Household Size in Allendale
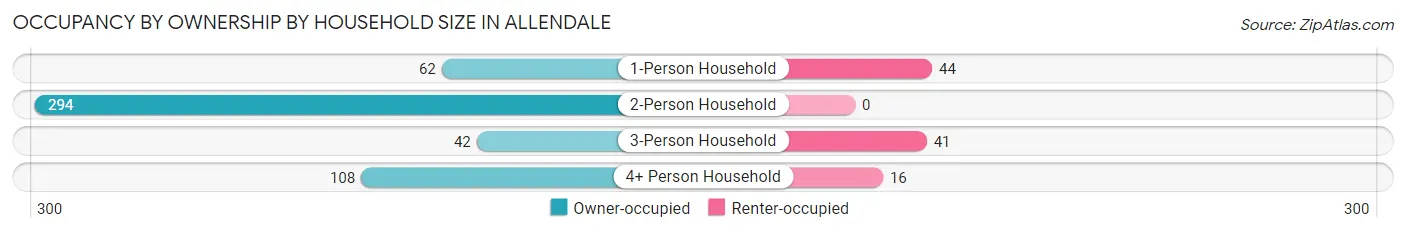
| Household Size | Owner-occupied | Renter-occupied |
| 1-Person Household | 62 (58.5%) | 44 (41.5%) |
| 2-Person Household | 294 (100.0%) | 0 (0.0%) |
| 3-Person Household | 42 (50.6%) | 41 (49.4%) |
| 4+ Person Household | 108 (87.1%) | 16 (12.9%) |
| Total Housing Units | 506 (83.4%) | 101 (16.6%) |
Occupancy by Educational Attainment in Allendale
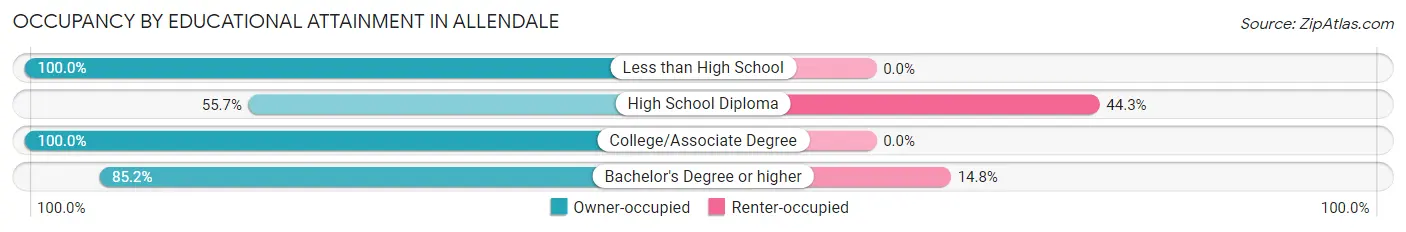
| Household Size | Owner-occupied | Renter-occupied |
| Less than High School | 39 (100.0%) | 0 (0.0%) |
| High School Diploma | 68 (55.7%) | 54 (44.3%) |
| College/Associate Degree | 128 (100.0%) | 0 (0.0%) |
| Bachelor's Degree or higher | 271 (85.2%) | 47 (14.8%) |
Occupancy by Age of Householder in Allendale
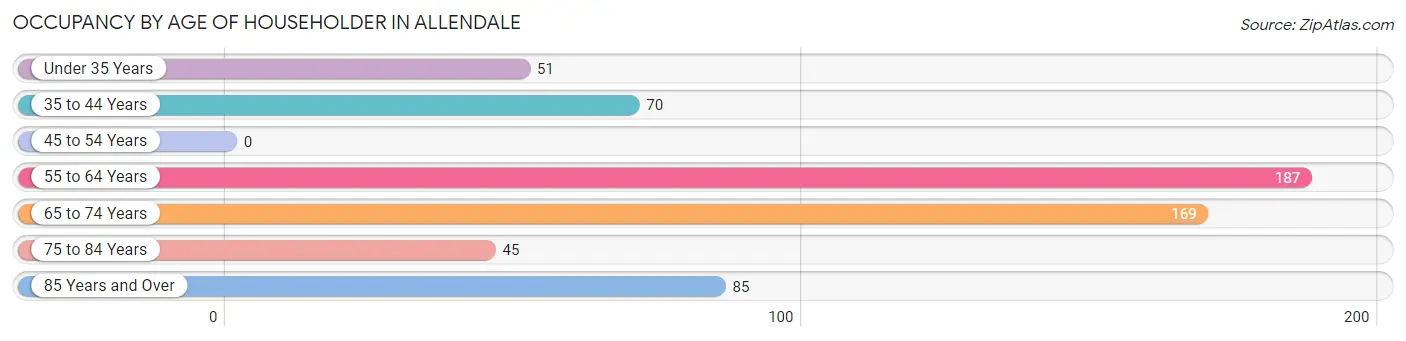
| Age Bracket | # Households | % Households |
| Under 35 Years | 51 | 8.4% |
| 35 to 44 Years | 70 | 11.5% |
| 45 to 54 Years | 0 | 0.0% |
| 55 to 64 Years | 187 | 30.8% |
| 65 to 74 Years | 169 | 27.8% |
| 75 to 84 Years | 45 | 7.4% |
| 85 Years and Over | 85 | 14.0% |
| Total | 607 | 100.0% |
Housing Finances in Allendale
Median Income by Occupancy in Allendale
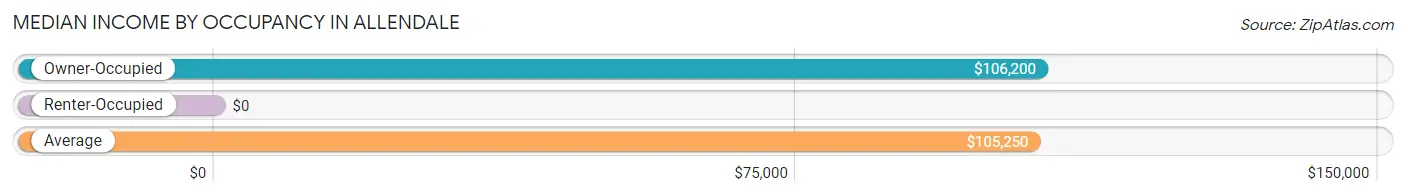
| Occupancy Type | # Households | Median Income |
| Owner-Occupied | 506 (83.4%) | $106,200 |
| Renter-Occupied | 101 (16.6%) | $0 |
| Average | 607 (100.0%) | $105,250 |
Occupancy by Householder Income Bracket in Allendale
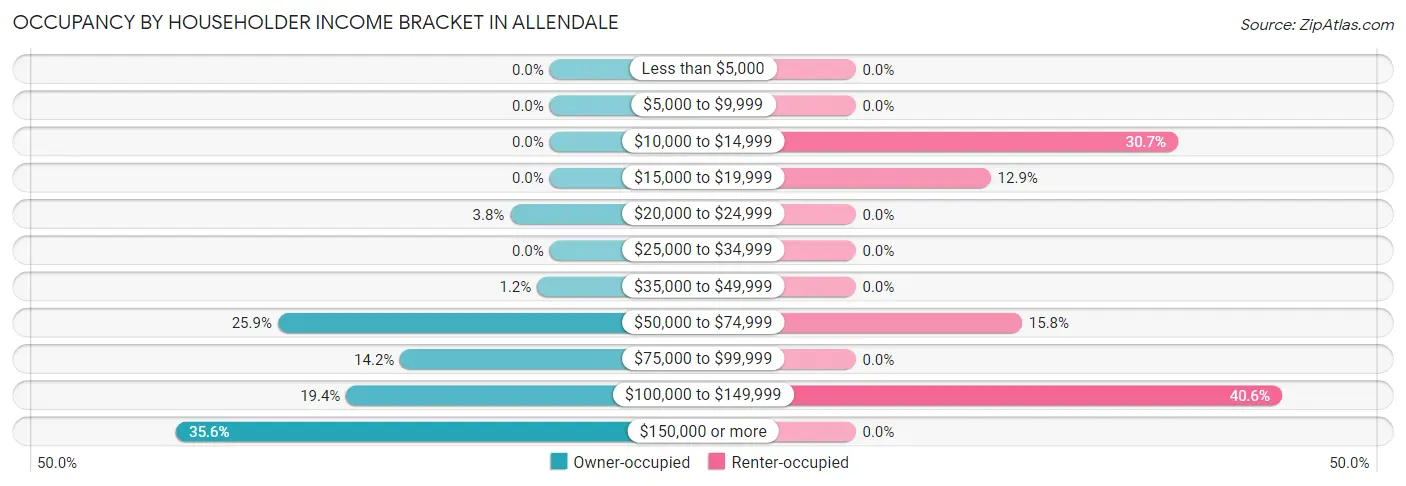
| Income Bracket | Owner-occupied | Renter-occupied |
| Less than $5,000 | 0 (0.0%) | 0 (0.0%) |
| $5,000 to $9,999 | 0 (0.0%) | 0 (0.0%) |
| $10,000 to $14,999 | 0 (0.0%) | 31 (30.7%) |
| $15,000 to $19,999 | 0 (0.0%) | 13 (12.9%) |
| $20,000 to $24,999 | 19 (3.7%) | 0 (0.0%) |
| $25,000 to $34,999 | 0 (0.0%) | 0 (0.0%) |
| $35,000 to $49,999 | 6 (1.2%) | 0 (0.0%) |
| $50,000 to $74,999 | 131 (25.9%) | 16 (15.8%) |
| $75,000 to $99,999 | 72 (14.2%) | 0 (0.0%) |
| $100,000 to $149,999 | 98 (19.4%) | 41 (40.6%) |
| $150,000 or more | 180 (35.6%) | 0 (0.0%) |
| Total | 506 (100.0%) | 101 (100.0%) |
Monthly Housing Cost Tiers in Allendale
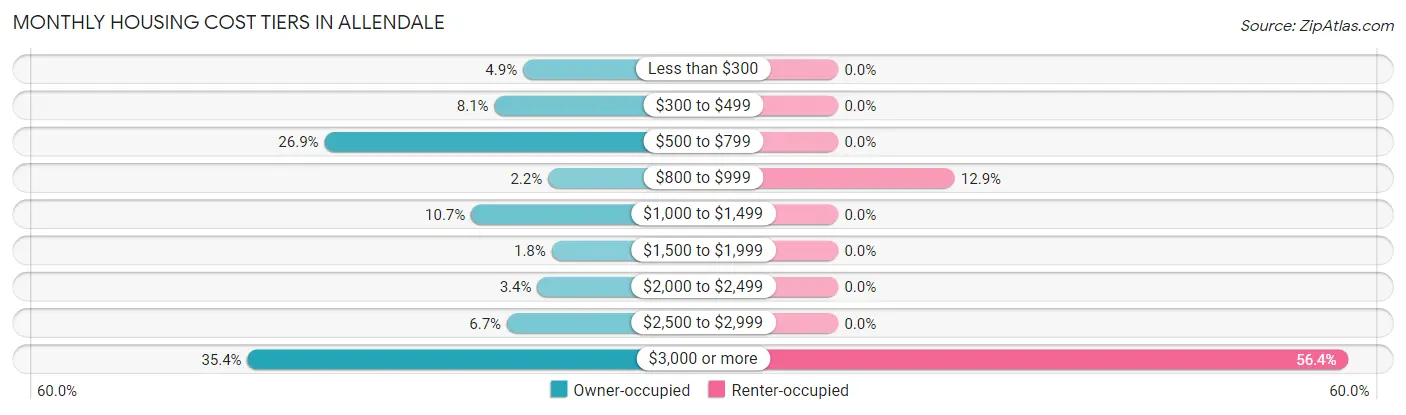
| Monthly Cost | Owner-occupied | Renter-occupied |
| Less than $300 | 25 (4.9%) | 0 (0.0%) |
| $300 to $499 | 41 (8.1%) | 0 (0.0%) |
| $500 to $799 | 136 (26.9%) | 0 (0.0%) |
| $800 to $999 | 11 (2.2%) | 13 (12.9%) |
| $1,000 to $1,499 | 54 (10.7%) | 0 (0.0%) |
| $1,500 to $1,999 | 9 (1.8%) | 0 (0.0%) |
| $2,000 to $2,499 | 17 (3.4%) | 0 (0.0%) |
| $2,500 to $2,999 | 34 (6.7%) | 0 (0.0%) |
| $3,000 or more | 179 (35.4%) | 57 (56.4%) |
| Total | 506 (100.0%) | 101 (100.0%) |
Physical Housing Characteristics in Allendale
Housing Structures in Allendale
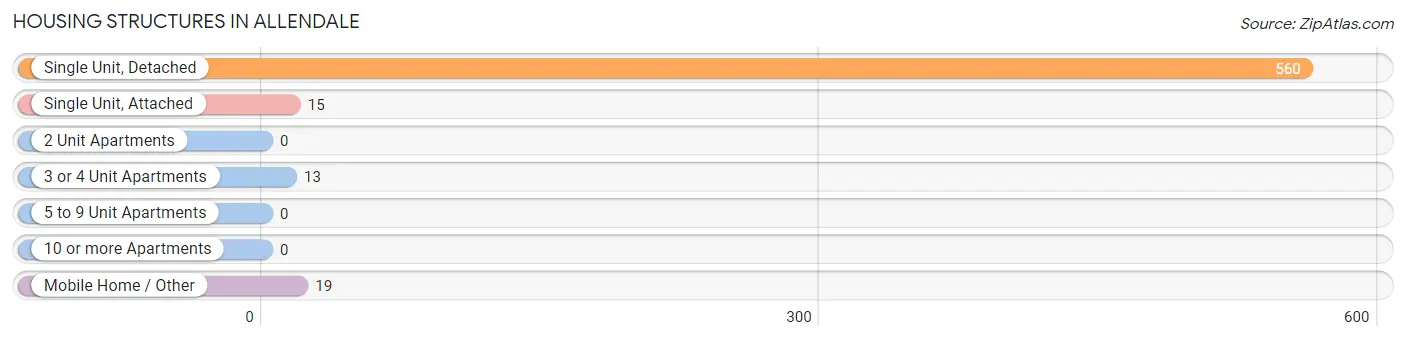
| Structure Type | # Housing Units | % Housing Units |
| Single Unit, Detached | 560 | 92.3% |
| Single Unit, Attached | 15 | 2.5% |
| 2 Unit Apartments | 0 | 0.0% |
| 3 or 4 Unit Apartments | 13 | 2.1% |
| 5 to 9 Unit Apartments | 0 | 0.0% |
| 10 or more Apartments | 0 | 0.0% |
| Mobile Home / Other | 19 | 3.1% |
| Total | 607 | 100.0% |
Housing Structures by Occupancy in Allendale
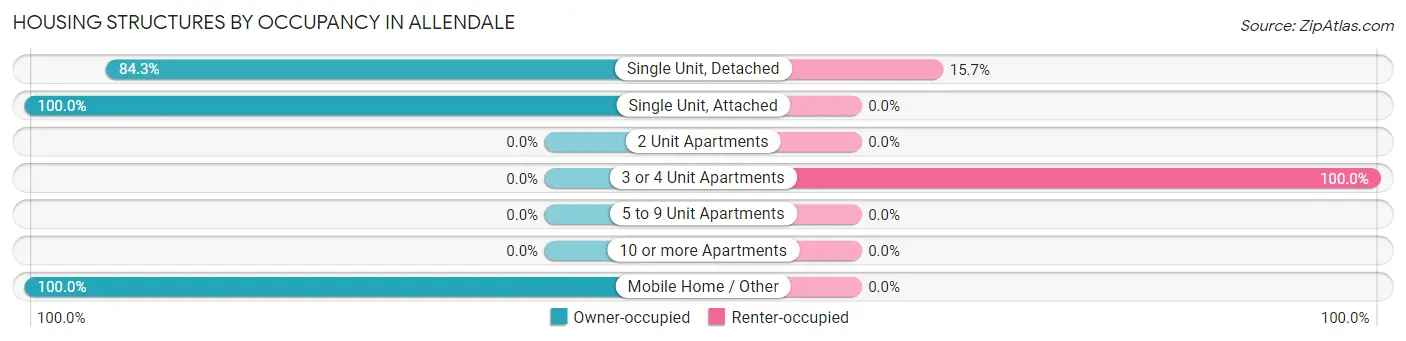
| Structure Type | Owner-occupied | Renter-occupied |
| Single Unit, Detached | 472 (84.3%) | 88 (15.7%) |
| Single Unit, Attached | 15 (100.0%) | 0 (0.0%) |
| 2 Unit Apartments | 0 (0.0%) | 0 (0.0%) |
| 3 or 4 Unit Apartments | 0 (0.0%) | 13 (100.0%) |
| 5 to 9 Unit Apartments | 0 (0.0%) | 0 (0.0%) |
| 10 or more Apartments | 0 (0.0%) | 0 (0.0%) |
| Mobile Home / Other | 19 (100.0%) | 0 (0.0%) |
| Total | 506 (83.4%) | 101 (16.6%) |
Housing Structures by Number of Rooms in Allendale
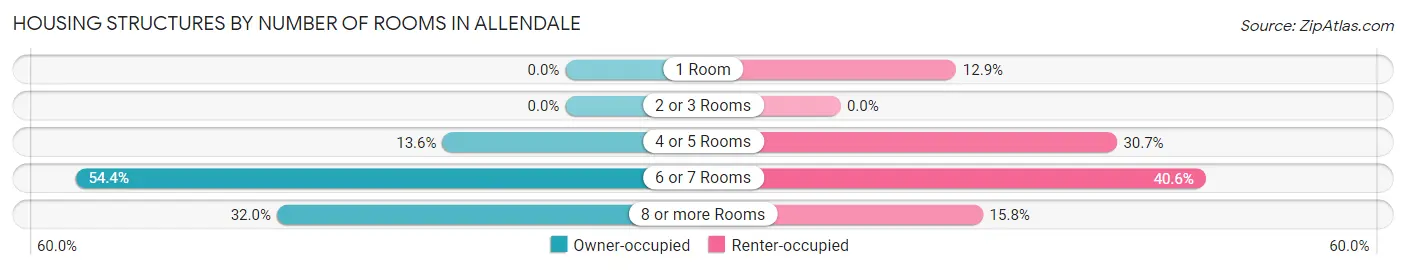
| Number of Rooms | Owner-occupied | Renter-occupied |
| 1 Room | 0 (0.0%) | 13 (12.9%) |
| 2 or 3 Rooms | 0 (0.0%) | 0 (0.0%) |
| 4 or 5 Rooms | 69 (13.6%) | 31 (30.7%) |
| 6 or 7 Rooms | 275 (54.3%) | 41 (40.6%) |
| 8 or more Rooms | 162 (32.0%) | 16 (15.8%) |
| Total | 506 (100.0%) | 101 (100.0%) |
Housing Structure by Heating Type in Allendale
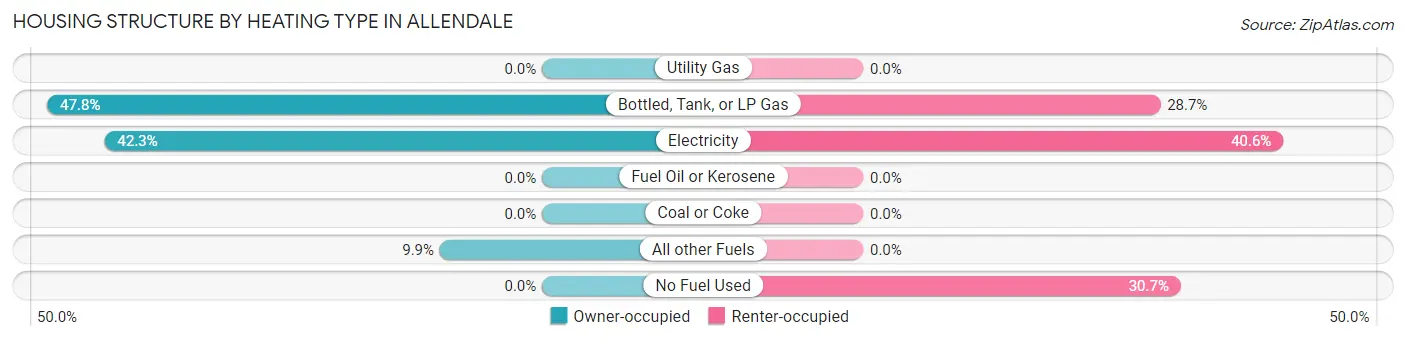
| Heating Type | Owner-occupied | Renter-occupied |
| Utility Gas | 0 (0.0%) | 0 (0.0%) |
| Bottled, Tank, or LP Gas | 242 (47.8%) | 29 (28.7%) |
| Electricity | 214 (42.3%) | 41 (40.6%) |
| Fuel Oil or Kerosene | 0 (0.0%) | 0 (0.0%) |
| Coal or Coke | 0 (0.0%) | 0 (0.0%) |
| All other Fuels | 50 (9.9%) | 0 (0.0%) |
| No Fuel Used | 0 (0.0%) | 31 (30.7%) |
| Total | 506 (100.0%) | 101 (100.0%) |
Household Vehicle Usage in Allendale
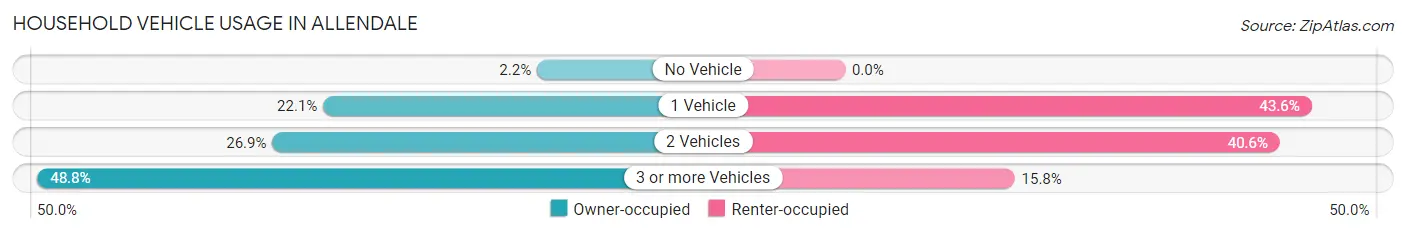
| Vehicles per Household | Owner-occupied | Renter-occupied |
| No Vehicle | 11 (2.2%) | 0 (0.0%) |
| 1 Vehicle | 112 (22.1%) | 44 (43.6%) |
| 2 Vehicles | 136 (26.9%) | 41 (40.6%) |
| 3 or more Vehicles | 247 (48.8%) | 16 (15.8%) |
| Total | 506 (100.0%) | 101 (100.0%) |
Real Estate & Mortgages in Allendale
Real Estate and Mortgage Overview in Allendale
| Characteristic | Without Mortgage | With Mortgage |
| Housing Units | 257 | 249 |
| Median Property Value | $726,100 | $973,000 |
| Median Household Income | $87,350 | $132 |
| Monthly Housing Costs | $712 | $179 |
| Real Estate Taxes | $2,590 | $0 |
Property Value by Mortgage Status in Allendale
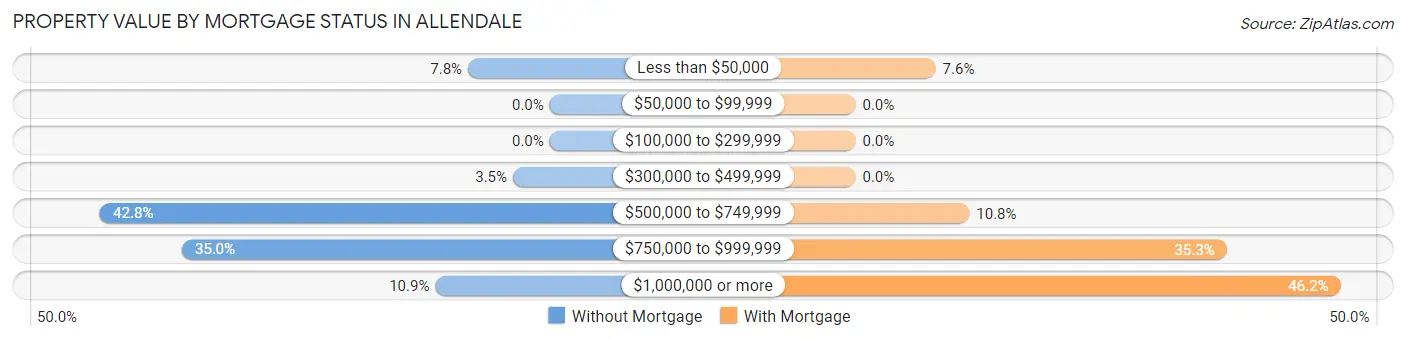
| Property Value | Without Mortgage | With Mortgage |
| Less than $50,000 | 20 (7.8%) | 19 (7.6%) |
| $50,000 to $99,999 | 0 (0.0%) | 0 (0.0%) |
| $100,000 to $299,999 | 0 (0.0%) | 0 (0.0%) |
| $300,000 to $499,999 | 9 (3.5%) | 0 (0.0%) |
| $500,000 to $749,999 | 110 (42.8%) | 27 (10.8%) |
| $750,000 to $999,999 | 90 (35.0%) | 88 (35.3%) |
| $1,000,000 or more | 28 (10.9%) | 115 (46.2%) |
| Total | 257 (100.0%) | 249 (100.0%) |
Household Income by Mortgage Status in Allendale
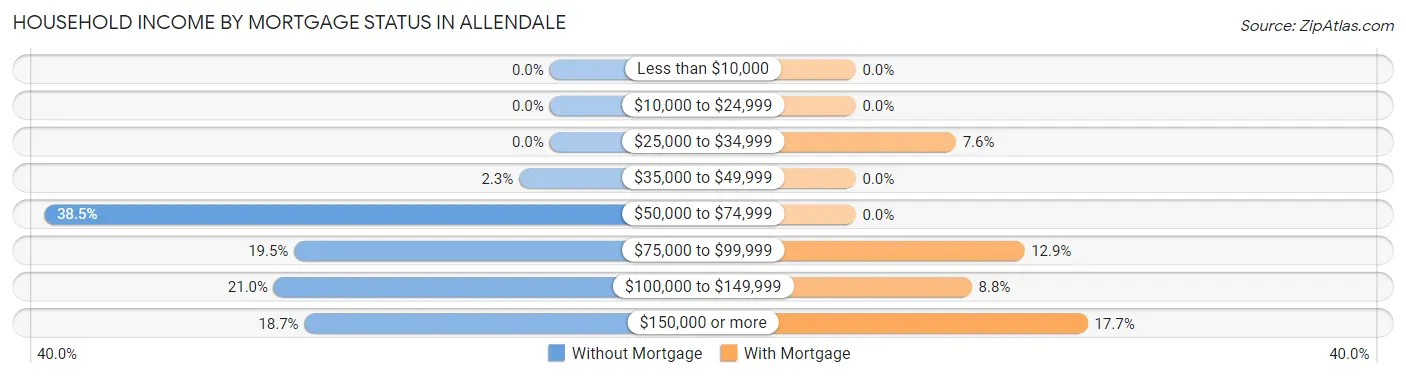
| Household Income | Without Mortgage | With Mortgage |
| Less than $10,000 | 0 (0.0%) | 0 (0.0%) |
| $10,000 to $24,999 | 0 (0.0%) | 0 (0.0%) |
| $25,000 to $34,999 | 0 (0.0%) | 19 (7.6%) |
| $35,000 to $49,999 | 6 (2.3%) | 0 (0.0%) |
| $50,000 to $74,999 | 99 (38.5%) | 0 (0.0%) |
| $75,000 to $99,999 | 50 (19.5%) | 32 (12.9%) |
| $100,000 to $149,999 | 54 (21.0%) | 22 (8.8%) |
| $150,000 or more | 48 (18.7%) | 44 (17.7%) |
| Total | 257 (100.0%) | 249 (100.0%) |
Property Value to Household Income Ratio in Allendale
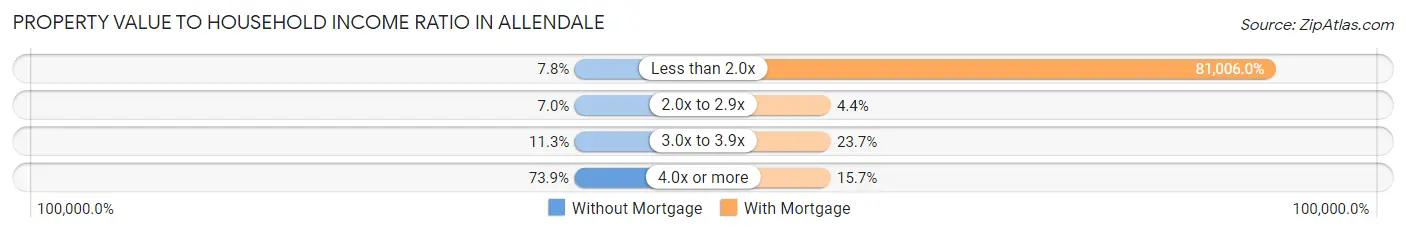
| Value-to-Income Ratio | Without Mortgage | With Mortgage |
| Less than 2.0x | 20 (7.8%) | 201,705 (81,006.0%) |
| 2.0x to 2.9x | 18 (7.0%) | 11 (4.4%) |
| 3.0x to 3.9x | 29 (11.3%) | 59 (23.7%) |
| 4.0x or more | 190 (73.9%) | 39 (15.7%) |
| Total | 257 (100.0%) | 249 (100.0%) |
Real Estate Taxes by Mortgage Status in Allendale
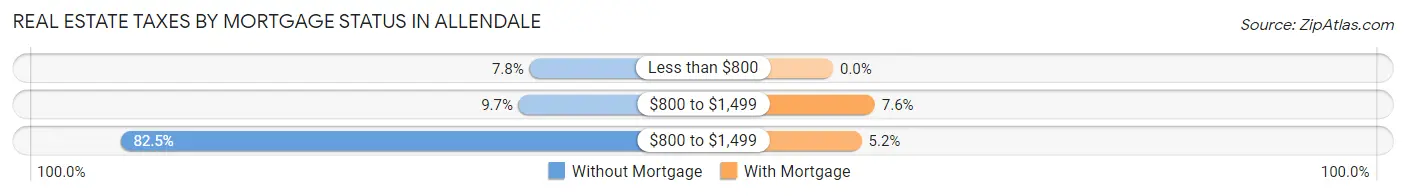
| Property Taxes | Without Mortgage | With Mortgage |
| Less than $800 | 20 (7.8%) | 0 (0.0%) |
| $800 to $1,499 | 25 (9.7%) | 19 (7.6%) |
| $800 to $1,499 | 212 (82.5%) | 13 (5.2%) |
| Total | 257 (100.0%) | 249 (100.0%) |
Health & Disability in Allendale
Health Insurance Coverage by Age in Allendale
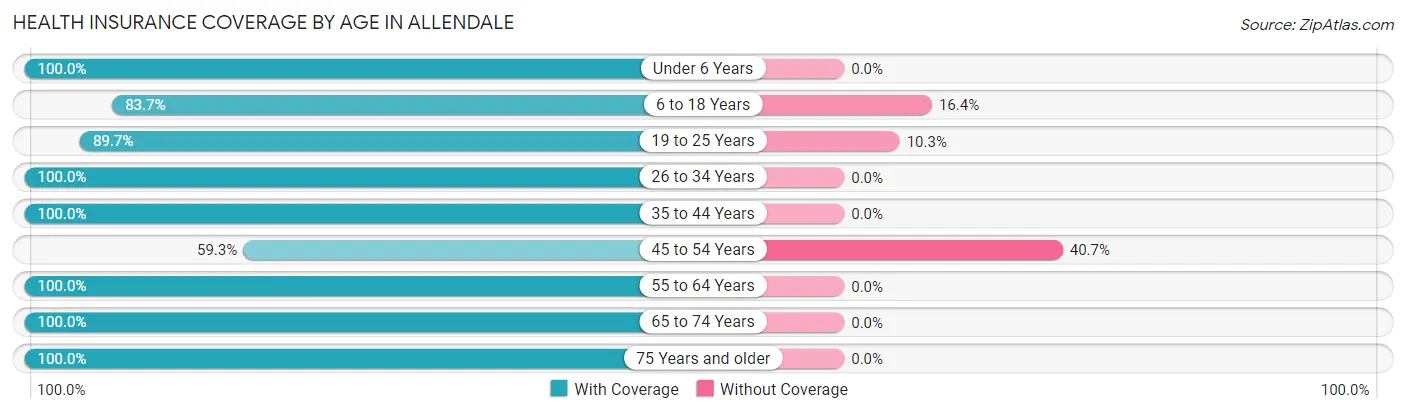
| Age Bracket | With Coverage | Without Coverage |
| Under 6 Years | 98 (100.0%) | 0 (0.0%) |
| 6 to 18 Years | 87 (83.7%) | 17 (16.4%) |
| 19 to 25 Years | 286 (89.7%) | 33 (10.3%) |
| 26 to 34 Years | 131 (100.0%) | 0 (0.0%) |
| 35 to 44 Years | 117 (100.0%) | 0 (0.0%) |
| 45 to 54 Years | 48 (59.3%) | 33 (40.7%) |
| 55 to 64 Years | 387 (100.0%) | 0 (0.0%) |
| 65 to 74 Years | 245 (100.0%) | 0 (0.0%) |
| 75 Years and older | 246 (100.0%) | 0 (0.0%) |
| Total | 1,645 (95.2%) | 83 (4.8%) |
Health Insurance Coverage by Citizenship Status in Allendale
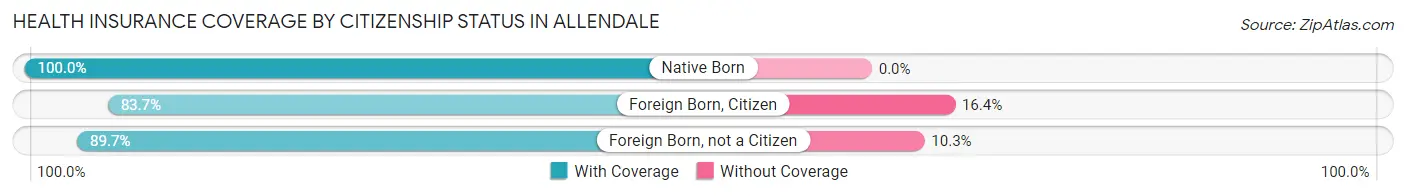
| Citizenship Status | With Coverage | Without Coverage |
| Native Born | 98 (100.0%) | 0 (0.0%) |
| Foreign Born, Citizen | 87 (83.7%) | 17 (16.4%) |
| Foreign Born, not a Citizen | 286 (89.7%) | 33 (10.3%) |
Health Insurance Coverage by Household Income in Allendale
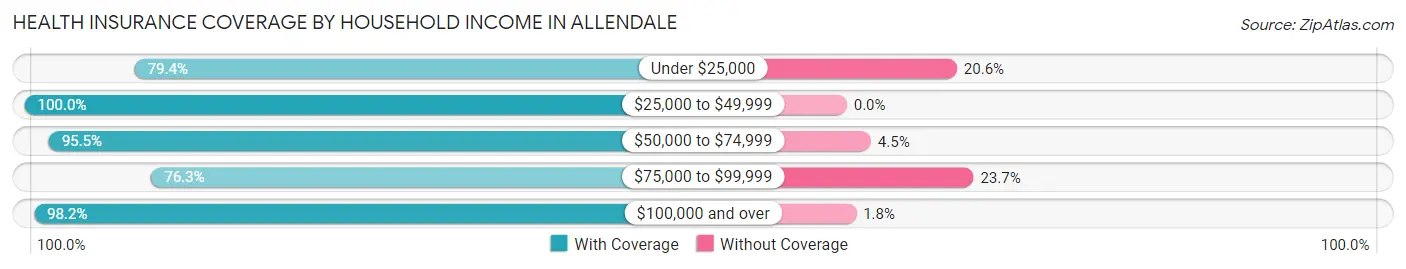
| Household Income | With Coverage | Without Coverage |
| Under $25,000 | 50 (79.4%) | 13 (20.6%) |
| $25,000 to $49,999 | 6 (100.0%) | 0 (0.0%) |
| $50,000 to $74,999 | 359 (95.5%) | 17 (4.5%) |
| $75,000 to $99,999 | 106 (76.3%) | 33 (23.7%) |
| $100,000 and over | 1,109 (98.2%) | 20 (1.8%) |
Public vs Private Health Insurance Coverage by Age in Allendale
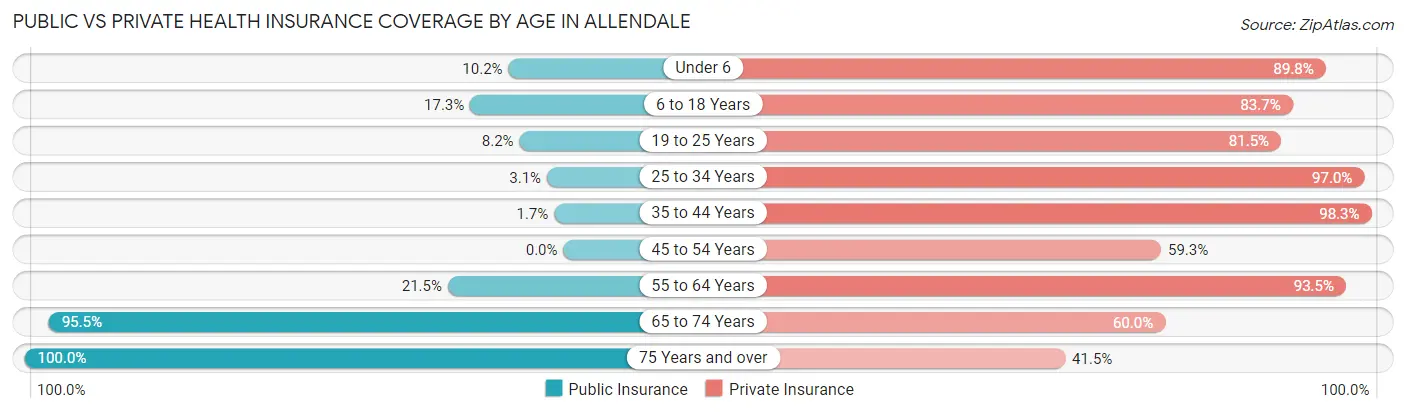
| Age Bracket | Public Insurance | Private Insurance |
| Under 6 | 10 (10.2%) | 88 (89.8%) |
| 6 to 18 Years | 18 (17.3%) | 87 (83.7%) |
| 19 to 25 Years | 26 (8.2%) | 260 (81.5%) |
| 25 to 34 Years | 4 (3.0%) | 127 (97.0%) |
| 35 to 44 Years | 2 (1.7%) | 115 (98.3%) |
| 45 to 54 Years | 0 (0.0%) | 48 (59.3%) |
| 55 to 64 Years | 83 (21.4%) | 362 (93.5%) |
| 65 to 74 Years | 234 (95.5%) | 147 (60.0%) |
| 75 Years and over | 246 (100.0%) | 102 (41.5%) |
| Total | 623 (36.0%) | 1,336 (77.3%) |
Disability Status by Sex by Age in Allendale
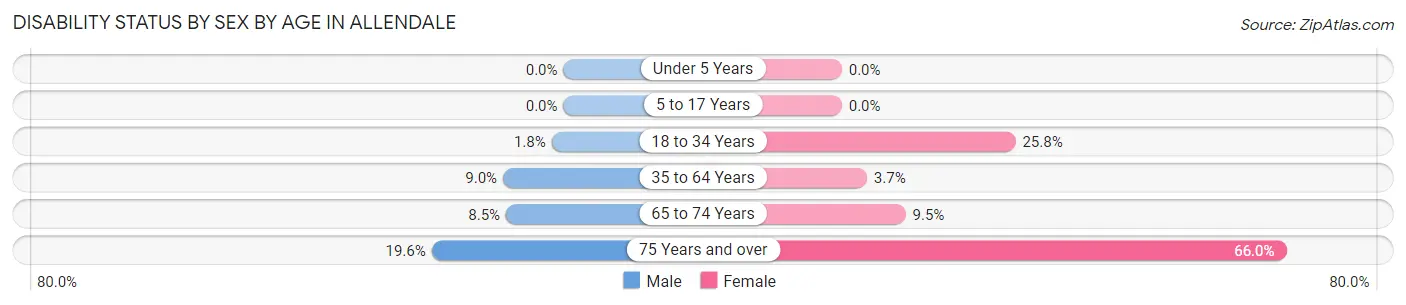
| Age Bracket | Male | Female |
| Under 5 Years | 0 (0.0%) | 0 (0.0%) |
| 5 to 17 Years | 0 (0.0%) | 0 (0.0%) |
| 18 to 34 Years | 4 (1.8%) | 57 (25.8%) |
| 35 to 64 Years | 26 (9.0%) | 11 (3.7%) |
| 65 to 74 Years | 11 (8.5%) | 11 (9.5%) |
| 75 Years and over | 9 (19.6%) | 132 (66.0%) |
Disability Class by Sex by Age in Allendale
Disability Class: Hearing Difficulty
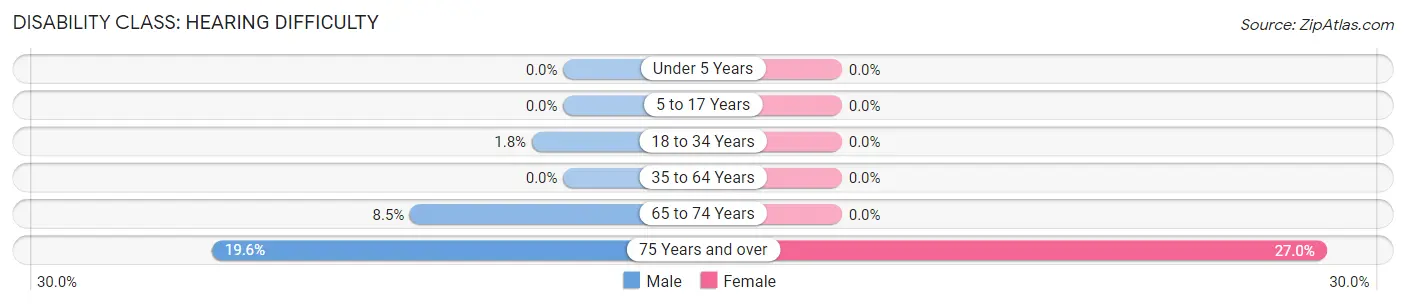
| Age Bracket | Male | Female |
| Under 5 Years | 0 (0.0%) | 0 (0.0%) |
| 5 to 17 Years | 0 (0.0%) | 0 (0.0%) |
| 18 to 34 Years | 4 (1.8%) | 0 (0.0%) |
| 35 to 64 Years | 0 (0.0%) | 0 (0.0%) |
| 65 to 74 Years | 11 (8.5%) | 0 (0.0%) |
| 75 Years and over | 9 (19.6%) | 54 (27.0%) |
Disability Class: Vision Difficulty
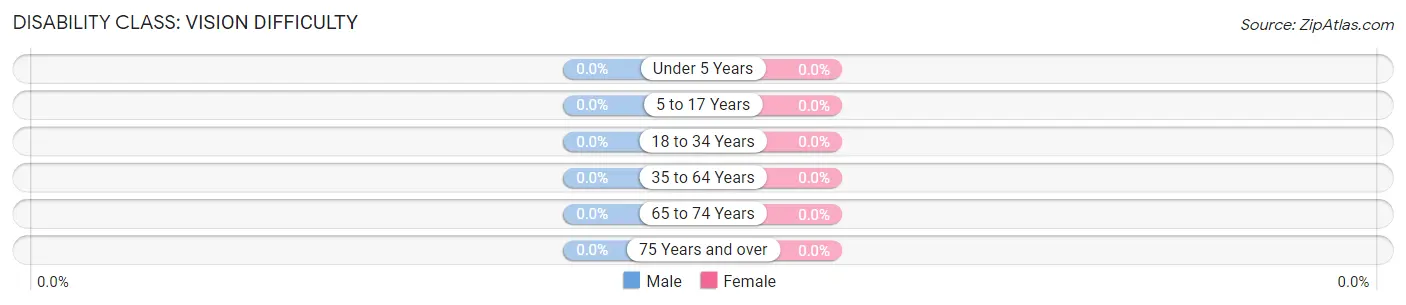
| Age Bracket | Male | Female |
| Under 5 Years | 0 (0.0%) | 0 (0.0%) |
| 5 to 17 Years | 0 (0.0%) | 0 (0.0%) |
| 18 to 34 Years | 0 (0.0%) | 0 (0.0%) |
| 35 to 64 Years | 0 (0.0%) | 0 (0.0%) |
| 65 to 74 Years | 0 (0.0%) | 0 (0.0%) |
| 75 Years and over | 0 (0.0%) | 0 (0.0%) |
Disability Class: Cognitive Difficulty
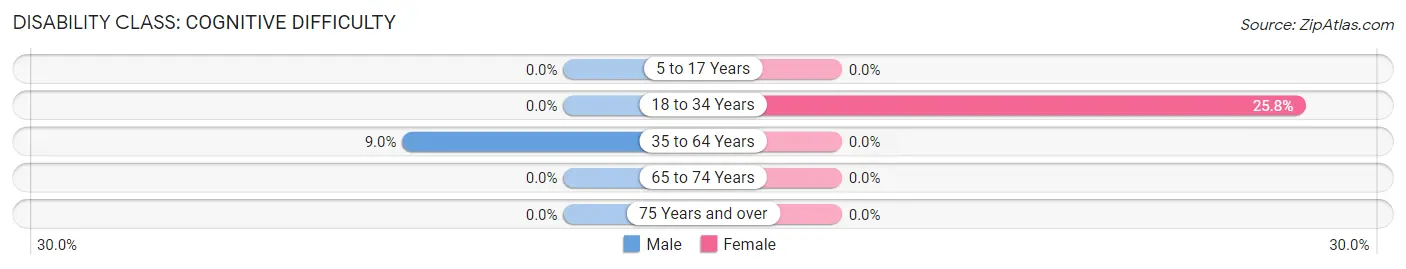
| Age Bracket | Male | Female |
| 5 to 17 Years | 0 (0.0%) | 0 (0.0%) |
| 18 to 34 Years | 0 (0.0%) | 57 (25.8%) |
| 35 to 64 Years | 26 (9.0%) | 0 (0.0%) |
| 65 to 74 Years | 0 (0.0%) | 0 (0.0%) |
| 75 Years and over | 0 (0.0%) | 0 (0.0%) |
Disability Class: Ambulatory Difficulty
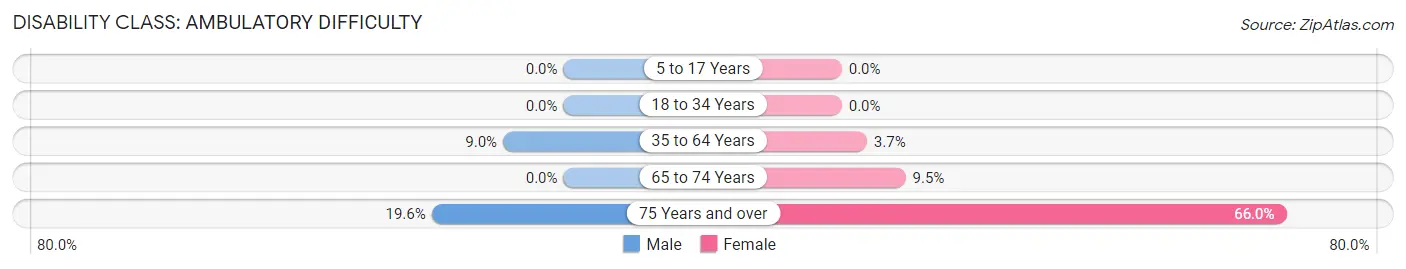
| Age Bracket | Male | Female |
| 5 to 17 Years | 0 (0.0%) | 0 (0.0%) |
| 18 to 34 Years | 0 (0.0%) | 0 (0.0%) |
| 35 to 64 Years | 26 (9.0%) | 11 (3.7%) |
| 65 to 74 Years | 0 (0.0%) | 11 (9.5%) |
| 75 Years and over | 9 (19.6%) | 132 (66.0%) |
Disability Class: Self-Care Difficulty
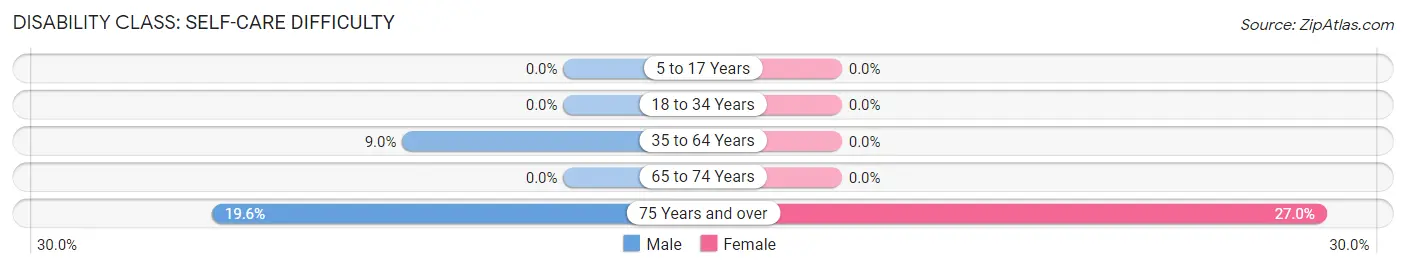
| Age Bracket | Male | Female |
| 5 to 17 Years | 0 (0.0%) | 0 (0.0%) |
| 18 to 34 Years | 0 (0.0%) | 0 (0.0%) |
| 35 to 64 Years | 26 (9.0%) | 0 (0.0%) |
| 65 to 74 Years | 0 (0.0%) | 0 (0.0%) |
| 75 Years and over | 9 (19.6%) | 54 (27.0%) |
Technology Access in Allendale
Computing Device Access in Allendale
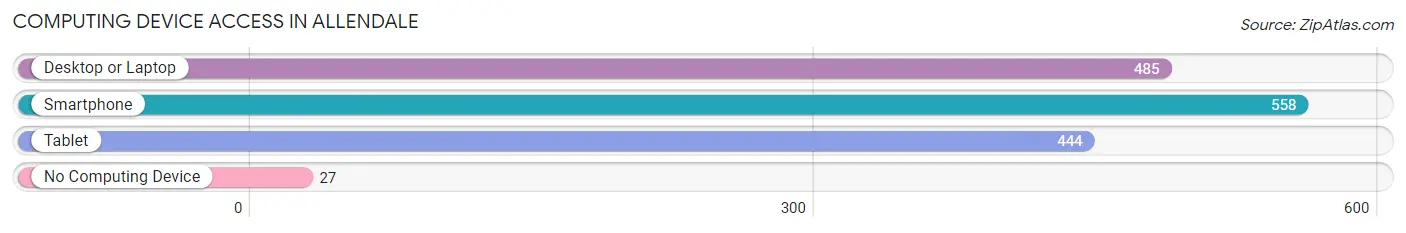
| Device Type | # Households | % Households |
| Desktop or Laptop | 485 | 79.9% |
| Smartphone | 558 | 91.9% |
| Tablet | 444 | 73.2% |
| No Computing Device | 27 | 4.4% |
| Total | 607 | 100.0% |
Internet Access in Allendale
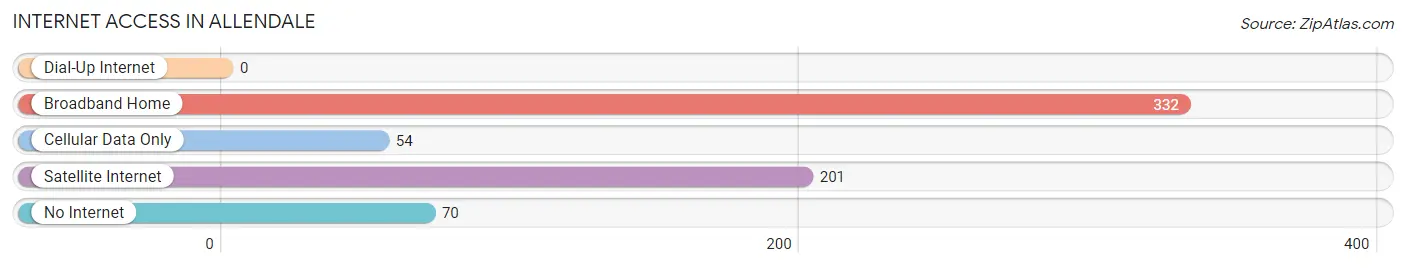
| Internet Type | # Households | % Households |
| Dial-Up Internet | 0 | 0.0% |
| Broadband Home | 332 | 54.7% |
| Cellular Data Only | 54 | 8.9% |
| Satellite Internet | 201 | 33.1% |
| No Internet | 70 | 11.5% |
| Total | 607 | 100.0% |
Allendale Summary
Allendale is a small unincorporated community located in the foothills of the Sierra Nevada Mountains in Placer County, California. It is situated at an elevation of 2,845 feet (867 m) and is located approximately 25 miles (40 km) northeast of Sacramento. The population of Allendale was estimated to be around 1,000 in 2020.
History
Allendale was first settled in the late 1800s by miners and ranchers. The town was named after the Allendale Mining Company, which was established in 1876. The company was responsible for the development of the town, and it was the first to build a store, a hotel, and a post office. The town was also home to a number of saloons, which were popular with the miners and ranchers.
In the early 1900s, the town began to decline as the mining industry in the area declined. However, the town was revitalized in the 1950s when the Allendale Dam was built. The dam provided irrigation for the surrounding area and allowed for the development of a number of agricultural businesses.
Geography
Allendale is located in the foothills of the Sierra Nevada Mountains in Placer County, California. It is situated at an elevation of 2,845 feet (867 m) and is located approximately 25 miles (40 km) northeast of Sacramento. The town is surrounded by rolling hills and is located near the American River.
The climate in Allendale is generally mild, with temperatures ranging from the mid-50s to the mid-80s in the summer months. Winters are cold, with temperatures ranging from the mid-30s to the mid-50s.
Economy
The economy of Allendale is largely based on agriculture. The town is home to a number of farms and ranches, which produce a variety of crops, including apples, pears, peaches, and walnuts. The town is also home to a number of wineries, which produce a variety of wines.
In addition to agriculture, Allendale is home to a number of small businesses, including restaurants, shops, and services. The town is also home to a number of tourist attractions, including the Allendale Dam, which is a popular spot for fishing and boating.
Demographics
The population of Allendale was estimated to be around 1,000 in 2020. The town is predominantly white, with approximately 90% of the population identifying as Caucasian. The remaining 10% of the population is made up of African Americans, Asians, and Hispanics. The median household income in Allendale is $60,000, and the median home value is $400,000.
Common Questions
What is Per Capita Income in Allendale?
Per Capita income in Allendale is $56,892.
What is the Median Family Income in Allendale?
Median Family Income in Allendale is $129,524.
What is the Median Household income in Allendale?
Median Household Income in Allendale is $105,250.
What is Inequality or Gini Index in Allendale?
Inequality or Gini Index in Allendale is 0.45.
What is the Total Population of Allendale?
Total Population of Allendale is 1,752.
What is the Total Male Population of Allendale?
Total Male Population of Allendale is 823.
What is the Total Female Population of Allendale?
Total Female Population of Allendale is 929.
What is the Ratio of Males per 100 Females in Allendale?
There are 88.59 Males per 100 Females in Allendale.
What is the Ratio of Females per 100 Males in Allendale?
There are 112.88 Females per 100 Males in Allendale.
What is the Median Population Age in Allendale?
Median Population Age in Allendale is 55.0 Years.
What is the Average Family Size in Allendale
Average Family Size in Allendale is 3.0 People.
What is the Average Household Size in Allendale
Average Household Size in Allendale is 2.9 People.
How Large is the Labor Force in Allendale?
There are 854 People in the Labor Forcein in Allendale.
What is the Percentage of People in the Labor Force in Allendale?
54.4% of People are in the Labor Force in Allendale.
What is the Unemployment Rate in Allendale?
Unemployment Rate in Allendale is 5.4%.