Discovery Bay, CA Map & Demographics
Discovery Bay Map
Discovery Bay Overview
$62,369
PER CAPITA INCOME
$147,623
AVG FAMILY INCOME
$147,608
AVG HOUSEHOLD INCOME
34.0%
WAGE / INCOME GAP [ % ]
66.0¢/ $1
WAGE / INCOME GAP [ $ ]
0.38
INEQUALITY / GINI INDEX
15,362
TOTAL POPULATION
7,714
MALE POPULATION
7,648
FEMALE POPULATION
100.86
MALES / 100 FEMALES
99.14
FEMALES / 100 MALES
43.9
MEDIAN AGE
3.1
AVG FAMILY SIZE
2.8
AVG HOUSEHOLD SIZE
7,864
LABOR FORCE [ PEOPLE ]
62.5%
PERCENT IN LABOR FORCE
5.4%
UNEMPLOYMENT RATE
Discovery Bay Zip Codes
Discovery Bay Area Codes
Income in Discovery Bay
Income Overview in Discovery Bay
Per Capita Income in Discovery Bay is $62,369, while median incomes of families and households are $147,623 and $147,608 respectively.
| Characteristic | Number | Measure |
| Per Capita Income | 15,362 | $62,369 |
| Median Family Income | 4,368 | $147,623 |
| Mean Family Income | 4,368 | $170,727 |
| Median Household Income | 5,451 | $147,608 |
| Mean Household Income | 5,451 | $172,081 |
| Income Deficit | 4,368 | $0 |
| Wage / Income Gap (%) | 15,362 | 33.97% |
| Wage / Income Gap ($) | 15,362 | 66.03¢ per $1 |
| Gini / Inequality Index | 15,362 | 0.38 |
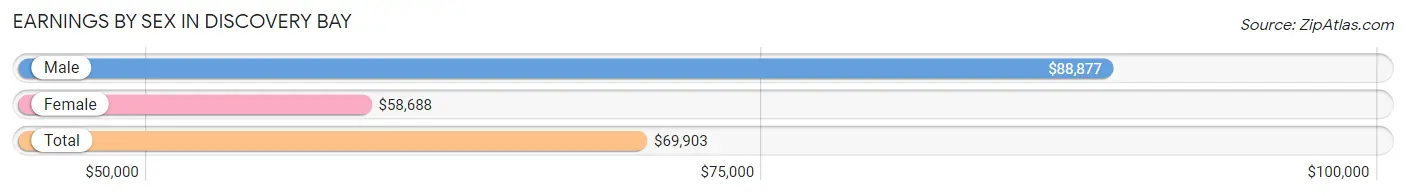
Earnings by Sex in Discovery Bay
Average Earnings in Discovery Bay are $69,903, $88,877 for men and $58,688 for women, a difference of 34.0%.
| Sex | Number | Average Earnings |
| Male | 4,304 (53.4%) | $88,877 |
| Female | 3,753 (46.6%) | $58,688 |
| Total | 8,057 (100.0%) | $69,903 |
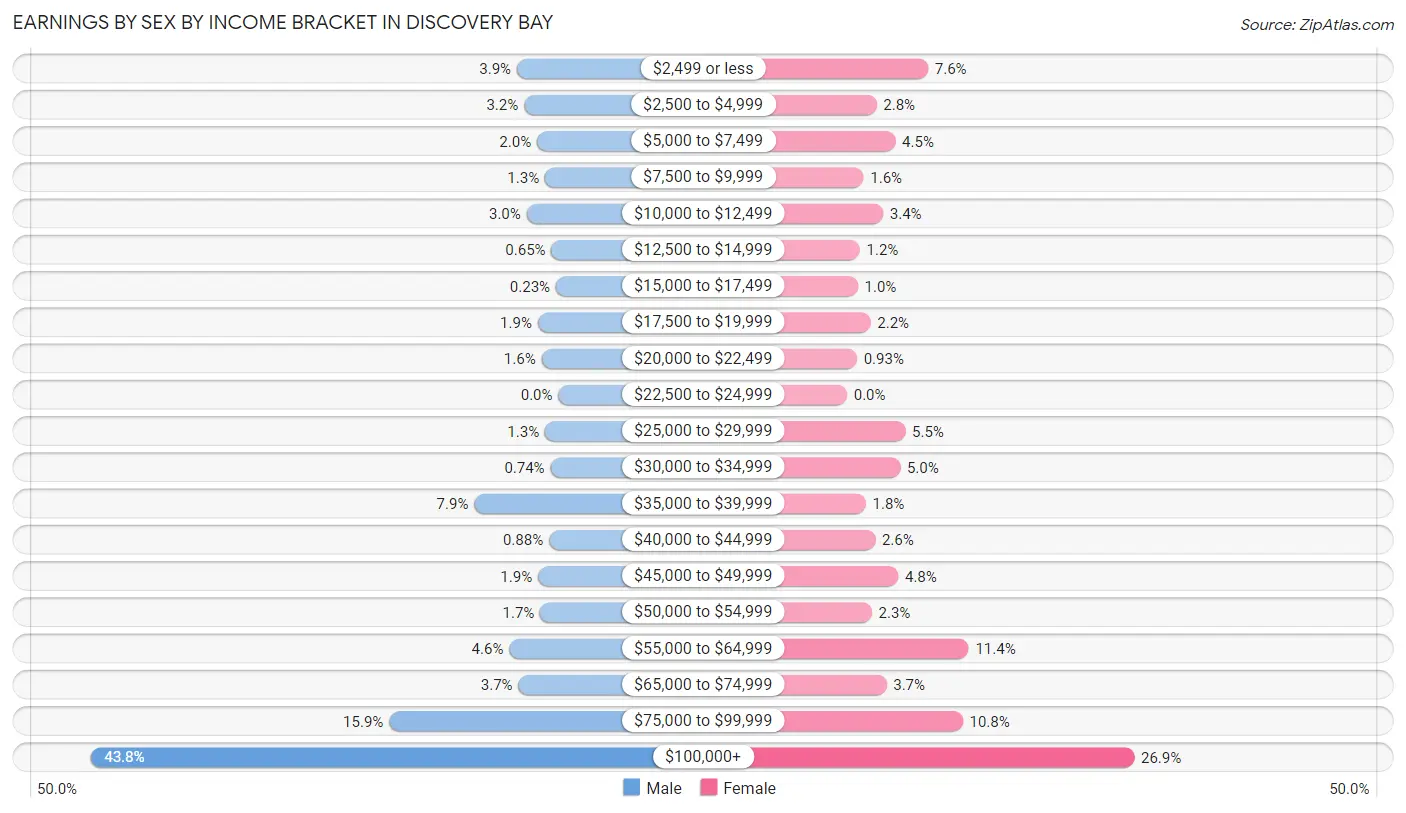
Earnings by Sex by Income Bracket in Discovery Bay
The most common earnings brackets in Discovery Bay are $100,000+ for men (1,883 | 43.8%) and $100,000+ for women (1,010 | 26.9%).
| Income | Male | Female |
| $2,499 or less | 167 (3.9%) | 285 (7.6%) |
| $2,500 to $4,999 | 138 (3.2%) | 104 (2.8%) |
| $5,000 to $7,499 | 86 (2.0%) | 170 (4.5%) |
| $7,500 to $9,999 | 54 (1.3%) | 58 (1.5%) |
| $10,000 to $12,499 | 128 (3.0%) | 127 (3.4%) |
| $12,500 to $14,999 | 28 (0.6%) | 45 (1.2%) |
| $15,000 to $17,499 | 10 (0.2%) | 38 (1.0%) |
| $17,500 to $19,999 | 83 (1.9%) | 83 (2.2%) |
| $20,000 to $22,499 | 68 (1.6%) | 35 (0.9%) |
| $22,500 to $24,999 | 0 (0.0%) | 0 (0.0%) |
| $25,000 to $29,999 | 54 (1.3%) | 205 (5.5%) |
| $30,000 to $34,999 | 32 (0.7%) | 187 (5.0%) |
| $35,000 to $39,999 | 339 (7.9%) | 66 (1.8%) |
| $40,000 to $44,999 | 38 (0.9%) | 99 (2.6%) |
| $45,000 to $49,999 | 82 (1.9%) | 180 (4.8%) |
| $50,000 to $54,999 | 73 (1.7%) | 87 (2.3%) |
| $55,000 to $64,999 | 198 (4.6%) | 428 (11.4%) |
| $65,000 to $74,999 | 161 (3.7%) | 139 (3.7%) |
| $75,000 to $99,999 | 682 (15.9%) | 407 (10.8%) |
| $100,000+ | 1,883 (43.8%) | 1,010 (26.9%) |
| Total | 4,304 (100.0%) | 3,753 (100.0%) |
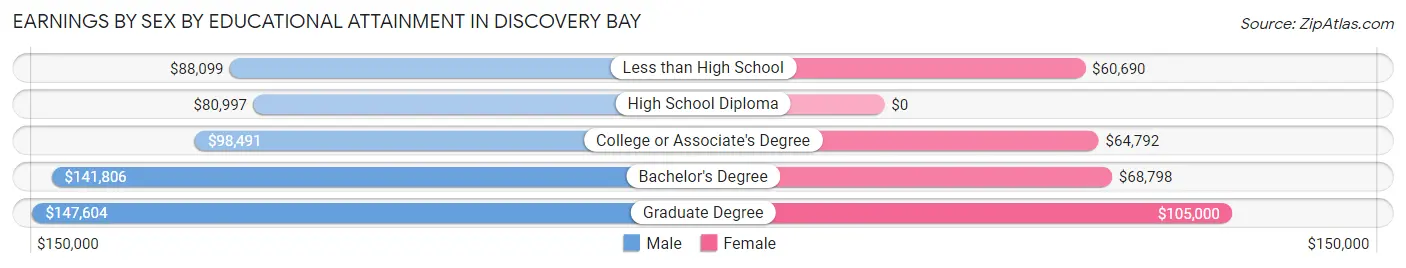
Earnings by Sex by Educational Attainment in Discovery Bay
Average earnings in Discovery Bay are $101,115 for men and $62,413 for women, a difference of 38.3%. Men with an educational attainment of graduate degree enjoy the highest average annual earnings of $147,604, while those with high school diploma education earn the least with $80,997. Women with an educational attainment of graduate degree earn the most with the average annual earnings of $105,000, while those with less than high school education have the smallest earnings of $60,690.
| Educational Attainment | Male Income | Female Income |
| Less than High School | $88,099 | $60,690 |
| High School Diploma | $80,997 | $0 |
| College or Associate's Degree | $98,491 | $64,792 |
| Bachelor's Degree | $141,806 | $68,798 |
| Graduate Degree | $147,604 | $105,000 |
| Total | $101,115 | $62,413 |
Family Income in Discovery Bay
Family Income Brackets in Discovery Bay
According to the Discovery Bay family income data, there are 1,494 families falling into the $200,000+ income range, which is the most common income bracket and makes up 34.2% of all families.
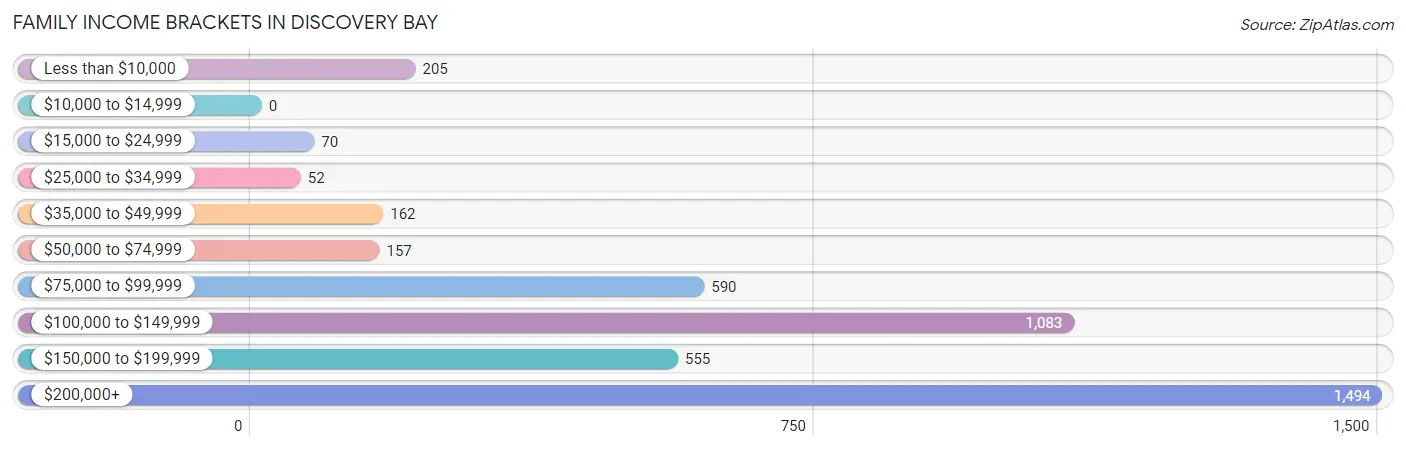
| Income Bracket | # Families | % Families |
| Less than $10,000 | 205 | 4.7% |
| $10,000 to $14,999 | 0 | 0.0% |
| $15,000 to $24,999 | 70 | 1.6% |
| $25,000 to $34,999 | 52 | 1.2% |
| $35,000 to $49,999 | 162 | 3.7% |
| $50,000 to $74,999 | 157 | 3.6% |
| $75,000 to $99,999 | 590 | 13.5% |
| $100,000 to $149,999 | 1,083 | 24.8% |
| $150,000 to $199,999 | 555 | 12.7% |
| $200,000+ | 1,494 | 34.2% |
Family Income by Famaliy Size in Discovery Bay
5-person families (301 | 6.9%) account for the highest median family income in Discovery Bay with $198,482 per family, while 2-person families (2,158 | 49.4%) have the highest median income of $62,400 per family member.
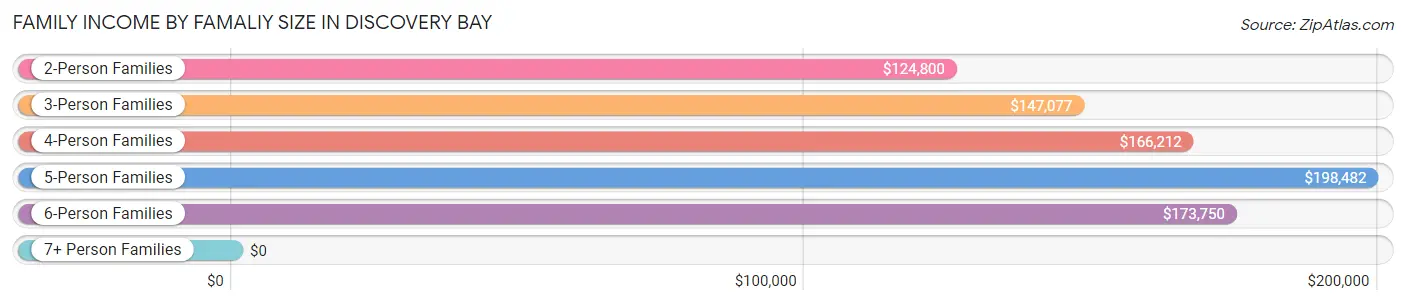
| Income Bracket | # Families | Median Income |
| 2-Person Families | 2,158 (49.4%) | $124,800 |
| 3-Person Families | 929 (21.3%) | $147,077 |
| 4-Person Families | 852 (19.5%) | $166,212 |
| 5-Person Families | 301 (6.9%) | $198,482 |
| 6-Person Families | 40 (0.9%) | $173,750 |
| 7+ Person Families | 88 (2.0%) | $0 |
| Total | 4,368 (100.0%) | $147,623 |
Family Income by Number of Earners in Discovery Bay
The median family income in Discovery Bay is $147,623, with families comprising 3+ earners (483) having the highest median family income of $235,609, while families with no earners (715) have the lowest median family income of $74,432, accounting for 11.1% and 16.4% of families, respectively.
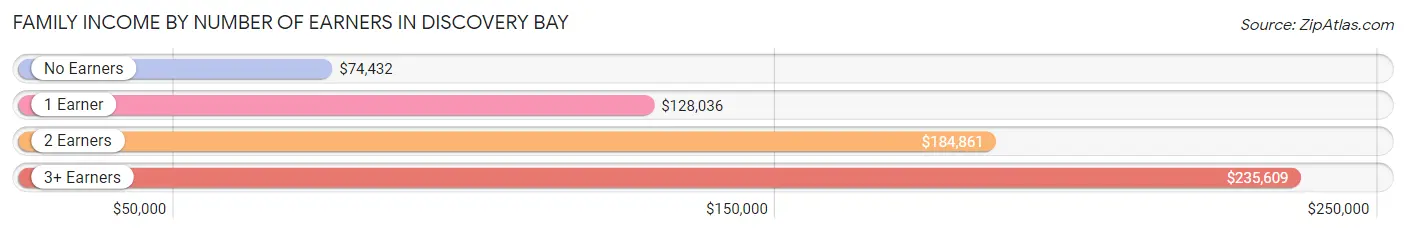
| Number of Earners | # Families | Median Income |
| No Earners | 715 (16.4%) | $74,432 |
| 1 Earner | 1,519 (34.8%) | $128,036 |
| 2 Earners | 1,651 (37.8%) | $184,861 |
| 3+ Earners | 483 (11.1%) | $235,609 |
| Total | 4,368 (100.0%) | $147,623 |
Household Income in Discovery Bay
Household Income Brackets in Discovery Bay
With 1,853 households falling in the category, the $200,000+ income range is the most frequent in Discovery Bay, accounting for 34.0% of all households. In contrast, only 16 households (0.3%) fall into the $10,000 to $14,999 income bracket, making it the least populous group.
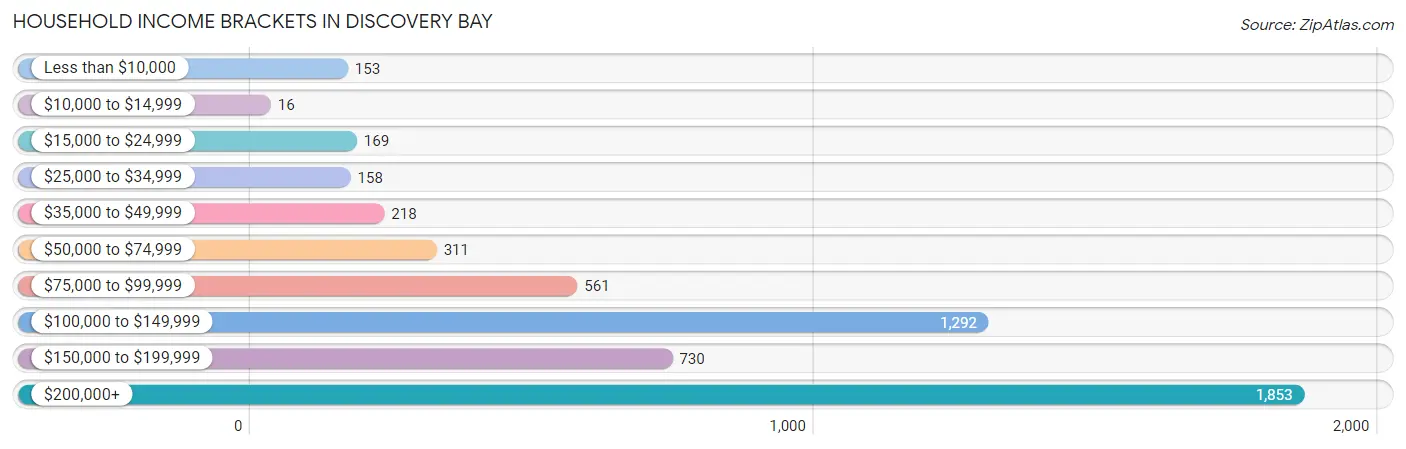
| Income Bracket | # Households | % Households |
| Less than $10,000 | 153 | 2.8% |
| $10,000 to $14,999 | 16 | 0.3% |
| $15,000 to $24,999 | 169 | 3.1% |
| $25,000 to $34,999 | 158 | 2.9% |
| $35,000 to $49,999 | 218 | 4.0% |
| $50,000 to $74,999 | 311 | 5.7% |
| $75,000 to $99,999 | 561 | 10.3% |
| $100,000 to $149,999 | 1,292 | 23.7% |
| $150,000 to $199,999 | 730 | 13.4% |
| $200,000+ | 1,853 | 34.0% |
Household Income by Householder Age in Discovery Bay
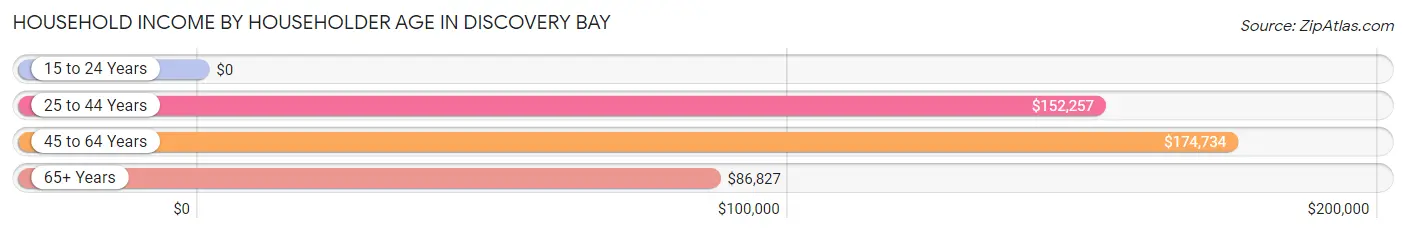
The median household income in Discovery Bay is $147,608, with the highest median household income of $174,734 found in the 45 to 64 years age bracket for the primary householder. A total of 2,423 households (44.5%) fall into this category. Meanwhile, the 15 to 24 years age bracket for the primary householder has the lowest median household income of $0, with 38 households (0.7%) in this group.
| Income Bracket | # Households | Median Income |
| 15 to 24 Years | 38 (0.7%) | $0 |
| 25 to 44 Years | 1,455 (26.7%) | $152,257 |
| 45 to 64 Years | 2,423 (44.5%) | $174,734 |
| 65+ Years | 1,535 (28.2%) | $86,827 |
| Total | 5,451 (100.0%) | $147,608 |
Poverty in Discovery Bay
Income Below Poverty by Sex and Age in Discovery Bay
With 5.8% poverty level for males and 6.5% for females among the residents of Discovery Bay, 12 to 14 year old males and 16 and 17 year old females are the most vulnerable to poverty, with 99 males (23.4%) and 114 females (37.9%) in their respective age groups living below the poverty level.
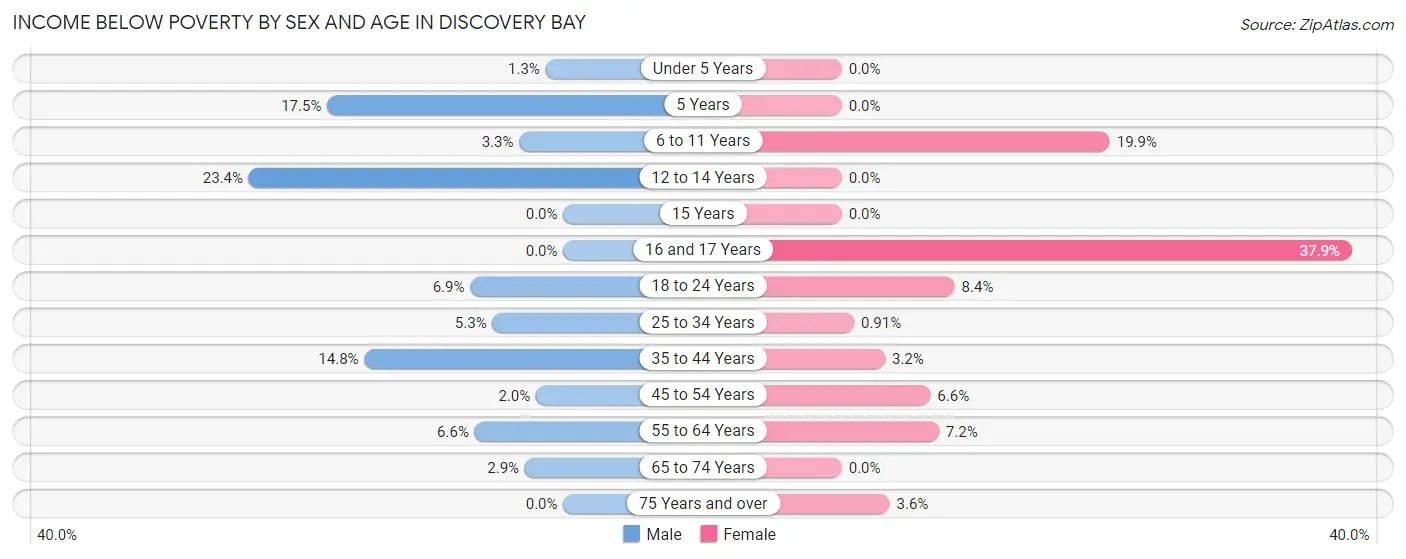
| Age Bracket | Male | Female |
| Under 5 Years | 9 (1.3%) | 0 (0.0%) |
| 5 Years | 17 (17.5%) | 0 (0.0%) |
| 6 to 11 Years | 10 (3.3%) | 115 (19.9%) |
| 12 to 14 Years | 99 (23.4%) | 0 (0.0%) |
| 15 Years | 0 (0.0%) | 0 (0.0%) |
| 16 and 17 Years | 0 (0.0%) | 114 (37.9%) |
| 18 to 24 Years | 47 (6.9%) | 48 (8.4%) |
| 25 to 34 Years | 39 (5.3%) | 9 (0.9%) |
| 35 to 44 Years | 109 (14.8%) | 26 (3.2%) |
| 45 to 54 Years | 28 (2.0%) | 75 (6.6%) |
| 55 to 64 Years | 64 (6.6%) | 89 (7.2%) |
| 65 to 74 Years | 20 (2.9%) | 0 (0.0%) |
| 75 Years and over | 0 (0.0%) | 21 (3.5%) |
| Total | 442 (5.8%) | 497 (6.5%) |
Income Above Poverty by Sex and Age in Discovery Bay
According to the poverty statistics in Discovery Bay, males aged 15 years and females aged under 5 years are the age groups that are most secure financially, with 100.0% of males and 100.0% of females in these age groups living above the poverty line.
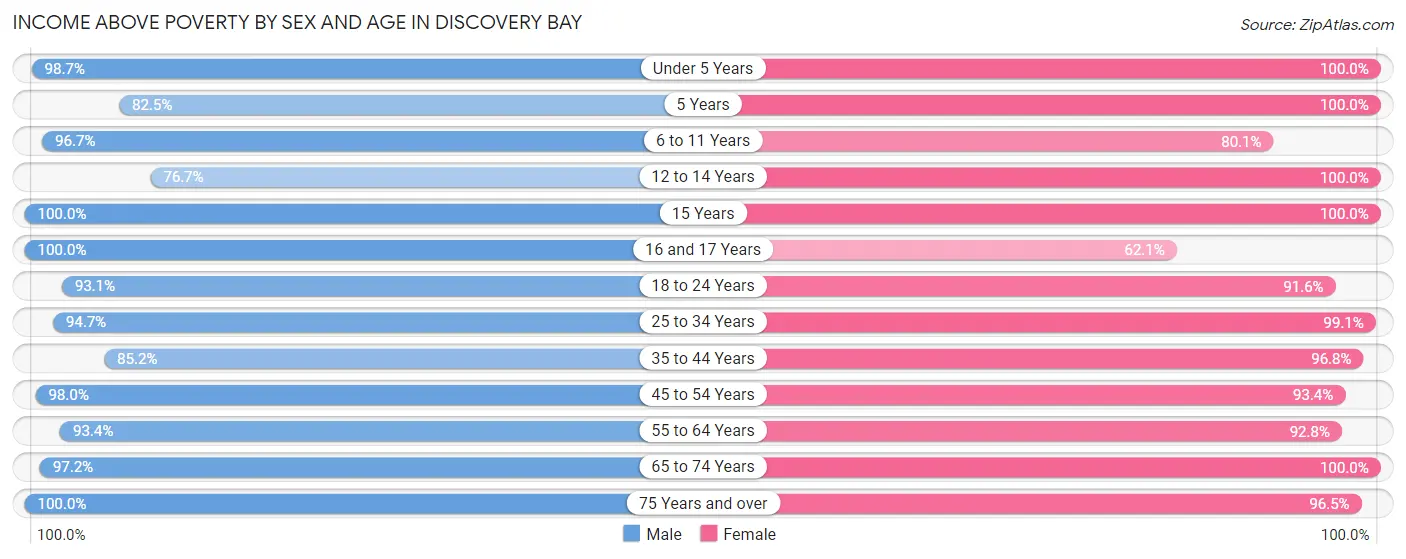
| Age Bracket | Male | Female |
| Under 5 Years | 676 (98.7%) | 249 (100.0%) |
| 5 Years | 80 (82.5%) | 53 (100.0%) |
| 6 to 11 Years | 296 (96.7%) | 463 (80.1%) |
| 12 to 14 Years | 325 (76.6%) | 274 (100.0%) |
| 15 Years | 33 (100.0%) | 54 (100.0%) |
| 16 and 17 Years | 314 (100.0%) | 187 (62.1%) |
| 18 to 24 Years | 633 (93.1%) | 525 (91.6%) |
| 25 to 34 Years | 702 (94.7%) | 985 (99.1%) |
| 35 to 44 Years | 629 (85.2%) | 783 (96.8%) |
| 45 to 54 Years | 1,349 (98.0%) | 1,065 (93.4%) |
| 55 to 64 Years | 909 (93.4%) | 1,146 (92.8%) |
| 65 to 74 Years | 682 (97.2%) | 797 (100.0%) |
| 75 Years and over | 617 (100.0%) | 570 (96.5%) |
| Total | 7,245 (94.3%) | 7,151 (93.5%) |
Income Below Poverty Among Married-Couple Families in Discovery Bay
The poverty statistics for married-couple families in Discovery Bay show that 2.2% or 77 of the total 3,536 families live below the poverty line. Families with 3 or 4 children have the highest poverty rate of 5.8%, comprising of 11 families. On the other hand, families with 1 or 2 children have the lowest poverty rate of 1.3%, which includes 16 families.
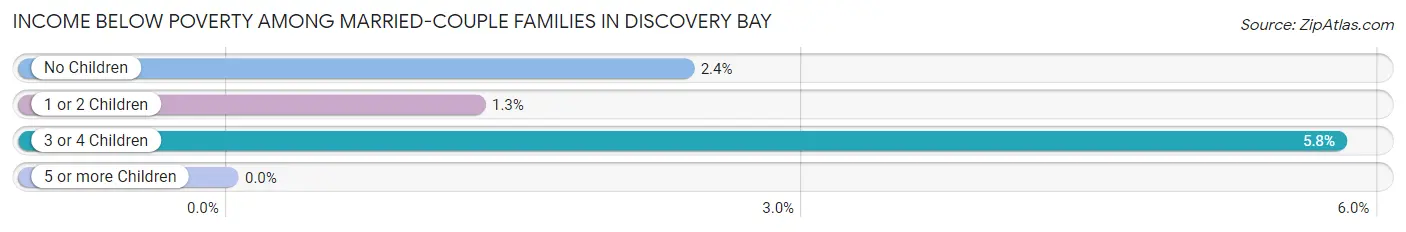
| Children | Above Poverty | Below Poverty |
| No Children | 2,051 (97.6%) | 50 (2.4%) |
| 1 or 2 Children | 1,229 (98.7%) | 16 (1.3%) |
| 3 or 4 Children | 179 (94.2%) | 11 (5.8%) |
| 5 or more Children | 0 (0.0%) | 0 (0.0%) |
| Total | 3,459 (97.8%) | 77 (2.2%) |
Income Below Poverty Among Single-Parent Households in Discovery Bay
According to the poverty data in Discovery Bay, 26.4% or 88 single-father households and 14.6% or 73 single-mother households are living below the poverty line. Among single-father households, those with 1 or 2 children have the highest poverty rate, with 88 households (48.9%) experiencing poverty. Likewise, among single-mother households, those with 1 or 2 children have the highest poverty rate, with 63 households (33.2%) falling below the poverty line.
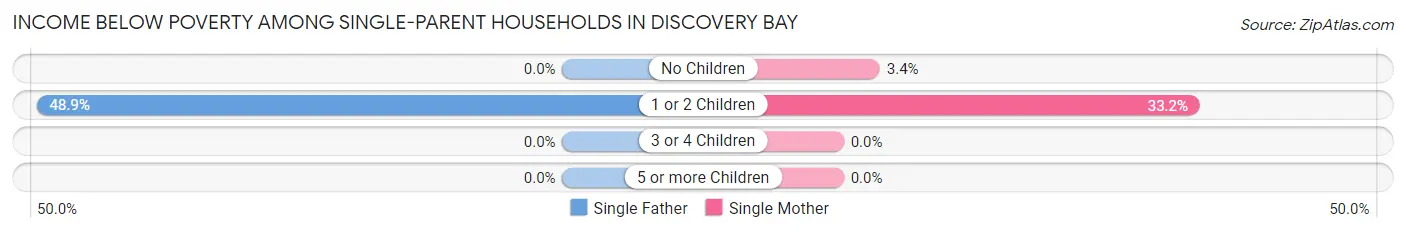
| Children | Single Father | Single Mother |
| No Children | 0 (0.0%) | 10 (3.4%) |
| 1 or 2 Children | 88 (48.9%) | 63 (33.2%) |
| 3 or 4 Children | 0 (0.0%) | 0 (0.0%) |
| 5 or more Children | 0 (0.0%) | 0 (0.0%) |
| Total | 88 (26.4%) | 73 (14.6%) |
Income Below Poverty Among Married-Couple vs Single-Parent Households in Discovery Bay
The poverty data for Discovery Bay shows that 77 of the married-couple family households (2.2%) and 161 of the single-parent households (19.4%) are living below the poverty level. Within the married-couple family households, those with 3 or 4 children have the highest poverty rate, with 11 households (5.8%) falling below the poverty line. Among the single-parent households, those with 1 or 2 children have the highest poverty rate, with 151 household (40.8%) living below poverty.
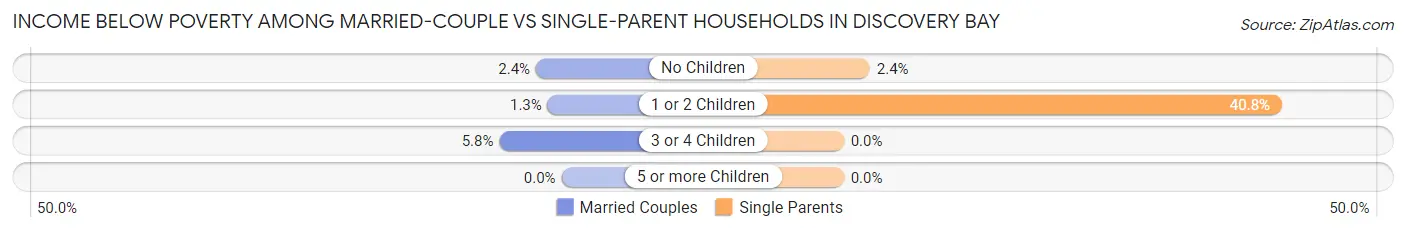
| Children | Married-Couple Families | Single-Parent Households |
| No Children | 50 (2.4%) | 10 (2.4%) |
| 1 or 2 Children | 16 (1.3%) | 151 (40.8%) |
| 3 or 4 Children | 11 (5.8%) | 0 (0.0%) |
| 5 or more Children | 0 (0.0%) | 0 (0.0%) |
| Total | 77 (2.2%) | 161 (19.4%) |
Race in Discovery Bay
The most populous races in Discovery Bay are White / Caucasian (10,941 | 71.2%), Hispanic or Latino (3,057 | 19.9%), and Two or more Races (1,593 | 10.4%).
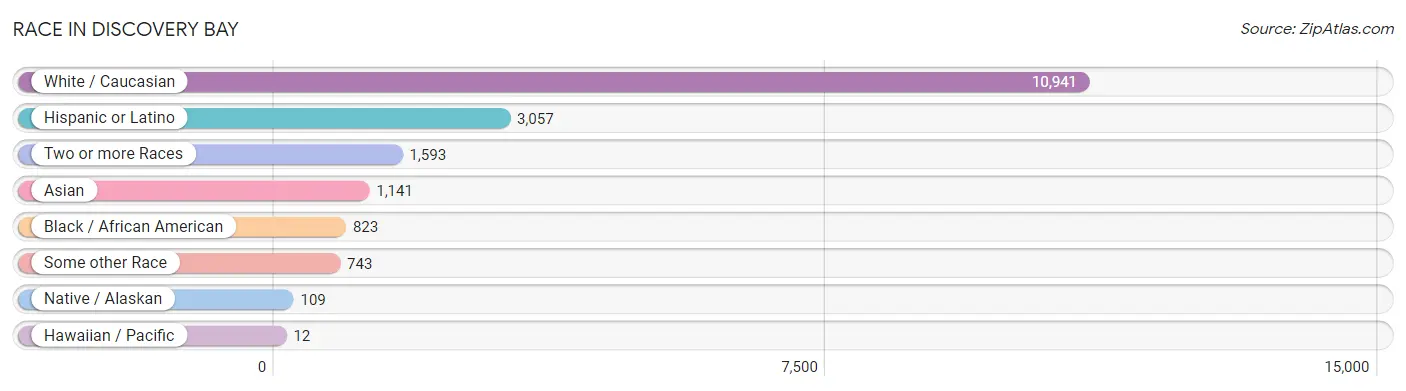
| Race | # Population | % Population |
| Asian | 1,141 | 7.4% |
| Black / African American | 823 | 5.4% |
| Hawaiian / Pacific | 12 | 0.1% |
| Hispanic or Latino | 3,057 | 19.9% |
| Native / Alaskan | 109 | 0.7% |
| White / Caucasian | 10,941 | 71.2% |
| Two or more Races | 1,593 | 10.4% |
| Some other Race | 743 | 4.8% |
| Total | 15,362 | 100.0% |
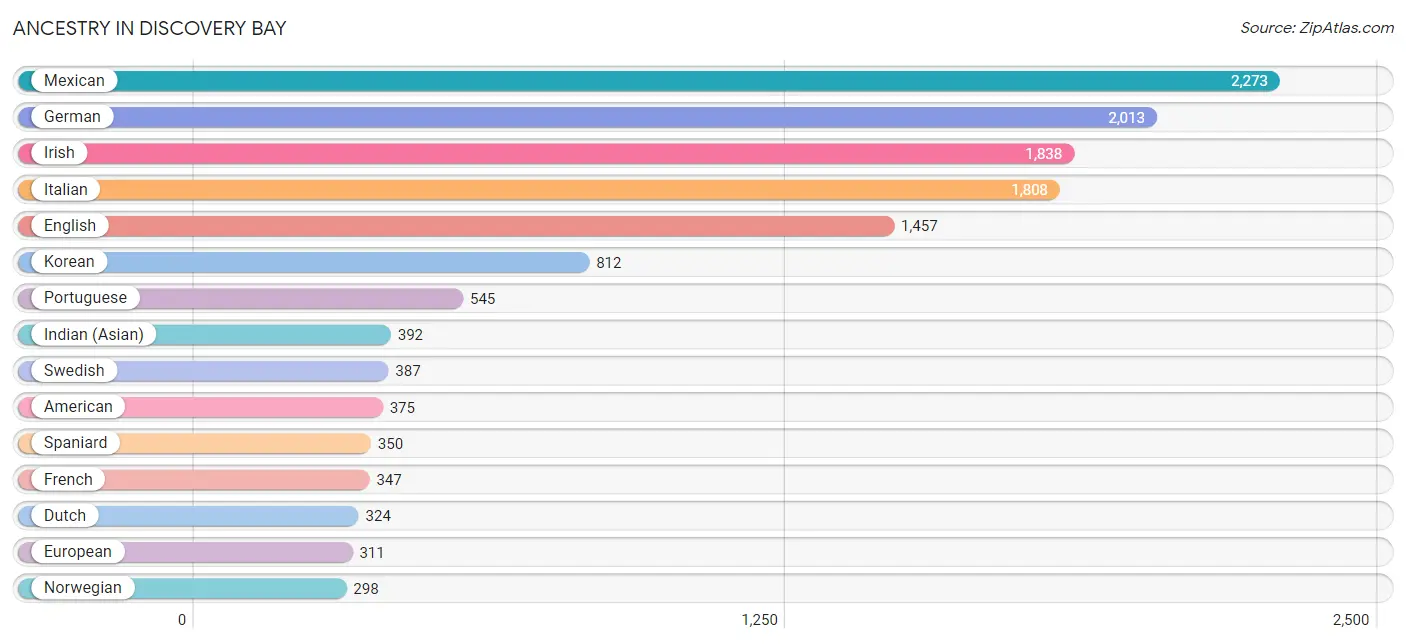
Ancestry in Discovery Bay
The most populous ancestries reported in Discovery Bay are Mexican (2,273 | 14.8%), German (2,013 | 13.1%), Irish (1,838 | 12.0%), Italian (1,808 | 11.8%), and English (1,457 | 9.5%), together accounting for 61.1% of all Discovery Bay residents.
| Ancestry | # Population | % Population |
| African | 48 | 0.3% |
| American | 375 | 2.4% |
| Arab | 130 | 0.9% |
| Armenian | 74 | 0.5% |
| Austrian | 24 | 0.2% |
| Belgian | 90 | 0.6% |
| Belizean | 10 | 0.1% |
| Bhutanese | 139 | 0.9% |
| Blackfeet | 16 | 0.1% |
| British | 63 | 0.4% |
| Burmese | 95 | 0.6% |
| Canadian | 13 | 0.1% |
| Celtic | 10 | 0.1% |
| Central American | 154 | 1.0% |
| Central American Indian | 30 | 0.2% |
| Cherokee | 12 | 0.1% |
| Chilean | 18 | 0.1% |
| Costa Rican | 87 | 0.6% |
| Cree | 6 | 0.0% |
| Croatian | 9 | 0.1% |
| Cypriot | 14 | 0.1% |
| Danish | 36 | 0.2% |
| Dutch | 324 | 2.1% |
| Dutch West Indian | 25 | 0.2% |
| Eastern European | 16 | 0.1% |
| English | 1,457 | 9.5% |
| European | 311 | 2.0% |
| Finnish | 9 | 0.1% |
| French | 347 | 2.3% |
| French Canadian | 27 | 0.2% |
| German | 2,013 | 13.1% |
| Greek | 79 | 0.5% |
| Guatemalan | 10 | 0.1% |
| Indian (Asian) | 392 | 2.5% |
| Iranian | 25 | 0.2% |
| Irish | 1,838 | 12.0% |
| Italian | 1,808 | 11.8% |
| Korean | 812 | 5.3% |
| Lebanese | 12 | 0.1% |
| Lithuanian | 8 | 0.1% |
| Maltese | 9 | 0.1% |
| Mexican | 2,273 | 14.8% |
| Mexican American Indian | 52 | 0.3% |
| Native Hawaiian | 33 | 0.2% |
| Nicaraguan | 15 | 0.1% |
| Northern European | 9 | 0.1% |
| Norwegian | 298 | 1.9% |
| Pakistani | 7 | 0.1% |
| Panamanian | 9 | 0.1% |
| Polish | 232 | 1.5% |
| Portuguese | 545 | 3.5% |
| Puerto Rican | 133 | 0.9% |
| Russian | 75 | 0.5% |
| Salvadoran | 33 | 0.2% |
| Samoan | 108 | 0.7% |
| Scandinavian | 59 | 0.4% |
| Scotch-Irish | 112 | 0.7% |
| Scottish | 287 | 1.9% |
| Slavic | 20 | 0.1% |
| Slovak | 18 | 0.1% |
| South African | 10 | 0.1% |
| South American | 18 | 0.1% |
| Spaniard | 350 | 2.3% |
| Spanish | 113 | 0.7% |
| Sri Lankan | 81 | 0.5% |
| Subsaharan African | 58 | 0.4% |
| Swedish | 387 | 2.5% |
| Swiss | 98 | 0.6% |
| Thai | 72 | 0.5% |
| Ukrainian | 36 | 0.2% |
| Welsh | 85 | 0.5% | View All 71 Rows |
Immigrants in Discovery Bay
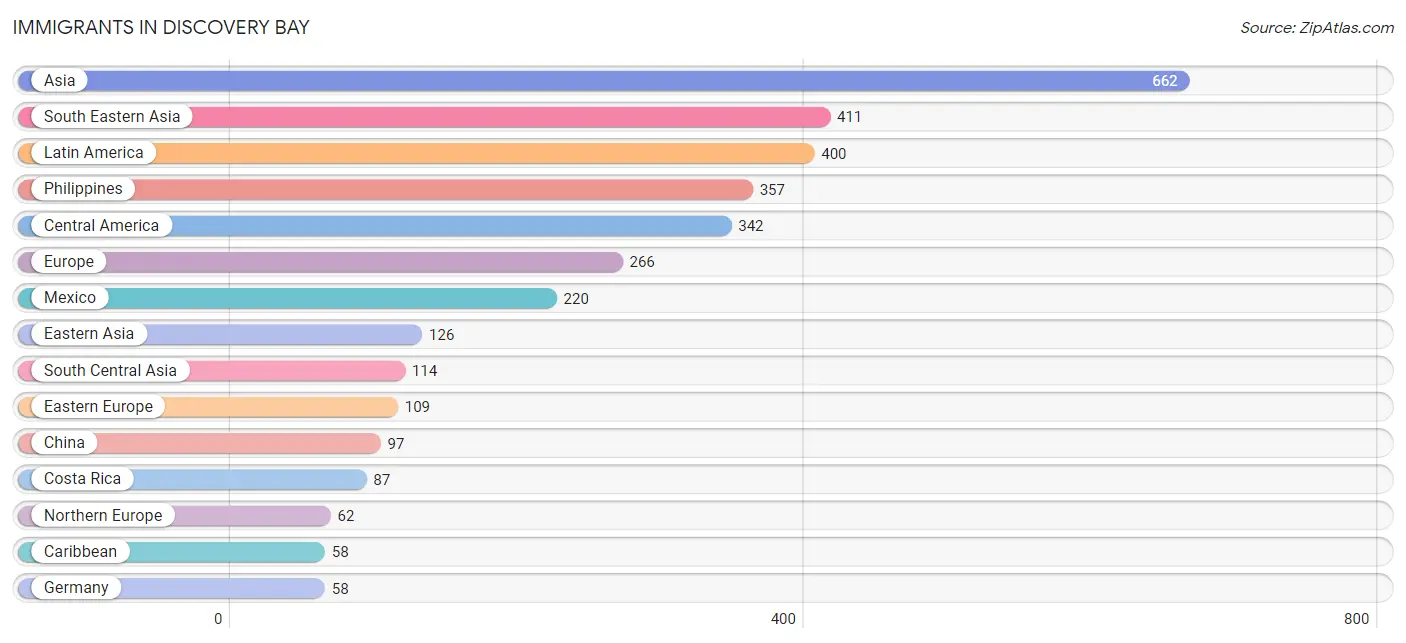
The most numerous immigrant groups reported in Discovery Bay came from Asia (662 | 4.3%), South Eastern Asia (411 | 2.7%), Latin America (400 | 2.6%), Philippines (357 | 2.3%), and Central America (342 | 2.2%), together accounting for 14.1% of all Discovery Bay residents.
| Immigration Origin | # Population | % Population |
| Africa | 44 | 0.3% |
| Asia | 662 | 4.3% |
| Belize | 10 | 0.1% |
| Canada | 43 | 0.3% |
| Caribbean | 58 | 0.4% |
| Central America | 342 | 2.2% |
| China | 97 | 0.6% |
| Costa Rica | 87 | 0.6% |
| Denmark | 13 | 0.1% |
| Eastern Asia | 126 | 0.8% |
| Eastern Europe | 109 | 0.7% |
| El Salvador | 15 | 0.1% |
| England | 49 | 0.3% |
| Europe | 266 | 1.7% |
| Germany | 58 | 0.4% |
| Guatemala | 10 | 0.1% |
| Haiti | 58 | 0.4% |
| Hong Kong | 42 | 0.3% |
| India | 56 | 0.4% |
| Iran | 12 | 0.1% |
| Korea | 29 | 0.2% |
| Latin America | 400 | 2.6% |
| Malaysia | 12 | 0.1% |
| Mexico | 220 | 1.4% |
| Morocco | 36 | 0.2% |
| Northern Africa | 36 | 0.2% |
| Northern Europe | 62 | 0.4% |
| Oceania | 12 | 0.1% |
| Pakistan | 46 | 0.3% |
| Philippines | 357 | 2.3% |
| Poland | 39 | 0.3% |
| Russia | 34 | 0.2% |
| Singapore | 9 | 0.1% |
| South Africa | 8 | 0.1% |
| South Central Asia | 114 | 0.7% |
| South Eastern Asia | 411 | 2.7% |
| Southern Europe | 9 | 0.1% |
| Syria | 11 | 0.1% |
| Taiwan | 8 | 0.1% |
| Ukraine | 36 | 0.2% |
| Vietnam | 33 | 0.2% |
| Western Asia | 11 | 0.1% |
| Western Europe | 58 | 0.4% | View All 43 Rows |
Sex and Age in Discovery Bay
Sex and Age in Discovery Bay
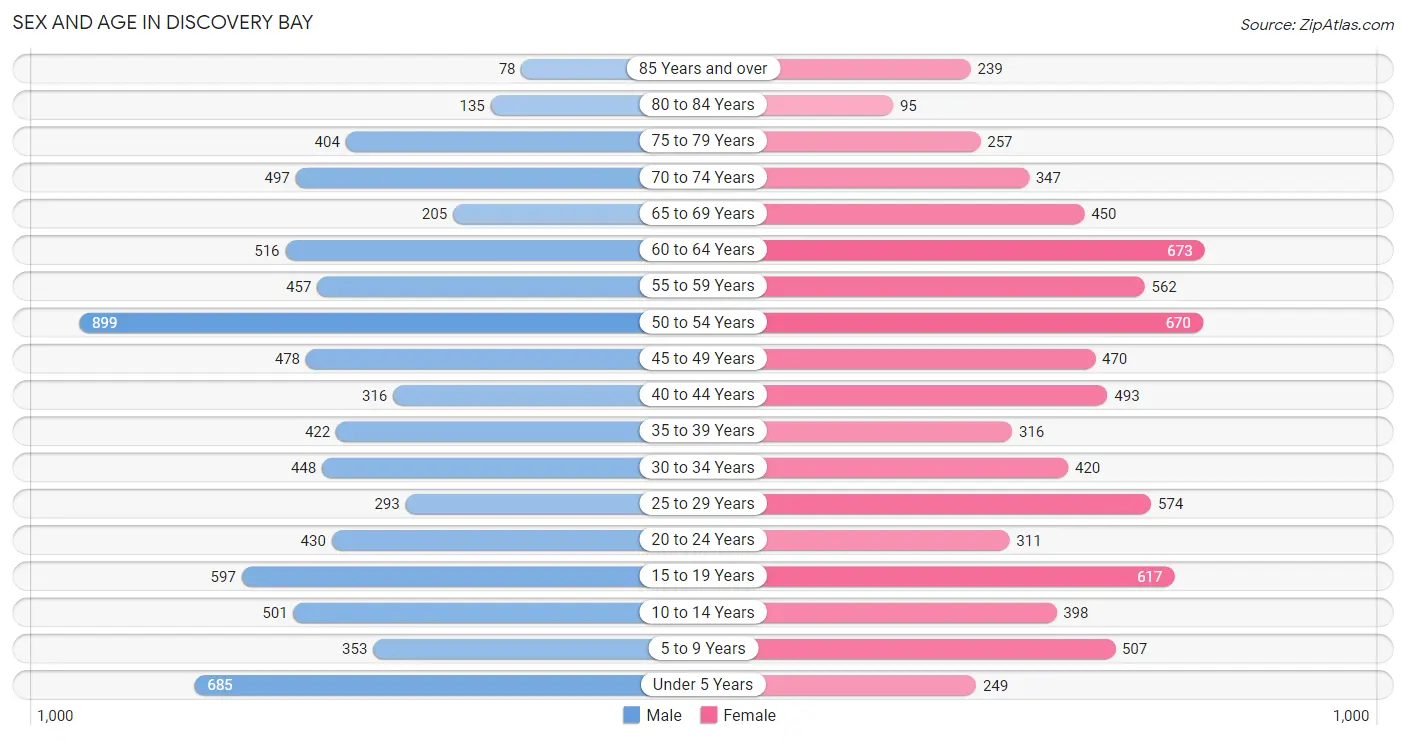
The most populous age groups in Discovery Bay are 50 to 54 Years (899 | 11.7%) for men and 60 to 64 Years (673 | 8.8%) for women.
| Age Bracket | Male | Female |
| Under 5 Years | 685 (8.9%) | 249 (3.3%) |
| 5 to 9 Years | 353 (4.6%) | 507 (6.6%) |
| 10 to 14 Years | 501 (6.5%) | 398 (5.2%) |
| 15 to 19 Years | 597 (7.7%) | 617 (8.1%) |
| 20 to 24 Years | 430 (5.6%) | 311 (4.1%) |
| 25 to 29 Years | 293 (3.8%) | 574 (7.5%) |
| 30 to 34 Years | 448 (5.8%) | 420 (5.5%) |
| 35 to 39 Years | 422 (5.5%) | 316 (4.1%) |
| 40 to 44 Years | 316 (4.1%) | 493 (6.5%) |
| 45 to 49 Years | 478 (6.2%) | 470 (6.1%) |
| 50 to 54 Years | 899 (11.7%) | 670 (8.8%) |
| 55 to 59 Years | 457 (5.9%) | 562 (7.3%) |
| 60 to 64 Years | 516 (6.7%) | 673 (8.8%) |
| 65 to 69 Years | 205 (2.7%) | 450 (5.9%) |
| 70 to 74 Years | 497 (6.4%) | 347 (4.5%) |
| 75 to 79 Years | 404 (5.2%) | 257 (3.4%) |
| 80 to 84 Years | 135 (1.8%) | 95 (1.2%) |
| 85 Years and over | 78 (1.0%) | 239 (3.1%) |
| Total | 7,714 (100.0%) | 7,648 (100.0%) |
Families and Households in Discovery Bay
Median Family Size in Discovery Bay
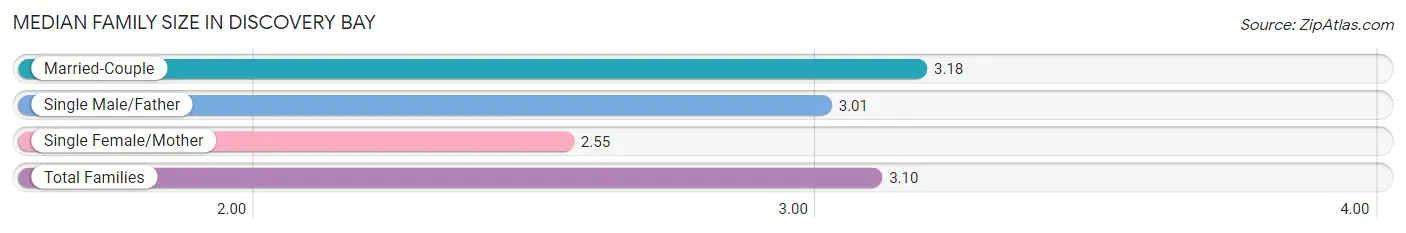
The median family size in Discovery Bay is 3.10 persons per family, with married-couple families (3,536 | 80.9%) accounting for the largest median family size of 3.18 persons per family. On the other hand, single female/mother families (499 | 11.4%) represent the smallest median family size with 2.55 persons per family.
| Family Type | # Families | Family Size |
| Married-Couple | 3,536 (80.9%) | 3.18 |
| Single Male/Father | 333 (7.6%) | 3.01 |
| Single Female/Mother | 499 (11.4%) | 2.55 |
| Total Families | 4,368 (100.0%) | 3.10 |
Median Household Size in Discovery Bay
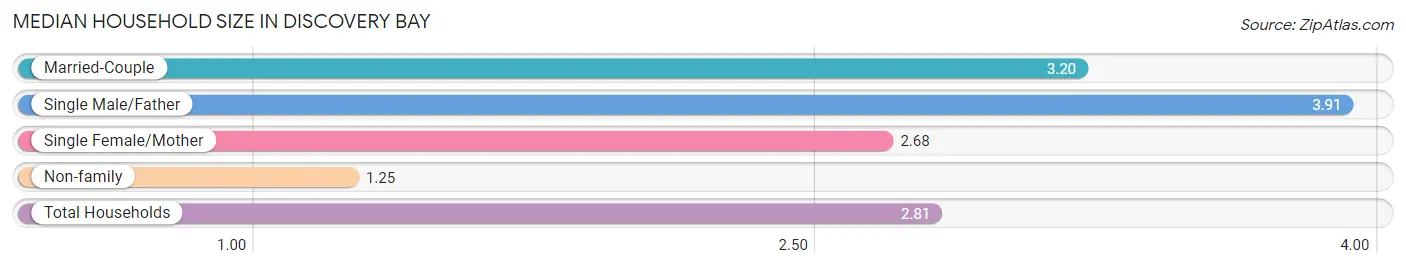
The median household size in Discovery Bay is 2.81 persons per household, with single male/father households (333 | 6.1%) accounting for the largest median household size of 3.91 persons per household. non-family households (1,083 | 19.9%) represent the smallest median household size with 1.25 persons per household.
| Household Type | # Households | Household Size |
| Married-Couple | 3,536 (64.9%) | 3.20 |
| Single Male/Father | 333 (6.1%) | 3.91 |
| Single Female/Mother | 499 (9.1%) | 2.68 |
| Non-family | 1,083 (19.9%) | 1.25 |
| Total Households | 5,451 (100.0%) | 2.81 |
Household Size by Marriage Status in Discovery Bay
Out of a total of 5,451 households in Discovery Bay, 4,368 (80.1%) are family households, while 1,083 (19.9%) are nonfamily households. The most numerous type of family households are 2-person households, comprising 1,996, and the most common type of nonfamily households are 1-person households, comprising 806.
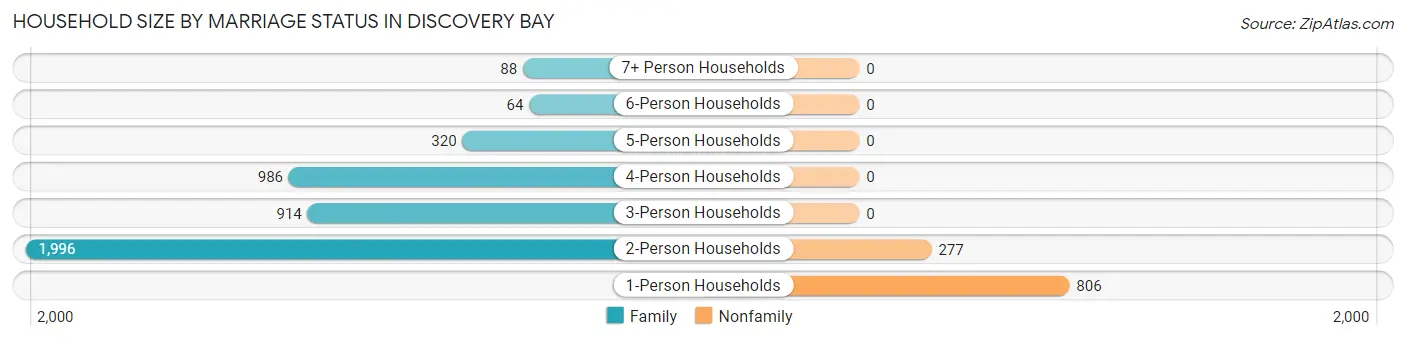
| Household Size | Family Households | Nonfamily Households |
| 1-Person Households | - | 806 (14.8%) |
| 2-Person Households | 1,996 (36.6%) | 277 (5.1%) |
| 3-Person Households | 914 (16.8%) | 0 (0.0%) |
| 4-Person Households | 986 (18.1%) | 0 (0.0%) |
| 5-Person Households | 320 (5.9%) | 0 (0.0%) |
| 6-Person Households | 64 (1.2%) | 0 (0.0%) |
| 7+ Person Households | 88 (1.6%) | 0 (0.0%) |
| Total | 4,368 (80.1%) | 1,083 (19.9%) |
Female Fertility in Discovery Bay
Fertility by Age in Discovery Bay
Average fertility rate in Discovery Bay is 74.0 births per 1,000 women. Women in the age bracket of 20 to 34 years have the highest fertility rate with 153.0 births per 1,000 women. Women in the age bracket of 20 to 34 years acount for 80.0% of all women with births.
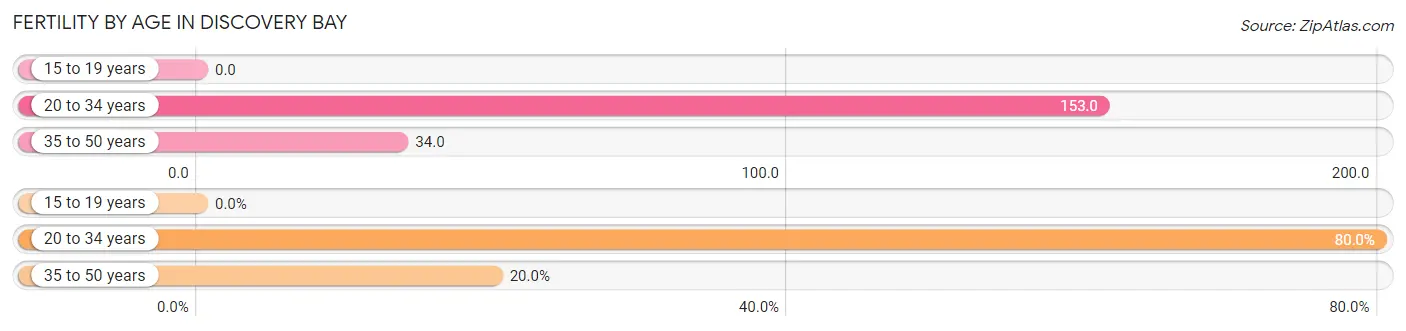
| Age Bracket | Women with Births | Births / 1,000 Women |
| 15 to 19 years | 0 (0.0%) | 0.0 |
| 20 to 34 years | 200 (80.0%) | 153.0 |
| 35 to 50 years | 50 (20.0%) | 34.0 |
| Total | 250 (100.0%) | 74.0 |
Fertility by Age by Marriage Status in Discovery Bay
86.0% of women with births (250) in Discovery Bay are married. The highest percentage of unmarried women with births falls into 35 to 50 years age bracket with 58.0% of them unmarried at the time of birth, while the lowest percentage of unmarried women with births belong to 20 to 34 years age bracket with 3.0% of them unmarried.
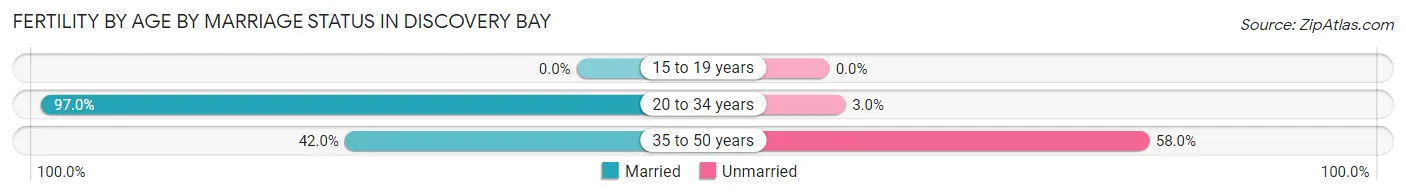
| Age Bracket | Married | Unmarried |
| 15 to 19 years | 0 (0.0%) | 0 (0.0%) |
| 20 to 34 years | 194 (97.0%) | 6 (3.0%) |
| 35 to 50 years | 21 (42.0%) | 29 (58.0%) |
| Total | 215 (86.0%) | 35 (14.0%) |
Fertility by Education in Discovery Bay
Average fertility rate in Discovery Bay is 74.0 births per 1,000 women. Women with the education attainment of bachelor's degree have the highest fertility rate of 193.0 births per 1,000 women, while women with the education attainment of high school diploma have the lowest fertility at 10.0 births per 1,000 women. Women with the education attainment of bachelor's degree represent 52.4% of all women with births.
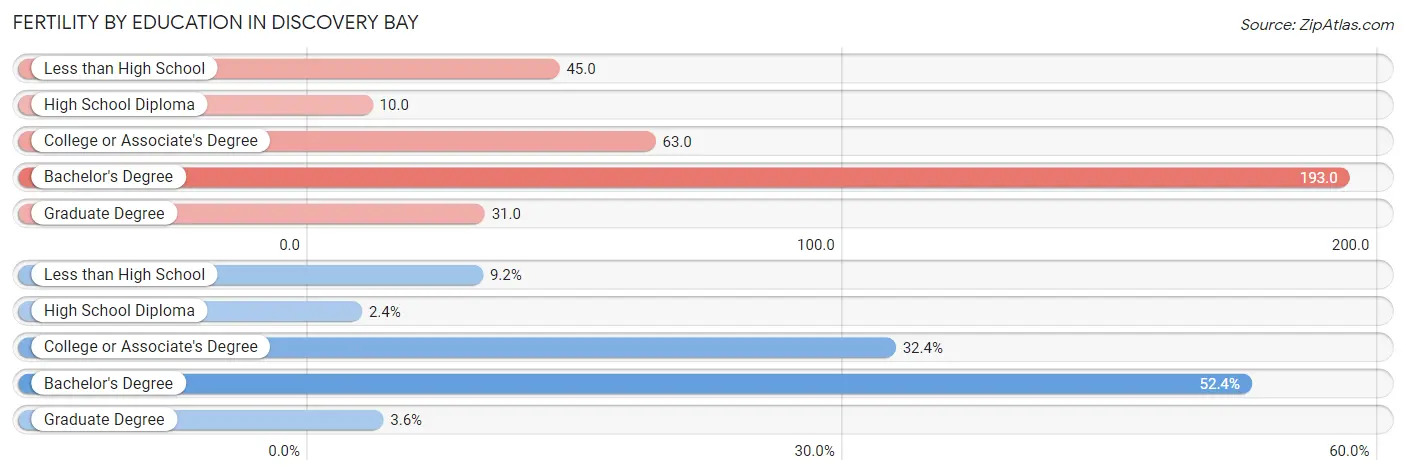
| Educational Attainment | Women with Births | Births / 1,000 Women |
| Less than High School | 23 (9.2%) | 45.0 |
| High School Diploma | 6 (2.4%) | 10.0 |
| College or Associate's Degree | 81 (32.4%) | 63.0 |
| Bachelor's Degree | 131 (52.4%) | 193.0 |
| Graduate Degree | 9 (3.6%) | 31.0 |
| Total | 250 (100.0%) | 74.0 |
Fertility by Education by Marriage Status in Discovery Bay
14.0% of women with births in Discovery Bay are unmarried. Women with the educational attainment of college or associate's degree are most likely to be married with 100.0% of them married at childbirth, while women with the educational attainment of less than high school are least likely to be married with 100.0% of them unmarried at childbirth.
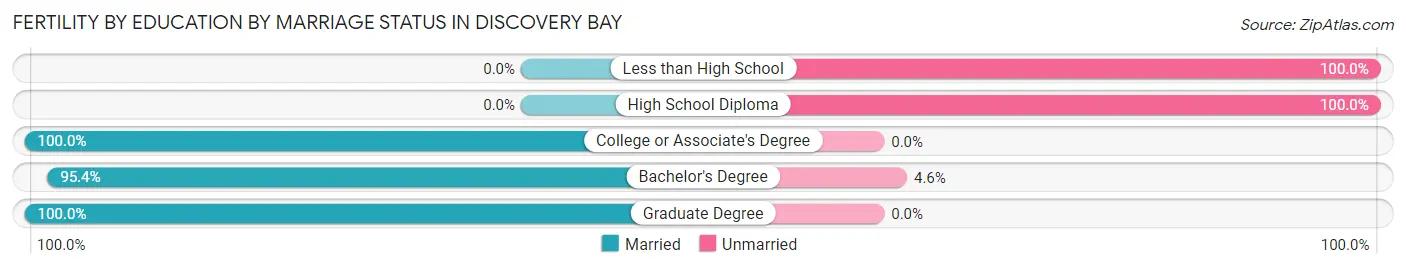
| Educational Attainment | Married | Unmarried |
| Less than High School | 0 (0.0%) | 23 (100.0%) |
| High School Diploma | 0 (0.0%) | 6 (100.0%) |
| College or Associate's Degree | 81 (100.0%) | 0 (0.0%) |
| Bachelor's Degree | 125 (95.4%) | 6 (4.6%) |
| Graduate Degree | 9 (100.0%) | 0 (0.0%) |
| Total | 215 (86.0%) | 35 (14.0%) |
Employment Characteristics in Discovery Bay
Employment by Class of Employer in Discovery Bay
Among the 7,318 employed individuals in Discovery Bay, private company employees (5,263 | 71.9%), local government employees (815 | 11.1%), and not-for-profit organizations (508 | 6.9%) make up the most common classes of employment.
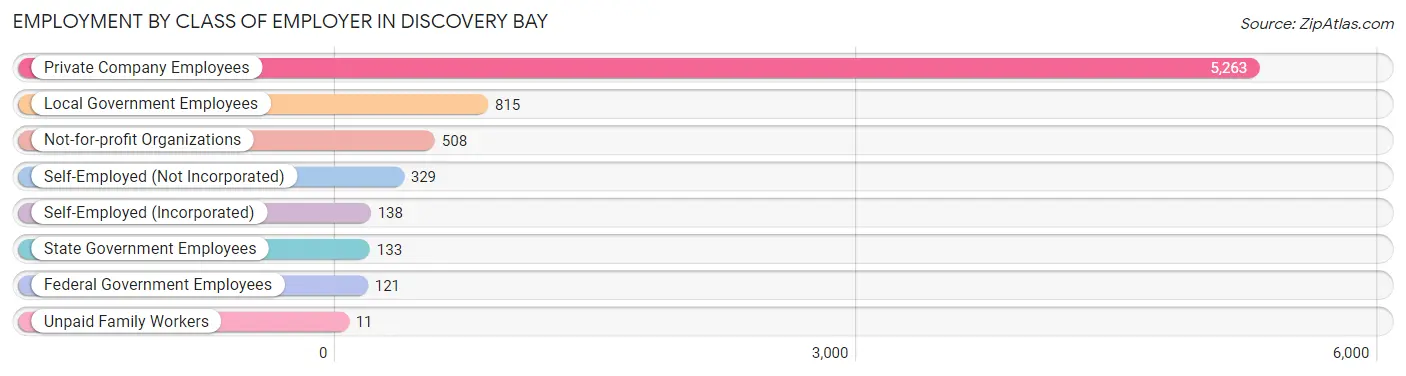
| Employer Class | # Employees | % Employees |
| Private Company Employees | 5,263 | 71.9% |
| Self-Employed (Incorporated) | 138 | 1.9% |
| Self-Employed (Not Incorporated) | 329 | 4.5% |
| Not-for-profit Organizations | 508 | 6.9% |
| Local Government Employees | 815 | 11.1% |
| State Government Employees | 133 | 1.8% |
| Federal Government Employees | 121 | 1.7% |
| Unpaid Family Workers | 11 | 0.2% |
| Total | 7,318 | 100.0% |
Employment Status by Age in Discovery Bay
According to the labor force statistics for Discovery Bay, out of the total population over 16 years of age (12,582), 62.5% or 7,864 individuals are in the labor force, with 5.4% or 425 of them unemployed. The age group with the highest labor force participation rate is 25 to 29 years, with 89.4% or 775 individuals in the labor force. Within the labor force, the 75 years and over age range has the highest percentage of unemployed individuals, with 17.6% or 39 of them being unemployed.
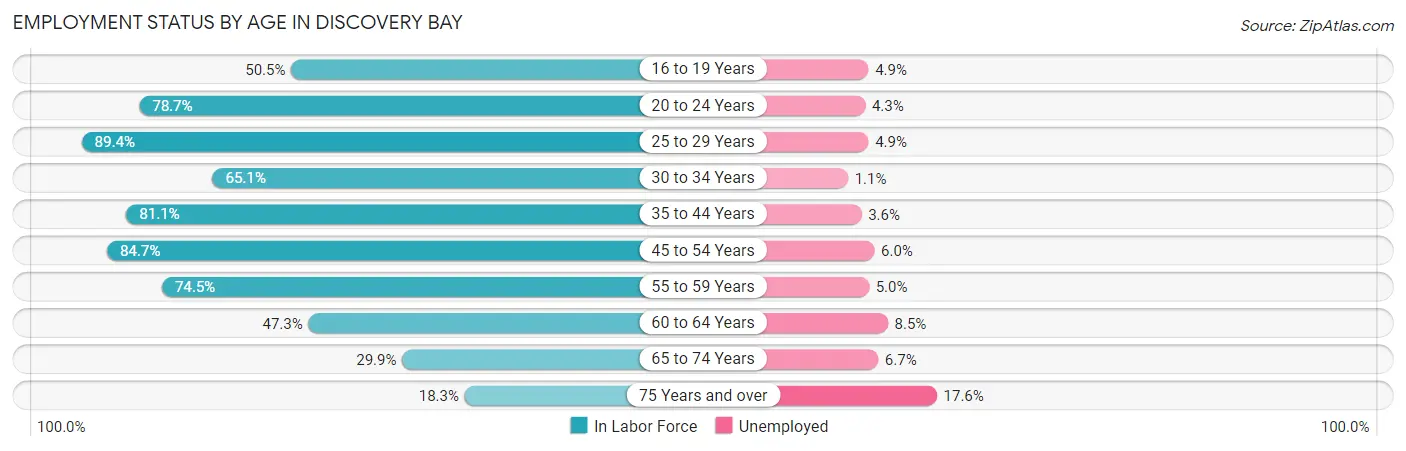
| Age Bracket | In Labor Force | Unemployed |
| 16 to 19 Years | 569 (50.5%) | 28 (4.9%) |
| 20 to 24 Years | 583 (78.7%) | 25 (4.3%) |
| 25 to 29 Years | 775 (89.4%) | 38 (4.9%) |
| 30 to 34 Years | 565 (65.1%) | 6 (1.1%) |
| 35 to 44 Years | 1,255 (81.1%) | 45 (3.6%) |
| 45 to 54 Years | 2,132 (84.7%) | 128 (6.0%) |
| 55 to 59 Years | 759 (74.5%) | 38 (5.0%) |
| 60 to 64 Years | 562 (47.3%) | 48 (8.5%) |
| 65 to 74 Years | 448 (29.9%) | 30 (6.7%) |
| 75 Years and over | 221 (18.3%) | 39 (17.6%) |
| Total | 7,864 (62.5%) | 425 (5.4%) |
Employment Status by Educational Attainment in Discovery Bay
According to labor force statistics for Discovery Bay, 75.5% of individuals (6,045) out of the total population between 25 and 64 years of age (8,007) are in the labor force, with 5.0% or 302 of them being unemployed. The group with the highest labor force participation rate are those with the educational attainment of bachelor's degree or higher, with 81.1% or 2,073 individuals in the labor force. Within the labor force, individuals with high school diploma education have the highest percentage of unemployment, with 9.9% or 79 of them being unemployed.
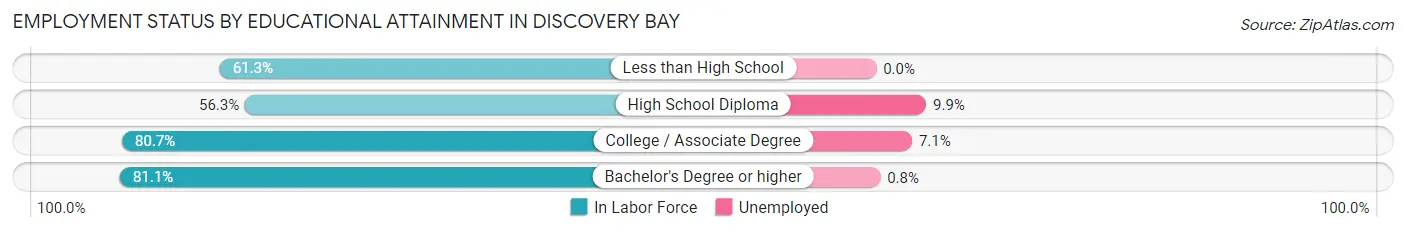
| Educational Attainment | In Labor Force | Unemployed |
| Less than High School | 253 (61.3%) | 0 (0.0%) |
| High School Diploma | 797 (56.3%) | 140 (9.9%) |
| College / Associate Degree | 2,924 (80.7%) | 257 (7.1%) |
| Bachelor's Degree or higher | 2,073 (81.1%) | 20 (0.8%) |
| Total | 6,045 (75.5%) | 400 (5.0%) |
Employment Occupations by Sex in Discovery Bay
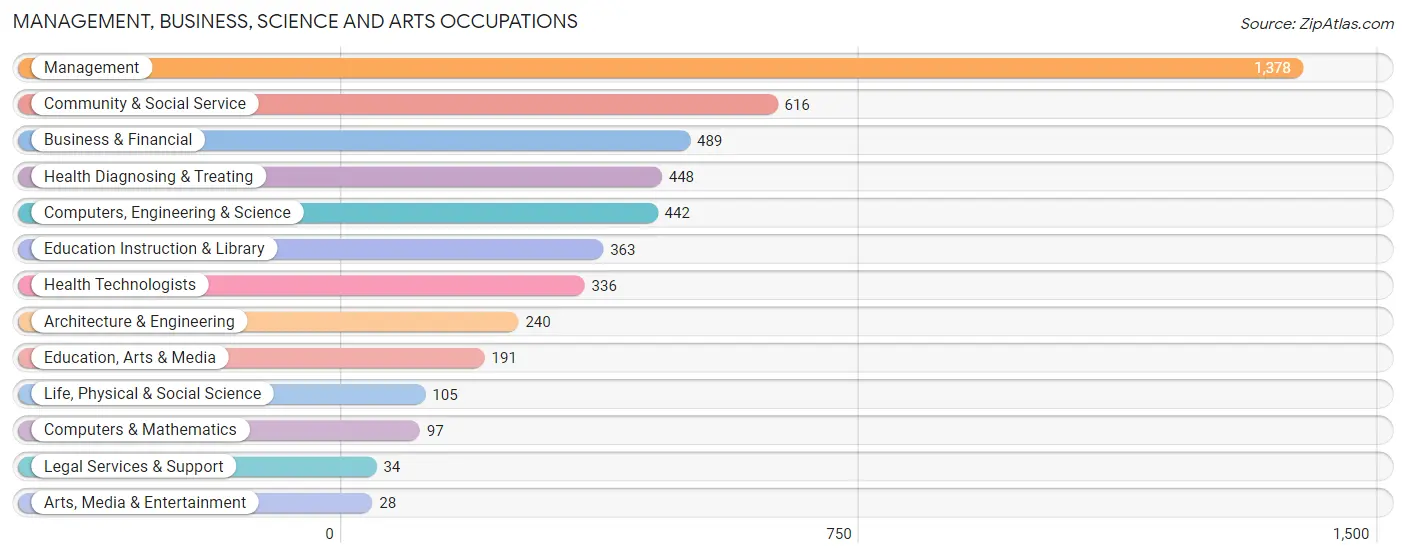
Management, Business, Science and Arts Occupations
The most common Management, Business, Science and Arts occupations in Discovery Bay are Management (1,378 | 18.5%), Community & Social Service (616 | 8.3%), Business & Financial (489 | 6.6%), Health Diagnosing & Treating (448 | 6.0%), and Computers, Engineering & Science (442 | 5.9%).
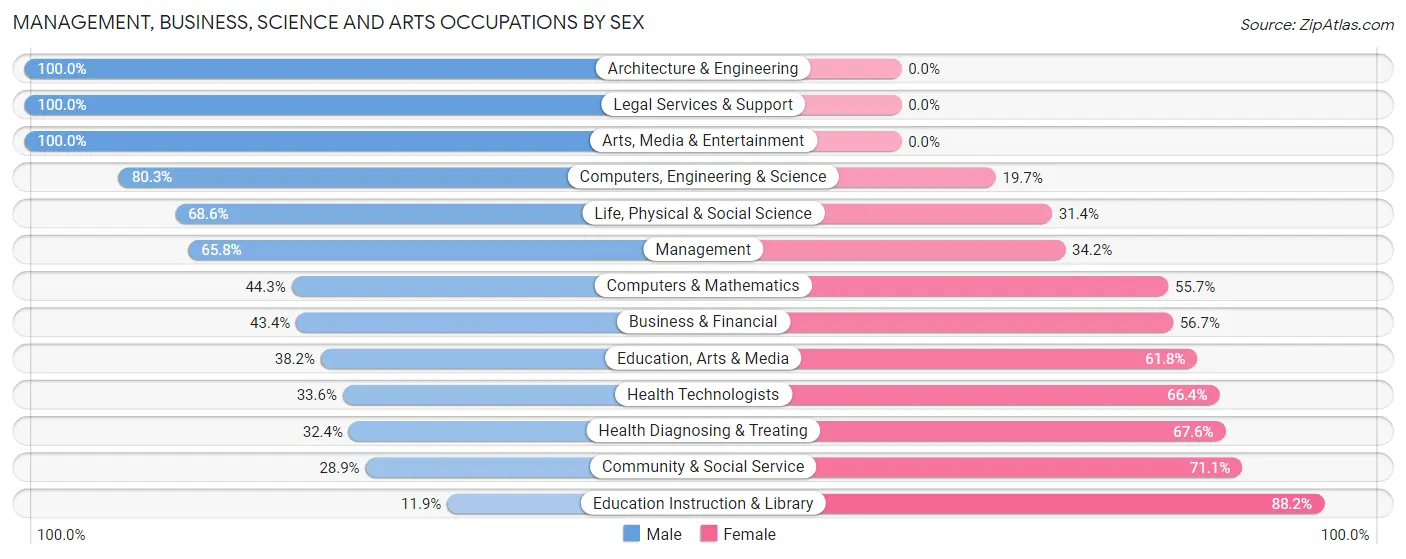
Management, Business, Science and Arts Occupations by Sex
Within the Management, Business, Science and Arts occupations in Discovery Bay, the most male-oriented occupations are Architecture & Engineering (100.0%), Legal Services & Support (100.0%), and Arts, Media & Entertainment (100.0%), while the most female-oriented occupations are Education Instruction & Library (88.1%), Community & Social Service (71.1%), and Health Diagnosing & Treating (67.6%).
| Occupation | Male | Female |
| Management | 907 (65.8%) | 471 (34.2%) |
| Business & Financial | 212 (43.3%) | 277 (56.7%) |
| Computers, Engineering & Science | 355 (80.3%) | 87 (19.7%) |
| Computers & Mathematics | 43 (44.3%) | 54 (55.7%) |
| Architecture & Engineering | 240 (100.0%) | 0 (0.0%) |
| Life, Physical & Social Science | 72 (68.6%) | 33 (31.4%) |
| Community & Social Service | 178 (28.9%) | 438 (71.1%) |
| Education, Arts & Media | 73 (38.2%) | 118 (61.8%) |
| Legal Services & Support | 34 (100.0%) | 0 (0.0%) |
| Education Instruction & Library | 43 (11.8%) | 320 (88.1%) |
| Arts, Media & Entertainment | 28 (100.0%) | 0 (0.0%) |
| Health Diagnosing & Treating | 145 (32.4%) | 303 (67.6%) |
| Health Technologists | 113 (33.6%) | 223 (66.4%) |
| Total (Category) | 1,797 (53.3%) | 1,576 (46.7%) |
| Total (Overall) | 4,043 (54.3%) | 3,400 (45.7%) |
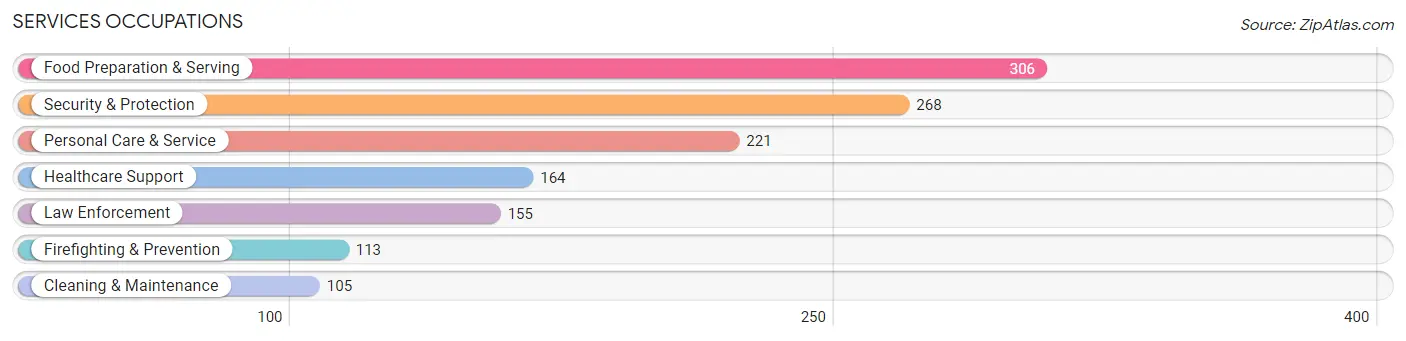
Services Occupations
The most common Services occupations in Discovery Bay are Food Preparation & Serving (306 | 4.1%), Security & Protection (268 | 3.6%), Personal Care & Service (221 | 3.0%), Healthcare Support (164 | 2.2%), and Law Enforcement (155 | 2.1%).
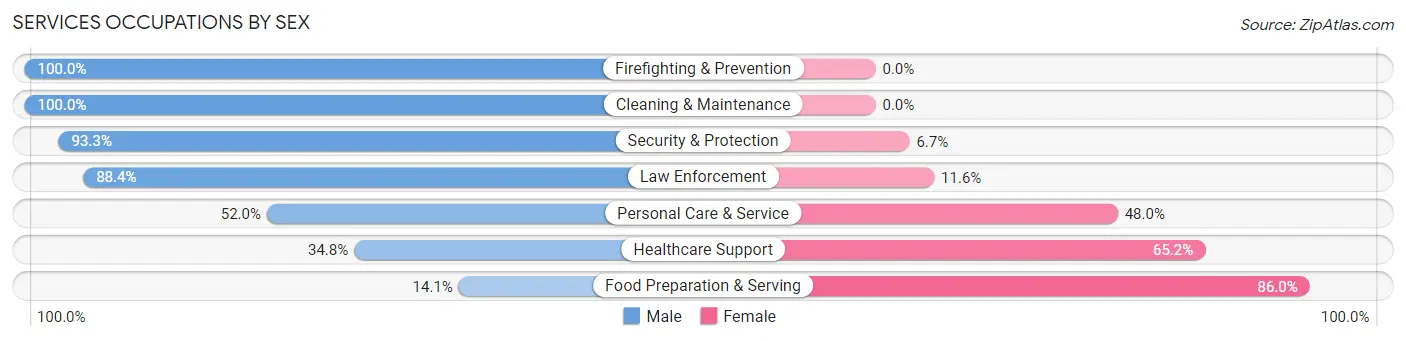
Services Occupations by Sex
Within the Services occupations in Discovery Bay, the most male-oriented occupations are Firefighting & Prevention (100.0%), Cleaning & Maintenance (100.0%), and Security & Protection (93.3%), while the most female-oriented occupations are Food Preparation & Serving (86.0%), Healthcare Support (65.2%), and Personal Care & Service (48.0%).
| Occupation | Male | Female |
| Healthcare Support | 57 (34.8%) | 107 (65.2%) |
| Security & Protection | 250 (93.3%) | 18 (6.7%) |
| Firefighting & Prevention | 113 (100.0%) | 0 (0.0%) |
| Law Enforcement | 137 (88.4%) | 18 (11.6%) |
| Food Preparation & Serving | 43 (14.1%) | 263 (86.0%) |
| Cleaning & Maintenance | 105 (100.0%) | 0 (0.0%) |
| Personal Care & Service | 115 (52.0%) | 106 (48.0%) |
| Total (Category) | 570 (53.6%) | 494 (46.4%) |
| Total (Overall) | 4,043 (54.3%) | 3,400 (45.7%) |
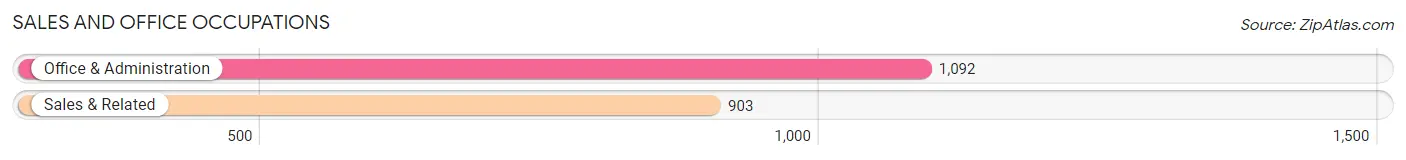
Sales and Office Occupations
The most common Sales and Office occupations in Discovery Bay are Office & Administration (1,092 | 14.7%), and Sales & Related (903 | 12.1%).
Sales and Office Occupations by Sex
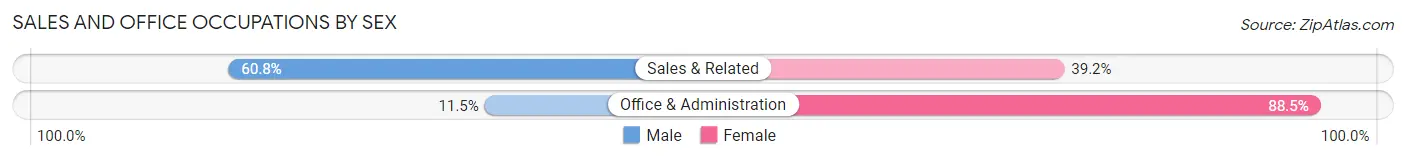
| Occupation | Male | Female |
| Sales & Related | 549 (60.8%) | 354 (39.2%) |
| Office & Administration | 126 (11.5%) | 966 (88.5%) |
| Total (Category) | 675 (33.8%) | 1,320 (66.2%) |
| Total (Overall) | 4,043 (54.3%) | 3,400 (45.7%) |
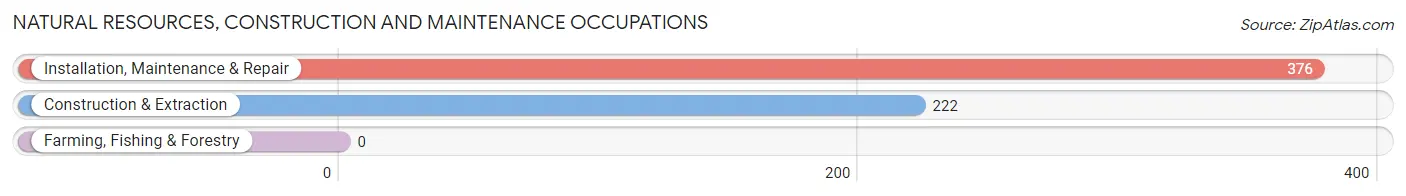
Natural Resources, Construction and Maintenance Occupations
The most common Natural Resources, Construction and Maintenance occupations in Discovery Bay are Installation, Maintenance & Repair (376 | 5.1%), and Construction & Extraction (222 | 3.0%).
Natural Resources, Construction and Maintenance Occupations by Sex
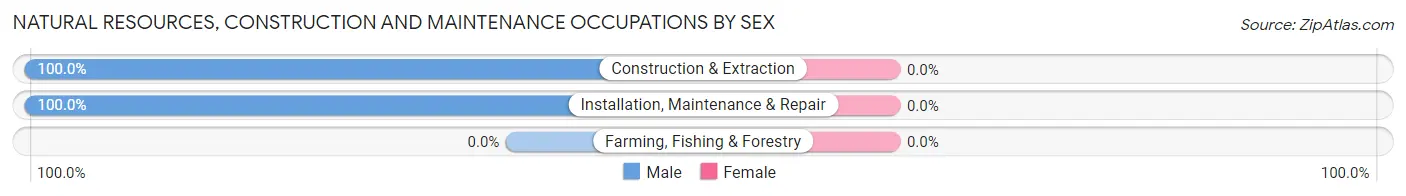
| Occupation | Male | Female |
| Farming, Fishing & Forestry | 0 (0.0%) | 0 (0.0%) |
| Construction & Extraction | 222 (100.0%) | 0 (0.0%) |
| Installation, Maintenance & Repair | 376 (100.0%) | 0 (0.0%) |
| Total (Category) | 598 (100.0%) | 0 (0.0%) |
| Total (Overall) | 4,043 (54.3%) | 3,400 (45.7%) |
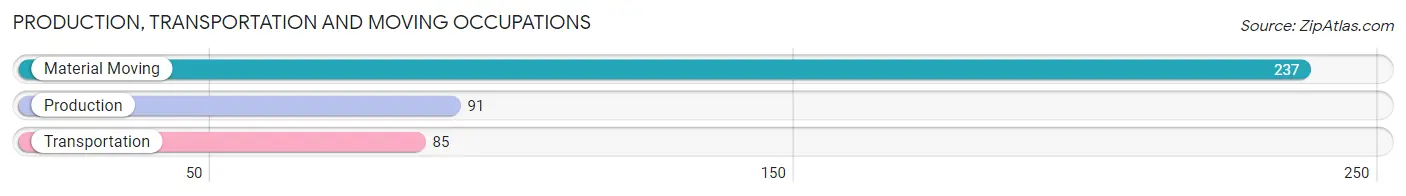
Production, Transportation and Moving Occupations
The most common Production, Transportation and Moving occupations in Discovery Bay are Material Moving (237 | 3.2%), Production (91 | 1.2%), and Transportation (85 | 1.1%).
Production, Transportation and Moving Occupations by Sex
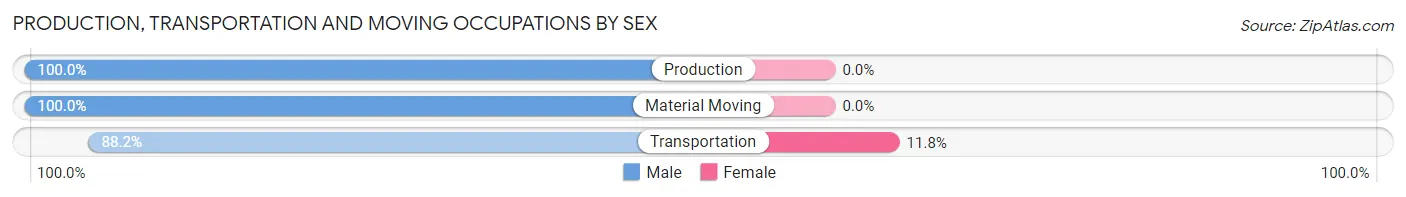
| Occupation | Male | Female |
| Production | 91 (100.0%) | 0 (0.0%) |
| Transportation | 75 (88.2%) | 10 (11.8%) |
| Material Moving | 237 (100.0%) | 0 (0.0%) |
| Total (Category) | 403 (97.6%) | 10 (2.4%) |
| Total (Overall) | 4,043 (54.3%) | 3,400 (45.7%) |
Employment Industries by Sex in Discovery Bay
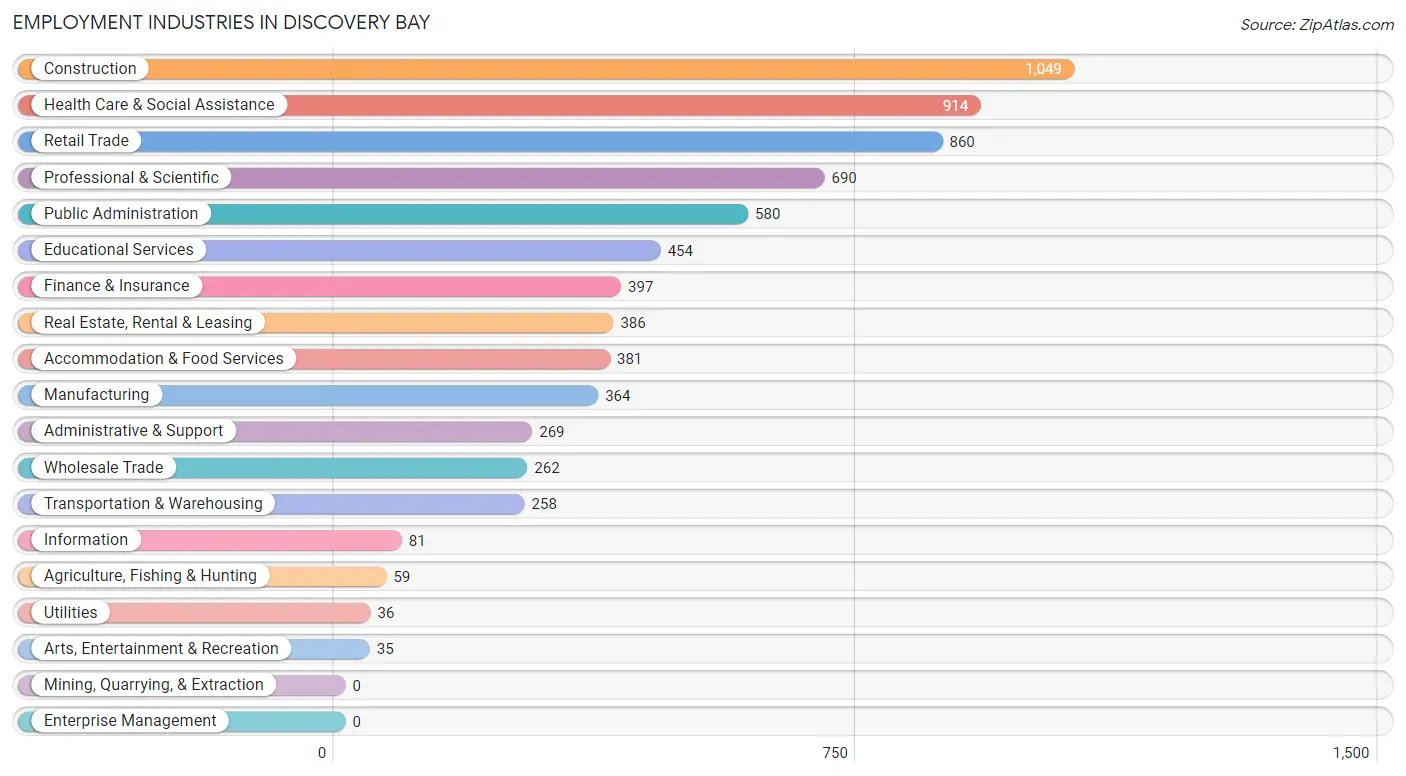
Employment Industries in Discovery Bay
The major employment industries in Discovery Bay include Construction (1,049 | 14.1%), Health Care & Social Assistance (914 | 12.3%), Retail Trade (860 | 11.6%), Professional & Scientific (690 | 9.3%), and Public Administration (580 | 7.8%).
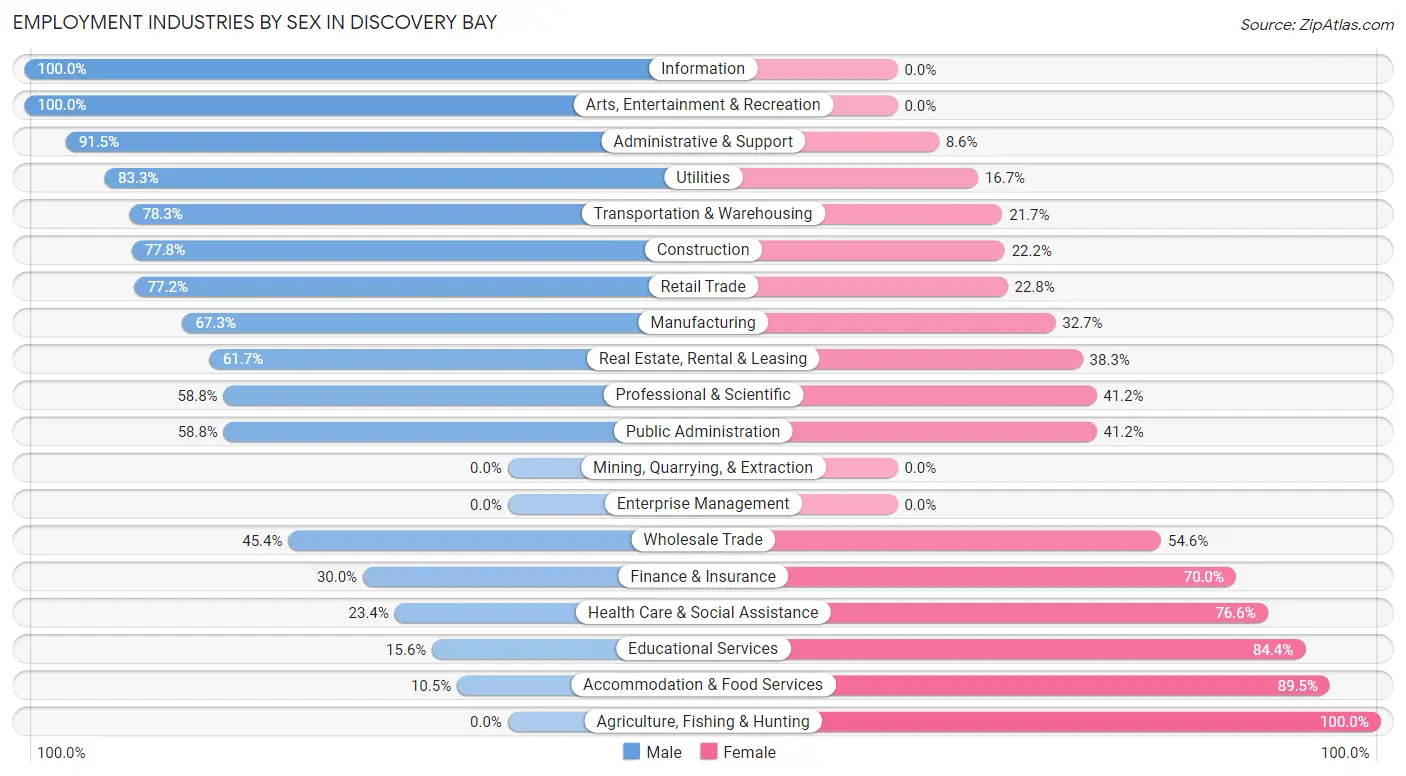
Employment Industries by Sex in Discovery Bay
The Discovery Bay industries that see more men than women are Information (100.0%), Arts, Entertainment & Recreation (100.0%), and Administrative & Support (91.4%), whereas the industries that tend to have a higher number of women are Agriculture, Fishing & Hunting (100.0%), Accommodation & Food Services (89.5%), and Educational Services (84.4%).
| Industry | Male | Female |
| Agriculture, Fishing & Hunting | 0 (0.0%) | 59 (100.0%) |
| Mining, Quarrying, & Extraction | 0 (0.0%) | 0 (0.0%) |
| Construction | 816 (77.8%) | 233 (22.2%) |
| Manufacturing | 245 (67.3%) | 119 (32.7%) |
| Wholesale Trade | 119 (45.4%) | 143 (54.6%) |
| Retail Trade | 664 (77.2%) | 196 (22.8%) |
| Transportation & Warehousing | 202 (78.3%) | 56 (21.7%) |
| Utilities | 30 (83.3%) | 6 (16.7%) |
| Information | 81 (100.0%) | 0 (0.0%) |
| Finance & Insurance | 119 (30.0%) | 278 (70.0%) |
| Real Estate, Rental & Leasing | 238 (61.7%) | 148 (38.3%) |
| Professional & Scientific | 406 (58.8%) | 284 (41.2%) |
| Enterprise Management | 0 (0.0%) | 0 (0.0%) |
| Administrative & Support | 246 (91.4%) | 23 (8.6%) |
| Educational Services | 71 (15.6%) | 383 (84.4%) |
| Health Care & Social Assistance | 214 (23.4%) | 700 (76.6%) |
| Arts, Entertainment & Recreation | 35 (100.0%) | 0 (0.0%) |
| Accommodation & Food Services | 40 (10.5%) | 341 (89.5%) |
| Public Administration | 341 (58.8%) | 239 (41.2%) |
| Total | 4,043 (54.3%) | 3,400 (45.7%) |
Education in Discovery Bay
School Enrollment in Discovery Bay
The most common levels of schooling among the 3,517 students in Discovery Bay are high school (980 | 27.9%), college / undergraduate (660 | 18.8%), and middle school (648 | 18.4%).
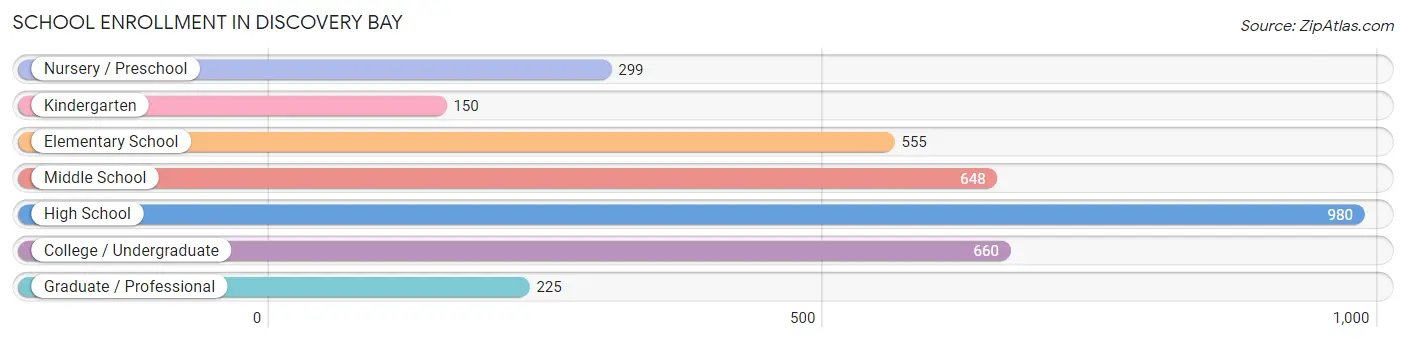
| School Level | # Students | % Students |
| Nursery / Preschool | 299 | 8.5% |
| Kindergarten | 150 | 4.3% |
| Elementary School | 555 | 15.8% |
| Middle School | 648 | 18.4% |
| High School | 980 | 27.9% |
| College / Undergraduate | 660 | 18.8% |
| Graduate / Professional | 225 | 6.4% |
| Total | 3,517 | 100.0% |
School Enrollment by Age by Funding Source in Discovery Bay
Out of a total of 3,517 students who are enrolled in schools in Discovery Bay, 753 (21.4%) attend a private institution, while the remaining 2,764 (78.6%) are enrolled in public schools. The age group of 3 to 4 year olds has the highest likelihood of being enrolled in private schools, with 166 (60.6% in the age bracket) enrolled. Conversely, the age group of 18 to 19 year olds has the lowest likelihood of being enrolled in a private school, with 414 (92.0% in the age bracket) attending a public institution.
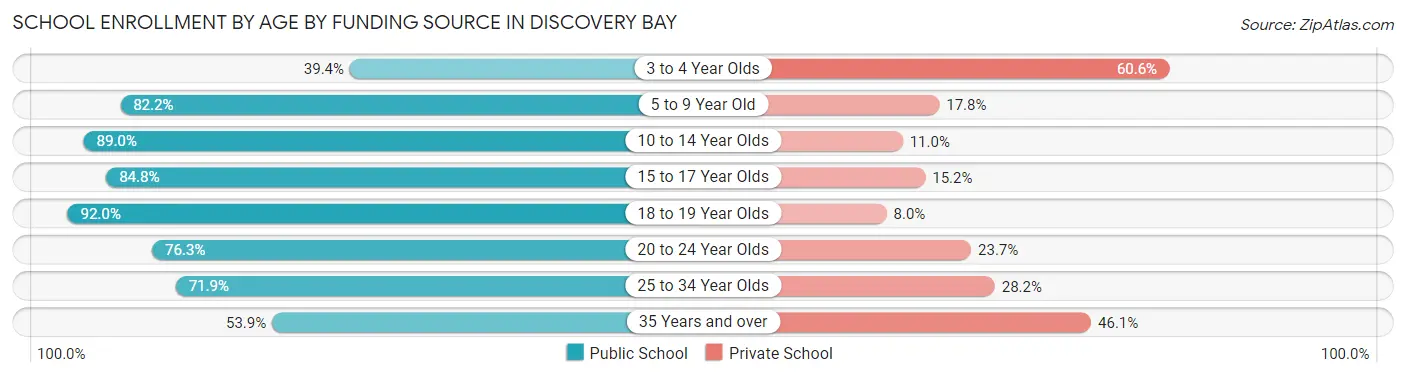
| Age Bracket | Public School | Private School |
| 3 to 4 Year Olds | 108 (39.4%) | 166 (60.6%) |
| 5 to 9 Year Old | 600 (82.2%) | 130 (17.8%) |
| 10 to 14 Year Olds | 712 (89.0%) | 88 (11.0%) |
| 15 to 17 Year Olds | 535 (84.8%) | 96 (15.2%) |
| 18 to 19 Year Olds | 414 (92.0%) | 36 (8.0%) |
| 20 to 24 Year Olds | 106 (76.3%) | 33 (23.7%) |
| 25 to 34 Year Olds | 97 (71.9%) | 38 (28.1%) |
| 35 Years and over | 193 (53.9%) | 165 (46.1%) |
| Total | 2,764 (78.6%) | 753 (21.4%) |
Educational Attainment by Field of Study in Discovery Bay
Business (1,192 | 32.3%), arts & humanities (372 | 10.1%), liberal arts & history (297 | 8.1%), science & technology (266 | 7.2%), and social sciences (265 | 7.2%) are the most common fields of study among 3,688 individuals in Discovery Bay who have obtained a bachelor's degree or higher.
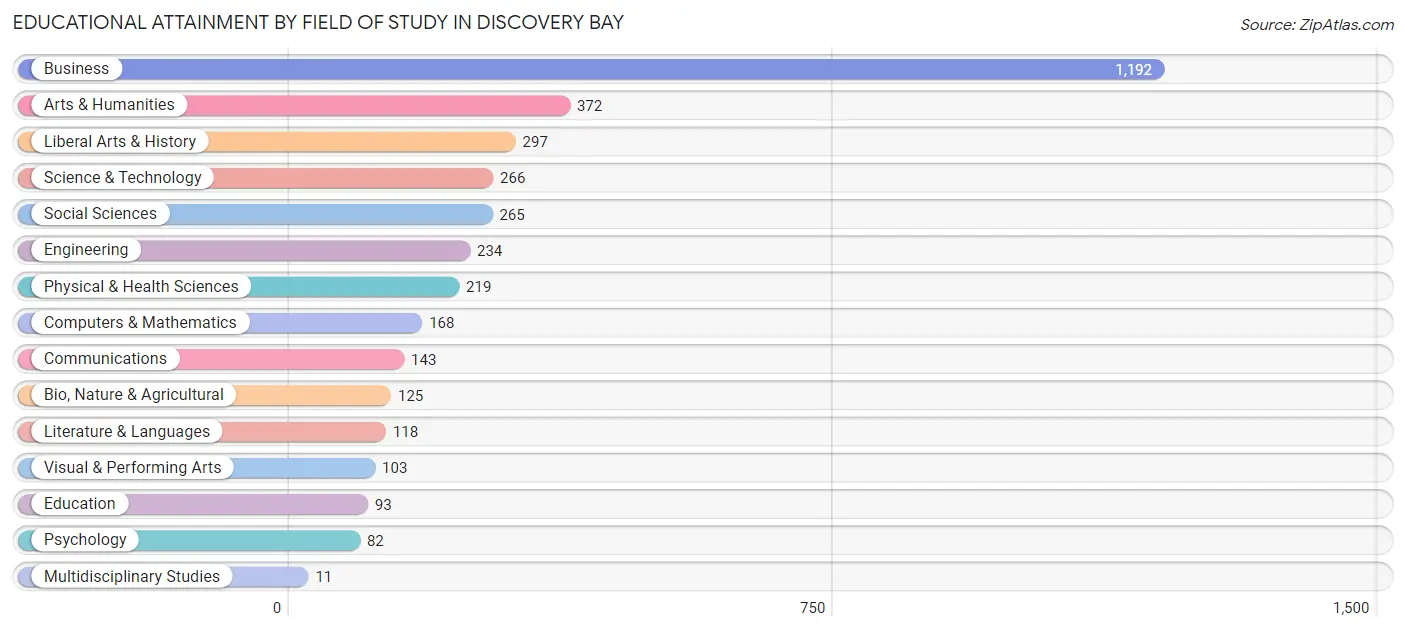
| Field of Study | # Graduates | % Graduates |
| Computers & Mathematics | 168 | 4.6% |
| Bio, Nature & Agricultural | 125 | 3.4% |
| Physical & Health Sciences | 219 | 5.9% |
| Psychology | 82 | 2.2% |
| Social Sciences | 265 | 7.2% |
| Engineering | 234 | 6.3% |
| Multidisciplinary Studies | 11 | 0.3% |
| Science & Technology | 266 | 7.2% |
| Business | 1,192 | 32.3% |
| Education | 93 | 2.5% |
| Literature & Languages | 118 | 3.2% |
| Liberal Arts & History | 297 | 8.1% |
| Visual & Performing Arts | 103 | 2.8% |
| Communications | 143 | 3.9% |
| Arts & Humanities | 372 | 10.1% |
| Total | 3,688 | 100.0% |
Transportation & Commute in Discovery Bay
Vehicle Availability by Sex in Discovery Bay
The most prevalent vehicle ownership categories in Discovery Bay are males with 3 vehicles (1,337, accounting for 33.8%) and females with 3 vehicles (846, making up 40.0%).
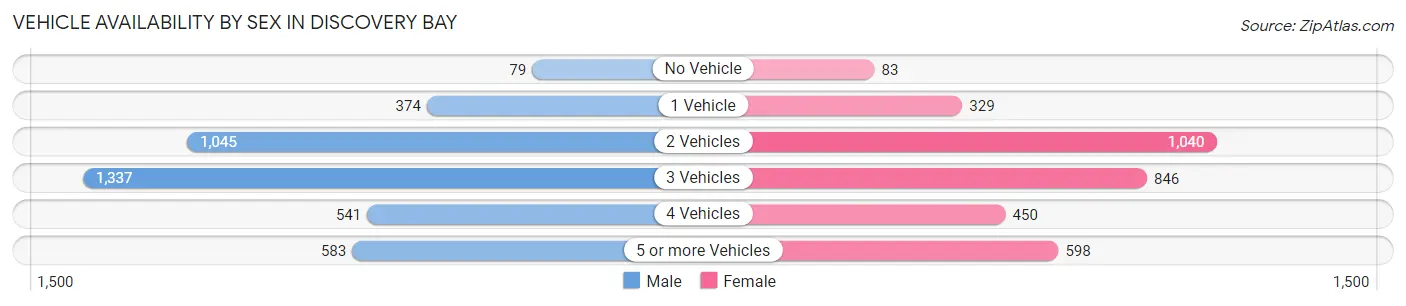
| Vehicles Available | Male | Female |
| No Vehicle | 79 (2.0%) | 83 (2.5%) |
| 1 Vehicle | 374 (9.5%) | 329 (9.8%) |
| 2 Vehicles | 1,045 (26.4%) | 1,040 (31.1%) |
| 3 Vehicles | 1,337 (33.8%) | 846 (25.3%) |
| 4 Vehicles | 541 (13.7%) | 450 (13.5%) |
| 5 or more Vehicles | 583 (14.7%) | 598 (17.9%) |
| Total | 3,959 (100.0%) | 3,346 (100.0%) |
Commute Time in Discovery Bay
The most frequently occuring commute durations in Discovery Bay are 60 to 89 minutes (1,348 commuters, 21.7%), 45 to 59 minutes (861 commuters, 13.8%), and 90 or more minutes (659 commuters, 10.6%).
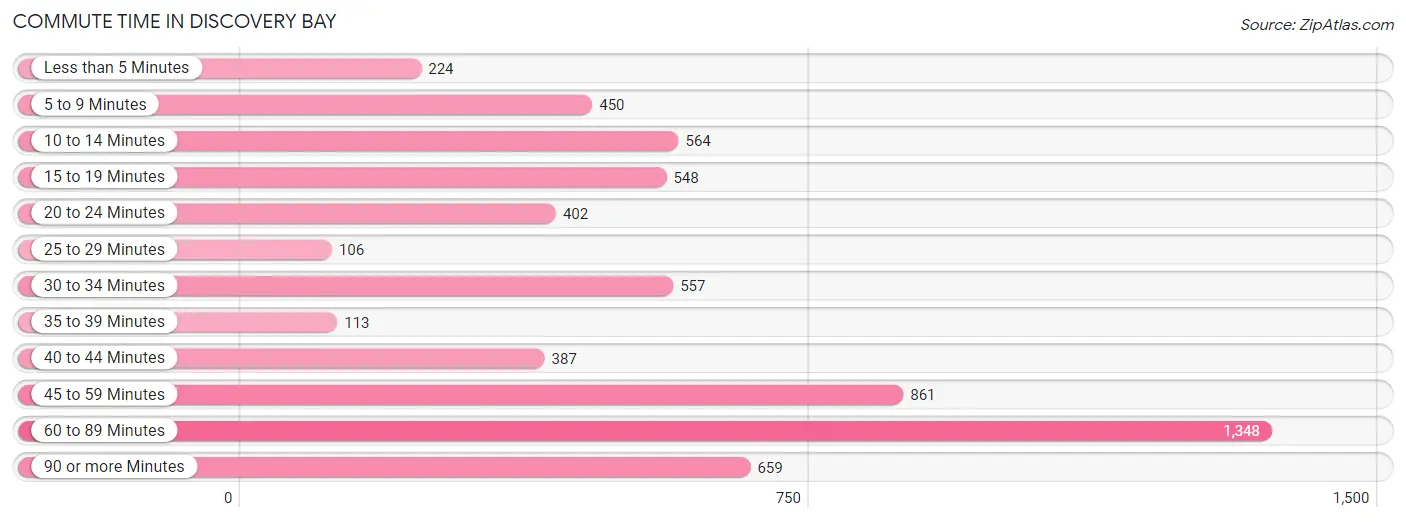
| Commute Time | # Commuters | % Commuters |
| Less than 5 Minutes | 224 | 3.6% |
| 5 to 9 Minutes | 450 | 7.2% |
| 10 to 14 Minutes | 564 | 9.1% |
| 15 to 19 Minutes | 548 | 8.8% |
| 20 to 24 Minutes | 402 | 6.5% |
| 25 to 29 Minutes | 106 | 1.7% |
| 30 to 34 Minutes | 557 | 9.0% |
| 35 to 39 Minutes | 113 | 1.8% |
| 40 to 44 Minutes | 387 | 6.2% |
| 45 to 59 Minutes | 861 | 13.8% |
| 60 to 89 Minutes | 1,348 | 21.7% |
| 90 or more Minutes | 659 | 10.6% |
Commute Time by Sex in Discovery Bay
The most common commute times in Discovery Bay are 60 to 89 minutes (938 commuters, 26.3%) for males and 60 to 89 minutes (410 commuters, 15.4%) for females.
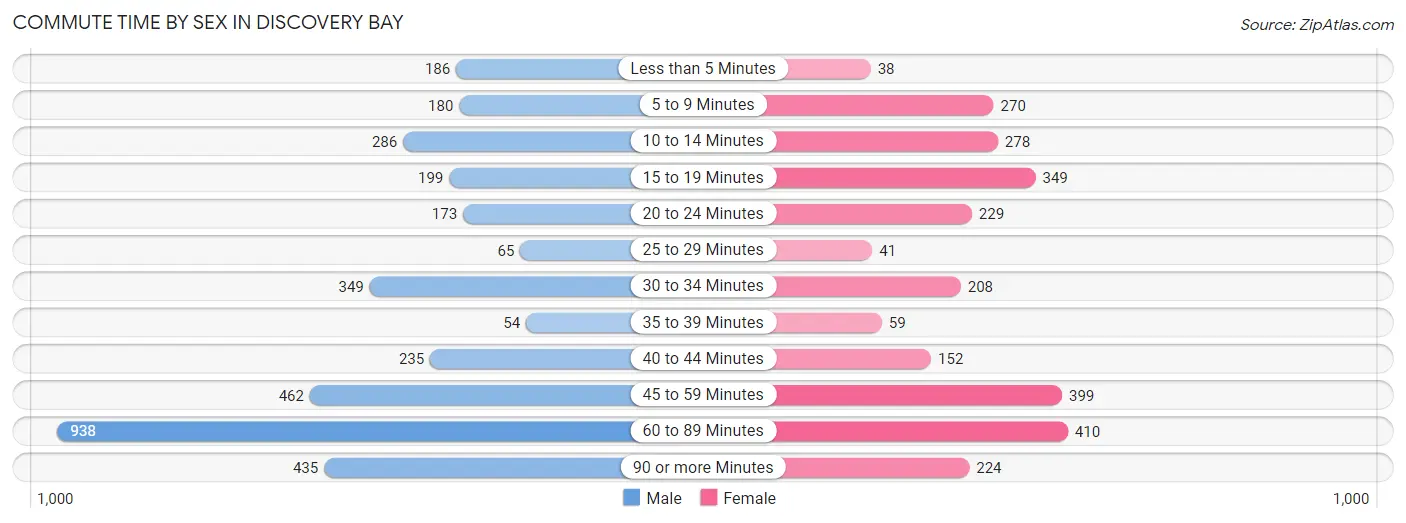
| Commute Time | Male | Female |
| Less than 5 Minutes | 186 (5.2%) | 38 (1.4%) |
| 5 to 9 Minutes | 180 (5.1%) | 270 (10.2%) |
| 10 to 14 Minutes | 286 (8.0%) | 278 (10.5%) |
| 15 to 19 Minutes | 199 (5.6%) | 349 (13.1%) |
| 20 to 24 Minutes | 173 (4.9%) | 229 (8.6%) |
| 25 to 29 Minutes | 65 (1.8%) | 41 (1.5%) |
| 30 to 34 Minutes | 349 (9.8%) | 208 (7.8%) |
| 35 to 39 Minutes | 54 (1.5%) | 59 (2.2%) |
| 40 to 44 Minutes | 235 (6.6%) | 152 (5.7%) |
| 45 to 59 Minutes | 462 (13.0%) | 399 (15.0%) |
| 60 to 89 Minutes | 938 (26.3%) | 410 (15.4%) |
| 90 or more Minutes | 435 (12.2%) | 224 (8.4%) |
Time of Departure to Work by Sex in Discovery Bay
The most frequent times of departure to work in Discovery Bay are 7:00 AM to 7:29 AM (497, 14.0%) for males and 7:00 AM to 7:29 AM (371, 14.0%) for females.
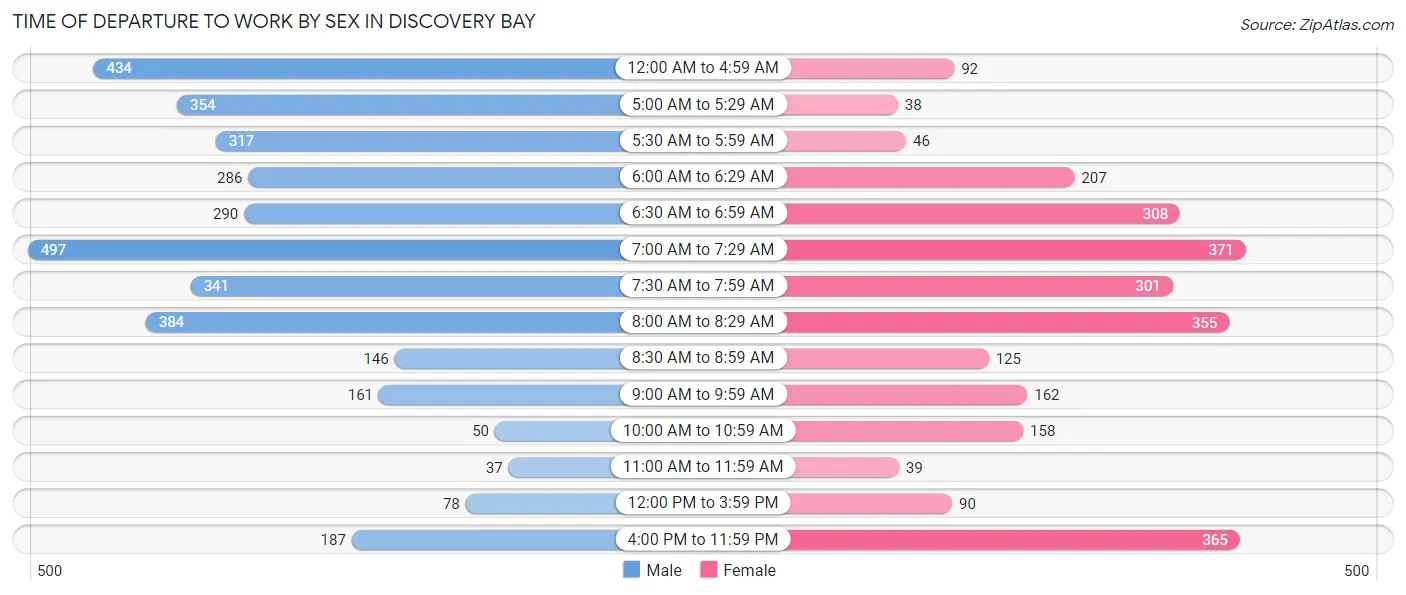
| Time of Departure | Male | Female |
| 12:00 AM to 4:59 AM | 434 (12.2%) | 92 (3.5%) |
| 5:00 AM to 5:29 AM | 354 (9.9%) | 38 (1.4%) |
| 5:30 AM to 5:59 AM | 317 (8.9%) | 46 (1.7%) |
| 6:00 AM to 6:29 AM | 286 (8.0%) | 207 (7.8%) |
| 6:30 AM to 6:59 AM | 290 (8.1%) | 308 (11.6%) |
| 7:00 AM to 7:29 AM | 497 (14.0%) | 371 (14.0%) |
| 7:30 AM to 7:59 AM | 341 (9.6%) | 301 (11.3%) |
| 8:00 AM to 8:29 AM | 384 (10.8%) | 355 (13.4%) |
| 8:30 AM to 8:59 AM | 146 (4.1%) | 125 (4.7%) |
| 9:00 AM to 9:59 AM | 161 (4.5%) | 162 (6.1%) |
| 10:00 AM to 10:59 AM | 50 (1.4%) | 158 (5.9%) |
| 11:00 AM to 11:59 AM | 37 (1.0%) | 39 (1.5%) |
| 12:00 PM to 3:59 PM | 78 (2.2%) | 90 (3.4%) |
| 4:00 PM to 11:59 PM | 187 (5.2%) | 365 (13.7%) |
| Total | 3,562 (100.0%) | 2,657 (100.0%) |
Housing Occupancy in Discovery Bay
Occupancy by Ownership in Discovery Bay
Of the total 5,451 dwellings in Discovery Bay, owner-occupied units account for 4,901 (89.9%), while renter-occupied units make up 550 (10.1%).
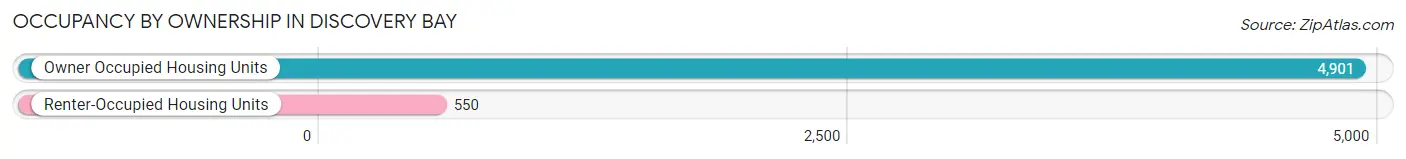
| Occupancy | # Housing Units | % Housing Units |
| Owner Occupied Housing Units | 4,901 | 89.9% |
| Renter-Occupied Housing Units | 550 | 10.1% |
| Total Occupied Housing Units | 5,451 | 100.0% |
Occupancy by Household Size in Discovery Bay
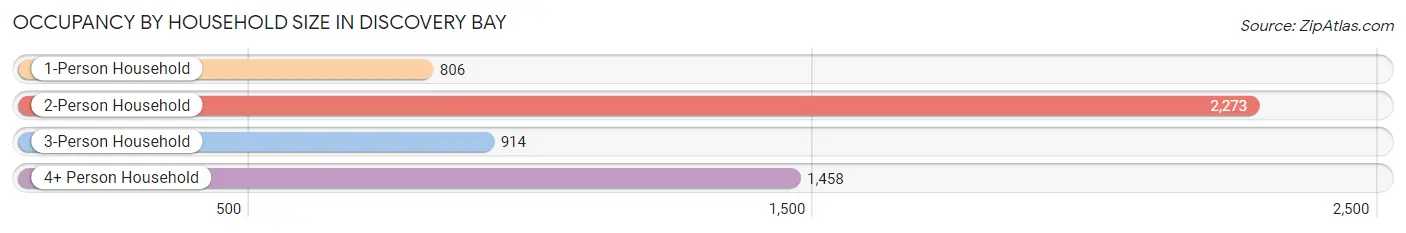
| Household Size | # Housing Units | % Housing Units |
| 1-Person Household | 806 | 14.8% |
| 2-Person Household | 2,273 | 41.7% |
| 3-Person Household | 914 | 16.8% |
| 4+ Person Household | 1,458 | 26.8% |
| Total Housing Units | 5,451 | 100.0% |
Occupancy by Ownership by Household Size in Discovery Bay
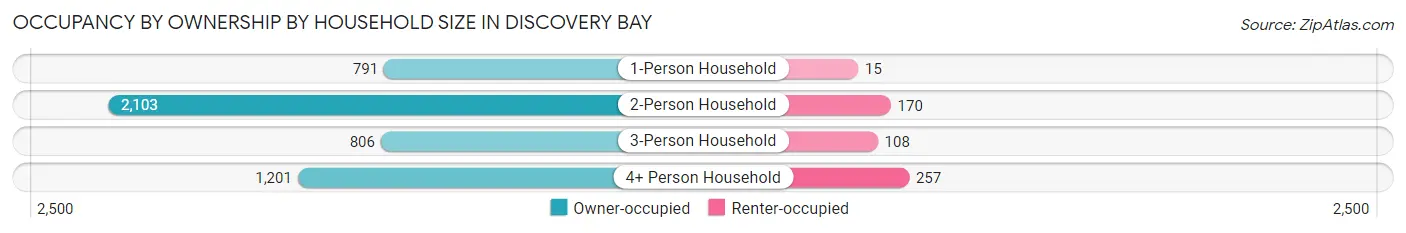
| Household Size | Owner-occupied | Renter-occupied |
| 1-Person Household | 791 (98.1%) | 15 (1.9%) |
| 2-Person Household | 2,103 (92.5%) | 170 (7.5%) |
| 3-Person Household | 806 (88.2%) | 108 (11.8%) |
| 4+ Person Household | 1,201 (82.4%) | 257 (17.6%) |
| Total Housing Units | 4,901 (89.9%) | 550 (10.1%) |
Occupancy by Educational Attainment in Discovery Bay
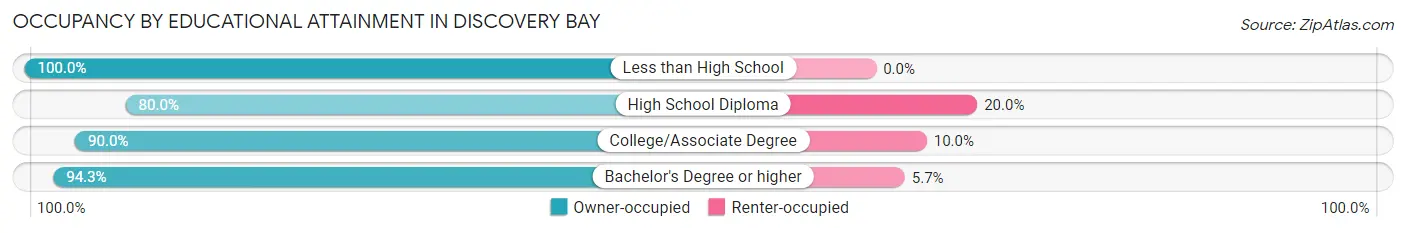
| Household Size | Owner-occupied | Renter-occupied |
| Less than High School | 108 (100.0%) | 0 (0.0%) |
| High School Diploma | 802 (80.0%) | 201 (20.0%) |
| College/Associate Degree | 2,117 (90.0%) | 236 (10.0%) |
| Bachelor's Degree or higher | 1,874 (94.3%) | 113 (5.7%) |
Occupancy by Age of Householder in Discovery Bay
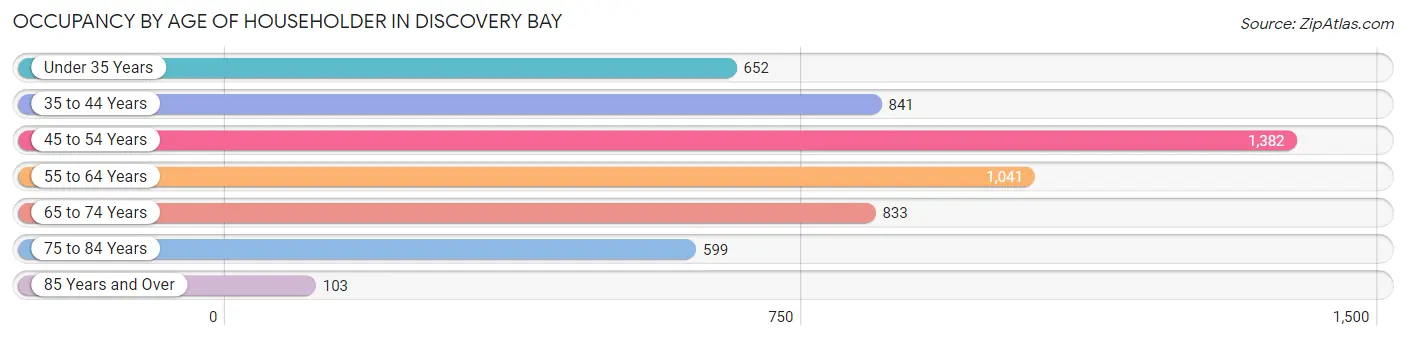
| Age Bracket | # Households | % Households |
| Under 35 Years | 652 | 12.0% |
| 35 to 44 Years | 841 | 15.4% |
| 45 to 54 Years | 1,382 | 25.4% |
| 55 to 64 Years | 1,041 | 19.1% |
| 65 to 74 Years | 833 | 15.3% |
| 75 to 84 Years | 599 | 11.0% |
| 85 Years and Over | 103 | 1.9% |
| Total | 5,451 | 100.0% |
Housing Finances in Discovery Bay
Median Income by Occupancy in Discovery Bay
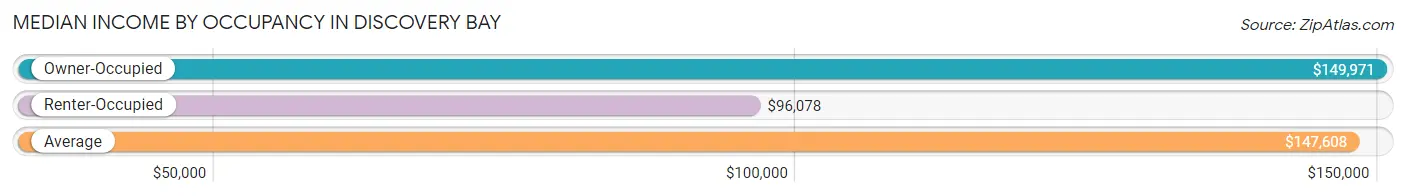
| Occupancy Type | # Households | Median Income |
| Owner-Occupied | 4,901 (89.9%) | $149,971 |
| Renter-Occupied | 550 (10.1%) | $96,078 |
| Average | 5,451 (100.0%) | $147,608 |
Occupancy by Householder Income Bracket in Discovery Bay
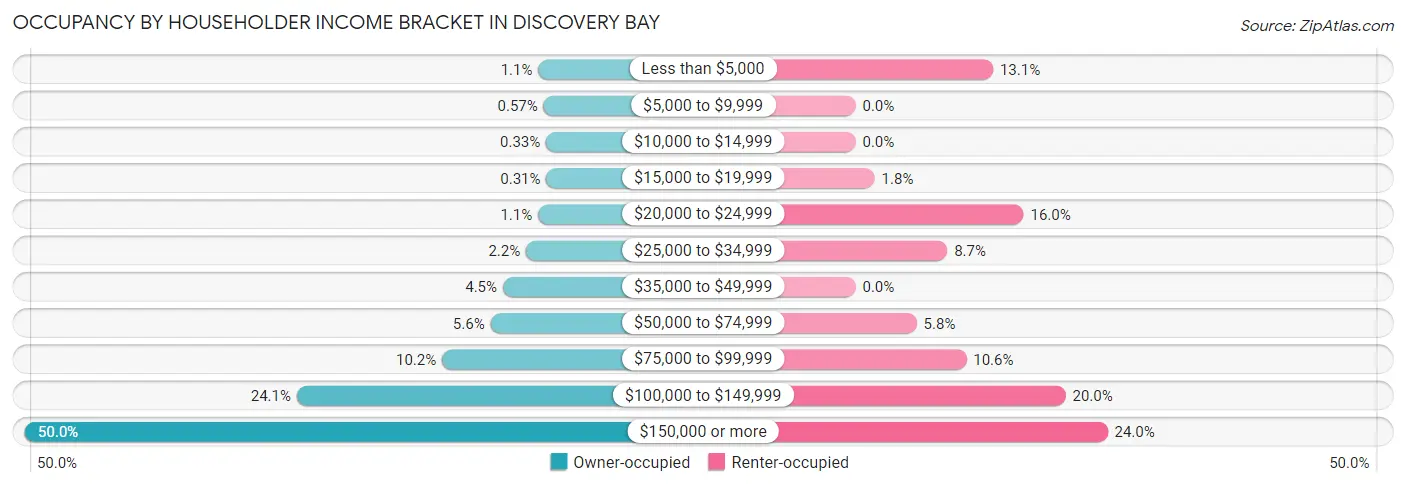
| Income Bracket | Owner-occupied | Renter-occupied |
| Less than $5,000 | 53 (1.1%) | 72 (13.1%) |
| $5,000 to $9,999 | 28 (0.6%) | 0 (0.0%) |
| $10,000 to $14,999 | 16 (0.3%) | 0 (0.0%) |
| $15,000 to $19,999 | 15 (0.3%) | 10 (1.8%) |
| $20,000 to $24,999 | 54 (1.1%) | 88 (16.0%) |
| $25,000 to $34,999 | 110 (2.2%) | 48 (8.7%) |
| $35,000 to $49,999 | 218 (4.4%) | 0 (0.0%) |
| $50,000 to $74,999 | 276 (5.6%) | 32 (5.8%) |
| $75,000 to $99,999 | 502 (10.2%) | 58 (10.5%) |
| $100,000 to $149,999 | 1,180 (24.1%) | 110 (20.0%) |
| $150,000 or more | 2,449 (50.0%) | 132 (24.0%) |
| Total | 4,901 (100.0%) | 550 (100.0%) |
Monthly Housing Cost Tiers in Discovery Bay
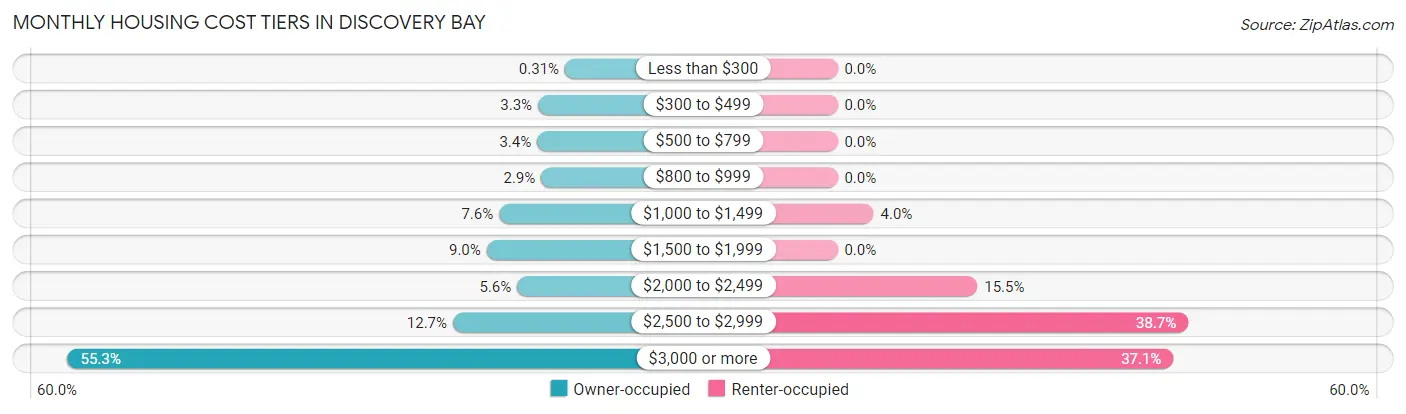
| Monthly Cost | Owner-occupied | Renter-occupied |
| Less than $300 | 15 (0.3%) | 0 (0.0%) |
| $300 to $499 | 161 (3.3%) | 0 (0.0%) |
| $500 to $799 | 166 (3.4%) | 0 (0.0%) |
| $800 to $999 | 144 (2.9%) | 0 (0.0%) |
| $1,000 to $1,499 | 372 (7.6%) | 22 (4.0%) |
| $1,500 to $1,999 | 439 (9.0%) | 0 (0.0%) |
| $2,000 to $2,499 | 274 (5.6%) | 85 (15.4%) |
| $2,500 to $2,999 | 622 (12.7%) | 213 (38.7%) |
| $3,000 or more | 2,708 (55.2%) | 204 (37.1%) |
| Total | 4,901 (100.0%) | 550 (100.0%) |
Physical Housing Characteristics in Discovery Bay
Housing Structures in Discovery Bay
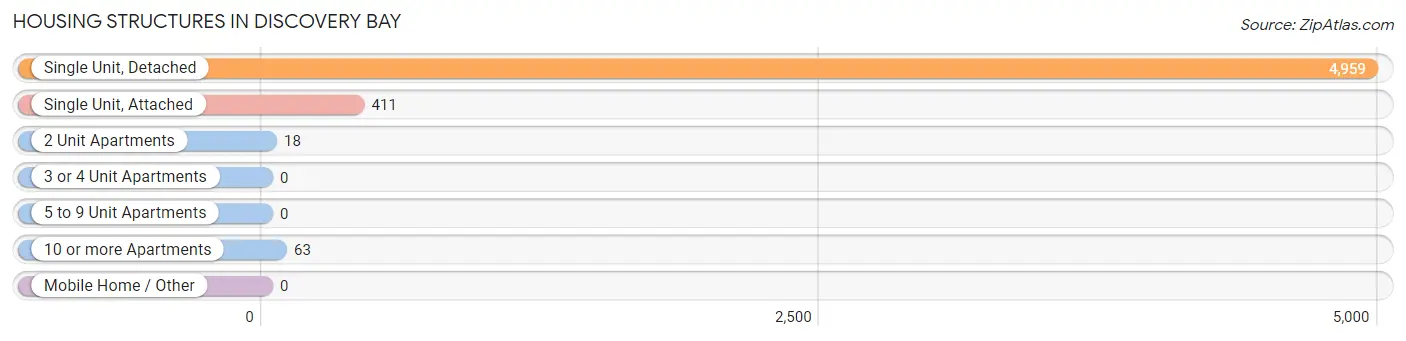
| Structure Type | # Housing Units | % Housing Units |
| Single Unit, Detached | 4,959 | 91.0% |
| Single Unit, Attached | 411 | 7.5% |
| 2 Unit Apartments | 18 | 0.3% |
| 3 or 4 Unit Apartments | 0 | 0.0% |
| 5 to 9 Unit Apartments | 0 | 0.0% |
| 10 or more Apartments | 63 | 1.2% |
| Mobile Home / Other | 0 | 0.0% |
| Total | 5,451 | 100.0% |
Housing Structures by Occupancy in Discovery Bay
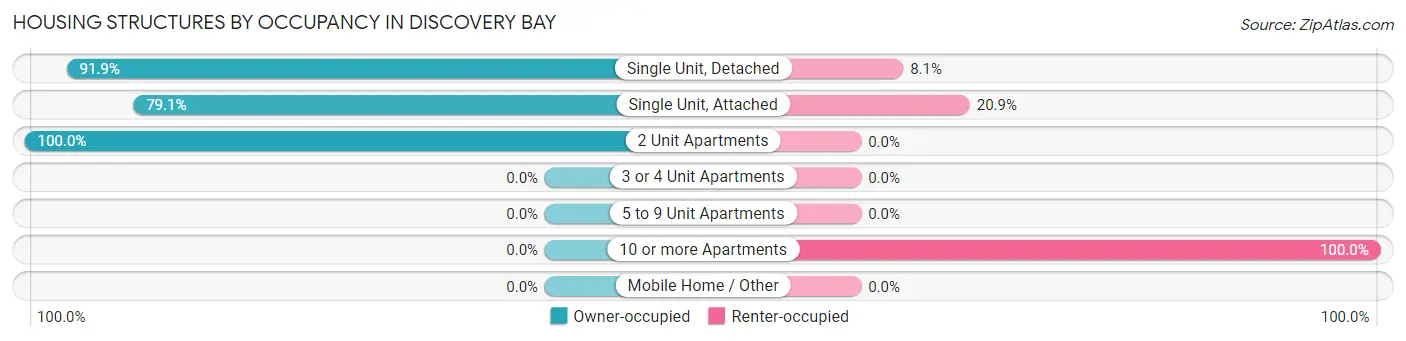
| Structure Type | Owner-occupied | Renter-occupied |
| Single Unit, Detached | 4,558 (91.9%) | 401 (8.1%) |
| Single Unit, Attached | 325 (79.1%) | 86 (20.9%) |
| 2 Unit Apartments | 18 (100.0%) | 0 (0.0%) |
| 3 or 4 Unit Apartments | 0 (0.0%) | 0 (0.0%) |
| 5 to 9 Unit Apartments | 0 (0.0%) | 0 (0.0%) |
| 10 or more Apartments | 0 (0.0%) | 63 (100.0%) |
| Mobile Home / Other | 0 (0.0%) | 0 (0.0%) |
| Total | 4,901 (89.9%) | 550 (10.1%) |
Housing Structures by Number of Rooms in Discovery Bay
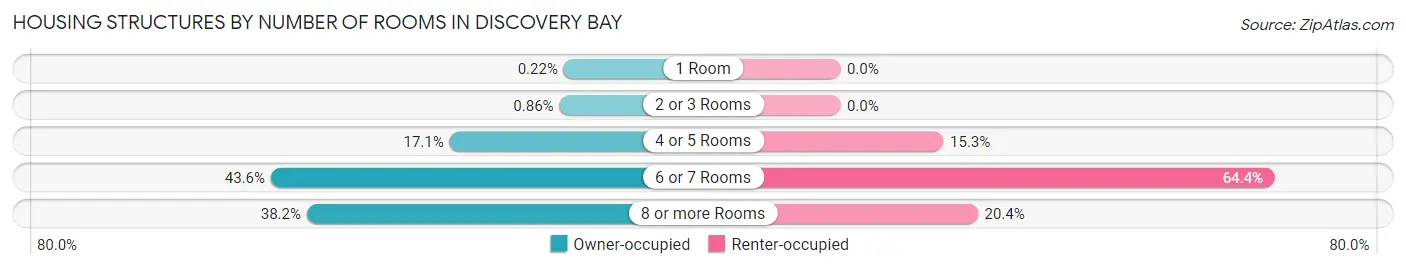
| Number of Rooms | Owner-occupied | Renter-occupied |
| 1 Room | 11 (0.2%) | 0 (0.0%) |
| 2 or 3 Rooms | 42 (0.9%) | 0 (0.0%) |
| 4 or 5 Rooms | 839 (17.1%) | 84 (15.3%) |
| 6 or 7 Rooms | 2,135 (43.6%) | 354 (64.4%) |
| 8 or more Rooms | 1,874 (38.2%) | 112 (20.4%) |
| Total | 4,901 (100.0%) | 550 (100.0%) |
Housing Structure by Heating Type in Discovery Bay
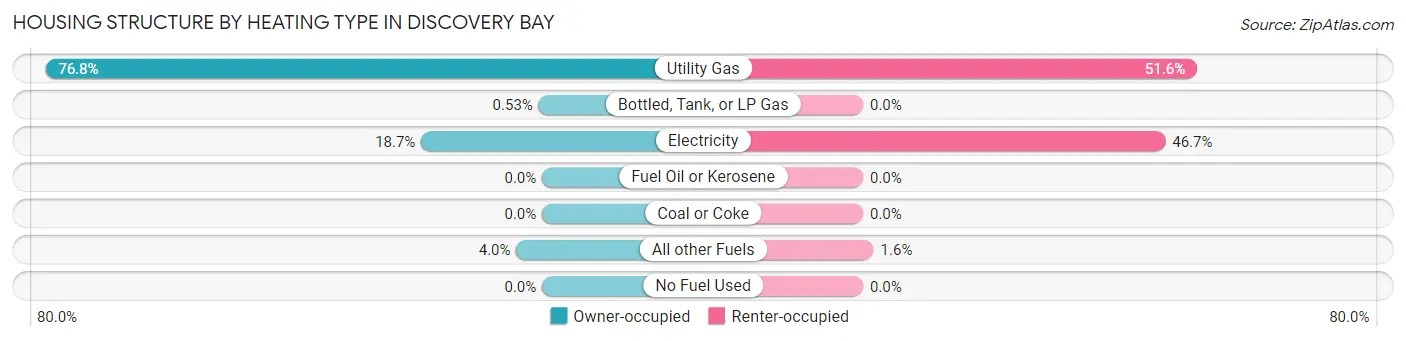
| Heating Type | Owner-occupied | Renter-occupied |
| Utility Gas | 3,764 (76.8%) | 284 (51.6%) |
| Bottled, Tank, or LP Gas | 26 (0.5%) | 0 (0.0%) |
| Electricity | 916 (18.7%) | 257 (46.7%) |
| Fuel Oil or Kerosene | 0 (0.0%) | 0 (0.0%) |
| Coal or Coke | 0 (0.0%) | 0 (0.0%) |
| All other Fuels | 195 (4.0%) | 9 (1.6%) |
| No Fuel Used | 0 (0.0%) | 0 (0.0%) |
| Total | 4,901 (100.0%) | 550 (100.0%) |
Household Vehicle Usage in Discovery Bay
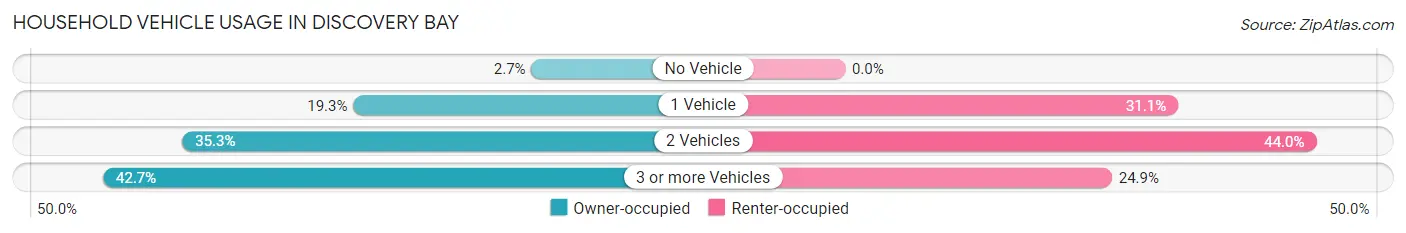
| Vehicles per Household | Owner-occupied | Renter-occupied |
| No Vehicle | 132 (2.7%) | 0 (0.0%) |
| 1 Vehicle | 947 (19.3%) | 171 (31.1%) |
| 2 Vehicles | 1,730 (35.3%) | 242 (44.0%) |
| 3 or more Vehicles | 2,092 (42.7%) | 137 (24.9%) |
| Total | 4,901 (100.0%) | 550 (100.0%) |
Real Estate & Mortgages in Discovery Bay
Real Estate and Mortgage Overview in Discovery Bay
| Characteristic | Without Mortgage | With Mortgage |
| Housing Units | 997 | 3,904 |
| Median Property Value | $717,800 | $783,000 |
| Median Household Income | $126,607 | $2,101 |
| Monthly Housing Costs | $1,021 | $2,708 |
| Real Estate Taxes | $7,212 | $16 |
Property Value by Mortgage Status in Discovery Bay
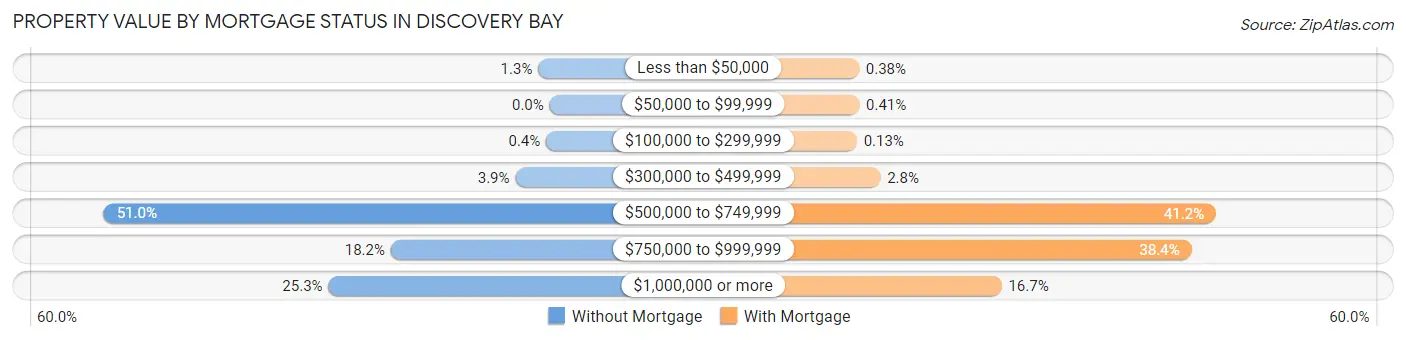
| Property Value | Without Mortgage | With Mortgage |
| Less than $50,000 | 13 (1.3%) | 15 (0.4%) |
| $50,000 to $99,999 | 0 (0.0%) | 16 (0.4%) |
| $100,000 to $299,999 | 4 (0.4%) | 5 (0.1%) |
| $300,000 to $499,999 | 39 (3.9%) | 110 (2.8%) |
| $500,000 to $749,999 | 508 (50.9%) | 1,608 (41.2%) |
| $750,000 to $999,999 | 181 (18.1%) | 1,499 (38.4%) |
| $1,000,000 or more | 252 (25.3%) | 651 (16.7%) |
| Total | 997 (100.0%) | 3,904 (100.0%) |
Household Income by Mortgage Status in Discovery Bay
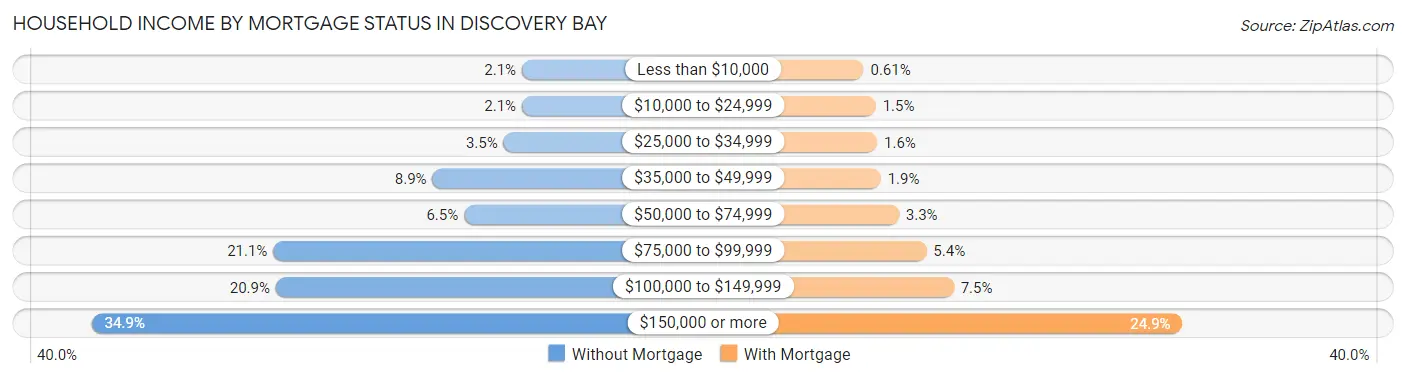
| Household Income | Without Mortgage | With Mortgage |
| Less than $10,000 | 21 (2.1%) | 24 (0.6%) |
| $10,000 to $24,999 | 21 (2.1%) | 60 (1.5%) |
| $25,000 to $34,999 | 35 (3.5%) | 64 (1.6%) |
| $35,000 to $49,999 | 89 (8.9%) | 75 (1.9%) |
| $50,000 to $74,999 | 65 (6.5%) | 129 (3.3%) |
| $75,000 to $99,999 | 210 (21.1%) | 211 (5.4%) |
| $100,000 to $149,999 | 208 (20.9%) | 292 (7.5%) |
| $150,000 or more | 348 (34.9%) | 972 (24.9%) |
| Total | 997 (100.0%) | 3,904 (100.0%) |
Property Value to Household Income Ratio in Discovery Bay
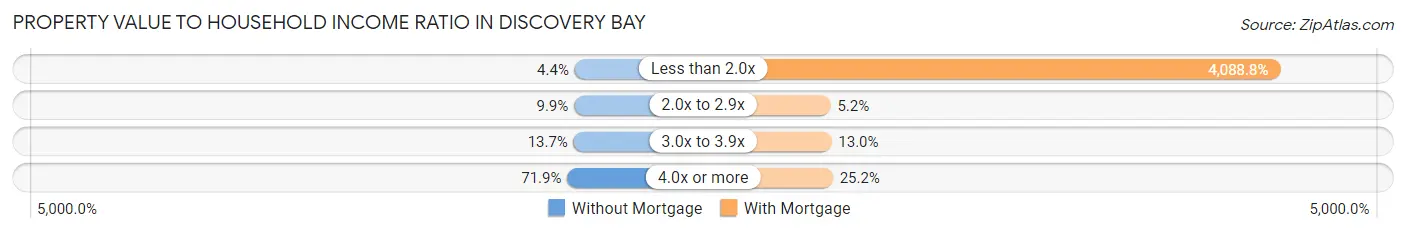
| Value-to-Income Ratio | Without Mortgage | With Mortgage |
| Less than 2.0x | 44 (4.4%) | 159,625 (4,088.8%) |
| 2.0x to 2.9x | 99 (9.9%) | 203 (5.2%) |
| 3.0x to 3.9x | 137 (13.7%) | 507 (13.0%) |
| 4.0x or more | 717 (71.9%) | 985 (25.2%) |
| Total | 997 (100.0%) | 3,904 (100.0%) |
Real Estate Taxes by Mortgage Status in Discovery Bay
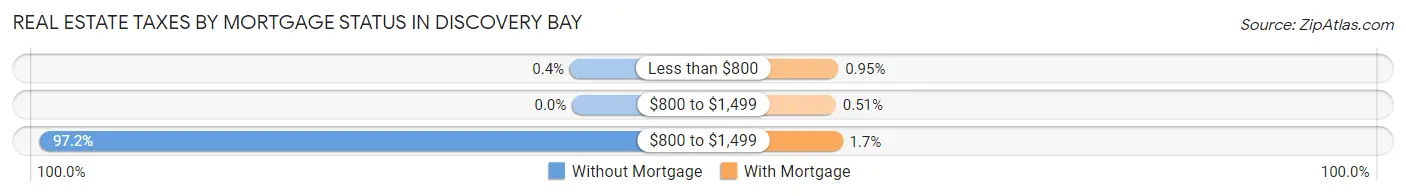
| Property Taxes | Without Mortgage | With Mortgage |
| Less than $800 | 4 (0.4%) | 37 (0.9%) |
| $800 to $1,499 | 0 (0.0%) | 20 (0.5%) |
| $800 to $1,499 | 969 (97.2%) | 67 (1.7%) |
| Total | 997 (100.0%) | 3,904 (100.0%) |
Health & Disability in Discovery Bay
Health Insurance Coverage by Age in Discovery Bay
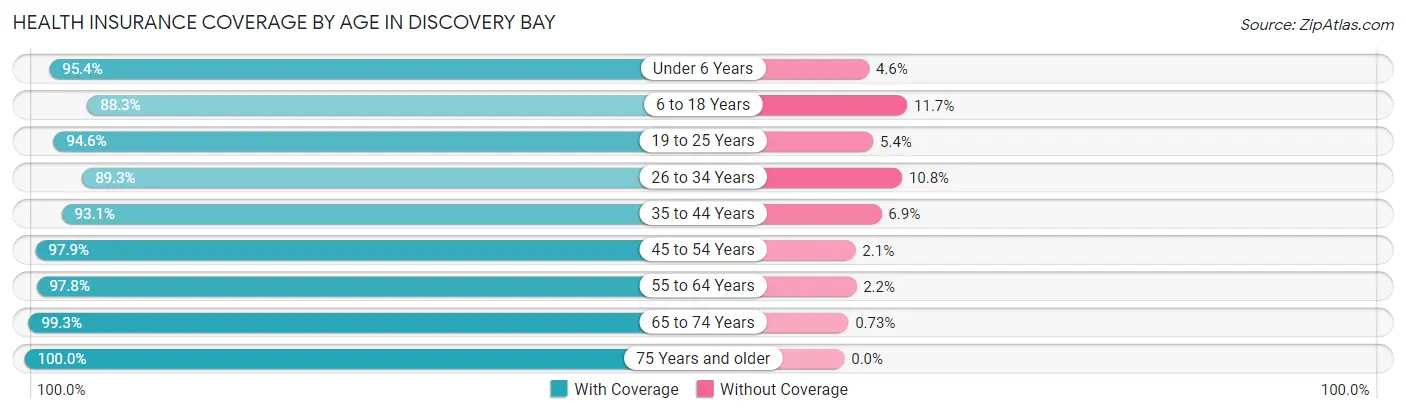
| Age Bracket | With Coverage | Without Coverage |
| Under 6 Years | 1,034 (95.4%) | 50 (4.6%) |
| 6 to 18 Years | 2,263 (88.3%) | 300 (11.7%) |
| 19 to 25 Years | 1,092 (94.6%) | 62 (5.4%) |
| 26 to 34 Years | 1,412 (89.2%) | 170 (10.7%) |
| 35 to 44 Years | 1,440 (93.1%) | 107 (6.9%) |
| 45 to 54 Years | 2,465 (97.9%) | 52 (2.1%) |
| 55 to 64 Years | 2,159 (97.8%) | 49 (2.2%) |
| 65 to 74 Years | 1,488 (99.3%) | 11 (0.7%) |
| 75 Years and older | 1,208 (100.0%) | 0 (0.0%) |
| Total | 14,561 (94.8%) | 801 (5.2%) |
Health Insurance Coverage by Citizenship Status in Discovery Bay
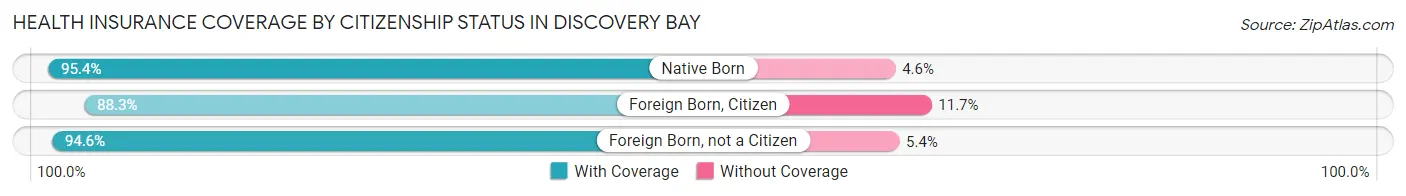
| Citizenship Status | With Coverage | Without Coverage |
| Native Born | 1,034 (95.4%) | 50 (4.6%) |
| Foreign Born, Citizen | 2,263 (88.3%) | 300 (11.7%) |
| Foreign Born, not a Citizen | 1,092 (94.6%) | 62 (5.4%) |
Health Insurance Coverage by Household Income in Discovery Bay
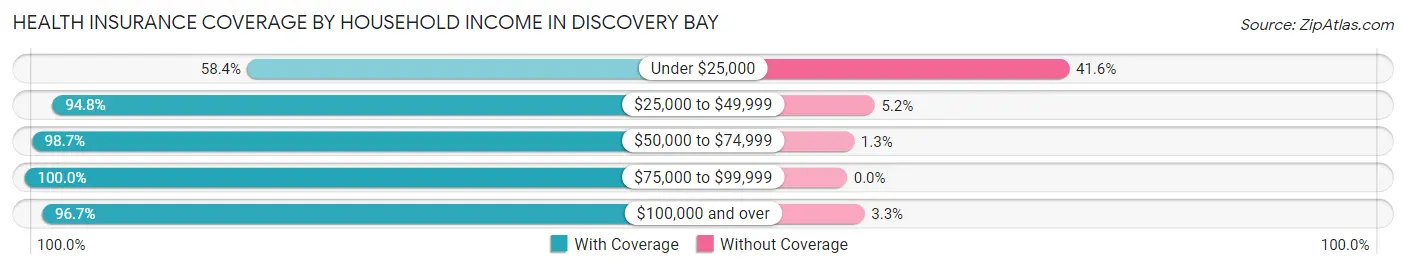
| Household Income | With Coverage | Without Coverage |
| Under $25,000 | 520 (58.4%) | 371 (41.6%) |
| $25,000 to $49,999 | 639 (94.8%) | 35 (5.2%) |
| $50,000 to $74,999 | 592 (98.7%) | 8 (1.3%) |
| $75,000 to $99,999 | 1,369 (100.0%) | 0 (0.0%) |
| $100,000 and over | 11,388 (96.7%) | 387 (3.3%) |
Public vs Private Health Insurance Coverage by Age in Discovery Bay
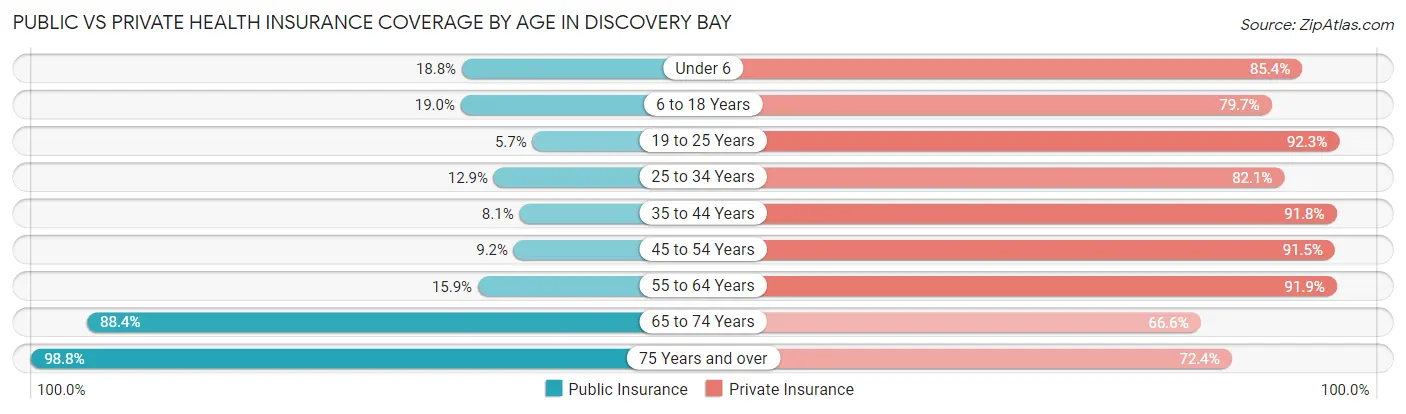
| Age Bracket | Public Insurance | Private Insurance |
| Under 6 | 204 (18.8%) | 926 (85.4%) |
| 6 to 18 Years | 488 (19.0%) | 2,043 (79.7%) |
| 19 to 25 Years | 66 (5.7%) | 1,065 (92.3%) |
| 25 to 34 Years | 204 (12.9%) | 1,299 (82.1%) |
| 35 to 44 Years | 126 (8.1%) | 1,420 (91.8%) |
| 45 to 54 Years | 231 (9.2%) | 2,303 (91.5%) |
| 55 to 64 Years | 350 (15.9%) | 2,028 (91.8%) |
| 65 to 74 Years | 1,325 (88.4%) | 998 (66.6%) |
| 75 Years and over | 1,193 (98.8%) | 874 (72.4%) |
| Total | 4,187 (27.3%) | 12,956 (84.3%) |
Disability Status by Sex by Age in Discovery Bay
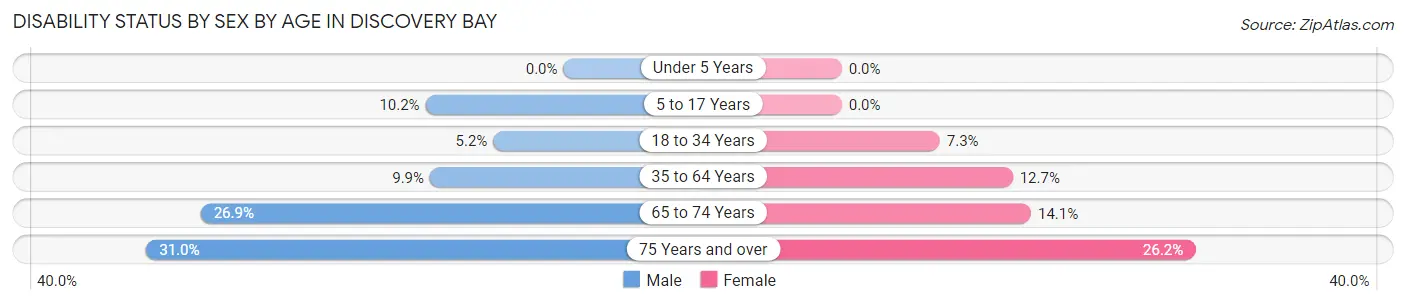
| Age Bracket | Male | Female |
| Under 5 Years | 0 (0.0%) | 0 (0.0%) |
| 5 to 17 Years | 123 (10.2%) | 0 (0.0%) |
| 18 to 34 Years | 74 (5.2%) | 114 (7.3%) |
| 35 to 64 Years | 306 (9.9%) | 404 (12.7%) |
| 65 to 74 Years | 189 (26.9%) | 112 (14.1%) |
| 75 Years and over | 191 (31.0%) | 155 (26.2%) |
Disability Class by Sex by Age in Discovery Bay
Disability Class: Hearing Difficulty
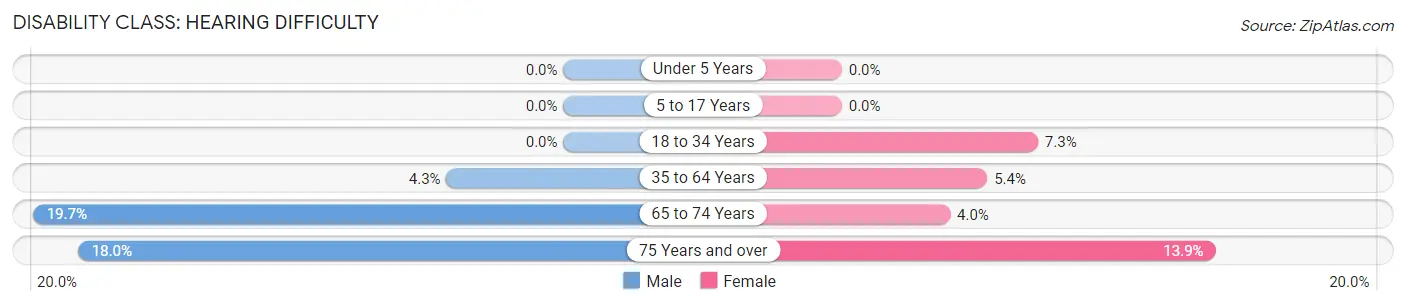
| Age Bracket | Male | Female |
| Under 5 Years | 0 (0.0%) | 0 (0.0%) |
| 5 to 17 Years | 0 (0.0%) | 0 (0.0%) |
| 18 to 34 Years | 0 (0.0%) | 114 (7.3%) |
| 35 to 64 Years | 134 (4.3%) | 172 (5.4%) |
| 65 to 74 Years | 138 (19.7%) | 32 (4.0%) |
| 75 Years and over | 111 (18.0%) | 82 (13.9%) |
Disability Class: Vision Difficulty
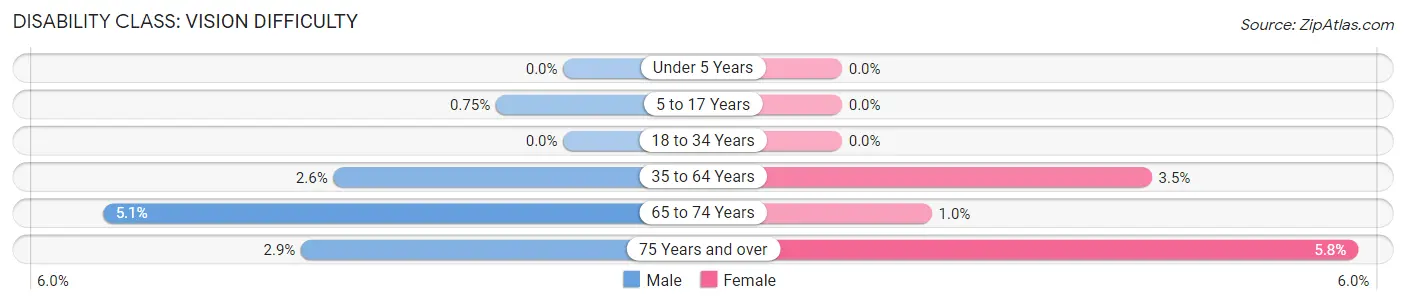
| Age Bracket | Male | Female |
| Under 5 Years | 0 (0.0%) | 0 (0.0%) |
| 5 to 17 Years | 9 (0.7%) | 0 (0.0%) |
| 18 to 34 Years | 0 (0.0%) | 0 (0.0%) |
| 35 to 64 Years | 79 (2.6%) | 110 (3.5%) |
| 65 to 74 Years | 36 (5.1%) | 8 (1.0%) |
| 75 Years and over | 18 (2.9%) | 34 (5.8%) |
Disability Class: Cognitive Difficulty
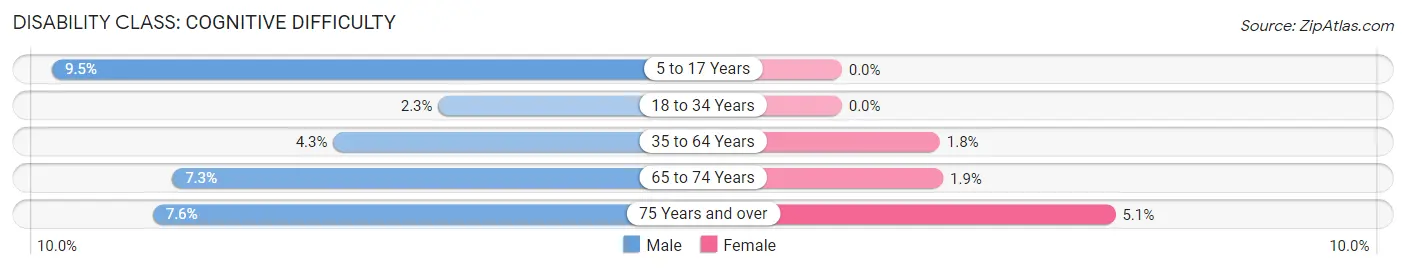
| Age Bracket | Male | Female |
| 5 to 17 Years | 114 (9.5%) | 0 (0.0%) |
| 18 to 34 Years | 33 (2.3%) | 0 (0.0%) |
| 35 to 64 Years | 132 (4.3%) | 58 (1.8%) |
| 65 to 74 Years | 51 (7.3%) | 15 (1.9%) |
| 75 Years and over | 47 (7.6%) | 30 (5.1%) |
Disability Class: Ambulatory Difficulty
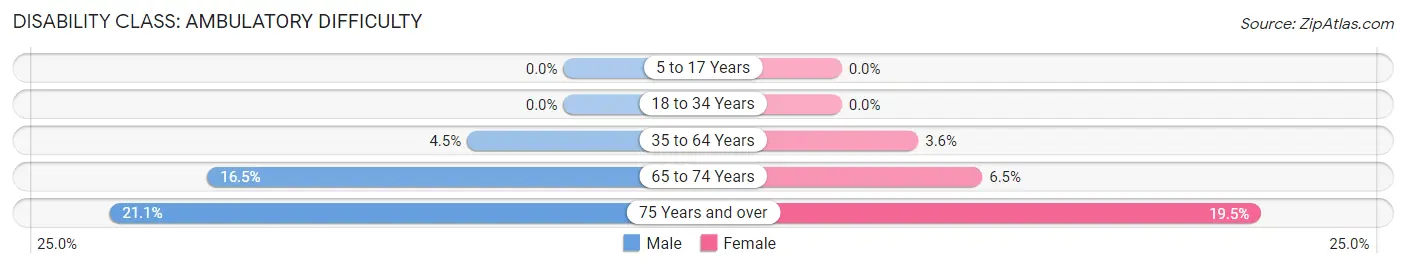
| Age Bracket | Male | Female |
| 5 to 17 Years | 0 (0.0%) | 0 (0.0%) |
| 18 to 34 Years | 0 (0.0%) | 0 (0.0%) |
| 35 to 64 Years | 138 (4.5%) | 113 (3.5%) |
| 65 to 74 Years | 116 (16.5%) | 52 (6.5%) |
| 75 Years and over | 130 (21.1%) | 115 (19.5%) |
Disability Class: Self-Care Difficulty
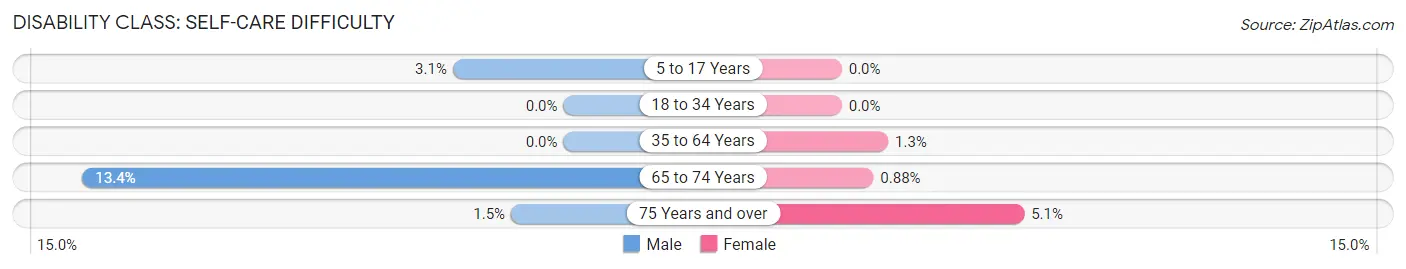
| Age Bracket | Male | Female |
| 5 to 17 Years | 37 (3.1%) | 0 (0.0%) |
| 18 to 34 Years | 0 (0.0%) | 0 (0.0%) |
| 35 to 64 Years | 0 (0.0%) | 41 (1.3%) |
| 65 to 74 Years | 94 (13.4%) | 7 (0.9%) |
| 75 Years and over | 9 (1.5%) | 30 (5.1%) |
Technology Access in Discovery Bay
Computing Device Access in Discovery Bay
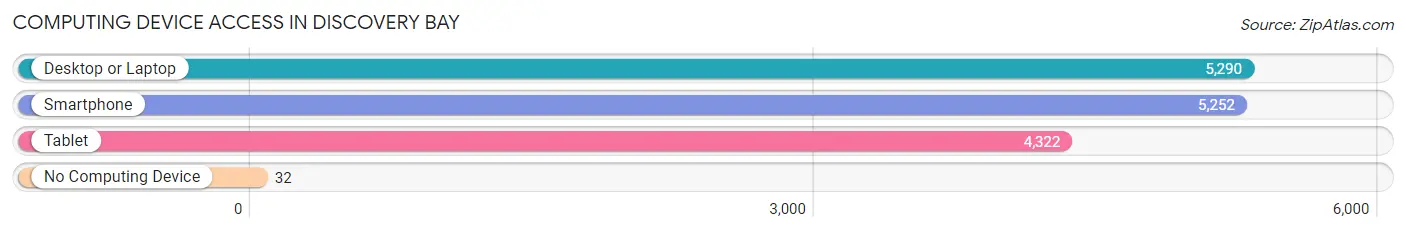
| Device Type | # Households | % Households |
| Desktop or Laptop | 5,290 | 97.1% |
| Smartphone | 5,252 | 96.4% |
| Tablet | 4,322 | 79.3% |
| No Computing Device | 32 | 0.6% |
| Total | 5,451 | 100.0% |
Internet Access in Discovery Bay
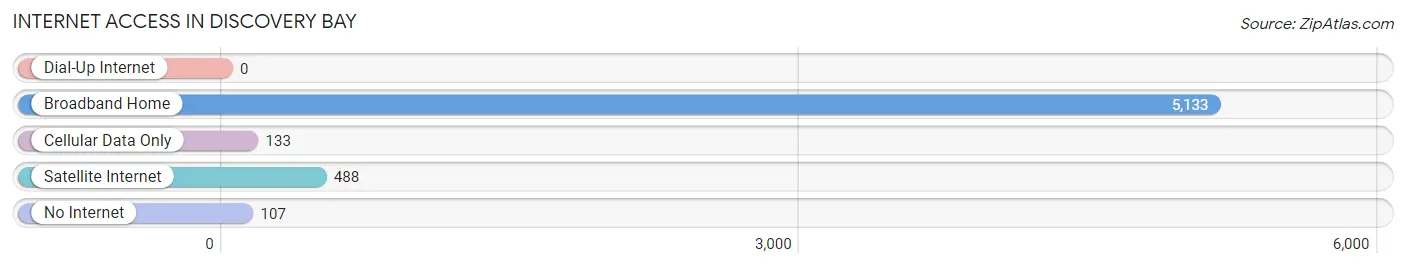
| Internet Type | # Households | % Households |
| Dial-Up Internet | 0 | 0.0% |
| Broadband Home | 5,133 | 94.2% |
| Cellular Data Only | 133 | 2.4% |
| Satellite Internet | 488 | 8.9% |
| No Internet | 107 | 2.0% |
| Total | 5,451 | 100.0% |
Discovery Bay Summary
Discovery Bay is a census-designated place (CDP) located in eastern Contra Costa County, California, United States. It is located in the San Francisco Bay Area, about 60 miles east of San Francisco. The population was 13,352 at the 2010 census.
History
Discovery Bay was originally part of the Rancho Boronda Mexican land grant of 1834. It was named after the Discovery Bay post office, which was established in 1853. The town was founded in 1855 by Dr. Robert Semple, who named it after the bay he discovered.
The town was incorporated in 1874 and was the first incorporated town in Contra Costa County. It was a popular resort town in the late 19th and early 20th centuries, with many visitors coming to enjoy the area's natural beauty.
Geography
Discovery Bay is located at 38°02′09″N 121°45′17″W (38.0358, -121.7547). It is situated on the east side of the San Francisco Bay, approximately 60 miles east of San Francisco. It is bordered by the cities of Brentwood to the north, Oakley to the east, and Byron to the south.
The town is located on the eastern shore of the San Francisco Bay, and is surrounded by rolling hills and valleys. The town is located in the Central Valley, and is part of the East Bay region.
Economy
Discovery Bay is primarily a residential community, with a small commercial district. The town is home to a variety of businesses, including restaurants, retail stores, and professional services.
The town is also home to a number of marinas, which provide access to the San Francisco Bay. The marinas are popular with boaters, and provide a variety of services, including boat rentals, boat repair, and boat storage.
Demographics
As of the 2010 census, there were 13,352 people, 4,845 households, and 3,845 families residing in the CDP. The population density was 1,837.3 people per square mile (710.7/km2). There were 5,068 housing units at an average density of 690.9 per square mile (267.2/km2). The racial makeup of the CDP was 79.2% White, 5.2% African American, 0.7% Native American, 8.3% Asian, 0.3% Pacific Islander, 3.2% from other races, and 3.2% from two or more races. Hispanic or Latino of any race were 11.3% of the population.
The median income for a household in the CDP was $90,917, and the median income for a family was $103,917. Males had a median income of $76,917 versus $50,917 for females. The per capita income for the CDP was $41,917. About 2.7% of families and 3.7% of the population were below the poverty line, including 4.3% of those under age 18 and 4.2% of those age 65 or over.
Common Questions
What is Per Capita Income in Discovery Bay?
Per Capita income in Discovery Bay is $62,369.
What is the Median Family Income in Discovery Bay?
Median Family Income in Discovery Bay is $147,623.
What is the Median Household income in Discovery Bay?
Median Household Income in Discovery Bay is $147,608.
What is Income or Wage Gap in Discovery Bay?
Income or Wage Gap in Discovery Bay is 34.0%.
Women in Discovery Bay earn 66.0 cents for every dollar earned by a man.
What is Inequality or Gini Index in Discovery Bay?
Inequality or Gini Index in Discovery Bay is 0.38.
What is the Total Population of Discovery Bay?
Total Population of Discovery Bay is 15,362.
What is the Total Male Population of Discovery Bay?
Total Male Population of Discovery Bay is 7,714.
What is the Total Female Population of Discovery Bay?
Total Female Population of Discovery Bay is 7,648.
What is the Ratio of Males per 100 Females in Discovery Bay?
There are 100.86 Males per 100 Females in Discovery Bay.
What is the Ratio of Females per 100 Males in Discovery Bay?
There are 99.14 Females per 100 Males in Discovery Bay.
What is the Median Population Age in Discovery Bay?
Median Population Age in Discovery Bay is 43.9 Years.
What is the Average Family Size in Discovery Bay
Average Family Size in Discovery Bay is 3.1 People.
What is the Average Household Size in Discovery Bay
Average Household Size in Discovery Bay is 2.8 People.
How Large is the Labor Force in Discovery Bay?
There are 7,864 People in the Labor Forcein in Discovery Bay.
What is the Percentage of People in the Labor Force in Discovery Bay?
62.5% of People are in the Labor Force in Discovery Bay.
What is the Unemployment Rate in Discovery Bay?
Unemployment Rate in Discovery Bay is 5.4%.