Cities with the Lowest Poverty Level Among Seniors Over the Age of 75 in Virginia
RELATED REPORTS & OPTIONS
Lowest Poverty | Seniors 75+
Virginia
Compare Cities
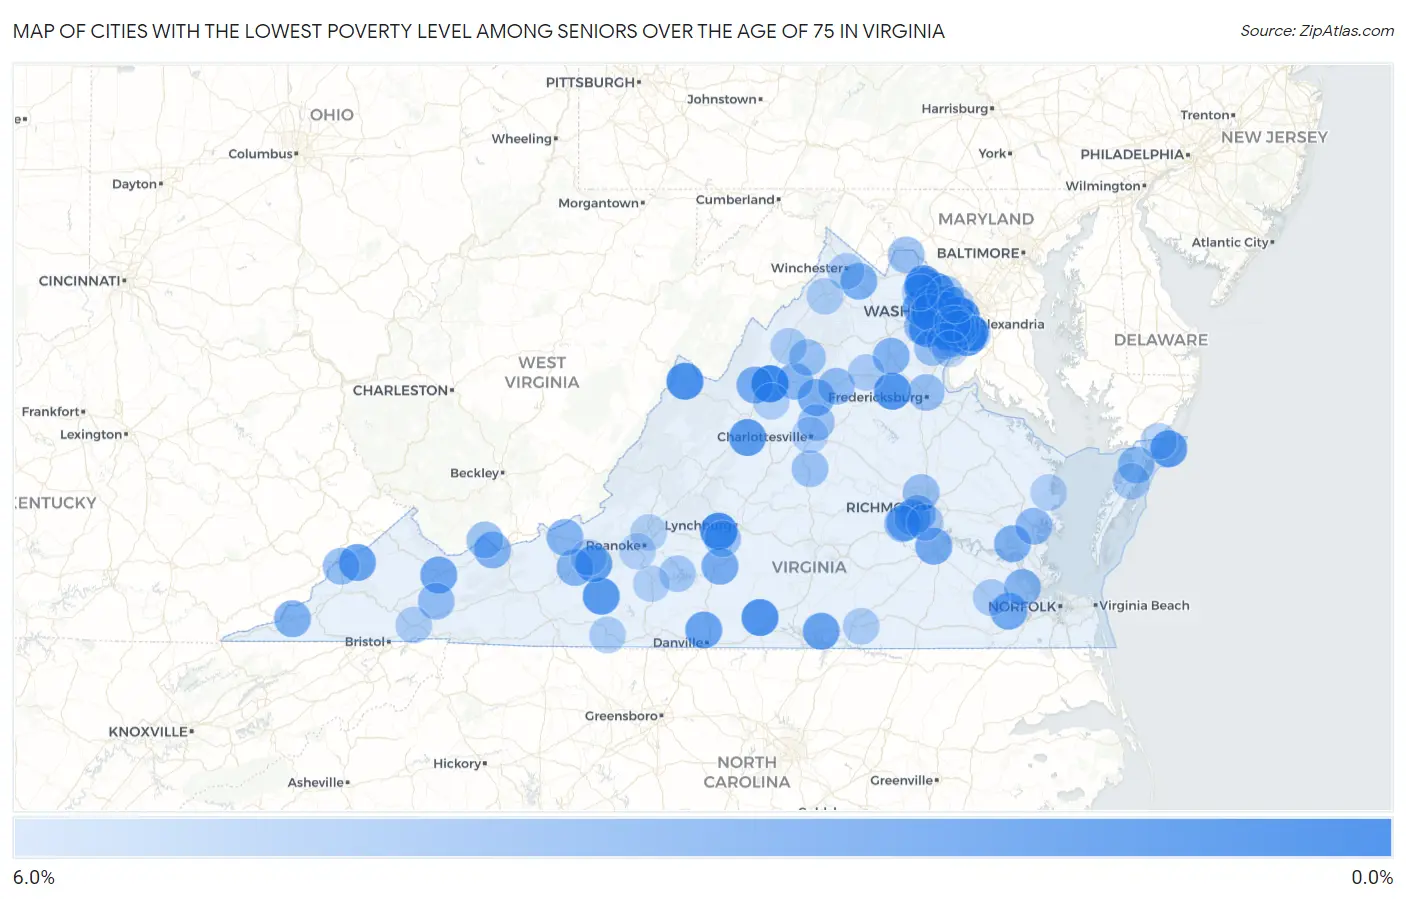
Map of Cities with the Lowest Poverty Level Among Seniors Over the Age of 75 in Virginia
6.0%
0.0%
Cities with the Lowest Poverty Level Among Seniors Over the Age of 75 in Virginia
| City | Senior Poverty | vs State | vs National | |
| 1. | Braddock | 0.26% | 9.2%(-8.93)#1 | 11.1%(-10.8)#19 |
| 2. | Massanetta Springs | 0.46% | 9.2%(-8.74)#2 | 11.1%(-10.6)#47 |
| 3. | Lake Barcroft | 0.63% | 9.2%(-8.56)#3 | 11.1%(-10.4)#72 |
| 4. | Forest | 0.89% | 9.2%(-8.31)#4 | 11.1%(-10.2)#122 |
| 5. | Monterey | 1.2% | 9.2%(-7.98)#5 | 11.1%(-9.85)#190 |
| 6. | South Run | 1.3% | 9.2%(-7.88)#6 | 11.1%(-9.75)#222 |
| 7. | Fairfax Station | 1.3% | 9.2%(-7.86)#7 | 11.1%(-9.74)#231 |
| 8. | Halifax | 1.4% | 9.2%(-7.81)#8 | 11.1%(-9.68)#252 |
| 9. | Mount Vernon | 1.4% | 9.2%(-7.78)#9 | 11.1%(-9.65)#263 |
| 10. | Difficult Run | 1.4% | 9.2%(-7.77)#10 | 11.1%(-9.64)#266 |
| 11. | Hybla Valley | 1.5% | 9.2%(-7.70)#11 | 11.1%(-9.57)#289 |
| 12. | Lake Of The Woods | 1.5% | 9.2%(-7.70)#12 | 11.1%(-9.57)#293 |
| 13. | Belmont | 1.5% | 9.2%(-7.66)#13 | 11.1%(-9.53)#307 |
| 14. | Sugarland Run | 1.6% | 9.2%(-7.61)#14 | 11.1%(-9.48)#332 |
| 15. | Manassas Park | 1.6% | 9.2%(-7.57)#15 | 11.1%(-9.44)#351 |
| 16. | Floyd | 1.7% | 9.2%(-7.50)#16 | 11.1%(-9.37)#383 |
| 17. | South Riding | 1.9% | 9.2%(-7.33)#17 | 11.1%(-9.20)#459 |
| 18. | Stuarts Draft | 1.9% | 9.2%(-7.28)#18 | 11.1%(-9.15)#476 |
| 19. | Lansdowne | 2.0% | 9.2%(-7.21)#19 | 11.1%(-9.08)#512 |
| 20. | Chincoteague | 2.0% | 9.2%(-7.20)#20 | 11.1%(-9.07)#515 |
| 21. | Christiansburg | 2.1% | 9.2%(-7.11)#21 | 11.1%(-8.98)#584 |
| 22. | Mcnair | 2.2% | 9.2%(-7.03)#22 | 11.1%(-8.90)#629 |
| 23. | Franklin Farm | 2.2% | 9.2%(-7.02)#23 | 11.1%(-8.89)#645 |
| 24. | Woodlawn Cdp Fairfax County | 2.3% | 9.2%(-6.89)#24 | 11.1%(-8.76)#725 |
| 25. | Clintwood | 2.3% | 9.2%(-6.87)#25 | 11.1%(-8.74)#736 |
| 26. | George Mason | 2.4% | 9.2%(-6.83)#26 | 11.1%(-8.70)#756 |
| 27. | Lincolnia | 2.4% | 9.2%(-6.83)#27 | 11.1%(-8.70)#758 |
| 28. | Mount Hermon | 2.5% | 9.2%(-6.71)#28 | 11.1%(-8.59)#840 |
| 29. | Boydton | 2.5% | 9.2%(-6.70)#29 | 11.1%(-8.57)#865 |
| 30. | Claypool Hill | 2.7% | 9.2%(-6.49)#30 | 11.1%(-8.36)#998 |
| 31. | Wolf Trap | 2.7% | 9.2%(-6.47)#31 | 11.1%(-8.34)#1,029 |
| 32. | Oakton | 2.8% | 9.2%(-6.36)#32 | 11.1%(-8.23)#1,115 |
| 33. | Windsor | 2.9% | 9.2%(-6.30)#33 | 11.1%(-8.17)#1,159 |
| 34. | Colonial Heights | 2.9% | 9.2%(-6.27)#34 | 11.1%(-8.14)#1,178 |
| 35. | Bridgewater | 3.0% | 9.2%(-6.17)#35 | 11.1%(-8.04)#1,256 |
| 36. | Altavista | 3.0% | 9.2%(-6.15)#36 | 11.1%(-8.02)#1,279 |
| 37. | Brandermill | 3.2% | 9.2%(-6.02)#37 | 11.1%(-7.89)#1,391 |
| 38. | Burke | 3.2% | 9.2%(-5.99)#38 | 11.1%(-7.86)#1,412 |
| 39. | Stanardsville | 3.2% | 9.2%(-5.97)#39 | 11.1%(-7.84)#1,437 |
| 40. | Boyce | 3.3% | 9.2%(-5.92)#40 | 11.1%(-7.79)#1,484 |
| 41. | Pennington Gap | 3.4% | 9.2%(-5.84)#41 | 11.1%(-7.71)#1,556 |
| 42. | Williamsburg | 3.4% | 9.2%(-5.81)#42 | 11.1%(-7.68)#1,581 |
| 43. | Bealeton | 3.5% | 9.2%(-5.67)#43 | 11.1%(-7.54)#1,696 |
| 44. | Bluefield | 3.5% | 9.2%(-5.65)#44 | 11.1%(-7.52)#1,710 |
| 45. | Manchester | 3.7% | 9.2%(-5.54)#45 | 11.1%(-7.41)#1,830 |
| 46. | Rockwood | 3.7% | 9.2%(-5.52)#46 | 11.1%(-7.39)#1,845 |
| 47. | Radford | 3.7% | 9.2%(-5.52)#47 | 11.1%(-7.39)#1,848 |
| 48. | Elkton | 3.7% | 9.2%(-5.49)#48 | 11.1%(-7.36)#1,865 |
| 49. | Smithfield | 3.7% | 9.2%(-5.48)#49 | 11.1%(-7.35)#1,887 |
| 50. | Pembroke | 3.7% | 9.2%(-5.45)#50 | 11.1%(-7.32)#1,915 |
| 51. | Bloxom | 3.8% | 9.2%(-5.35)#51 | 11.1%(-7.22)#2,019 |
| 52. | West Falls Church | 3.9% | 9.2%(-5.30)#52 | 11.1%(-7.17)#2,072 |
| 53. | Sudley | 4.0% | 9.2%(-5.23)#53 | 11.1%(-7.10)#2,143 |
| 54. | Gloucester Courthouse | 4.0% | 9.2%(-5.21)#54 | 11.1%(-7.08)#2,161 |
| 55. | Newington | 4.1% | 9.2%(-5.14)#55 | 11.1%(-7.01)#2,238 |
| 56. | Saltville | 4.2% | 9.2%(-5.03)#56 | 11.1%(-6.90)#2,333 |
| 57. | Madison | 4.2% | 9.2%(-5.03)#57 | 11.1%(-6.90)#2,351 |
| 58. | Pound | 4.2% | 9.2%(-4.99)#58 | 11.1%(-6.87)#2,385 |
| 59. | Chantilly | 4.3% | 9.2%(-4.86)#59 | 11.1%(-6.73)#2,502 |
| 60. | Falmouth | 4.3% | 9.2%(-4.85)#60 | 11.1%(-6.72)#2,510 |
| 61. | Pocahontas | 4.3% | 9.2%(-4.85)#61 | 11.1%(-6.72)#2,547 |
| 62. | Franconia | 4.4% | 9.2%(-4.77)#62 | 11.1%(-6.64)#2,619 |
| 63. | Laurel | 4.5% | 9.2%(-4.72)#63 | 11.1%(-6.59)#2,652 |
| 64. | Hollymead | 4.5% | 9.2%(-4.71)#64 | 11.1%(-6.58)#2,672 |
| 65. | Lovettsville | 4.5% | 9.2%(-4.70)#65 | 11.1%(-6.57)#2,675 |
| 66. | Independent Hill | 4.5% | 9.2%(-4.69)#66 | 11.1%(-6.56)#2,682 |
| 67. | Woodlake | 4.5% | 9.2%(-4.68)#67 | 11.1%(-6.55)#2,700 |
| 68. | Timberlake | 4.5% | 9.2%(-4.66)#68 | 11.1%(-6.53)#2,714 |
| 69. | Scottsville | 4.5% | 9.2%(-4.65)#69 | 11.1%(-6.52)#2,741 |
| 70. | Laurel Hill | 4.6% | 9.2%(-4.62)#70 | 11.1%(-6.49)#2,777 |
| 71. | Great Falls | 4.6% | 9.2%(-4.62)#71 | 11.1%(-6.49)#2,778 |
| 72. | Stanley | 4.6% | 9.2%(-4.61)#72 | 11.1%(-6.48)#2,788 |
| 73. | Meadowbrook | 4.8% | 9.2%(-4.35)#73 | 11.1%(-6.22)#3,046 |
| 74. | Rose Hill Cdp Fairfax County | 4.9% | 9.2%(-4.30)#74 | 11.1%(-6.17)#3,089 |
| 75. | North Springfield | 5.0% | 9.2%(-4.23)#75 | 11.1%(-6.10)#3,164 |
| 76. | Springfield | 5.0% | 9.2%(-4.19)#76 | 11.1%(-6.06)#3,231 |
| 77. | North Shore | 5.1% | 9.2%(-4.13)#77 | 11.1%(-6.00)#3,276 |
| 78. | Accomac | 5.1% | 9.2%(-4.07)#78 | 11.1%(-5.94)#3,336 |
| 79. | Ivor | 5.1% | 9.2%(-4.07)#79 | 11.1%(-5.94)#3,345 |
| 80. | Lake Ridge | 5.2% | 9.2%(-4.04)#80 | 11.1%(-5.91)#3,365 |
| 81. | Culpeper | 5.2% | 9.2%(-4.00)#81 | 11.1%(-5.88)#3,396 |
| 82. | Winchester | 5.2% | 9.2%(-3.95)#82 | 11.1%(-5.82)#3,434 |
| 83. | New Market | 5.3% | 9.2%(-3.93)#83 | 11.1%(-5.80)#3,453 |
| 84. | Brodnax | 5.3% | 9.2%(-3.93)#84 | 11.1%(-5.80)#3,490 |
| 85. | Strasburg | 5.3% | 9.2%(-3.91)#85 | 11.1%(-5.78)#3,514 |
| 86. | Abingdon | 5.3% | 9.2%(-3.90)#86 | 11.1%(-5.77)#3,521 |
| 87. | Stuart | 5.3% | 9.2%(-3.89)#87 | 11.1%(-5.76)#3,528 |
| 88. | Captains Cove | 5.3% | 9.2%(-3.89)#88 | 11.1%(-5.76)#3,535 |
| 89. | Fort Hunt | 5.4% | 9.2%(-3.83)#89 | 11.1%(-5.70)#3,579 |
| 90. | Kings Park | 5.4% | 9.2%(-3.83)#90 | 11.1%(-5.70)#3,580 |
| 91. | Grottoes | 5.4% | 9.2%(-3.76)#91 | 11.1%(-5.63)#3,641 |
| 92. | Rocky Mount | 5.5% | 9.2%(-3.74)#92 | 11.1%(-5.61)#3,651 |
| 93. | Merrimac | 5.5% | 9.2%(-3.73)#93 | 11.1%(-5.60)#3,662 |
| 94. | Cloverdale | 5.5% | 9.2%(-3.68)#94 | 11.1%(-5.55)#3,710 |
| 95. | Charlottesville | 5.5% | 9.2%(-3.66)#95 | 11.1%(-5.53)#3,731 |
| 96. | White Stone | 5.6% | 9.2%(-3.64)#96 | 11.1%(-5.51)#3,789 |
| 97. | Mclean | 5.6% | 9.2%(-3.64)#97 | 11.1%(-5.51)#3,803 |
| 98. | Cave Spring | 5.6% | 9.2%(-3.62)#98 | 11.1%(-5.49)#3,813 |
| 99. | Woodbridge | 5.6% | 9.2%(-3.62)#99 | 11.1%(-5.49)#3,814 |
| 100. | Broadlands | 5.8% | 9.2%(-3.44)#100 | 11.1%(-5.31)#3,986 |
Common Questions
What are the Top 10 Cities with the Lowest Poverty Level Among Seniors Over the Age of 75 in Virginia?
Top 10 Cities with the Lowest Poverty Level Among Seniors Over the Age of 75 in Virginia are:
#1
0.46%
#2
0.63%
#3
0.89%
#4
1.2%
#5
1.3%
#6
1.3%
#7
1.4%
#8
1.4%
#9
1.5%
#10
1.5%
What city has the Lowest Poverty Level Among Seniors Over the Age of 75 in Virginia?
Massanetta Springs has the Lowest Poverty Level Among Seniors Over the Age of 75 in Virginia with 0.46%.
What is the Poverty Level Among Seniors Over the Age of 75 in the State of Virginia?
Poverty Level Among Seniors Over the Age of 75 in Virginia is 9.2%.
What is the Poverty Level Among Seniors Over the Age of 75 in the United States?
Poverty Level Among Seniors Over the Age of 75 in the United States is 11.1%.