Rancho Murieta, CA Map & Demographics
Rancho Murieta Map
Rancho Murieta Overview
$61,572
PER CAPITA INCOME
$149,644
AVG FAMILY INCOME
$127,128
AVG HOUSEHOLD INCOME
30.4%
WAGE / INCOME GAP [ % ]
69.6¢/ $1
WAGE / INCOME GAP [ $ ]
$12,797
FAMILY INCOME DEFICIT
0.40
INEQUALITY / GINI INDEX
5,728
TOTAL POPULATION
2,578
MALE POPULATION
3,150
FEMALE POPULATION
81.84
MALES / 100 FEMALES
122.19
FEMALES / 100 MALES
56.3
MEDIAN AGE
2.8
AVG FAMILY SIZE
2.4
AVG HOUSEHOLD SIZE
2,492
LABOR FORCE [ PEOPLE ]
52.6%
PERCENT IN LABOR FORCE
2.1%
UNEMPLOYMENT RATE
Rancho Murieta Area Codes
Income in Rancho Murieta
Income Overview in Rancho Murieta
Per Capita Income in Rancho Murieta is $61,572, while median incomes of families and households are $149,644 and $127,128 respectively.
| Characteristic | Number | Measure |
| Per Capita Income | 5,728 | $61,572 |
| Median Family Income | 1,749 | $149,644 |
| Mean Family Income | 1,749 | $168,751 |
| Median Household Income | 2,439 | $127,128 |
| Mean Household Income | 2,439 | $142,877 |
| Income Deficit | 1,749 | $12,797 |
| Wage / Income Gap (%) | 5,728 | 30.40% |
| Wage / Income Gap ($) | 5,728 | 69.60¢ per $1 |
| Gini / Inequality Index | 5,728 | 0.40 |
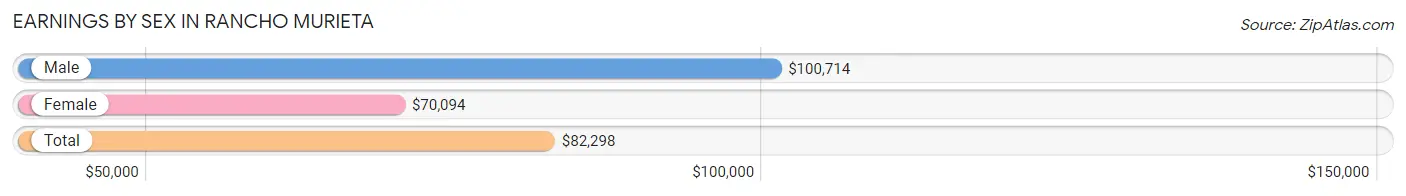
Earnings by Sex in Rancho Murieta
Average Earnings in Rancho Murieta are $82,298, $100,714 for men and $70,094 for women, a difference of 30.4%.
| Sex | Number | Average Earnings |
| Male | 1,280 (47.8%) | $100,714 |
| Female | 1,398 (52.2%) | $70,094 |
| Total | 2,678 (100.0%) | $82,298 |
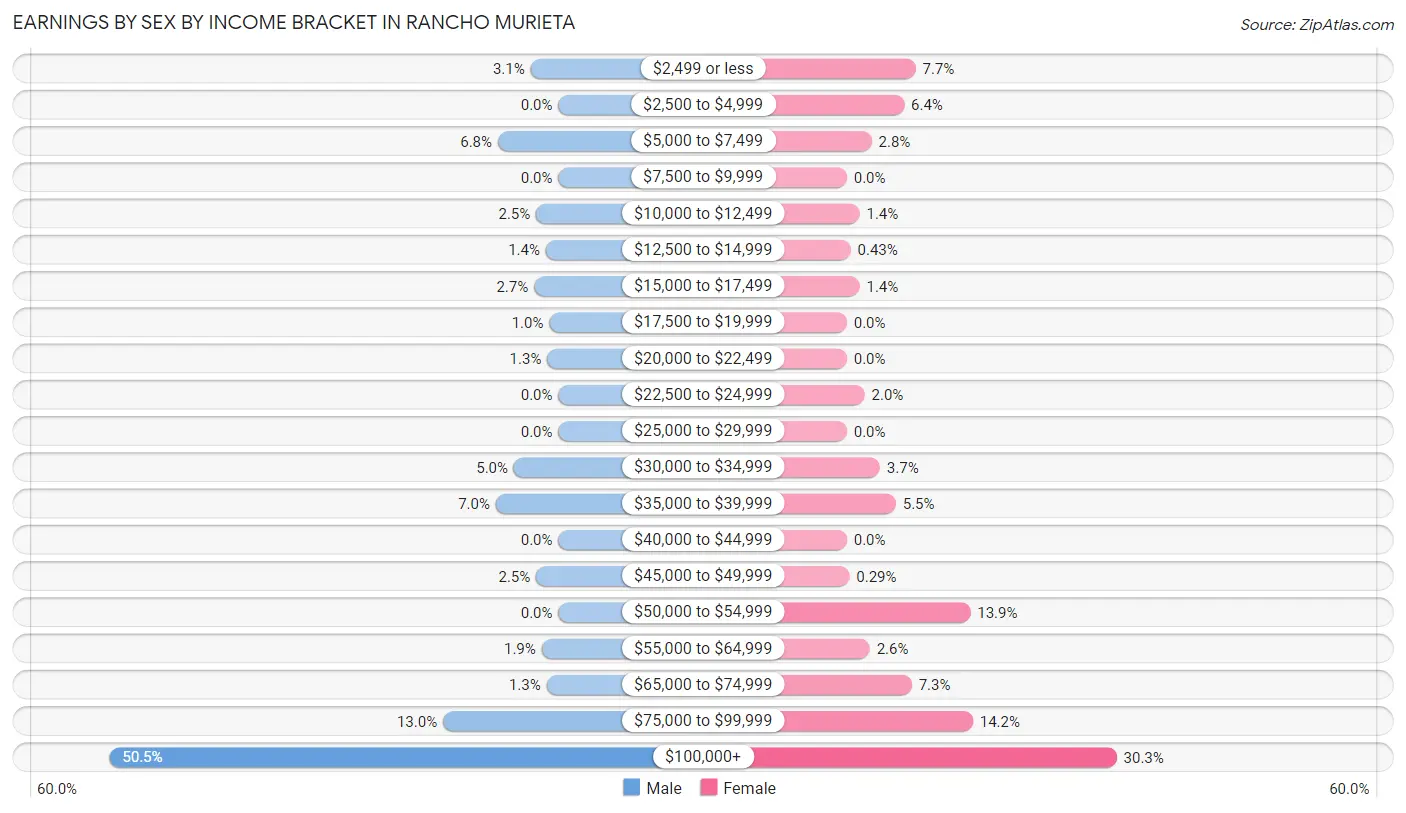
Earnings by Sex by Income Bracket in Rancho Murieta
The most common earnings brackets in Rancho Murieta are $100,000+ for men (646 | 50.5%) and $100,000+ for women (424 | 30.3%).
| Income | Male | Female |
| $2,499 or less | 40 (3.1%) | 108 (7.7%) |
| $2,500 to $4,999 | 0 (0.0%) | 90 (6.4%) |
| $5,000 to $7,499 | 87 (6.8%) | 39 (2.8%) |
| $7,500 to $9,999 | 0 (0.0%) | 0 (0.0%) |
| $10,000 to $12,499 | 32 (2.5%) | 20 (1.4%) |
| $12,500 to $14,999 | 18 (1.4%) | 6 (0.4%) |
| $15,000 to $17,499 | 35 (2.7%) | 20 (1.4%) |
| $17,500 to $19,999 | 13 (1.0%) | 0 (0.0%) |
| $20,000 to $22,499 | 16 (1.3%) | 0 (0.0%) |
| $22,500 to $24,999 | 0 (0.0%) | 28 (2.0%) |
| $25,000 to $29,999 | 0 (0.0%) | 0 (0.0%) |
| $30,000 to $34,999 | 64 (5.0%) | 52 (3.7%) |
| $35,000 to $39,999 | 90 (7.0%) | 77 (5.5%) |
| $40,000 to $44,999 | 0 (0.0%) | 0 (0.0%) |
| $45,000 to $49,999 | 32 (2.5%) | 4 (0.3%) |
| $50,000 to $54,999 | 0 (0.0%) | 194 (13.9%) |
| $55,000 to $64,999 | 24 (1.9%) | 36 (2.6%) |
| $65,000 to $74,999 | 17 (1.3%) | 102 (7.3%) |
| $75,000 to $99,999 | 166 (13.0%) | 198 (14.2%) |
| $100,000+ | 646 (50.5%) | 424 (30.3%) |
| Total | 1,280 (100.0%) | 1,398 (100.0%) |
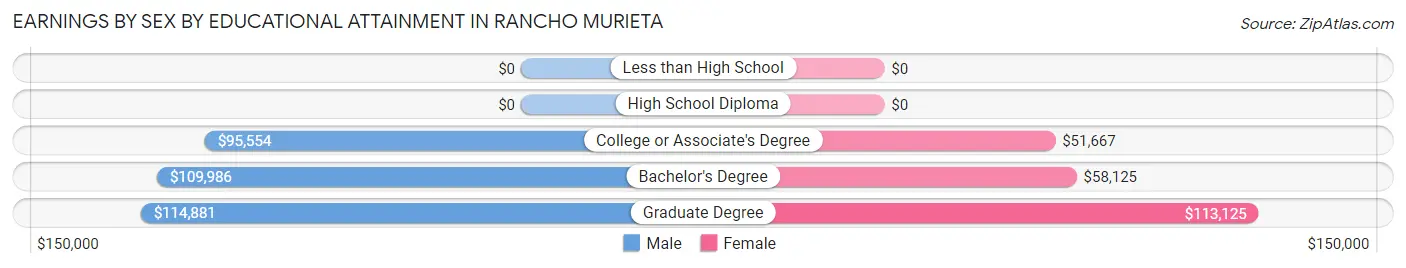
Earnings by Sex by Educational Attainment in Rancho Murieta
Average earnings in Rancho Murieta are $108,338 for men and $72,250 for women, a difference of 33.3%. Men with an educational attainment of graduate degree enjoy the highest average annual earnings of $114,881, while those with college or associate's degree education earn the least with $95,554. Women with an educational attainment of graduate degree earn the most with the average annual earnings of $113,125, while those with college or associate's degree education have the smallest earnings of $51,667.
| Educational Attainment | Male Income | Female Income |
| Less than High School | - | - |
| High School Diploma | - | - |
| College or Associate's Degree | $95,554 | $51,667 |
| Bachelor's Degree | $109,986 | $58,125 |
| Graduate Degree | $114,881 | $113,125 |
| Total | $108,338 | $72,250 |
Family Income in Rancho Murieta
Family Income Brackets in Rancho Murieta
According to the Rancho Murieta family income data, there are 491 families falling into the $200,000+ income range, which is the most common income bracket and makes up 28.1% of all families.
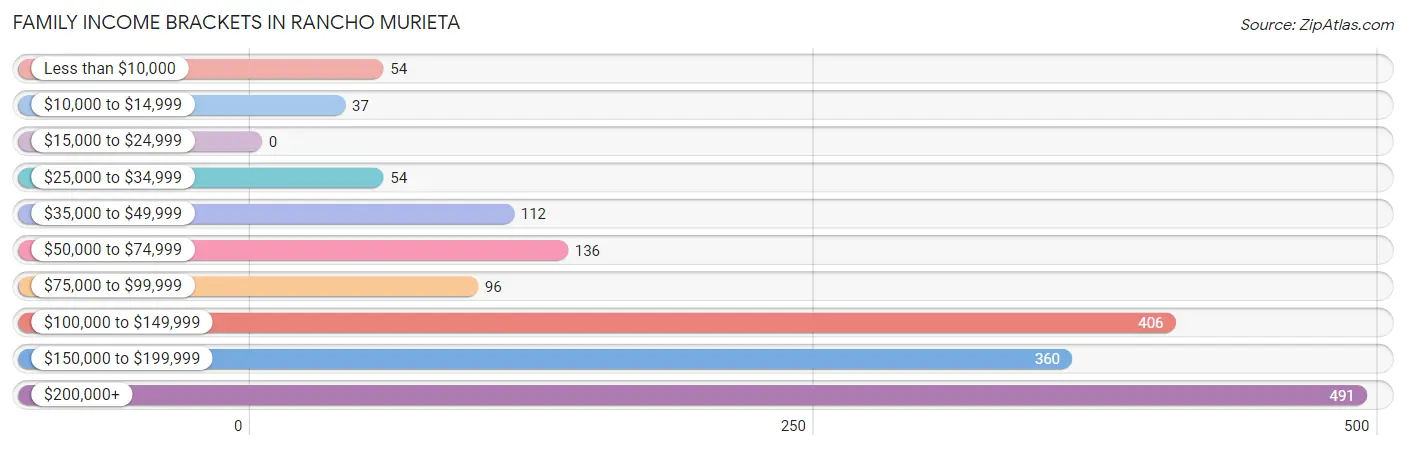
| Income Bracket | # Families | % Families |
| Less than $10,000 | 54 | 3.1% |
| $10,000 to $14,999 | 37 | 2.1% |
| $15,000 to $24,999 | 0 | 0.0% |
| $25,000 to $34,999 | 54 | 3.1% |
| $35,000 to $49,999 | 112 | 6.4% |
| $50,000 to $74,999 | 136 | 7.8% |
| $75,000 to $99,999 | 96 | 5.5% |
| $100,000 to $149,999 | 406 | 23.2% |
| $150,000 to $199,999 | 360 | 20.6% |
| $200,000+ | 491 | 28.1% |
Family Income by Famaliy Size in Rancho Murieta
3-person families (158 | 9.0%) account for the highest median family income in Rancho Murieta with $212,955 per family, while 3-person families (158 | 9.0%) have the highest median income of $70,985 per family member.
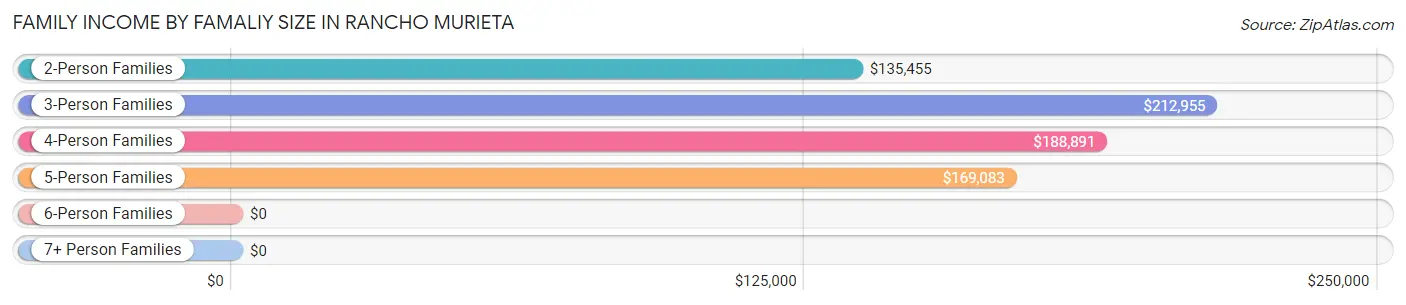
| Income Bracket | # Families | Median Income |
| 2-Person Families | 1,096 (62.7%) | $135,455 |
| 3-Person Families | 158 (9.0%) | $212,955 |
| 4-Person Families | 375 (21.4%) | $188,891 |
| 5-Person Families | 43 (2.5%) | $169,083 |
| 6-Person Families | 77 (4.4%) | $0 |
| 7+ Person Families | 0 (0.0%) | $0 |
| Total | 1,749 (100.0%) | $149,644 |
Family Income by Number of Earners in Rancho Murieta
The median family income in Rancho Murieta is $149,644, with families comprising 2 earners (566) having the highest median family income of $212,545, while families with no earners (572) have the lowest median family income of $72,868, accounting for 32.4% and 32.7% of families, respectively.
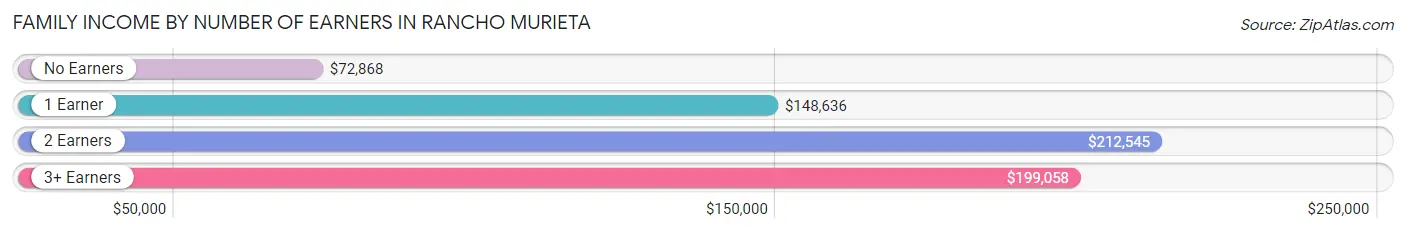
| Number of Earners | # Families | Median Income |
| No Earners | 572 (32.7%) | $72,868 |
| 1 Earner | 430 (24.6%) | $148,636 |
| 2 Earners | 566 (32.4%) | $212,545 |
| 3+ Earners | 181 (10.3%) | $199,058 |
| Total | 1,749 (100.0%) | $149,644 |
Household Income in Rancho Murieta
Household Income Brackets in Rancho Murieta
With 517 households falling in the category, the $100,000 to $149,999 income range is the most frequent in Rancho Murieta, accounting for 21.2% of all households. In contrast, only 22 households (0.9%) fall into the $15,000 to $24,999 income bracket, making it the least populous group.
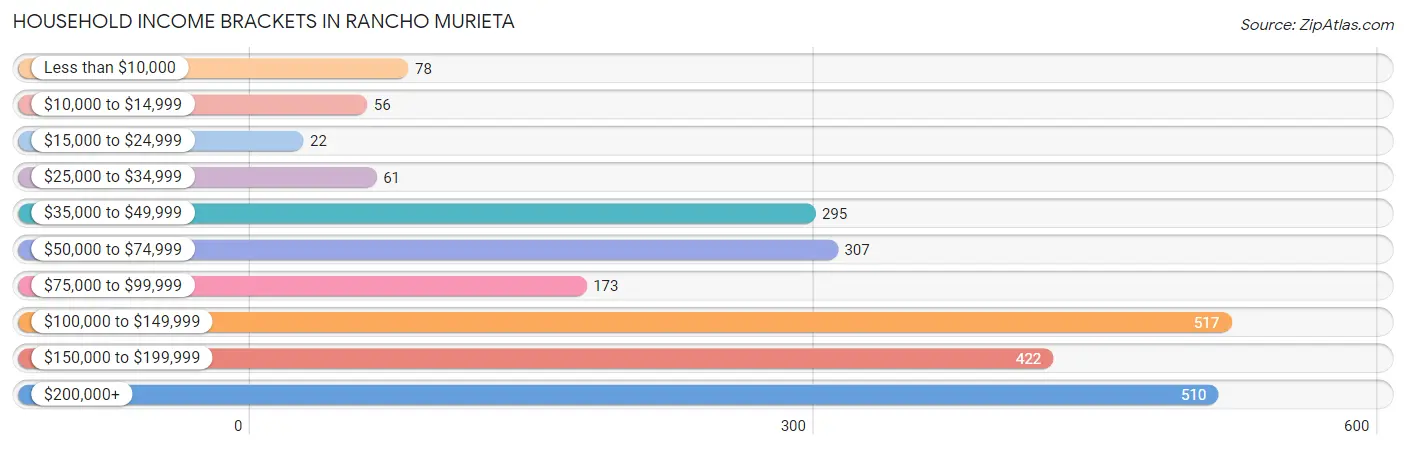
| Income Bracket | # Households | % Households |
| Less than $10,000 | 78 | 3.2% |
| $10,000 to $14,999 | 56 | 2.3% |
| $15,000 to $24,999 | 22 | 0.9% |
| $25,000 to $34,999 | 61 | 2.5% |
| $35,000 to $49,999 | 295 | 12.1% |
| $50,000 to $74,999 | 307 | 12.6% |
| $75,000 to $99,999 | 173 | 7.1% |
| $100,000 to $149,999 | 517 | 21.2% |
| $150,000 to $199,999 | 422 | 17.3% |
| $200,000+ | 510 | 20.9% |
Household Income by Householder Age in Rancho Murieta
The median household income in Rancho Murieta is $127,128, with the highest median household income of $197,798 found in the 45 to 64 years age bracket for the primary householder. A total of 808 households (33.1%) fall into this category.
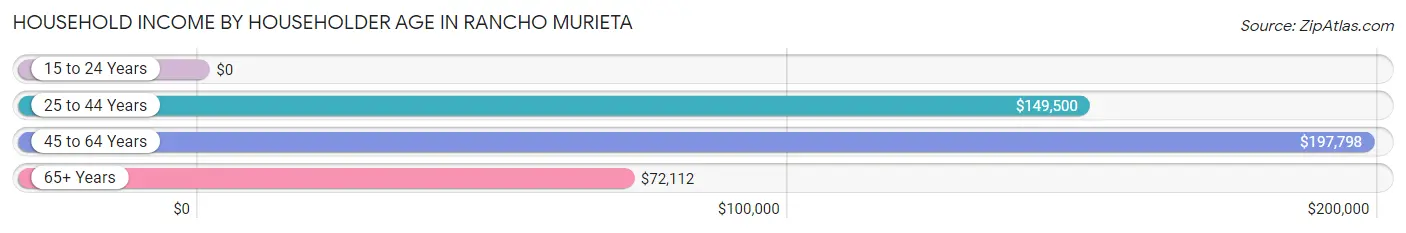
| Income Bracket | # Households | Median Income |
| 15 to 24 Years | 0 (0.0%) | $0 |
| 25 to 44 Years | 422 (17.3%) | $149,500 |
| 45 to 64 Years | 808 (33.1%) | $197,798 |
| 65+ Years | 1,209 (49.6%) | $72,112 |
| Total | 2,439 (100.0%) | $127,128 |
Poverty in Rancho Murieta
Income Below Poverty by Sex and Age in Rancho Murieta
With 4.4% poverty level for males and 4.1% for females among the residents of Rancho Murieta, 18 to 24 year old males and 25 to 34 year old females are the most vulnerable to poverty, with 22 males (16.3%) and 39 females (26.9%) in their respective age groups living below the poverty level.
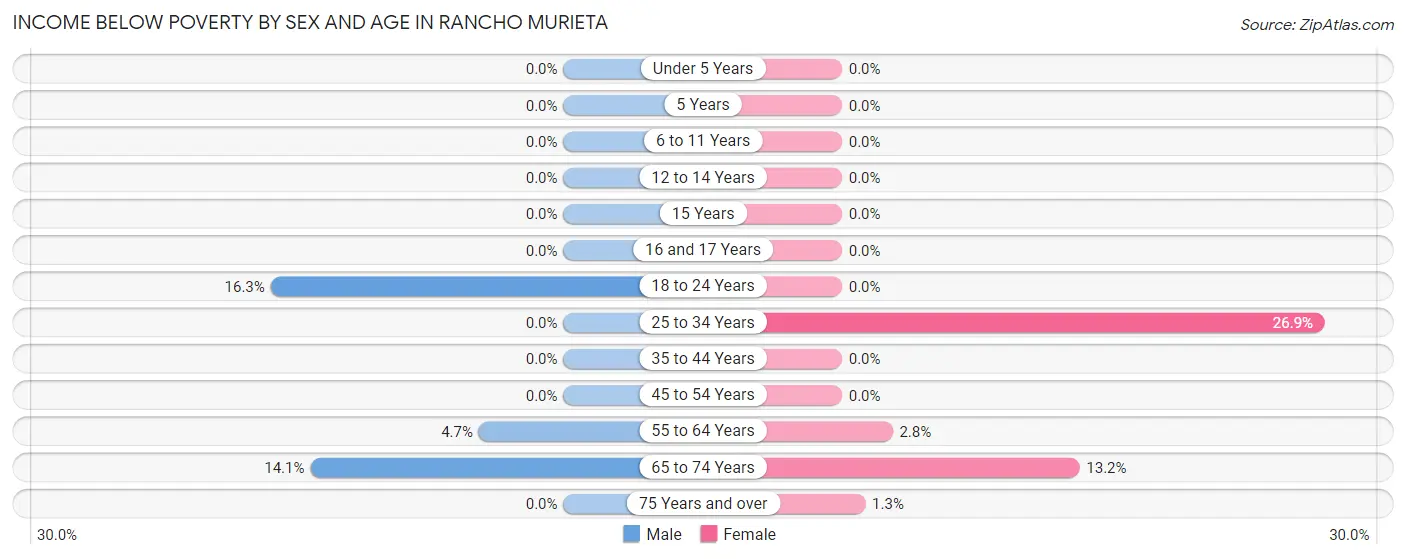
| Age Bracket | Male | Female |
| Under 5 Years | 0 (0.0%) | 0 (0.0%) |
| 5 Years | 0 (0.0%) | 0 (0.0%) |
| 6 to 11 Years | 0 (0.0%) | 0 (0.0%) |
| 12 to 14 Years | 0 (0.0%) | 0 (0.0%) |
| 15 Years | 0 (0.0%) | 0 (0.0%) |
| 16 and 17 Years | 0 (0.0%) | 0 (0.0%) |
| 18 to 24 Years | 22 (16.3%) | 0 (0.0%) |
| 25 to 34 Years | 0 (0.0%) | 39 (26.9%) |
| 35 to 44 Years | 0 (0.0%) | 0 (0.0%) |
| 45 to 54 Years | 0 (0.0%) | 0 (0.0%) |
| 55 to 64 Years | 18 (4.7%) | 19 (2.8%) |
| 65 to 74 Years | 73 (14.1%) | 66 (13.2%) |
| 75 Years and over | 0 (0.0%) | 6 (1.3%) |
| Total | 113 (4.4%) | 130 (4.1%) |
Income Above Poverty by Sex and Age in Rancho Murieta
According to the poverty statistics in Rancho Murieta, males aged under 5 years and females aged under 5 years are the age groups that are most secure financially, with 100.0% of males and 100.0% of females in these age groups living above the poverty line.
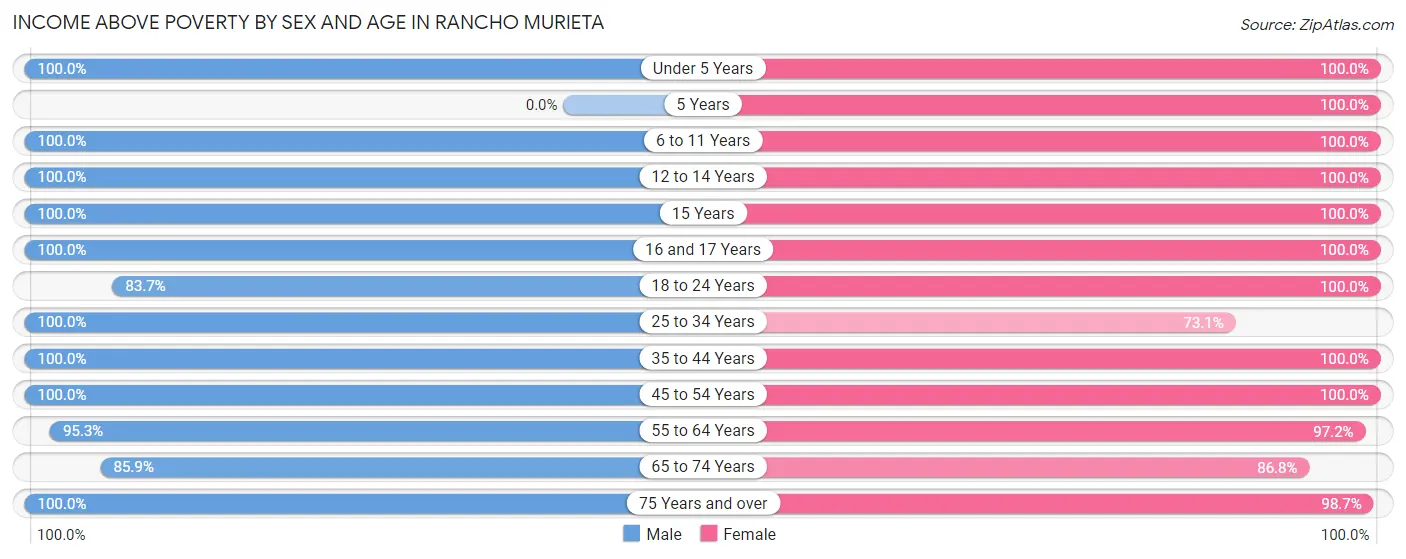
| Age Bracket | Male | Female |
| Under 5 Years | 157 (100.0%) | 68 (100.0%) |
| 5 Years | 0 (0.0%) | 21 (100.0%) |
| 6 to 11 Years | 176 (100.0%) | 88 (100.0%) |
| 12 to 14 Years | 59 (100.0%) | 272 (100.0%) |
| 15 Years | 14 (100.0%) | 135 (100.0%) |
| 16 and 17 Years | 42 (100.0%) | 86 (100.0%) |
| 18 to 24 Years | 113 (83.7%) | 111 (100.0%) |
| 25 to 34 Years | 64 (100.0%) | 106 (73.1%) |
| 35 to 44 Years | 325 (100.0%) | 255 (100.0%) |
| 45 to 54 Years | 230 (100.0%) | 336 (100.0%) |
| 55 to 64 Years | 364 (95.3%) | 655 (97.2%) |
| 65 to 74 Years | 445 (85.9%) | 433 (86.8%) |
| 75 Years and over | 476 (100.0%) | 454 (98.7%) |
| Total | 2,465 (95.6%) | 3,020 (95.9%) |
Income Below Poverty Among Married-Couple Families in Rancho Murieta
The poverty statistics for married-couple families in Rancho Murieta show that 6.2% or 91 of the total 1,457 families live below the poverty line. Families with no children have the highest poverty rate of 8.4%, comprising of 91 families. On the other hand, families with 1 or 2 children have the lowest poverty rate of 0.0%, which includes 0 families.
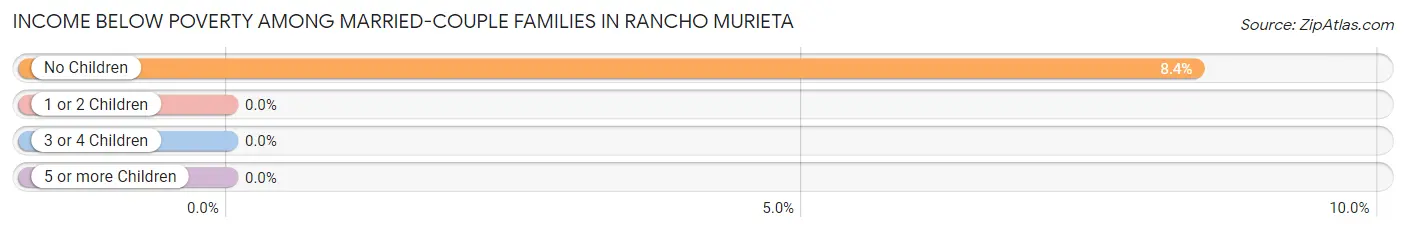
| Children | Above Poverty | Below Poverty |
| No Children | 991 (91.6%) | 91 (8.4%) |
| 1 or 2 Children | 286 (100.0%) | 0 (0.0%) |
| 3 or 4 Children | 89 (100.0%) | 0 (0.0%) |
| 5 or more Children | 0 (0.0%) | 0 (0.0%) |
| Total | 1,366 (93.8%) | 91 (6.2%) |
Income Below Poverty Among Single-Parent Households in Rancho Murieta
| Children | Single Father | Single Mother |
| No Children | 0 (0.0%) | 0 (0.0%) |
| 1 or 2 Children | 0 (0.0%) | 0 (0.0%) |
| 3 or 4 Children | 0 (0.0%) | 0 (0.0%) |
| 5 or more Children | 0 (0.0%) | 0 (0.0%) |
| Total | 0 (0.0%) | 0 (0.0%) |
Income Below Poverty Among Married-Couple vs Single-Parent Households in Rancho Murieta
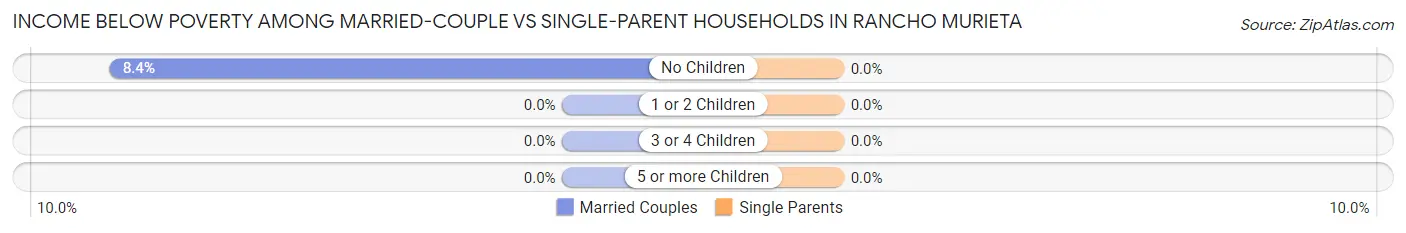
| Children | Married-Couple Families | Single-Parent Households |
| No Children | 91 (8.4%) | 0 (0.0%) |
| 1 or 2 Children | 0 (0.0%) | 0 (0.0%) |
| 3 or 4 Children | 0 (0.0%) | 0 (0.0%) |
| 5 or more Children | 0 (0.0%) | 0 (0.0%) |
| Total | 91 (6.2%) | 0 (0.0%) |
Race in Rancho Murieta
The most populous races in Rancho Murieta are White / Caucasian (4,470 | 78.0%), Hispanic or Latino (1,054 | 18.4%), and Two or more Races (500 | 8.7%).
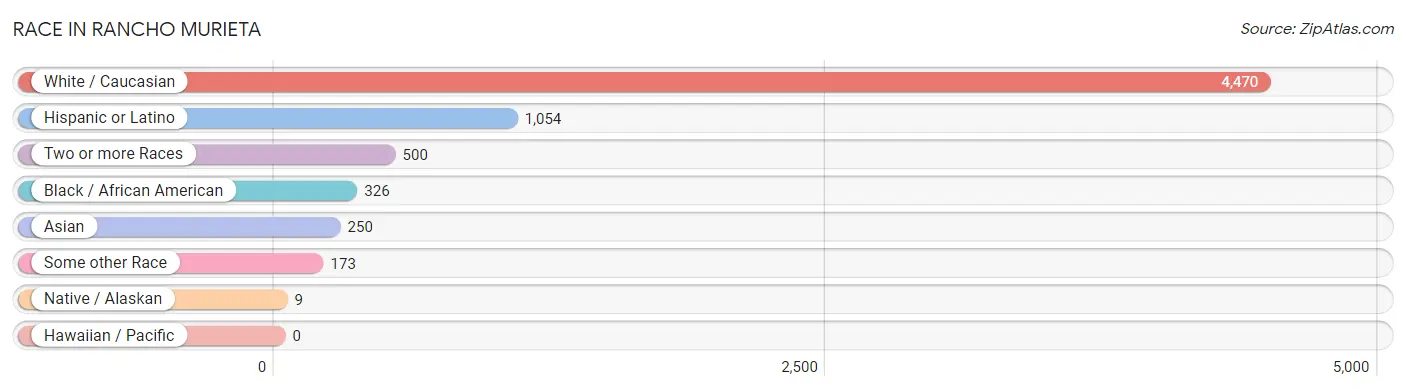
| Race | # Population | % Population |
| Asian | 250 | 4.4% |
| Black / African American | 326 | 5.7% |
| Hawaiian / Pacific | 0 | 0.0% |
| Hispanic or Latino | 1,054 | 18.4% |
| Native / Alaskan | 9 | 0.2% |
| White / Caucasian | 4,470 | 78.0% |
| Two or more Races | 500 | 8.7% |
| Some other Race | 173 | 3.0% |
| Total | 5,728 | 100.0% |
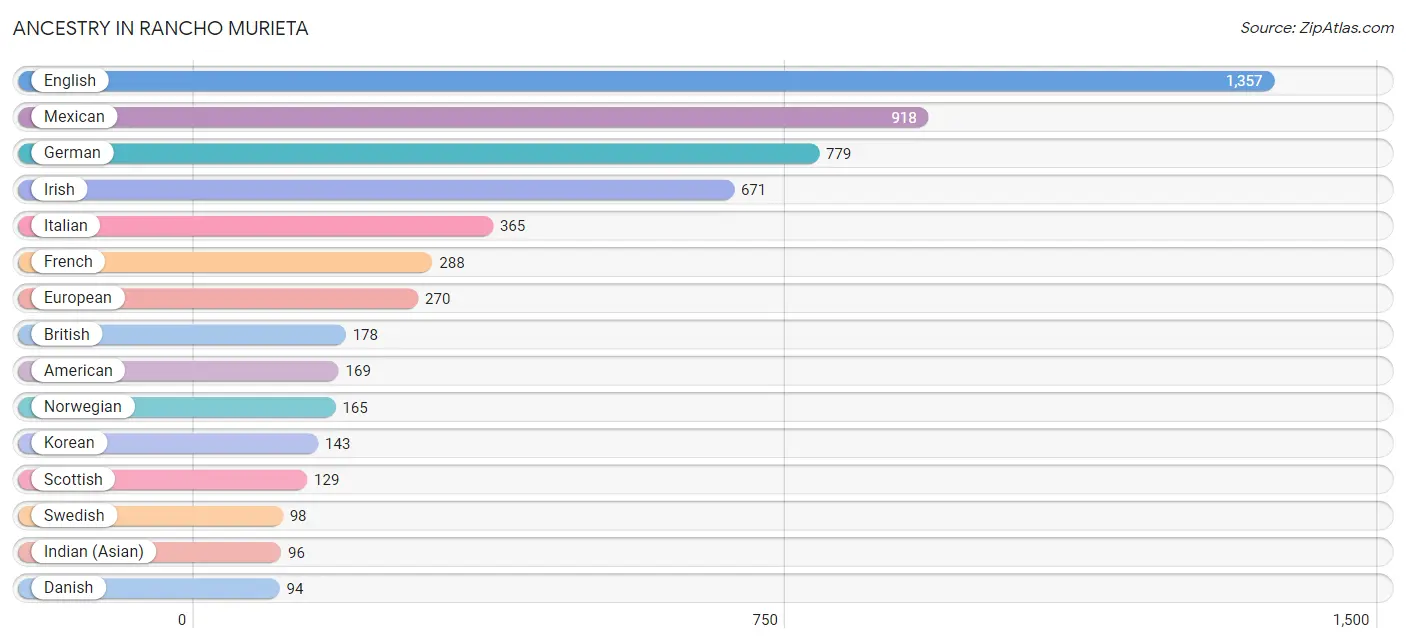
Ancestry in Rancho Murieta
The most populous ancestries reported in Rancho Murieta are English (1,357 | 23.7%), Mexican (918 | 16.0%), German (779 | 13.6%), Irish (671 | 11.7%), and Italian (365 | 6.4%), together accounting for 71.4% of all Rancho Murieta residents.
| Ancestry | # Population | % Population |
| American | 169 | 2.9% |
| Assyrian / Chaldean / Syriac | 16 | 0.3% |
| Austrian | 23 | 0.4% |
| Bhutanese | 28 | 0.5% |
| British | 178 | 3.1% |
| Burmese | 17 | 0.3% |
| Canadian | 16 | 0.3% |
| Cherokee | 25 | 0.4% |
| Colombian | 16 | 0.3% |
| Danish | 94 | 1.6% |
| Dutch | 68 | 1.2% |
| Eastern European | 19 | 0.3% |
| English | 1,357 | 23.7% |
| European | 270 | 4.7% |
| Finnish | 32 | 0.6% |
| French | 288 | 5.0% |
| French Canadian | 37 | 0.6% |
| German | 779 | 13.6% |
| Hungarian | 34 | 0.6% |
| Indian (Asian) | 96 | 1.7% |
| Irish | 671 | 11.7% |
| Italian | 365 | 6.4% |
| Japanese | 15 | 0.3% |
| Korean | 143 | 2.5% |
| Laotian | 52 | 0.9% |
| Lithuanian | 52 | 0.9% |
| Mexican | 918 | 16.0% |
| Northern European | 41 | 0.7% |
| Norwegian | 165 | 2.9% |
| Polish | 68 | 1.2% |
| Portuguese | 66 | 1.1% |
| Russian | 6 | 0.1% |
| Scandinavian | 38 | 0.7% |
| Scotch-Irish | 24 | 0.4% |
| Scottish | 129 | 2.2% |
| Serbian | 22 | 0.4% |
| Slovak | 39 | 0.7% |
| South American | 16 | 0.3% |
| Spaniard | 40 | 0.7% |
| Spanish | 80 | 1.4% |
| Swedish | 98 | 1.7% |
| Swiss | 21 | 0.4% |
| Ukrainian | 22 | 0.4% |
| Welsh | 30 | 0.5% | View All 44 Rows |
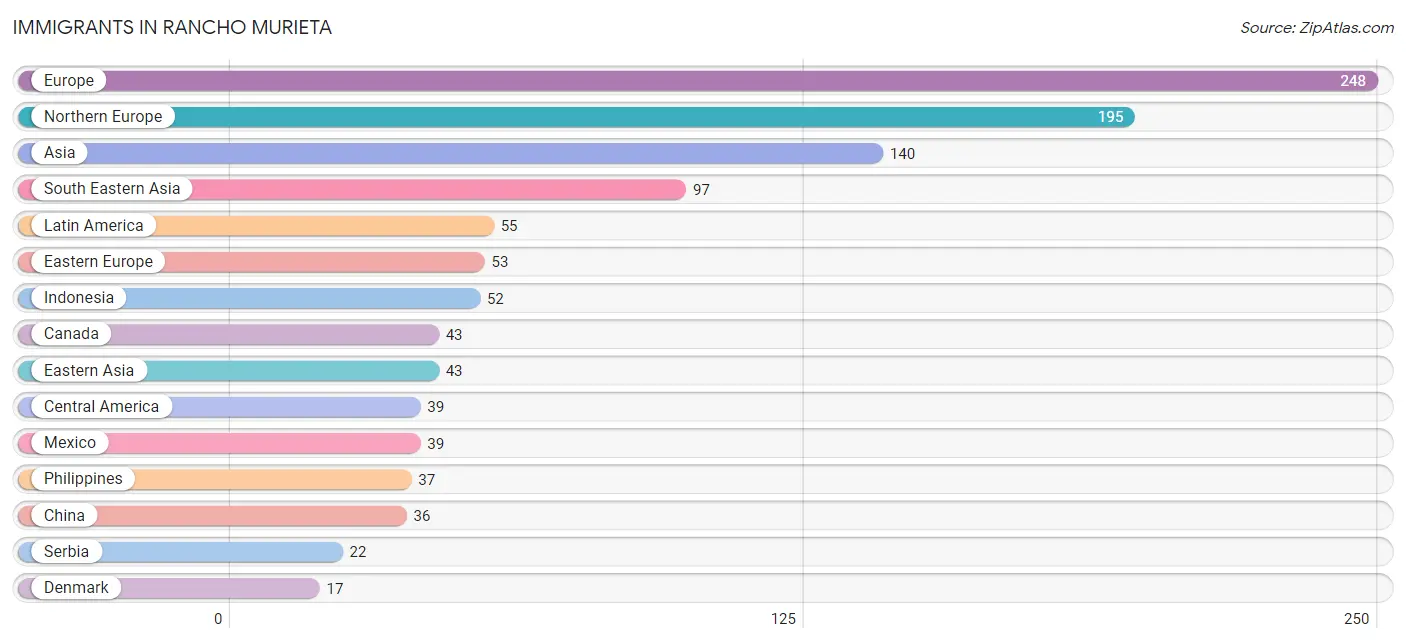
Immigrants in Rancho Murieta
The most numerous immigrant groups reported in Rancho Murieta came from Europe (248 | 4.3%), Northern Europe (195 | 3.4%), Asia (140 | 2.4%), South Eastern Asia (97 | 1.7%), and Latin America (55 | 1.0%), together accounting for 12.8% of all Rancho Murieta residents.
| Immigration Origin | # Population | % Population |
| Asia | 140 | 2.4% |
| Canada | 43 | 0.7% |
| Central America | 39 | 0.7% |
| China | 36 | 0.6% |
| Colombia | 16 | 0.3% |
| Denmark | 17 | 0.3% |
| Eastern Asia | 43 | 0.7% |
| Eastern Europe | 53 | 0.9% |
| Europe | 248 | 4.3% |
| Hungary | 16 | 0.3% |
| Indonesia | 52 | 0.9% |
| Korea | 7 | 0.1% |
| Latin America | 55 | 1.0% |
| Mexico | 39 | 0.7% |
| Northern Europe | 195 | 3.4% |
| Philippines | 37 | 0.6% |
| Poland | 15 | 0.3% |
| Serbia | 22 | 0.4% |
| South America | 16 | 0.3% |
| South Eastern Asia | 97 | 1.7% |
| Vietnam | 8 | 0.1% | View All 21 Rows |
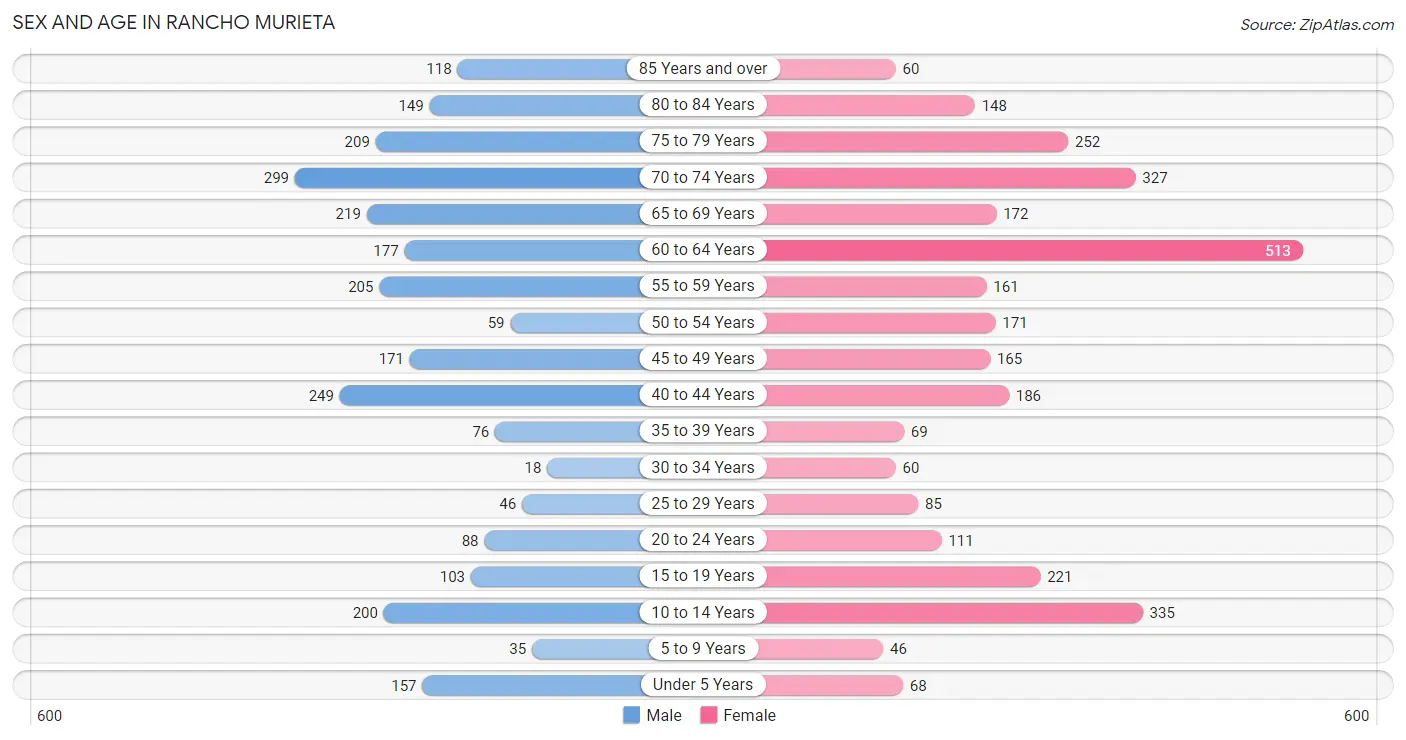
Sex and Age in Rancho Murieta
Sex and Age in Rancho Murieta
The most populous age groups in Rancho Murieta are 70 to 74 Years (299 | 11.6%) for men and 60 to 64 Years (513 | 16.3%) for women.
| Age Bracket | Male | Female |
| Under 5 Years | 157 (6.1%) | 68 (2.2%) |
| 5 to 9 Years | 35 (1.4%) | 46 (1.5%) |
| 10 to 14 Years | 200 (7.8%) | 335 (10.6%) |
| 15 to 19 Years | 103 (4.0%) | 221 (7.0%) |
| 20 to 24 Years | 88 (3.4%) | 111 (3.5%) |
| 25 to 29 Years | 46 (1.8%) | 85 (2.7%) |
| 30 to 34 Years | 18 (0.7%) | 60 (1.9%) |
| 35 to 39 Years | 76 (2.9%) | 69 (2.2%) |
| 40 to 44 Years | 249 (9.7%) | 186 (5.9%) |
| 45 to 49 Years | 171 (6.6%) | 165 (5.2%) |
| 50 to 54 Years | 59 (2.3%) | 171 (5.4%) |
| 55 to 59 Years | 205 (8.0%) | 161 (5.1%) |
| 60 to 64 Years | 177 (6.9%) | 513 (16.3%) |
| 65 to 69 Years | 219 (8.5%) | 172 (5.5%) |
| 70 to 74 Years | 299 (11.6%) | 327 (10.4%) |
| 75 to 79 Years | 209 (8.1%) | 252 (8.0%) |
| 80 to 84 Years | 149 (5.8%) | 148 (4.7%) |
| 85 Years and over | 118 (4.6%) | 60 (1.9%) |
| Total | 2,578 (100.0%) | 3,150 (100.0%) |
Families and Households in Rancho Murieta
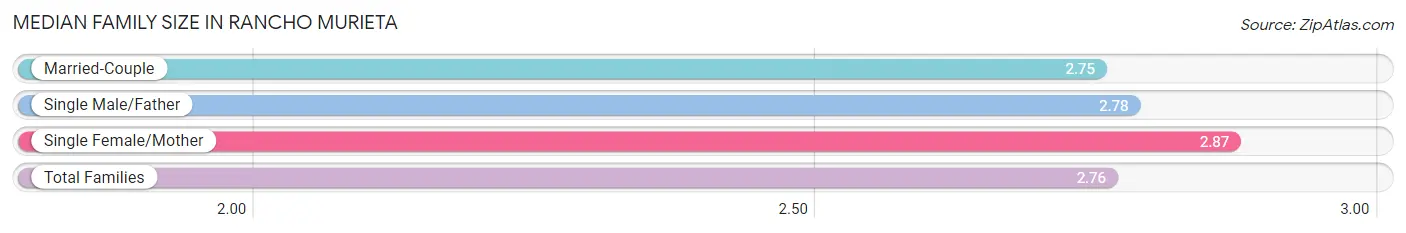
Median Family Size in Rancho Murieta
The median family size in Rancho Murieta is 2.76 persons per family, with single female/mother families (85 | 4.9%) accounting for the largest median family size of 2.87 persons per family. On the other hand, married-couple families (1,457 | 83.3%) represent the smallest median family size with 2.75 persons per family.
| Family Type | # Families | Family Size |
| Married-Couple | 1,457 (83.3%) | 2.75 |
| Single Male/Father | 207 (11.8%) | 2.78 |
| Single Female/Mother | 85 (4.9%) | 2.87 |
| Total Families | 1,749 (100.0%) | 2.76 |
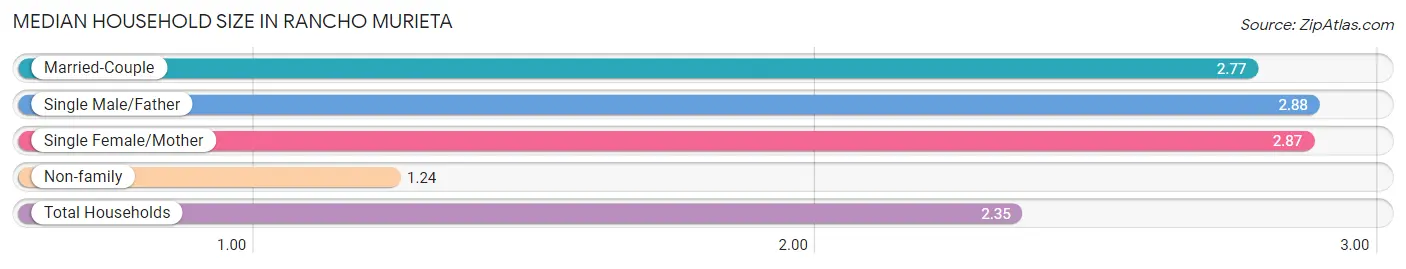
Median Household Size in Rancho Murieta
The median household size in Rancho Murieta is 2.35 persons per household, with single male/father households (207 | 8.5%) accounting for the largest median household size of 2.88 persons per household. non-family households (690 | 28.3%) represent the smallest median household size with 1.24 persons per household.
| Household Type | # Households | Household Size |
| Married-Couple | 1,457 (59.7%) | 2.77 |
| Single Male/Father | 207 (8.5%) | 2.88 |
| Single Female/Mother | 85 (3.5%) | 2.87 |
| Non-family | 690 (28.3%) | 1.24 |
| Total Households | 2,439 (100.0%) | 2.35 |
Household Size by Marriage Status in Rancho Murieta
Out of a total of 2,439 households in Rancho Murieta, 1,749 (71.7%) are family households, while 690 (28.3%) are nonfamily households. The most numerous type of family households are 2-person households, comprising 1,054, and the most common type of nonfamily households are 1-person households, comprising 557.
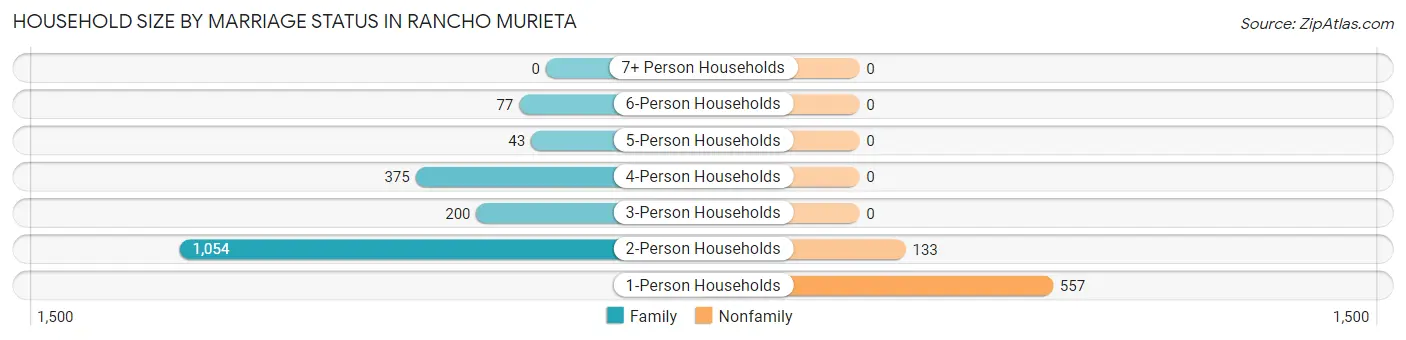
| Household Size | Family Households | Nonfamily Households |
| 1-Person Households | - | 557 (22.8%) |
| 2-Person Households | 1,054 (43.2%) | 133 (5.4%) |
| 3-Person Households | 200 (8.2%) | 0 (0.0%) |
| 4-Person Households | 375 (15.4%) | 0 (0.0%) |
| 5-Person Households | 43 (1.8%) | 0 (0.0%) |
| 6-Person Households | 77 (3.2%) | 0 (0.0%) |
| 7+ Person Households | 0 (0.0%) | 0 (0.0%) |
| Total | 1,749 (71.7%) | 690 (28.3%) |
Female Fertility in Rancho Murieta
Fertility by Age in Rancho Murieta
Average fertility rate in Rancho Murieta is 88.0 births per 1,000 women. Women in the age bracket of 20 to 34 years have the highest fertility rate with 320.0 births per 1,000 women. Women in the age bracket of 20 to 34 years acount for 100.0% of all women with births.
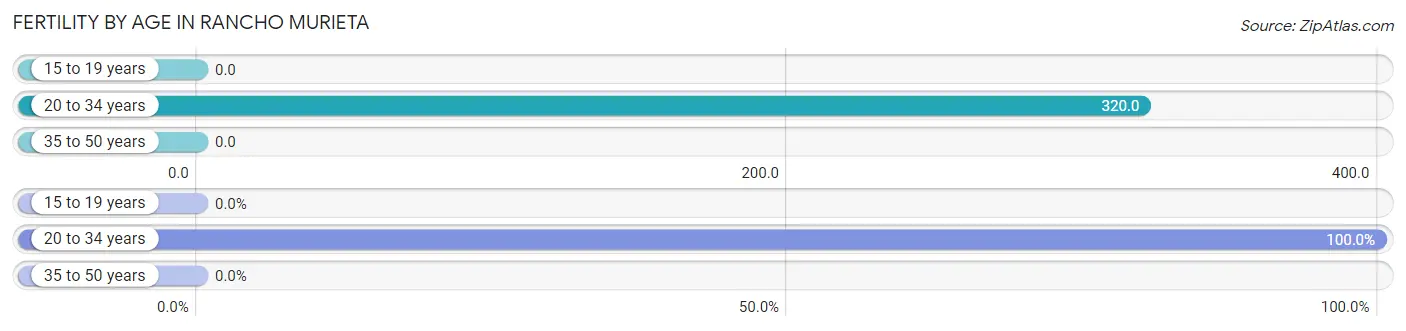
| Age Bracket | Women with Births | Births / 1,000 Women |
| 15 to 19 years | 0 (0.0%) | 0.0 |
| 20 to 34 years | 82 (100.0%) | 320.0 |
| 35 to 50 years | 0 (0.0%) | 0.0 |
| Total | 82 (100.0%) | 88.0 |
Fertility by Age by Marriage Status in Rancho Murieta
51.2% of women with births (82) in Rancho Murieta are married. The highest percentage of unmarried women with births falls into 20 to 34 years age bracket with 48.8% of them unmarried at the time of birth, while the lowest percentage of unmarried women with births belong to 20 to 34 years age bracket with 48.8% of them unmarried.
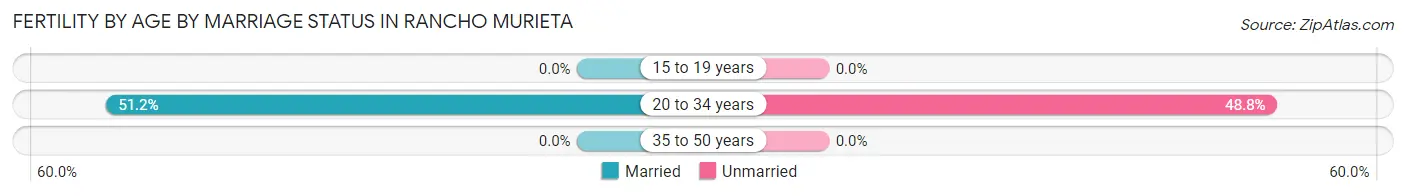
| Age Bracket | Married | Unmarried |
| 15 to 19 years | 0 (0.0%) | 0 (0.0%) |
| 20 to 34 years | 42 (51.2%) | 40 (48.8%) |
| 35 to 50 years | 0 (0.0%) | 0 (0.0%) |
| Total | 42 (51.2%) | 40 (48.8%) |
Fertility by Education in Rancho Murieta
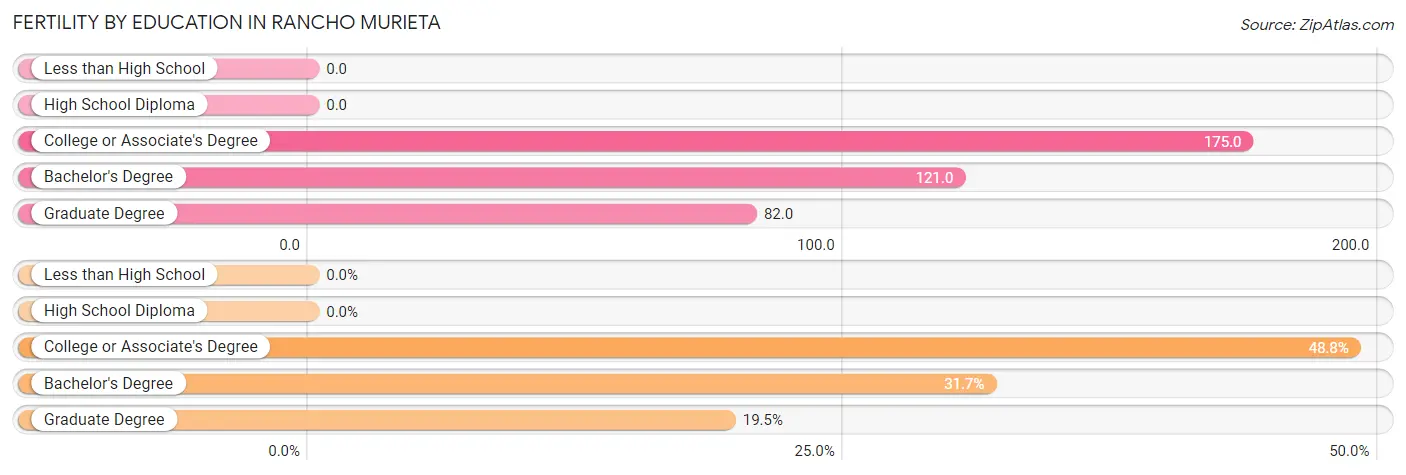
| Educational Attainment | Women with Births | Births / 1,000 Women |
| Less than High School | 0 (0.0%) | 0.0 |
| High School Diploma | 0 (0.0%) | 0.0 |
| College or Associate's Degree | 40 (48.8%) | 175.0 |
| Bachelor's Degree | 26 (31.7%) | 121.0 |
| Graduate Degree | 16 (19.5%) | 82.0 |
| Total | 82 (100.0%) | 88.0 |
Fertility by Education by Marriage Status in Rancho Murieta
48.8% of women with births in Rancho Murieta are unmarried. Women with the educational attainment of bachelor's degree are most likely to be married with 100.0% of them married at childbirth, while women with the educational attainment of college or associate's degree are least likely to be married with 100.0% of them unmarried at childbirth.
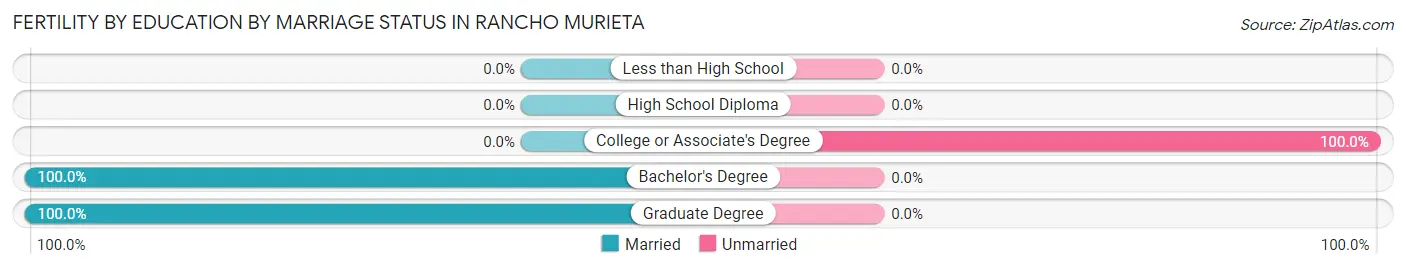
| Educational Attainment | Married | Unmarried |
| Less than High School | 0 (0.0%) | 0 (0.0%) |
| High School Diploma | 0 (0.0%) | 0 (0.0%) |
| College or Associate's Degree | 0 (0.0%) | 40 (100.0%) |
| Bachelor's Degree | 26 (100.0%) | 0 (0.0%) |
| Graduate Degree | 16 (100.0%) | 0 (0.0%) |
| Total | 42 (51.2%) | 40 (48.8%) |
Employment Characteristics in Rancho Murieta
Employment by Class of Employer in Rancho Murieta
Among the 2,439 employed individuals in Rancho Murieta, private company employees (1,133 | 46.5%), local government employees (371 | 15.2%), and not-for-profit organizations (272 | 11.2%) make up the most common classes of employment.
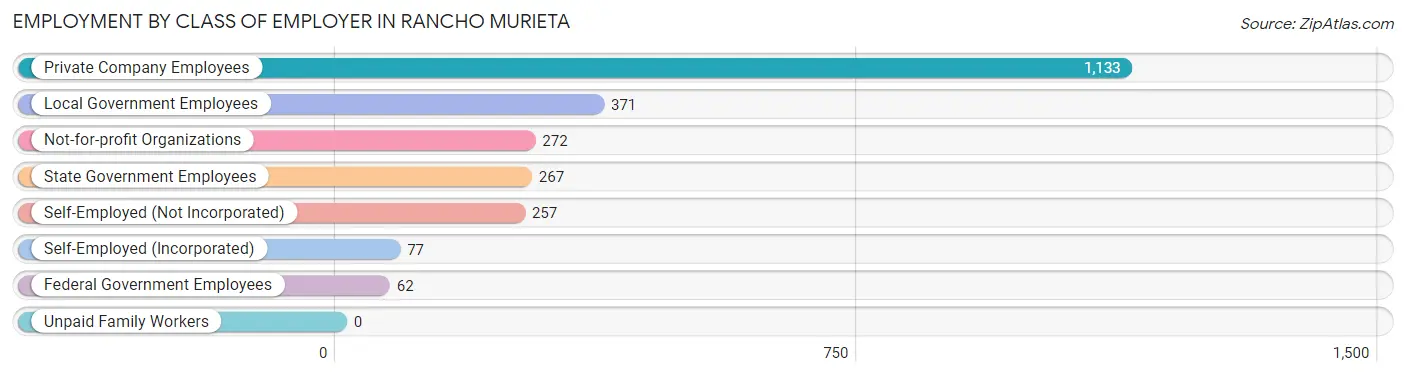
| Employer Class | # Employees | % Employees |
| Private Company Employees | 1,133 | 46.5% |
| Self-Employed (Incorporated) | 77 | 3.2% |
| Self-Employed (Not Incorporated) | 257 | 10.5% |
| Not-for-profit Organizations | 272 | 11.2% |
| Local Government Employees | 371 | 15.2% |
| State Government Employees | 267 | 11.0% |
| Federal Government Employees | 62 | 2.5% |
| Unpaid Family Workers | 0 | 0.0% |
| Total | 2,439 | 100.0% |
Employment Status by Age in Rancho Murieta
According to the labor force statistics for Rancho Murieta, out of the total population over 16 years of age (4,738), 52.6% or 2,492 individuals are in the labor force, with 2.1% or 52 of them unemployed. The age group with the highest labor force participation rate is 55 to 59 years, with 100.0% or 366 individuals in the labor force. Within the labor force, the 20 to 24 years age range has the highest percentage of unemployed individuals, with 17.9% or 25 of them being unemployed.
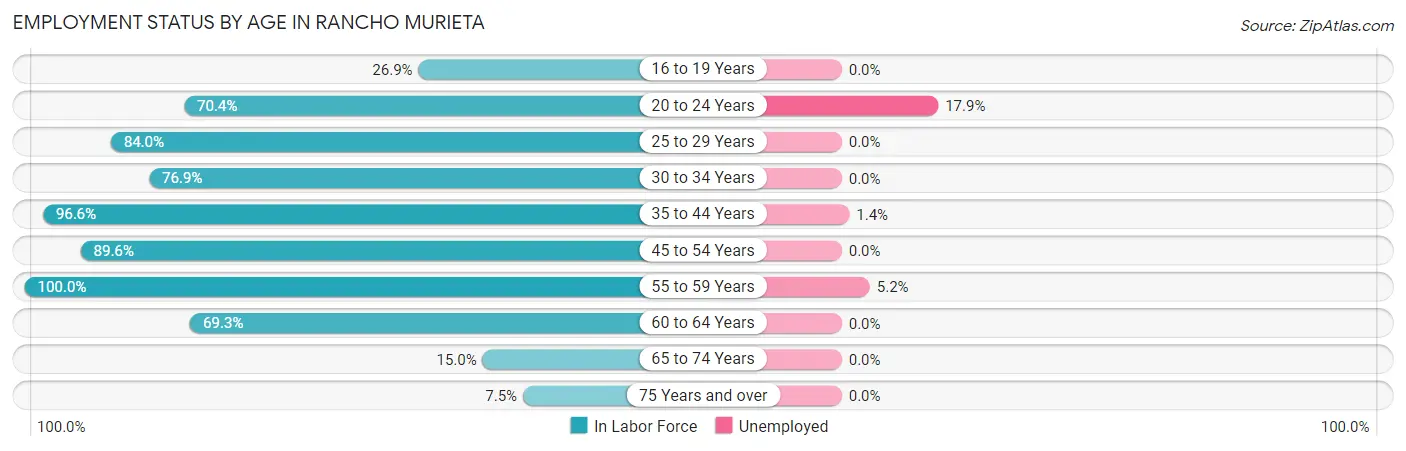
| Age Bracket | In Labor Force | Unemployed |
| 16 to 19 Years | 47 (26.9%) | 0 (0.0%) |
| 20 to 24 Years | 140 (70.4%) | 25 (17.9%) |
| 25 to 29 Years | 110 (84.0%) | 0 (0.0%) |
| 30 to 34 Years | 60 (76.9%) | 0 (0.0%) |
| 35 to 44 Years | 560 (96.6%) | 8 (1.4%) |
| 45 to 54 Years | 507 (89.6%) | 0 (0.0%) |
| 55 to 59 Years | 366 (100.0%) | 19 (5.2%) |
| 60 to 64 Years | 478 (69.3%) | 0 (0.0%) |
| 65 to 74 Years | 153 (15.0%) | 0 (0.0%) |
| 75 Years and over | 70 (7.5%) | 0 (0.0%) |
| Total | 2,492 (52.6%) | 52 (2.1%) |
Employment Status by Educational Attainment in Rancho Murieta
According to labor force statistics for Rancho Murieta, 86.3% of individuals (2,081) out of the total population between 25 and 64 years of age (2,411) are in the labor force, with 1.3% or 27 of them being unemployed. The group with the highest labor force participation rate are those with the educational attainment of college / associate degree, with 92.2% or 659 individuals in the labor force. Within the labor force, individuals with bachelor's degree or higher education have the highest percentage of unemployment, with 1.6% or 18 of them being unemployed.
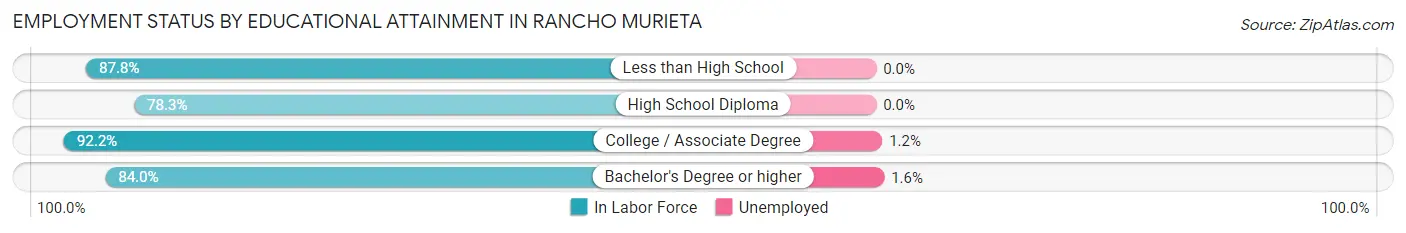
| Educational Attainment | In Labor Force | Unemployed |
| Less than High School | 151 (87.8%) | 0 (0.0%) |
| High School Diploma | 119 (78.3%) | 0 (0.0%) |
| College / Associate Degree | 659 (92.2%) | 9 (1.2%) |
| Bachelor's Degree or higher | 1,152 (84.0%) | 22 (1.6%) |
| Total | 2,081 (86.3%) | 31 (1.3%) |
Employment Occupations by Sex in Rancho Murieta
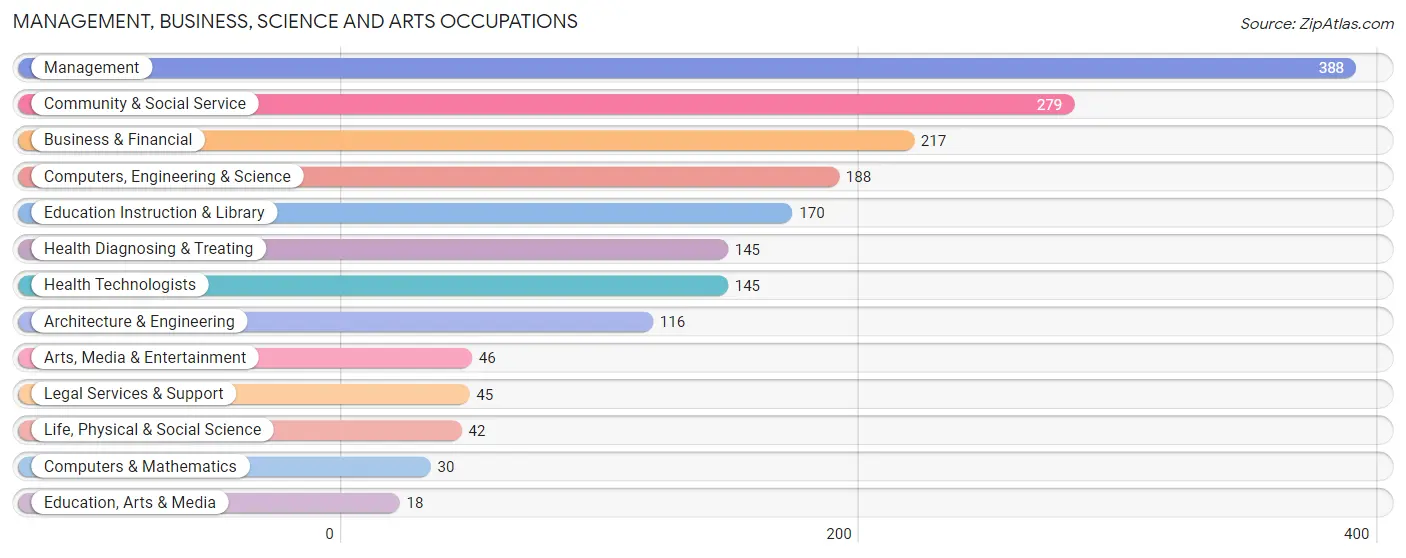
Management, Business, Science and Arts Occupations
The most common Management, Business, Science and Arts occupations in Rancho Murieta are Management (388 | 15.9%), Community & Social Service (279 | 11.4%), Business & Financial (217 | 8.9%), Computers, Engineering & Science (188 | 7.7%), and Education Instruction & Library (170 | 7.0%).
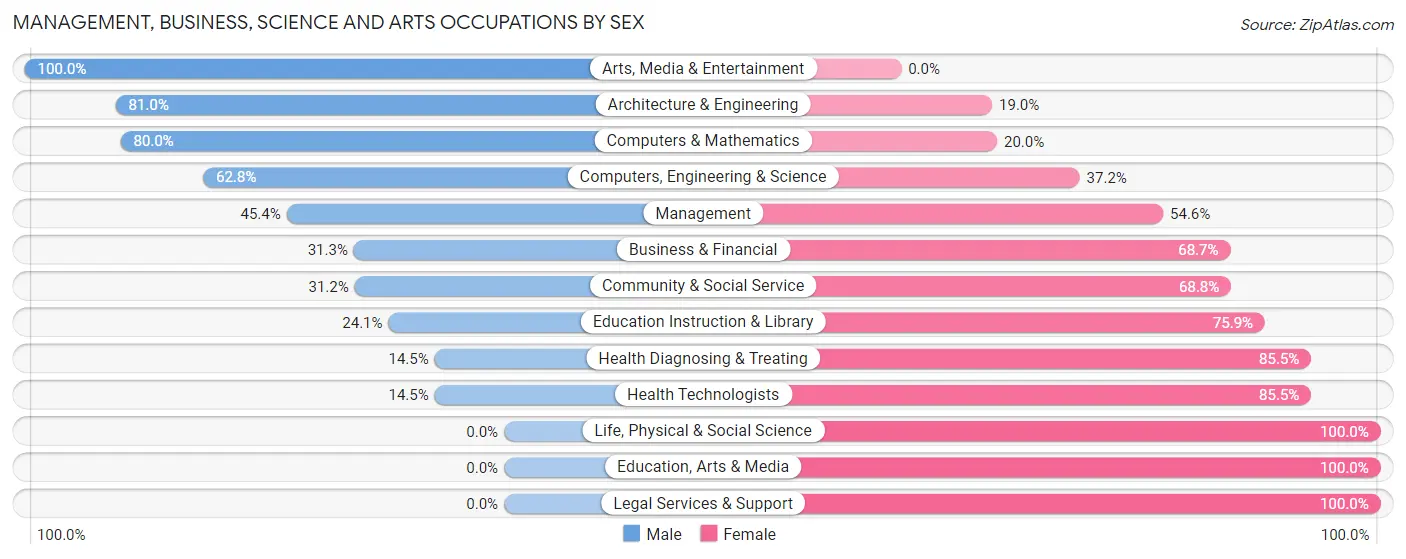
Management, Business, Science and Arts Occupations by Sex
Within the Management, Business, Science and Arts occupations in Rancho Murieta, the most male-oriented occupations are Arts, Media & Entertainment (100.0%), Architecture & Engineering (81.0%), and Computers & Mathematics (80.0%), while the most female-oriented occupations are Life, Physical & Social Science (100.0%), Education, Arts & Media (100.0%), and Legal Services & Support (100.0%).
| Occupation | Male | Female |
| Management | 176 (45.4%) | 212 (54.6%) |
| Business & Financial | 68 (31.3%) | 149 (68.7%) |
| Computers, Engineering & Science | 118 (62.8%) | 70 (37.2%) |
| Computers & Mathematics | 24 (80.0%) | 6 (20.0%) |
| Architecture & Engineering | 94 (81.0%) | 22 (19.0%) |
| Life, Physical & Social Science | 0 (0.0%) | 42 (100.0%) |
| Community & Social Service | 87 (31.2%) | 192 (68.8%) |
| Education, Arts & Media | 0 (0.0%) | 18 (100.0%) |
| Legal Services & Support | 0 (0.0%) | 45 (100.0%) |
| Education Instruction & Library | 41 (24.1%) | 129 (75.9%) |
| Arts, Media & Entertainment | 46 (100.0%) | 0 (0.0%) |
| Health Diagnosing & Treating | 21 (14.5%) | 124 (85.5%) |
| Health Technologists | 21 (14.5%) | 124 (85.5%) |
| Total (Category) | 470 (38.6%) | 747 (61.4%) |
| Total (Overall) | 1,237 (50.7%) | 1,202 (49.3%) |
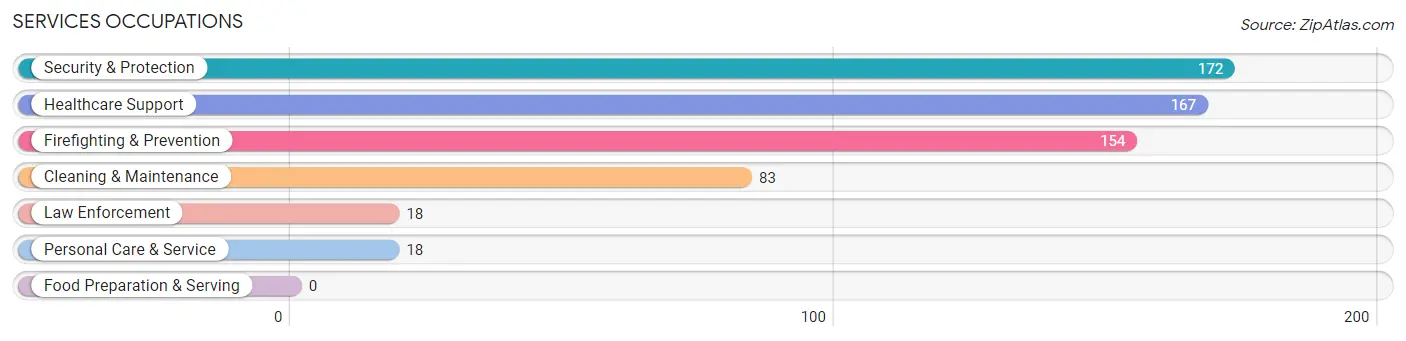
Services Occupations
The most common Services occupations in Rancho Murieta are Security & Protection (172 | 7.0%), Healthcare Support (167 | 6.9%), Firefighting & Prevention (154 | 6.3%), Cleaning & Maintenance (83 | 3.4%), and Law Enforcement (18 | 0.7%).
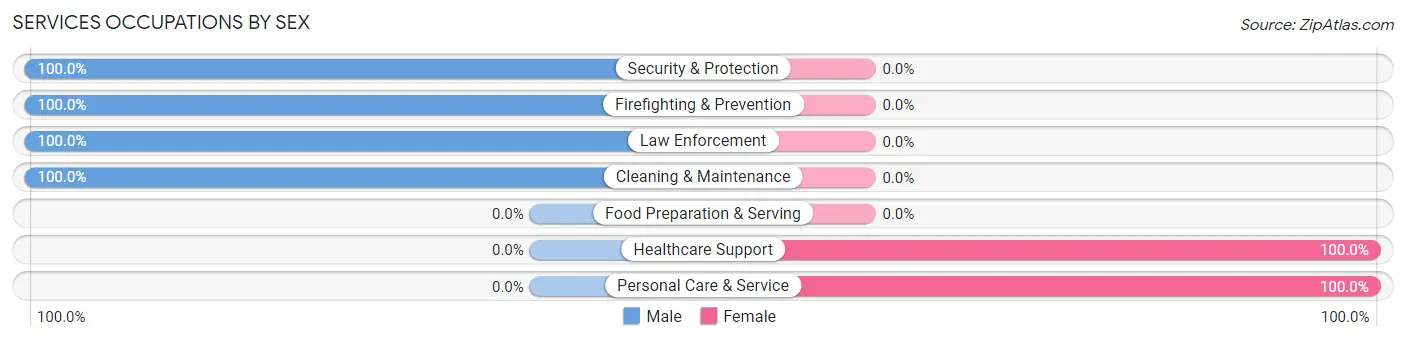
Services Occupations by Sex
Within the Services occupations in Rancho Murieta, the most male-oriented occupations are Security & Protection (100.0%), Firefighting & Prevention (100.0%), and Law Enforcement (100.0%), while the most female-oriented occupations are Healthcare Support (100.0%), and Personal Care & Service (100.0%).
| Occupation | Male | Female |
| Healthcare Support | 0 (0.0%) | 167 (100.0%) |
| Security & Protection | 172 (100.0%) | 0 (0.0%) |
| Firefighting & Prevention | 154 (100.0%) | 0 (0.0%) |
| Law Enforcement | 18 (100.0%) | 0 (0.0%) |
| Food Preparation & Serving | 0 (0.0%) | 0 (0.0%) |
| Cleaning & Maintenance | 83 (100.0%) | 0 (0.0%) |
| Personal Care & Service | 0 (0.0%) | 18 (100.0%) |
| Total (Category) | 255 (58.0%) | 185 (42.0%) |
| Total (Overall) | 1,237 (50.7%) | 1,202 (49.3%) |
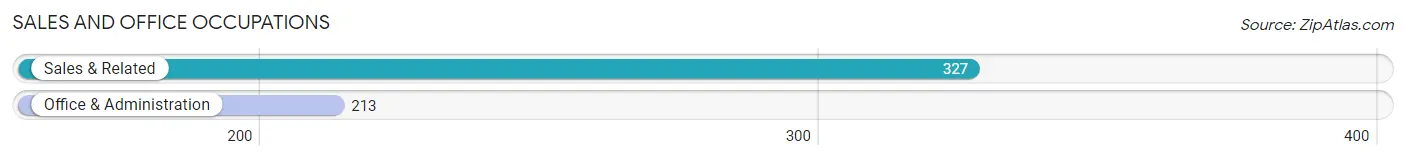
Sales and Office Occupations
The most common Sales and Office occupations in Rancho Murieta are Sales & Related (327 | 13.4%), and Office & Administration (213 | 8.7%).
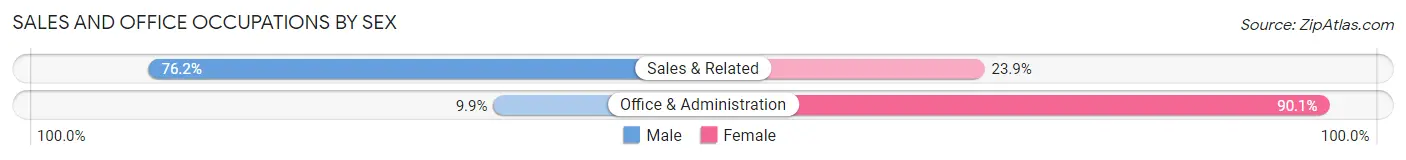
Sales and Office Occupations by Sex
| Occupation | Male | Female |
| Sales & Related | 249 (76.1%) | 78 (23.8%) |
| Office & Administration | 21 (9.9%) | 192 (90.1%) |
| Total (Category) | 270 (50.0%) | 270 (50.0%) |
| Total (Overall) | 1,237 (50.7%) | 1,202 (49.3%) |
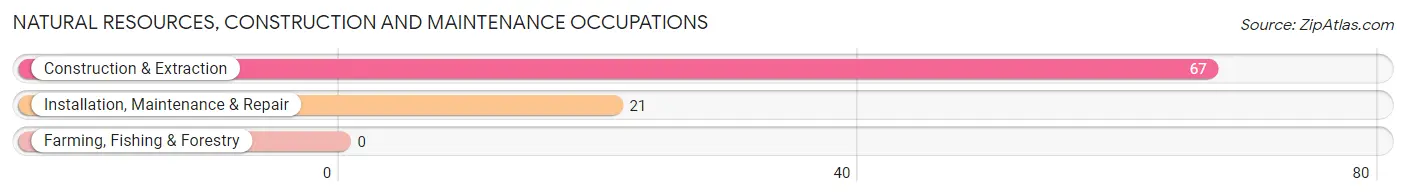
Natural Resources, Construction and Maintenance Occupations
The most common Natural Resources, Construction and Maintenance occupations in Rancho Murieta are Construction & Extraction (67 | 2.8%), and Installation, Maintenance & Repair (21 | 0.9%).
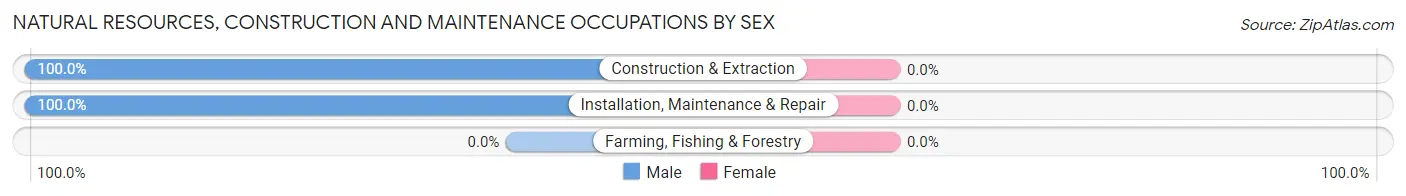
Natural Resources, Construction and Maintenance Occupations by Sex
| Occupation | Male | Female |
| Farming, Fishing & Forestry | 0 (0.0%) | 0 (0.0%) |
| Construction & Extraction | 67 (100.0%) | 0 (0.0%) |
| Installation, Maintenance & Repair | 21 (100.0%) | 0 (0.0%) |
| Total (Category) | 88 (100.0%) | 0 (0.0%) |
| Total (Overall) | 1,237 (50.7%) | 1,202 (49.3%) |
Production, Transportation and Moving Occupations
The most common Production, Transportation and Moving occupations in Rancho Murieta are Transportation (97 | 4.0%), Production (37 | 1.5%), and Material Moving (20 | 0.8%).
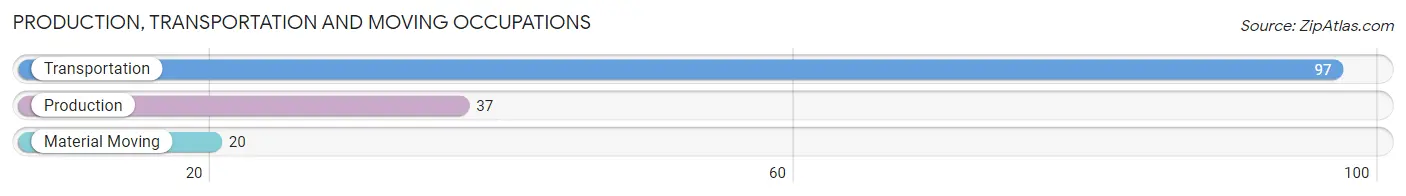
Production, Transportation and Moving Occupations by Sex
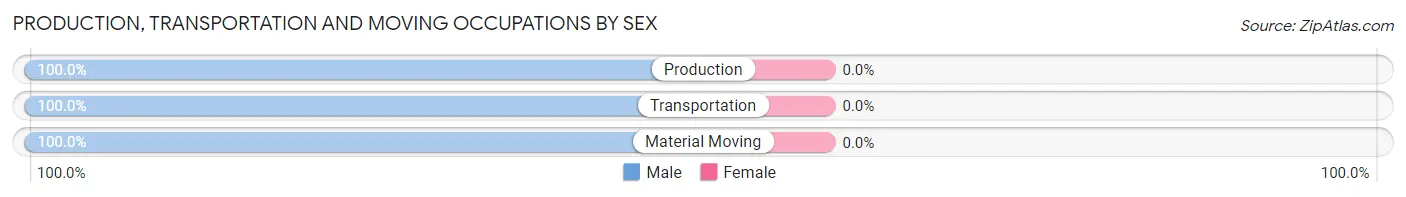
| Occupation | Male | Female |
| Production | 37 (100.0%) | 0 (0.0%) |
| Transportation | 97 (100.0%) | 0 (0.0%) |
| Material Moving | 20 (100.0%) | 0 (0.0%) |
| Total (Category) | 154 (100.0%) | 0 (0.0%) |
| Total (Overall) | 1,237 (50.7%) | 1,202 (49.3%) |
Employment Industries by Sex in Rancho Murieta
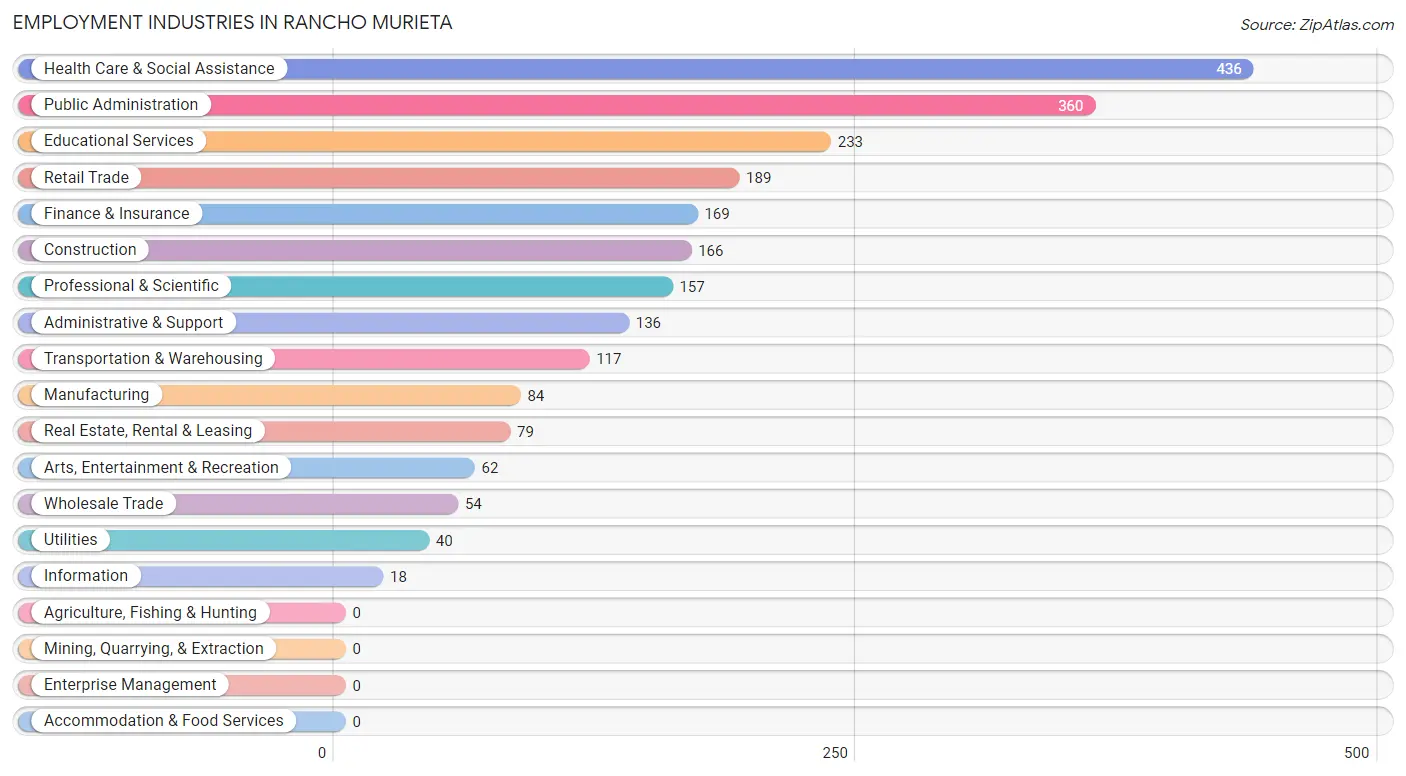
Employment Industries in Rancho Murieta
The major employment industries in Rancho Murieta include Health Care & Social Assistance (436 | 17.9%), Public Administration (360 | 14.8%), Educational Services (233 | 9.6%), Retail Trade (189 | 7.7%), and Finance & Insurance (169 | 6.9%).
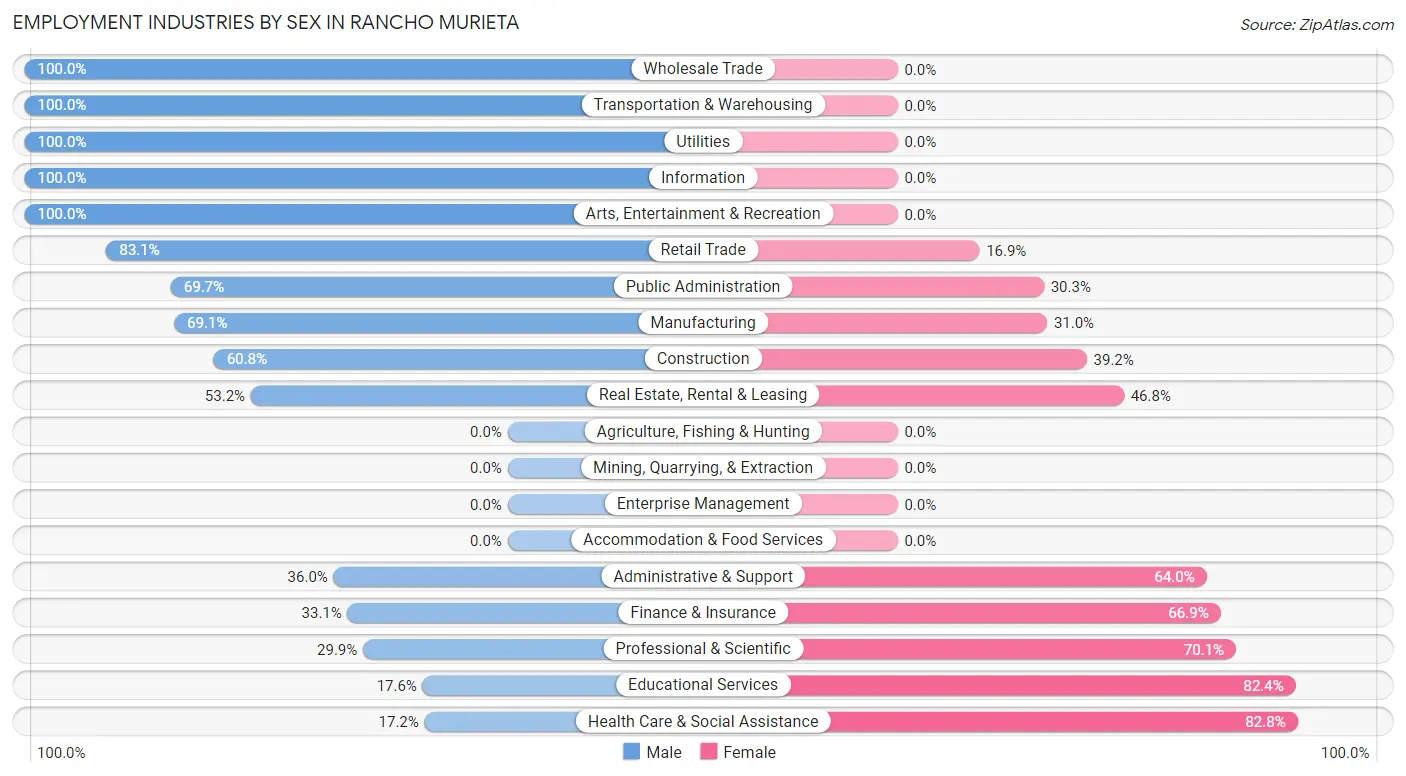
Employment Industries by Sex in Rancho Murieta
The Rancho Murieta industries that see more men than women are Wholesale Trade (100.0%), Transportation & Warehousing (100.0%), and Utilities (100.0%), whereas the industries that tend to have a higher number of women are Health Care & Social Assistance (82.8%), Educational Services (82.4%), and Professional & Scientific (70.1%).
| Industry | Male | Female |
| Agriculture, Fishing & Hunting | 0 (0.0%) | 0 (0.0%) |
| Mining, Quarrying, & Extraction | 0 (0.0%) | 0 (0.0%) |
| Construction | 101 (60.8%) | 65 (39.2%) |
| Manufacturing | 58 (69.1%) | 26 (30.9%) |
| Wholesale Trade | 54 (100.0%) | 0 (0.0%) |
| Retail Trade | 157 (83.1%) | 32 (16.9%) |
| Transportation & Warehousing | 117 (100.0%) | 0 (0.0%) |
| Utilities | 40 (100.0%) | 0 (0.0%) |
| Information | 18 (100.0%) | 0 (0.0%) |
| Finance & Insurance | 56 (33.1%) | 113 (66.9%) |
| Real Estate, Rental & Leasing | 42 (53.2%) | 37 (46.8%) |
| Professional & Scientific | 47 (29.9%) | 110 (70.1%) |
| Enterprise Management | 0 (0.0%) | 0 (0.0%) |
| Administrative & Support | 49 (36.0%) | 87 (64.0%) |
| Educational Services | 41 (17.6%) | 192 (82.4%) |
| Health Care & Social Assistance | 75 (17.2%) | 361 (82.8%) |
| Arts, Entertainment & Recreation | 62 (100.0%) | 0 (0.0%) |
| Accommodation & Food Services | 0 (0.0%) | 0 (0.0%) |
| Public Administration | 251 (69.7%) | 109 (30.3%) |
| Total | 1,237 (50.7%) | 1,202 (49.3%) |
Education in Rancho Murieta
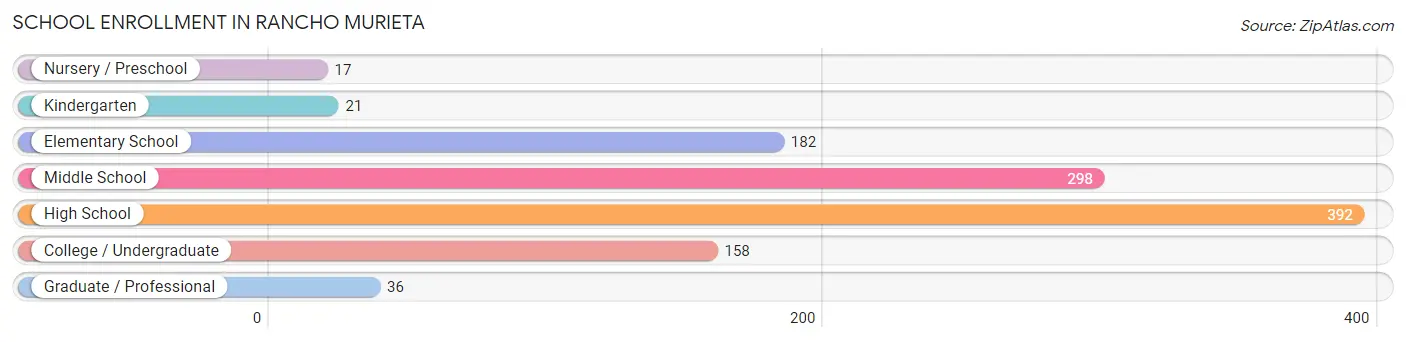
School Enrollment in Rancho Murieta
The most common levels of schooling among the 1,104 students in Rancho Murieta are high school (392 | 35.5%), middle school (298 | 27.0%), and elementary school (182 | 16.5%).
| School Level | # Students | % Students |
| Nursery / Preschool | 17 | 1.5% |
| Kindergarten | 21 | 1.9% |
| Elementary School | 182 | 16.5% |
| Middle School | 298 | 27.0% |
| High School | 392 | 35.5% |
| College / Undergraduate | 158 | 14.3% |
| Graduate / Professional | 36 | 3.3% |
| Total | 1,104 | 100.0% |
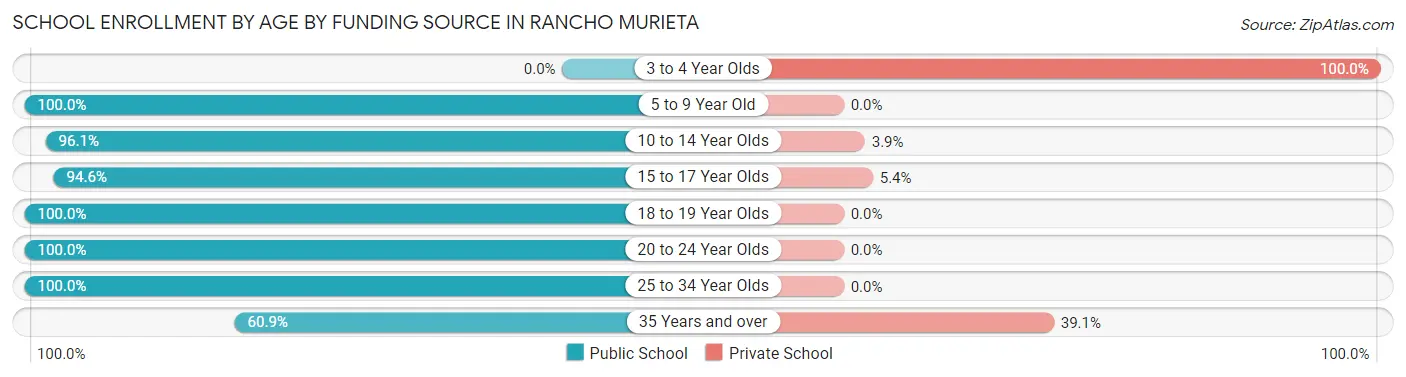
School Enrollment by Age by Funding Source in Rancho Murieta
Out of a total of 1,104 students who are enrolled in schools in Rancho Murieta, 71 (6.4%) attend a private institution, while the remaining 1,033 (93.6%) are enrolled in public schools. The age group of 3 to 4 year olds has the highest likelihood of being enrolled in private schools, with 17 (100.0% in the age bracket) enrolled. Conversely, the age group of 5 to 9 year old has the lowest likelihood of being enrolled in a private school, with 81 (100.0% in the age bracket) attending a public institution.
| Age Bracket | Public School | Private School |
| 3 to 4 Year Olds | 0 (0.0%) | 17 (100.0%) |
| 5 to 9 Year Old | 81 (100.0%) | 0 (0.0%) |
| 10 to 14 Year Olds | 514 (96.1%) | 21 (3.9%) |
| 15 to 17 Year Olds | 262 (94.6%) | 15 (5.4%) |
| 18 to 19 Year Olds | 32 (100.0%) | 0 (0.0%) |
| 20 to 24 Year Olds | 98 (100.0%) | 0 (0.0%) |
| 25 to 34 Year Olds | 18 (100.0%) | 0 (0.0%) |
| 35 Years and over | 28 (60.9%) | 18 (39.1%) |
| Total | 1,033 (93.6%) | 71 (6.4%) |
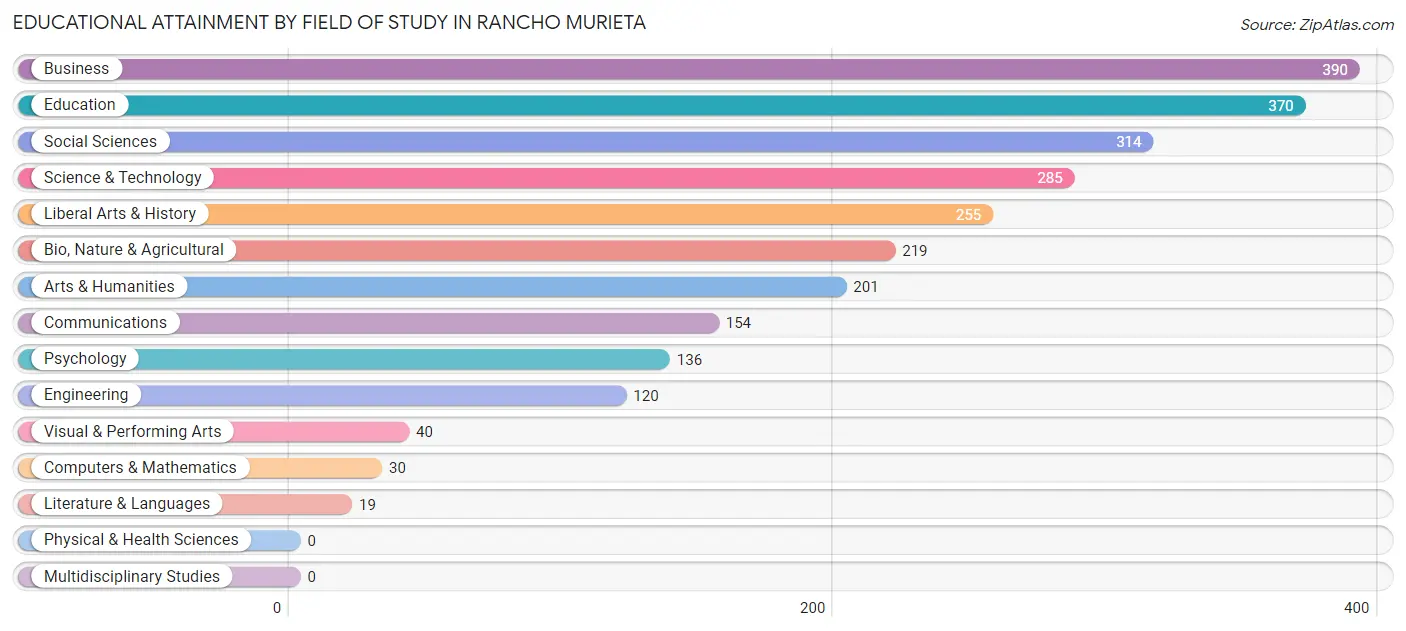
Educational Attainment by Field of Study in Rancho Murieta
Business (390 | 15.4%), education (370 | 14.6%), social sciences (314 | 12.4%), science & technology (285 | 11.3%), and liberal arts & history (255 | 10.1%) are the most common fields of study among 2,533 individuals in Rancho Murieta who have obtained a bachelor's degree or higher.
| Field of Study | # Graduates | % Graduates |
| Computers & Mathematics | 30 | 1.2% |
| Bio, Nature & Agricultural | 219 | 8.6% |
| Physical & Health Sciences | 0 | 0.0% |
| Psychology | 136 | 5.4% |
| Social Sciences | 314 | 12.4% |
| Engineering | 120 | 4.7% |
| Multidisciplinary Studies | 0 | 0.0% |
| Science & Technology | 285 | 11.3% |
| Business | 390 | 15.4% |
| Education | 370 | 14.6% |
| Literature & Languages | 19 | 0.7% |
| Liberal Arts & History | 255 | 10.1% |
| Visual & Performing Arts | 40 | 1.6% |
| Communications | 154 | 6.1% |
| Arts & Humanities | 201 | 7.9% |
| Total | 2,533 | 100.0% |
Transportation & Commute in Rancho Murieta
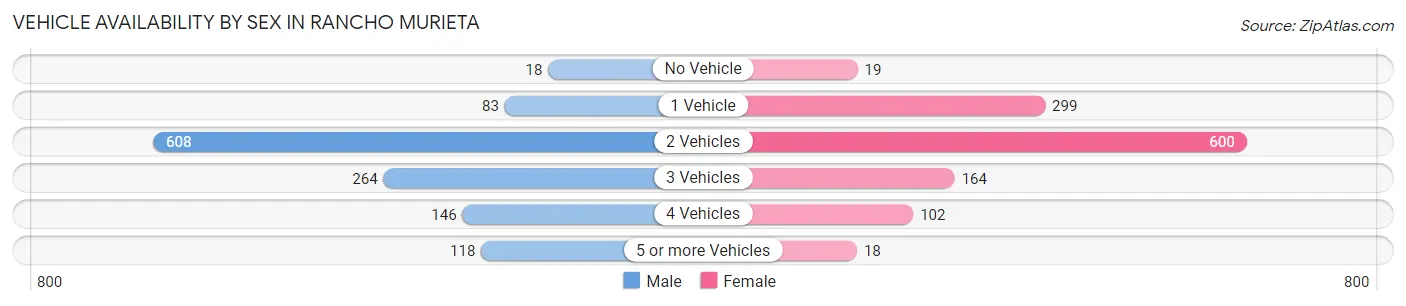
Vehicle Availability by Sex in Rancho Murieta
The most prevalent vehicle ownership categories in Rancho Murieta are males with 2 vehicles (608, accounting for 49.1%) and females with 2 vehicles (600, making up 50.6%).
| Vehicles Available | Male | Female |
| No Vehicle | 18 (1.5%) | 19 (1.6%) |
| 1 Vehicle | 83 (6.7%) | 299 (24.9%) |
| 2 Vehicles | 608 (49.1%) | 600 (49.9%) |
| 3 Vehicles | 264 (21.3%) | 164 (13.6%) |
| 4 Vehicles | 146 (11.8%) | 102 (8.5%) |
| 5 or more Vehicles | 118 (9.5%) | 18 (1.5%) |
| Total | 1,237 (100.0%) | 1,202 (100.0%) |
Commute Time in Rancho Murieta
The most frequently occuring commute durations in Rancho Murieta are 30 to 34 minutes (630 commuters, 31.1%), 45 to 59 minutes (437 commuters, 21.6%), and 90 or more minutes (220 commuters, 10.9%).
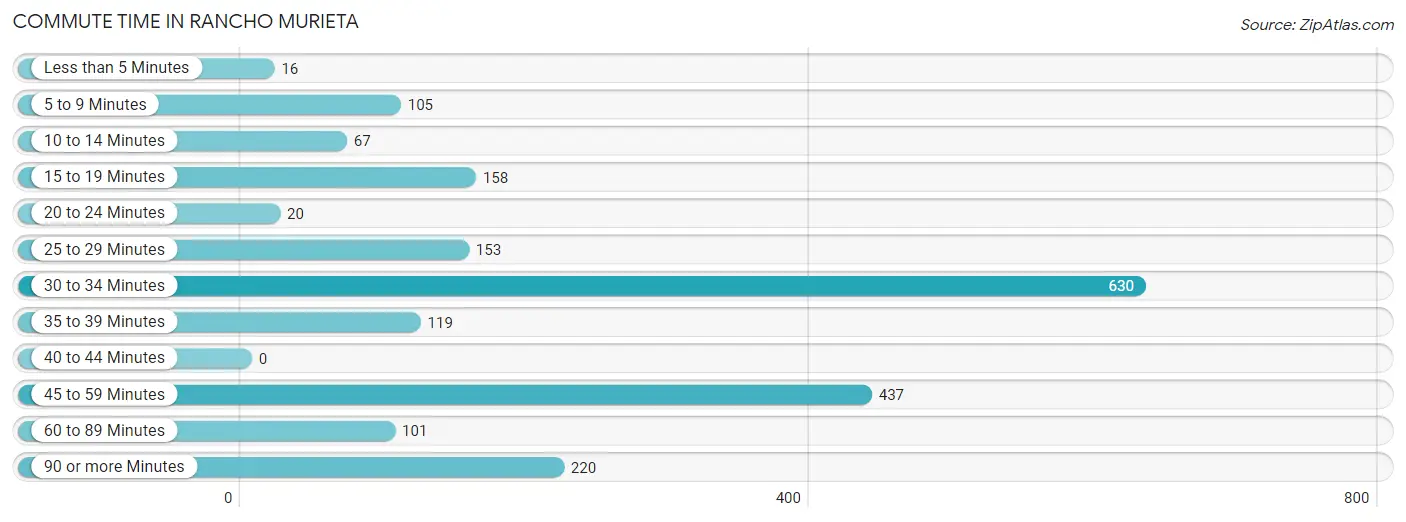
| Commute Time | # Commuters | % Commuters |
| Less than 5 Minutes | 16 | 0.8% |
| 5 to 9 Minutes | 105 | 5.2% |
| 10 to 14 Minutes | 67 | 3.3% |
| 15 to 19 Minutes | 158 | 7.8% |
| 20 to 24 Minutes | 20 | 1.0% |
| 25 to 29 Minutes | 153 | 7.5% |
| 30 to 34 Minutes | 630 | 31.1% |
| 35 to 39 Minutes | 119 | 5.9% |
| 40 to 44 Minutes | 0 | 0.0% |
| 45 to 59 Minutes | 437 | 21.6% |
| 60 to 89 Minutes | 101 | 5.0% |
| 90 or more Minutes | 220 | 10.9% |
Commute Time by Sex in Rancho Murieta
The most common commute times in Rancho Murieta are 30 to 34 minutes (258 commuters, 24.0%) for males and 30 to 34 minutes (372 commuters, 39.0%) for females.
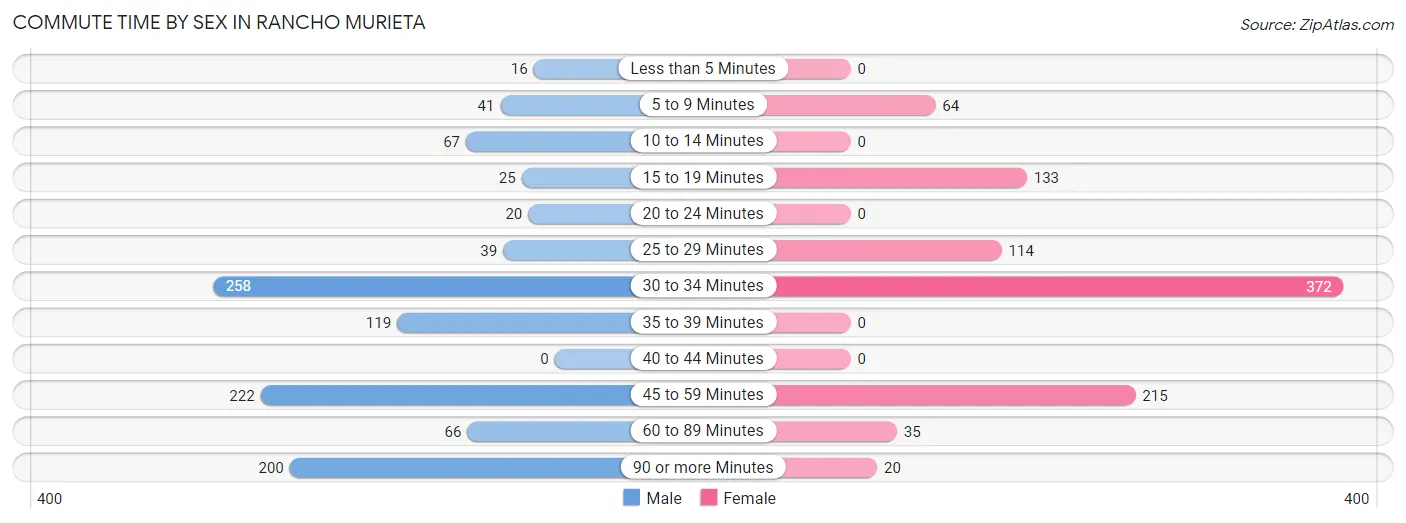
| Commute Time | Male | Female |
| Less than 5 Minutes | 16 (1.5%) | 0 (0.0%) |
| 5 to 9 Minutes | 41 (3.8%) | 64 (6.7%) |
| 10 to 14 Minutes | 67 (6.2%) | 0 (0.0%) |
| 15 to 19 Minutes | 25 (2.3%) | 133 (14.0%) |
| 20 to 24 Minutes | 20 (1.9%) | 0 (0.0%) |
| 25 to 29 Minutes | 39 (3.6%) | 114 (12.0%) |
| 30 to 34 Minutes | 258 (24.0%) | 372 (39.0%) |
| 35 to 39 Minutes | 119 (11.1%) | 0 (0.0%) |
| 40 to 44 Minutes | 0 (0.0%) | 0 (0.0%) |
| 45 to 59 Minutes | 222 (20.7%) | 215 (22.6%) |
| 60 to 89 Minutes | 66 (6.1%) | 35 (3.7%) |
| 90 or more Minutes | 200 (18.6%) | 20 (2.1%) |
Time of Departure to Work by Sex in Rancho Murieta
The most frequent times of departure to work in Rancho Murieta are 12:00 AM to 4:59 AM (177, 16.5%) for males and 7:00 AM to 7:29 AM (246, 25.8%) for females.
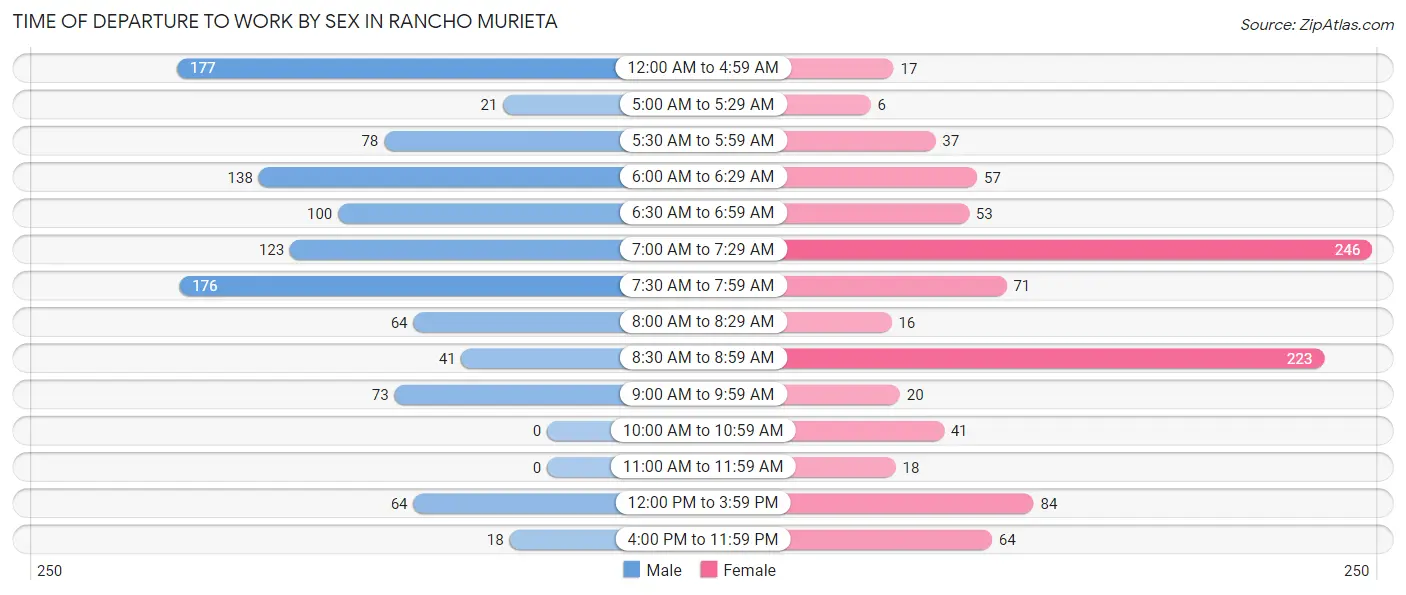
| Time of Departure | Male | Female |
| 12:00 AM to 4:59 AM | 177 (16.5%) | 17 (1.8%) |
| 5:00 AM to 5:29 AM | 21 (2.0%) | 6 (0.6%) |
| 5:30 AM to 5:59 AM | 78 (7.3%) | 37 (3.9%) |
| 6:00 AM to 6:29 AM | 138 (12.9%) | 57 (6.0%) |
| 6:30 AM to 6:59 AM | 100 (9.3%) | 53 (5.6%) |
| 7:00 AM to 7:29 AM | 123 (11.5%) | 246 (25.8%) |
| 7:30 AM to 7:59 AM | 176 (16.4%) | 71 (7.4%) |
| 8:00 AM to 8:29 AM | 64 (6.0%) | 16 (1.7%) |
| 8:30 AM to 8:59 AM | 41 (3.8%) | 223 (23.4%) |
| 9:00 AM to 9:59 AM | 73 (6.8%) | 20 (2.1%) |
| 10:00 AM to 10:59 AM | 0 (0.0%) | 41 (4.3%) |
| 11:00 AM to 11:59 AM | 0 (0.0%) | 18 (1.9%) |
| 12:00 PM to 3:59 PM | 64 (6.0%) | 84 (8.8%) |
| 4:00 PM to 11:59 PM | 18 (1.7%) | 64 (6.7%) |
| Total | 1,073 (100.0%) | 953 (100.0%) |
Housing Occupancy in Rancho Murieta
Occupancy by Ownership in Rancho Murieta
Of the total 2,439 dwellings in Rancho Murieta, owner-occupied units account for 2,227 (91.3%), while renter-occupied units make up 212 (8.7%).
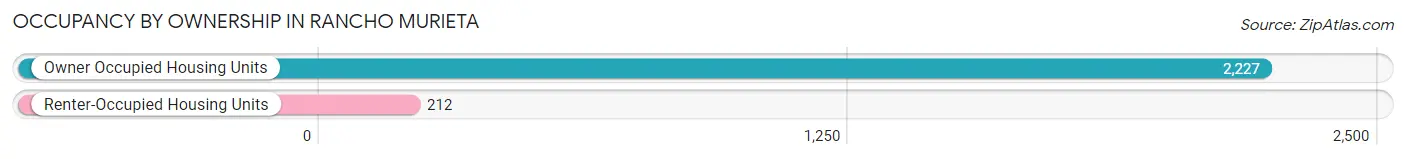
| Occupancy | # Housing Units | % Housing Units |
| Owner Occupied Housing Units | 2,227 | 91.3% |
| Renter-Occupied Housing Units | 212 | 8.7% |
| Total Occupied Housing Units | 2,439 | 100.0% |
Occupancy by Household Size in Rancho Murieta
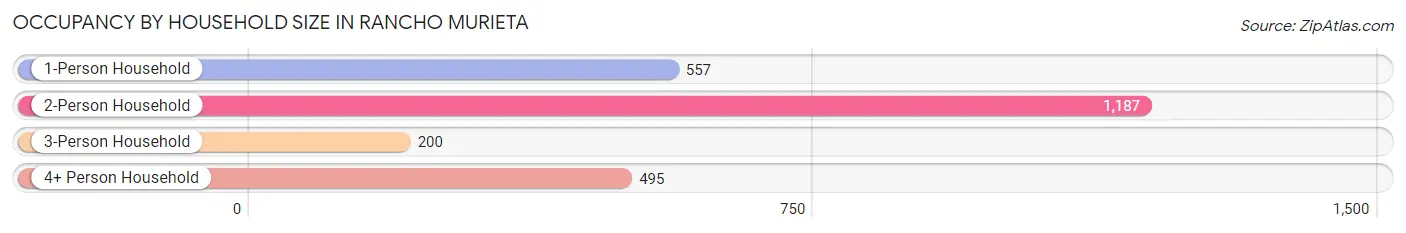
| Household Size | # Housing Units | % Housing Units |
| 1-Person Household | 557 | 22.8% |
| 2-Person Household | 1,187 | 48.7% |
| 3-Person Household | 200 | 8.2% |
| 4+ Person Household | 495 | 20.3% |
| Total Housing Units | 2,439 | 100.0% |
Occupancy by Ownership by Household Size in Rancho Murieta
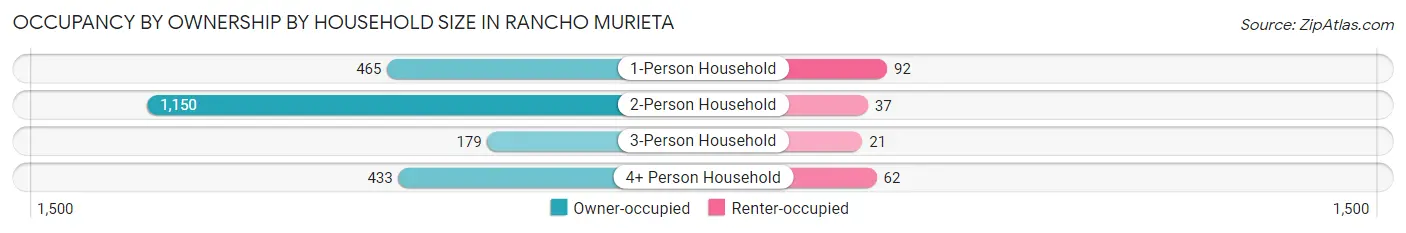
| Household Size | Owner-occupied | Renter-occupied |
| 1-Person Household | 465 (83.5%) | 92 (16.5%) |
| 2-Person Household | 1,150 (96.9%) | 37 (3.1%) |
| 3-Person Household | 179 (89.5%) | 21 (10.5%) |
| 4+ Person Household | 433 (87.5%) | 62 (12.5%) |
| Total Housing Units | 2,227 (91.3%) | 212 (8.7%) |
Occupancy by Educational Attainment in Rancho Murieta
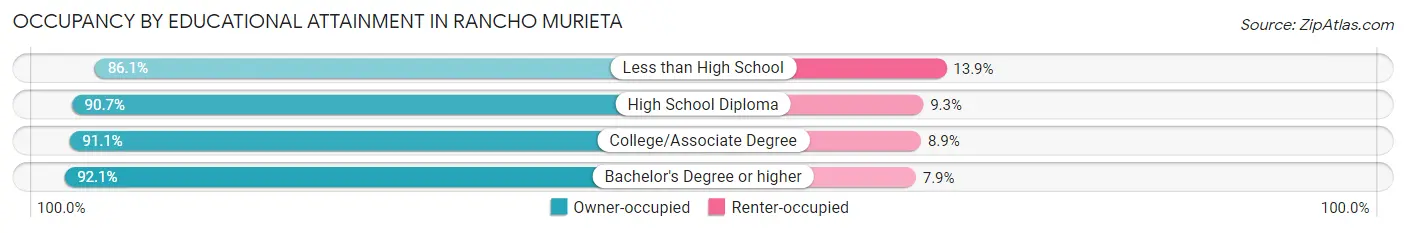
| Household Size | Owner-occupied | Renter-occupied |
| Less than High School | 130 (86.1%) | 21 (13.9%) |
| High School Diploma | 175 (90.7%) | 18 (9.3%) |
| College/Associate Degree | 738 (91.1%) | 72 (8.9%) |
| Bachelor's Degree or higher | 1,184 (92.1%) | 101 (7.9%) |
Occupancy by Age of Householder in Rancho Murieta
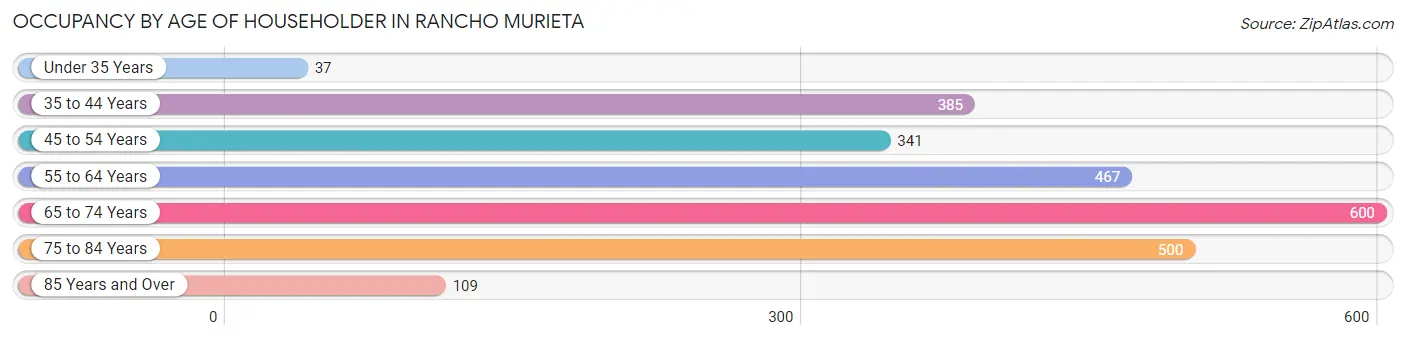
| Age Bracket | # Households | % Households |
| Under 35 Years | 37 | 1.5% |
| 35 to 44 Years | 385 | 15.8% |
| 45 to 54 Years | 341 | 14.0% |
| 55 to 64 Years | 467 | 19.2% |
| 65 to 74 Years | 600 | 24.6% |
| 75 to 84 Years | 500 | 20.5% |
| 85 Years and Over | 109 | 4.5% |
| Total | 2,439 | 100.0% |
Housing Finances in Rancho Murieta
Median Income by Occupancy in Rancho Murieta
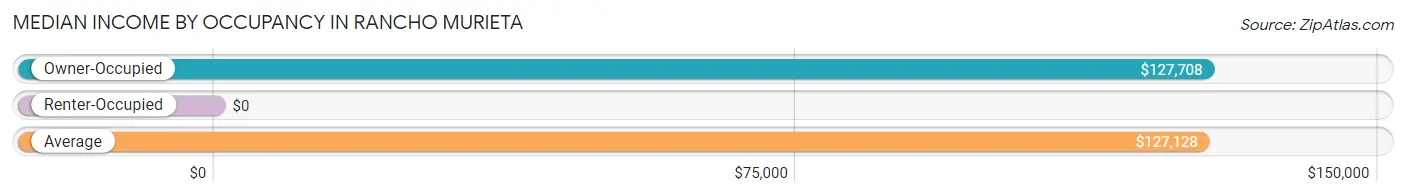
| Occupancy Type | # Households | Median Income |
| Owner-Occupied | 2,227 (91.3%) | $127,708 |
| Renter-Occupied | 212 (8.7%) | $0 |
| Average | 2,439 (100.0%) | $127,128 |
Occupancy by Householder Income Bracket in Rancho Murieta
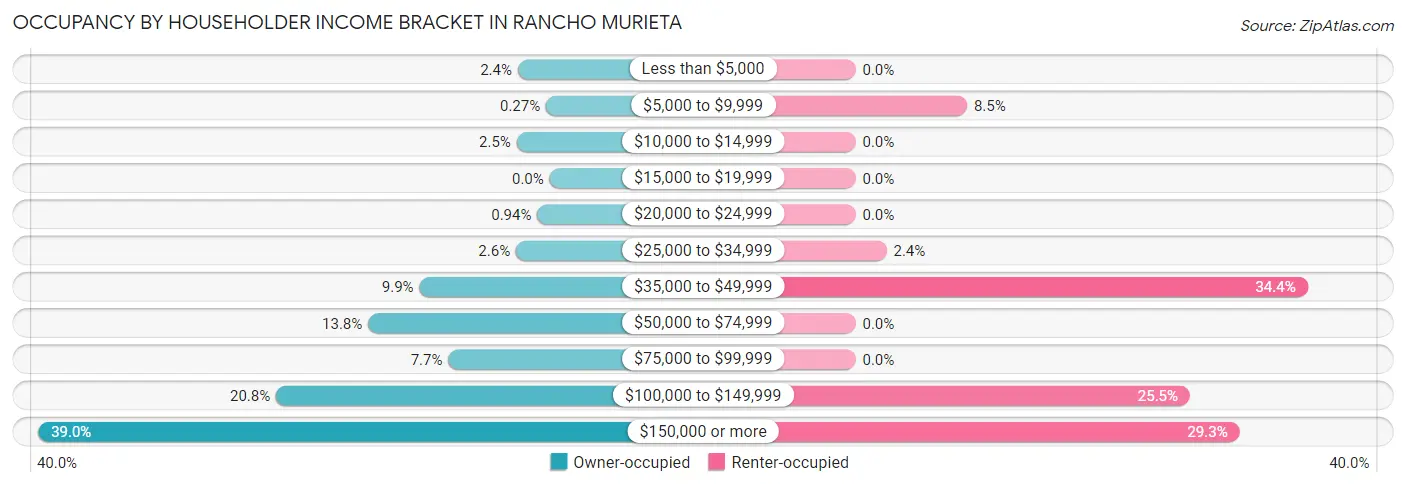
| Income Bracket | Owner-occupied | Renter-occupied |
| Less than $5,000 | 54 (2.4%) | 0 (0.0%) |
| $5,000 to $9,999 | 6 (0.3%) | 18 (8.5%) |
| $10,000 to $14,999 | 56 (2.5%) | 0 (0.0%) |
| $15,000 to $19,999 | 0 (0.0%) | 0 (0.0%) |
| $20,000 to $24,999 | 21 (0.9%) | 0 (0.0%) |
| $25,000 to $34,999 | 57 (2.6%) | 5 (2.4%) |
| $35,000 to $49,999 | 221 (9.9%) | 73 (34.4%) |
| $50,000 to $74,999 | 308 (13.8%) | 0 (0.0%) |
| $75,000 to $99,999 | 172 (7.7%) | 0 (0.0%) |
| $100,000 to $149,999 | 464 (20.8%) | 54 (25.5%) |
| $150,000 or more | 868 (39.0%) | 62 (29.2%) |
| Total | 2,227 (100.0%) | 212 (100.0%) |
Monthly Housing Cost Tiers in Rancho Murieta
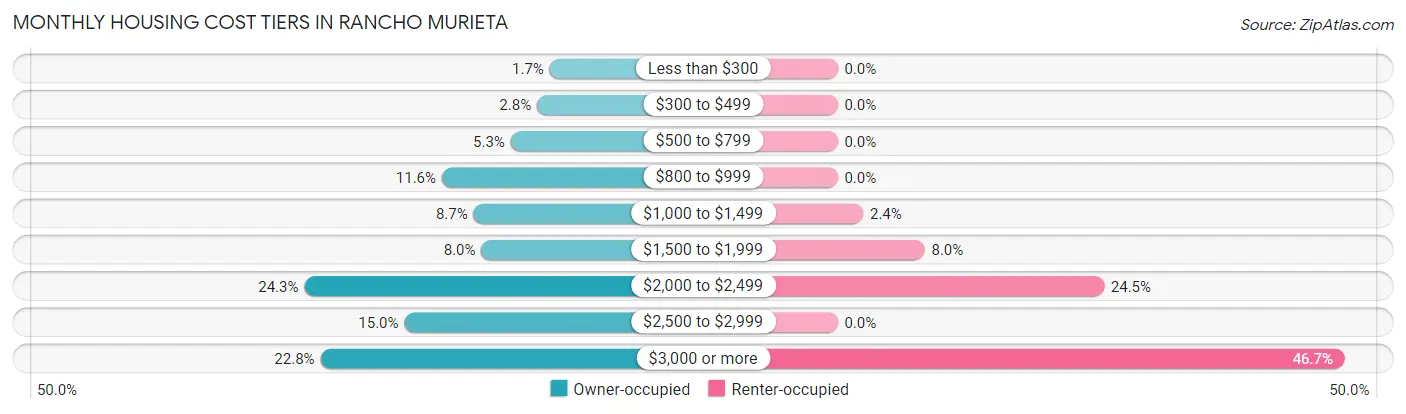
| Monthly Cost | Owner-occupied | Renter-occupied |
| Less than $300 | 37 (1.7%) | 0 (0.0%) |
| $300 to $499 | 63 (2.8%) | 0 (0.0%) |
| $500 to $799 | 117 (5.2%) | 0 (0.0%) |
| $800 to $999 | 258 (11.6%) | 0 (0.0%) |
| $1,000 to $1,499 | 193 (8.7%) | 5 (2.4%) |
| $1,500 to $1,999 | 177 (8.0%) | 17 (8.0%) |
| $2,000 to $2,499 | 540 (24.2%) | 52 (24.5%) |
| $2,500 to $2,999 | 335 (15.0%) | 0 (0.0%) |
| $3,000 or more | 507 (22.8%) | 99 (46.7%) |
| Total | 2,227 (100.0%) | 212 (100.0%) |
Physical Housing Characteristics in Rancho Murieta
Housing Structures in Rancho Murieta
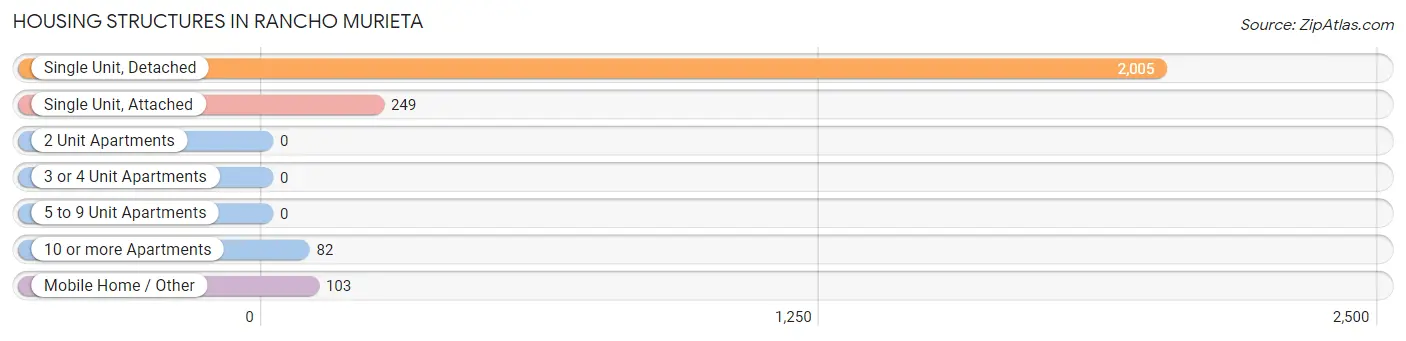
| Structure Type | # Housing Units | % Housing Units |
| Single Unit, Detached | 2,005 | 82.2% |
| Single Unit, Attached | 249 | 10.2% |
| 2 Unit Apartments | 0 | 0.0% |
| 3 or 4 Unit Apartments | 0 | 0.0% |
| 5 to 9 Unit Apartments | 0 | 0.0% |
| 10 or more Apartments | 82 | 3.4% |
| Mobile Home / Other | 103 | 4.2% |
| Total | 2,439 | 100.0% |
Housing Structures by Occupancy in Rancho Murieta
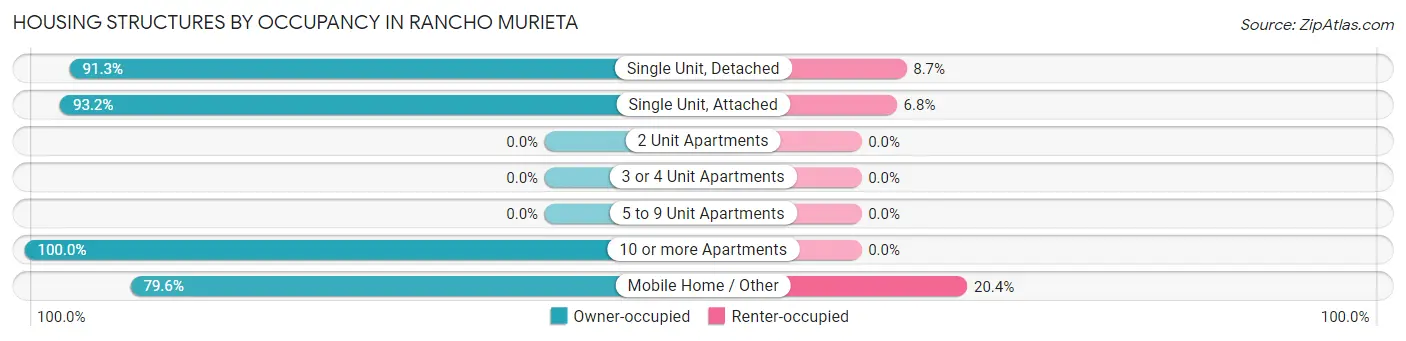
| Structure Type | Owner-occupied | Renter-occupied |
| Single Unit, Detached | 1,831 (91.3%) | 174 (8.7%) |
| Single Unit, Attached | 232 (93.2%) | 17 (6.8%) |
| 2 Unit Apartments | 0 (0.0%) | 0 (0.0%) |
| 3 or 4 Unit Apartments | 0 (0.0%) | 0 (0.0%) |
| 5 to 9 Unit Apartments | 0 (0.0%) | 0 (0.0%) |
| 10 or more Apartments | 82 (100.0%) | 0 (0.0%) |
| Mobile Home / Other | 82 (79.6%) | 21 (20.4%) |
| Total | 2,227 (91.3%) | 212 (8.7%) |
Housing Structures by Number of Rooms in Rancho Murieta
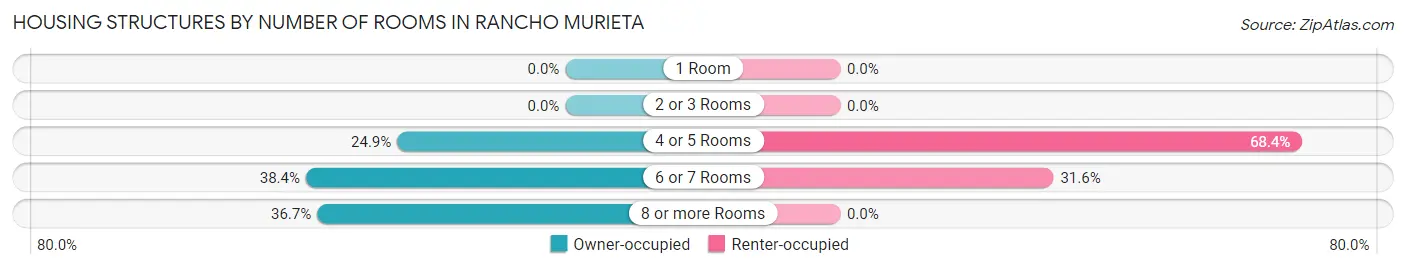
| Number of Rooms | Owner-occupied | Renter-occupied |
| 1 Room | 0 (0.0%) | 0 (0.0%) |
| 2 or 3 Rooms | 0 (0.0%) | 0 (0.0%) |
| 4 or 5 Rooms | 554 (24.9%) | 145 (68.4%) |
| 6 or 7 Rooms | 855 (38.4%) | 67 (31.6%) |
| 8 or more Rooms | 818 (36.7%) | 0 (0.0%) |
| Total | 2,227 (100.0%) | 212 (100.0%) |
Housing Structure by Heating Type in Rancho Murieta
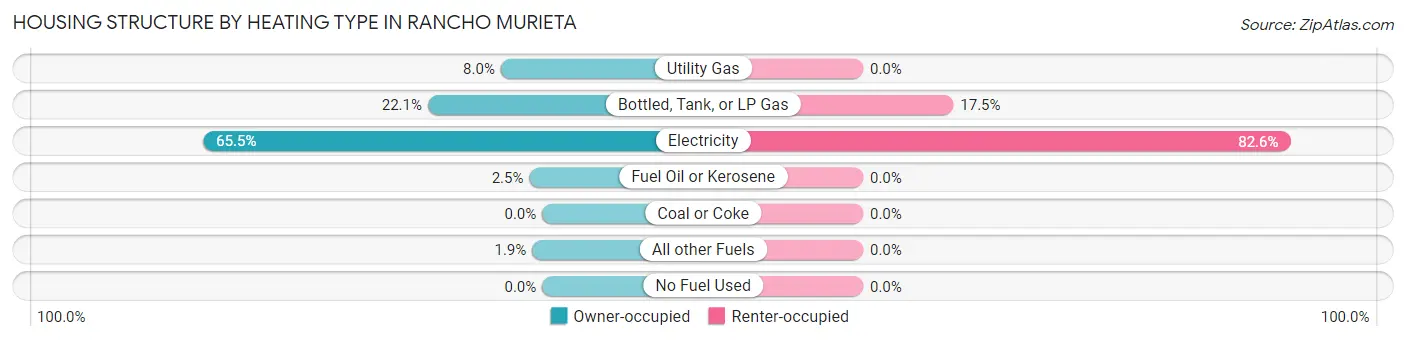
| Heating Type | Owner-occupied | Renter-occupied |
| Utility Gas | 178 (8.0%) | 0 (0.0%) |
| Bottled, Tank, or LP Gas | 492 (22.1%) | 37 (17.4%) |
| Electricity | 1,459 (65.5%) | 175 (82.6%) |
| Fuel Oil or Kerosene | 55 (2.5%) | 0 (0.0%) |
| Coal or Coke | 0 (0.0%) | 0 (0.0%) |
| All other Fuels | 43 (1.9%) | 0 (0.0%) |
| No Fuel Used | 0 (0.0%) | 0 (0.0%) |
| Total | 2,227 (100.0%) | 212 (100.0%) |
Household Vehicle Usage in Rancho Murieta
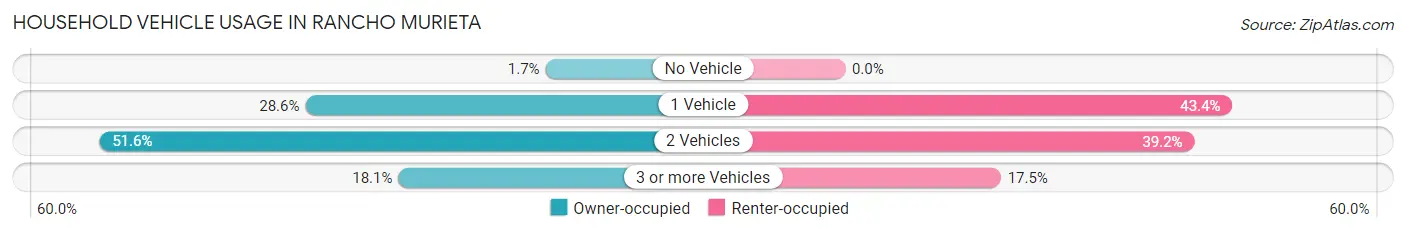
| Vehicles per Household | Owner-occupied | Renter-occupied |
| No Vehicle | 37 (1.7%) | 0 (0.0%) |
| 1 Vehicle | 636 (28.6%) | 92 (43.4%) |
| 2 Vehicles | 1,150 (51.6%) | 83 (39.2%) |
| 3 or more Vehicles | 404 (18.1%) | 37 (17.4%) |
| Total | 2,227 (100.0%) | 212 (100.0%) |
Real Estate & Mortgages in Rancho Murieta
Real Estate and Mortgage Overview in Rancho Murieta
| Characteristic | Without Mortgage | With Mortgage |
| Housing Units | 540 | 1,687 |
| Median Property Value | $498,100 | $628,600 |
| Median Household Income | $67,828 | $820 |
| Monthly Housing Costs | $845 | $489 |
| Real Estate Taxes | $3,237 | $0 |
Property Value by Mortgage Status in Rancho Murieta
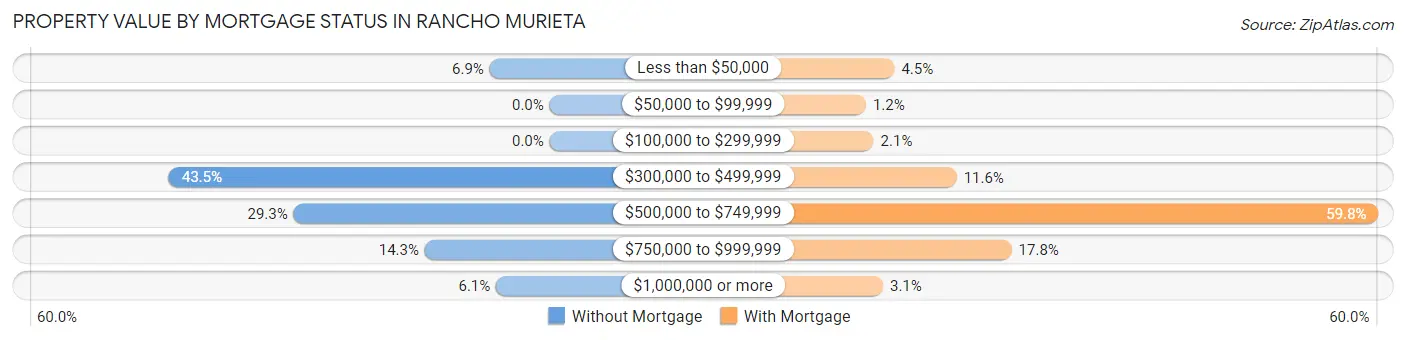
| Property Value | Without Mortgage | With Mortgage |
| Less than $50,000 | 37 (6.9%) | 75 (4.4%) |
| $50,000 to $99,999 | 0 (0.0%) | 20 (1.2%) |
| $100,000 to $299,999 | 0 (0.0%) | 35 (2.1%) |
| $300,000 to $499,999 | 235 (43.5%) | 195 (11.6%) |
| $500,000 to $749,999 | 158 (29.3%) | 1,008 (59.8%) |
| $750,000 to $999,999 | 77 (14.3%) | 301 (17.8%) |
| $1,000,000 or more | 33 (6.1%) | 53 (3.1%) |
| Total | 540 (100.0%) | 1,687 (100.0%) |
Household Income by Mortgage Status in Rancho Murieta
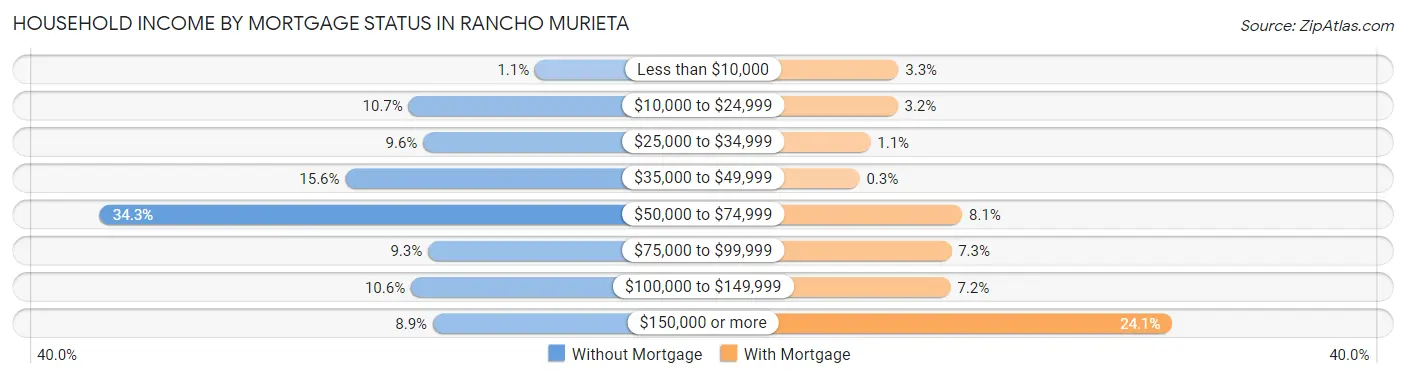
| Household Income | Without Mortgage | With Mortgage |
| Less than $10,000 | 6 (1.1%) | 55 (3.3%) |
| $10,000 to $24,999 | 58 (10.7%) | 54 (3.2%) |
| $25,000 to $34,999 | 52 (9.6%) | 19 (1.1%) |
| $35,000 to $49,999 | 84 (15.6%) | 5 (0.3%) |
| $50,000 to $74,999 | 185 (34.3%) | 137 (8.1%) |
| $75,000 to $99,999 | 50 (9.3%) | 123 (7.3%) |
| $100,000 to $149,999 | 57 (10.6%) | 122 (7.2%) |
| $150,000 or more | 48 (8.9%) | 407 (24.1%) |
| Total | 540 (100.0%) | 1,687 (100.0%) |
Property Value to Household Income Ratio in Rancho Murieta
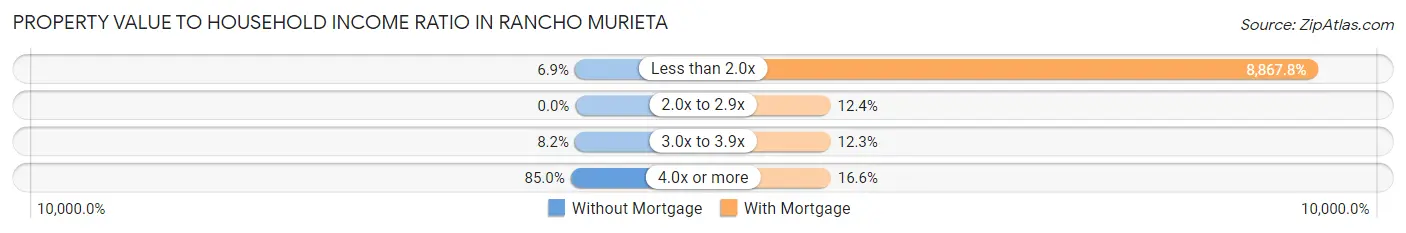
| Value-to-Income Ratio | Without Mortgage | With Mortgage |
| Less than 2.0x | 37 (6.9%) | 149,600 (8,867.8%) |
| 2.0x to 2.9x | 0 (0.0%) | 209 (12.4%) |
| 3.0x to 3.9x | 44 (8.2%) | 208 (12.3%) |
| 4.0x or more | 459 (85.0%) | 280 (16.6%) |
| Total | 540 (100.0%) | 1,687 (100.0%) |
Real Estate Taxes by Mortgage Status in Rancho Murieta
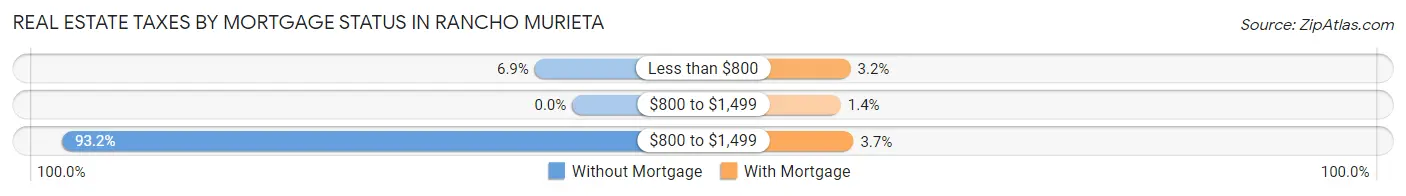
| Property Taxes | Without Mortgage | With Mortgage |
| Less than $800 | 37 (6.9%) | 54 (3.2%) |
| $800 to $1,499 | 0 (0.0%) | 24 (1.4%) |
| $800 to $1,499 | 503 (93.1%) | 63 (3.7%) |
| Total | 540 (100.0%) | 1,687 (100.0%) |
Health & Disability in Rancho Murieta
Health Insurance Coverage by Age in Rancho Murieta
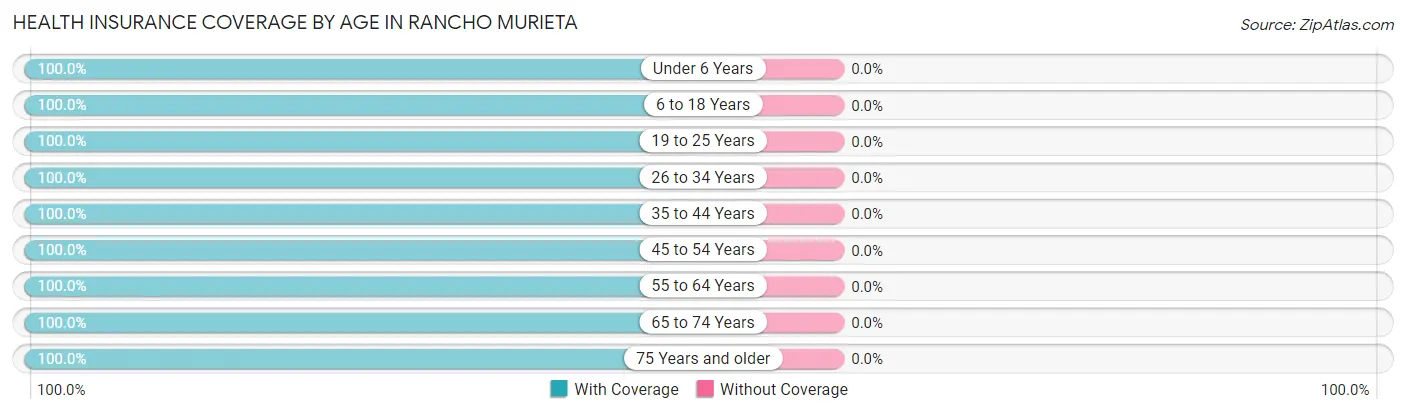
| Age Bracket | With Coverage | Without Coverage |
| Under 6 Years | 246 (100.0%) | 0 (0.0%) |
| 6 to 18 Years | 872 (100.0%) | 0 (0.0%) |
| 19 to 25 Years | 246 (100.0%) | 0 (0.0%) |
| 26 to 34 Years | 209 (100.0%) | 0 (0.0%) |
| 35 to 44 Years | 580 (100.0%) | 0 (0.0%) |
| 45 to 54 Years | 566 (100.0%) | 0 (0.0%) |
| 55 to 64 Years | 1,056 (100.0%) | 0 (0.0%) |
| 65 to 74 Years | 1,017 (100.0%) | 0 (0.0%) |
| 75 Years and older | 936 (100.0%) | 0 (0.0%) |
| Total | 5,728 (100.0%) | 0 (0.0%) |
Health Insurance Coverage by Citizenship Status in Rancho Murieta
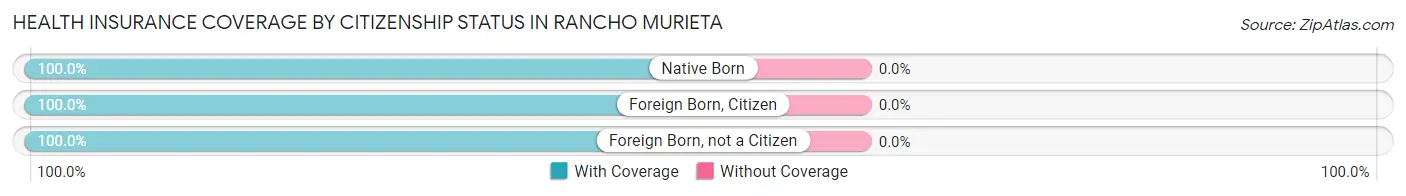
| Citizenship Status | With Coverage | Without Coverage |
| Native Born | 246 (100.0%) | 0 (0.0%) |
| Foreign Born, Citizen | 872 (100.0%) | 0 (0.0%) |
| Foreign Born, not a Citizen | 246 (100.0%) | 0 (0.0%) |
Health Insurance Coverage by Household Income in Rancho Murieta
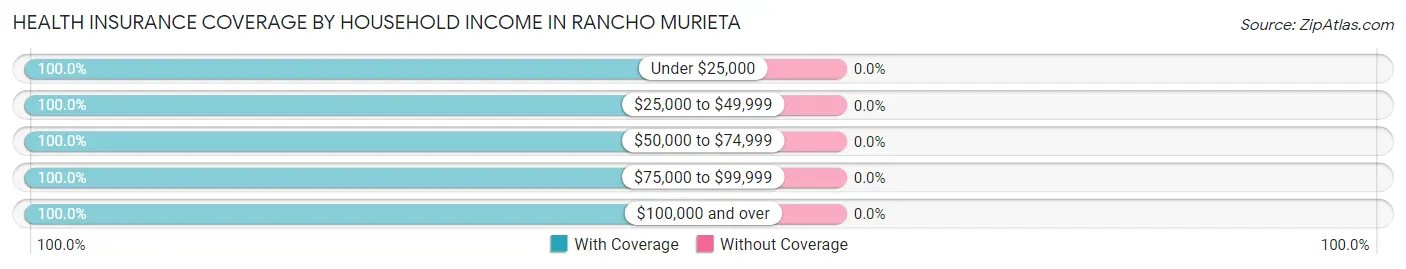
| Household Income | With Coverage | Without Coverage |
| Under $25,000 | 240 (100.0%) | 0 (0.0%) |
| $25,000 to $49,999 | 551 (100.0%) | 0 (0.0%) |
| $50,000 to $74,999 | 619 (100.0%) | 0 (0.0%) |
| $75,000 to $99,999 | 345 (100.0%) | 0 (0.0%) |
| $100,000 and over | 3,973 (100.0%) | 0 (0.0%) |
Public vs Private Health Insurance Coverage by Age in Rancho Murieta
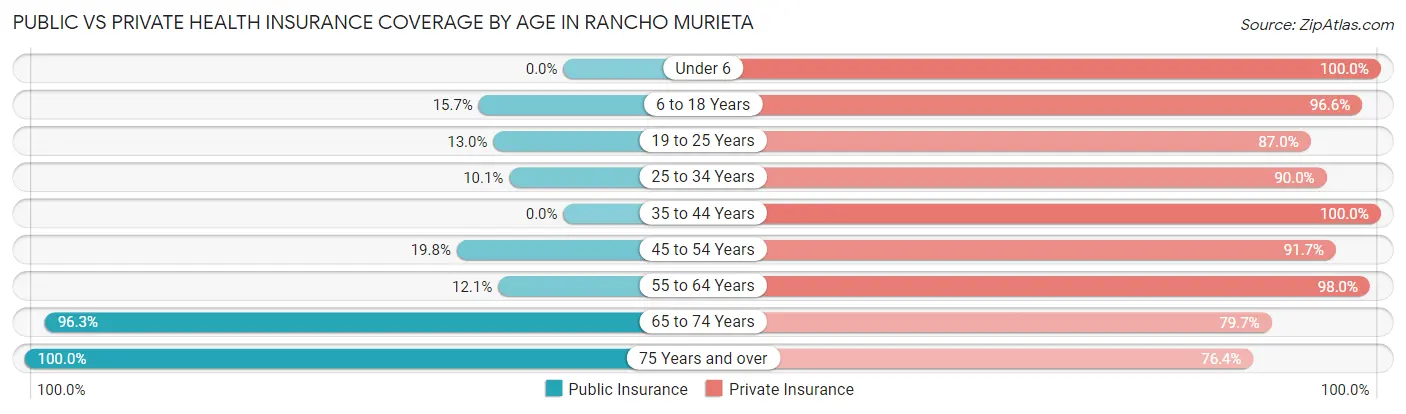
| Age Bracket | Public Insurance | Private Insurance |
| Under 6 | 0 (0.0%) | 246 (100.0%) |
| 6 to 18 Years | 137 (15.7%) | 842 (96.6%) |
| 19 to 25 Years | 32 (13.0%) | 214 (87.0%) |
| 25 to 34 Years | 21 (10.1%) | 188 (89.9%) |
| 35 to 44 Years | 0 (0.0%) | 580 (100.0%) |
| 45 to 54 Years | 112 (19.8%) | 519 (91.7%) |
| 55 to 64 Years | 128 (12.1%) | 1,035 (98.0%) |
| 65 to 74 Years | 979 (96.3%) | 811 (79.7%) |
| 75 Years and over | 936 (100.0%) | 715 (76.4%) |
| Total | 2,345 (40.9%) | 5,150 (89.9%) |
Disability Status by Sex by Age in Rancho Murieta
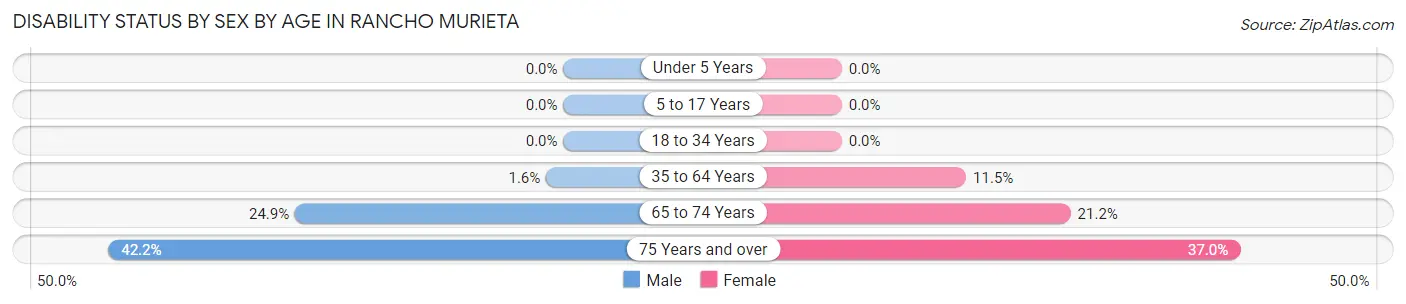
| Age Bracket | Male | Female |
| Under 5 Years | 0 (0.0%) | 0 (0.0%) |
| 5 to 17 Years | 0 (0.0%) | 0 (0.0%) |
| 18 to 34 Years | 0 (0.0%) | 0 (0.0%) |
| 35 to 64 Years | 15 (1.6%) | 146 (11.5%) |
| 65 to 74 Years | 129 (24.9%) | 106 (21.2%) |
| 75 Years and over | 201 (42.2%) | 170 (37.0%) |
Disability Class by Sex by Age in Rancho Murieta
Disability Class: Hearing Difficulty
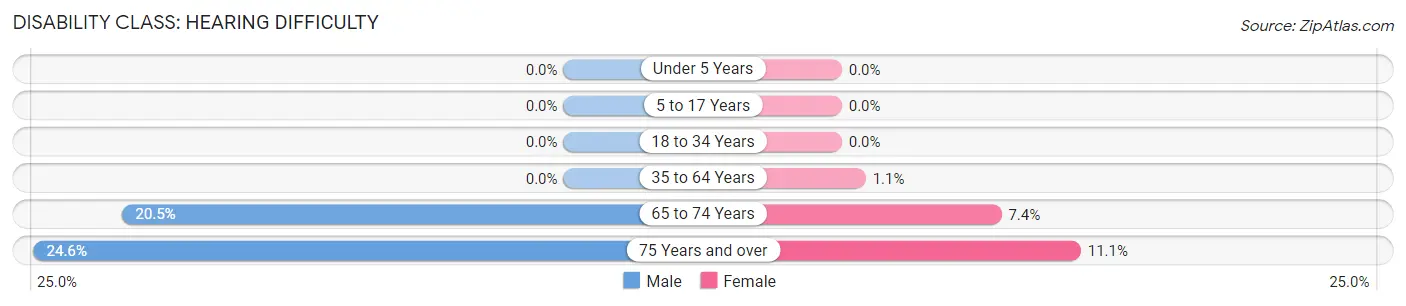
| Age Bracket | Male | Female |
| Under 5 Years | 0 (0.0%) | 0 (0.0%) |
| 5 to 17 Years | 0 (0.0%) | 0 (0.0%) |
| 18 to 34 Years | 0 (0.0%) | 0 (0.0%) |
| 35 to 64 Years | 0 (0.0%) | 14 (1.1%) |
| 65 to 74 Years | 106 (20.5%) | 37 (7.4%) |
| 75 Years and over | 117 (24.6%) | 51 (11.1%) |
Disability Class: Vision Difficulty
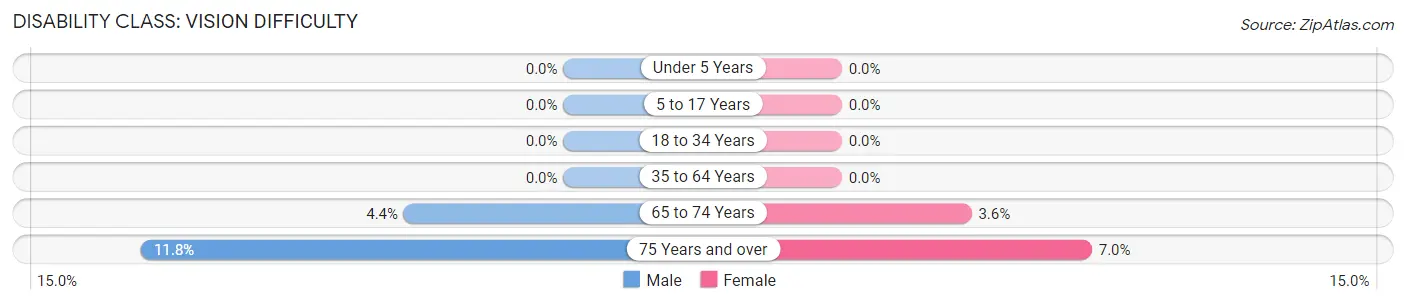
| Age Bracket | Male | Female |
| Under 5 Years | 0 (0.0%) | 0 (0.0%) |
| 5 to 17 Years | 0 (0.0%) | 0 (0.0%) |
| 18 to 34 Years | 0 (0.0%) | 0 (0.0%) |
| 35 to 64 Years | 0 (0.0%) | 0 (0.0%) |
| 65 to 74 Years | 23 (4.4%) | 18 (3.6%) |
| 75 Years and over | 56 (11.8%) | 32 (7.0%) |
Disability Class: Cognitive Difficulty
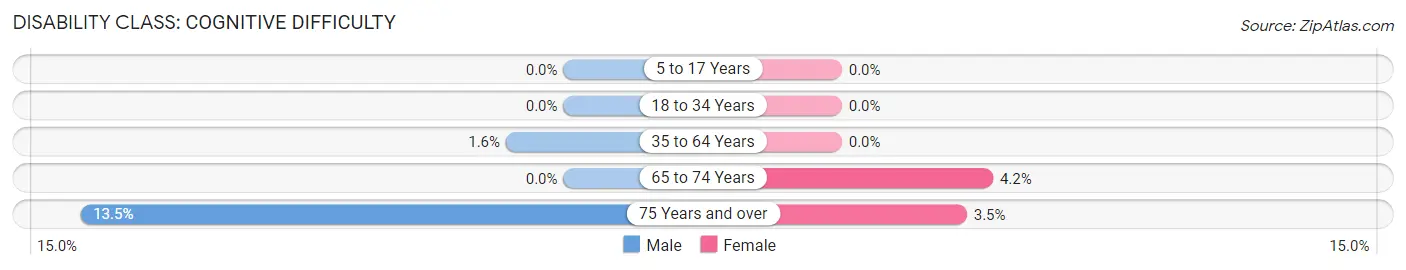
| Age Bracket | Male | Female |
| 5 to 17 Years | 0 (0.0%) | 0 (0.0%) |
| 18 to 34 Years | 0 (0.0%) | 0 (0.0%) |
| 35 to 64 Years | 15 (1.6%) | 0 (0.0%) |
| 65 to 74 Years | 0 (0.0%) | 21 (4.2%) |
| 75 Years and over | 64 (13.5%) | 16 (3.5%) |
Disability Class: Ambulatory Difficulty
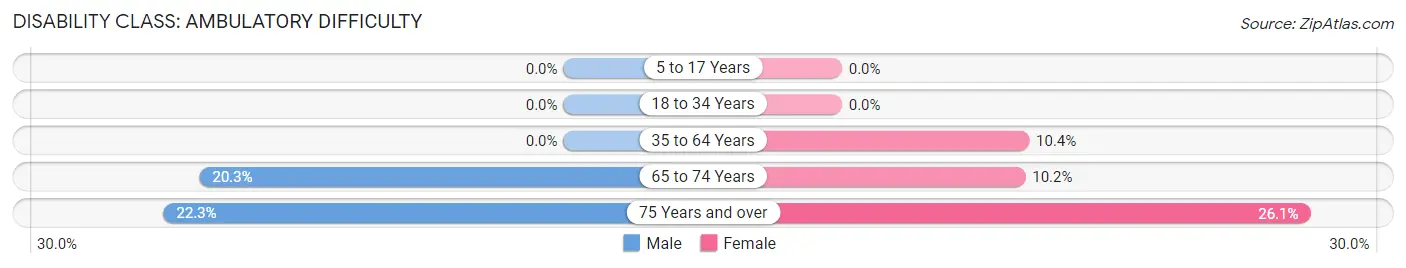
| Age Bracket | Male | Female |
| 5 to 17 Years | 0 (0.0%) | 0 (0.0%) |
| 18 to 34 Years | 0 (0.0%) | 0 (0.0%) |
| 35 to 64 Years | 0 (0.0%) | 132 (10.4%) |
| 65 to 74 Years | 105 (20.3%) | 51 (10.2%) |
| 75 Years and over | 106 (22.3%) | 120 (26.1%) |
Disability Class: Self-Care Difficulty
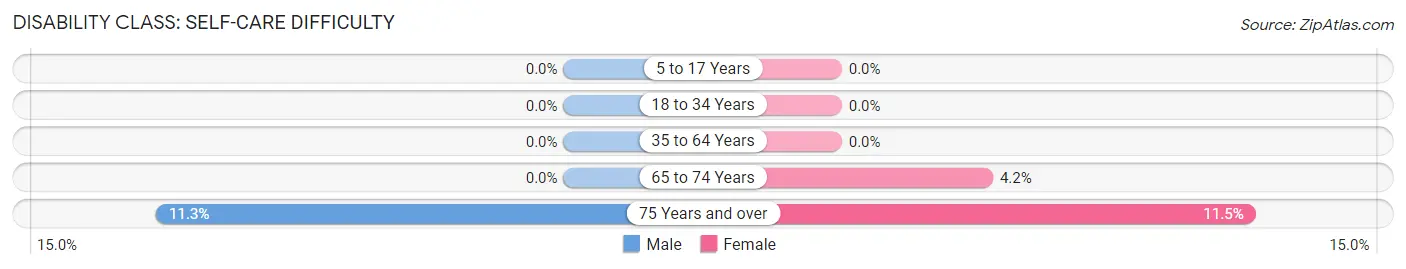
| Age Bracket | Male | Female |
| 5 to 17 Years | 0 (0.0%) | 0 (0.0%) |
| 18 to 34 Years | 0 (0.0%) | 0 (0.0%) |
| 35 to 64 Years | 0 (0.0%) | 0 (0.0%) |
| 65 to 74 Years | 0 (0.0%) | 21 (4.2%) |
| 75 Years and over | 54 (11.3%) | 53 (11.5%) |
Technology Access in Rancho Murieta
Computing Device Access in Rancho Murieta
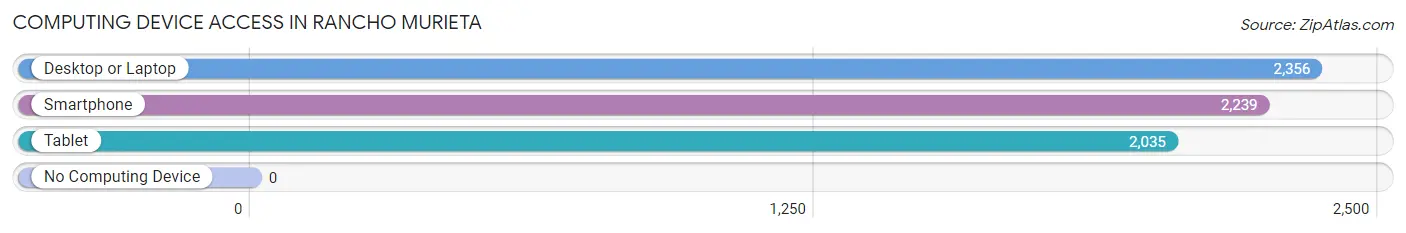
| Device Type | # Households | % Households |
| Desktop or Laptop | 2,356 | 96.6% |
| Smartphone | 2,239 | 91.8% |
| Tablet | 2,035 | 83.4% |
| No Computing Device | 0 | 0.0% |
| Total | 2,439 | 100.0% |
Internet Access in Rancho Murieta
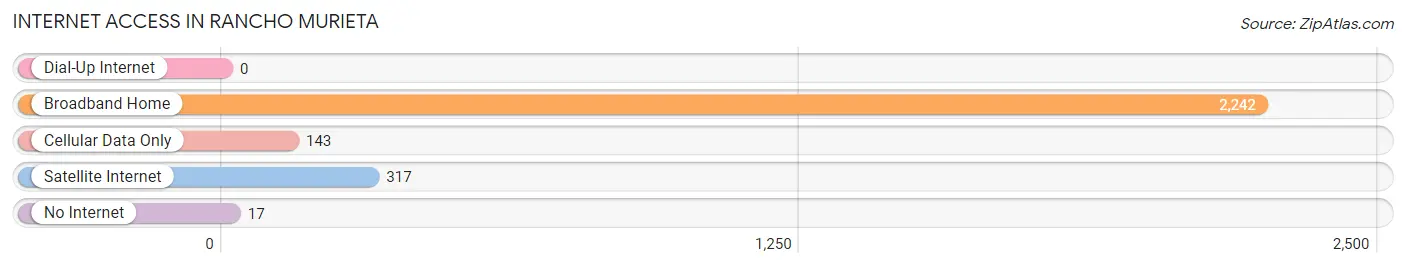
| Internet Type | # Households | % Households |
| Dial-Up Internet | 0 | 0.0% |
| Broadband Home | 2,242 | 91.9% |
| Cellular Data Only | 143 | 5.9% |
| Satellite Internet | 317 | 13.0% |
| No Internet | 17 | 0.7% |
| Total | 2,439 | 100.0% |
Rancho Murieta Summary
Rancho Murieta is a census-designated place (CDP) located in Sacramento County, California, United States. The population was 7,543 at the 2010 census. It is located in the Sierra Nevada foothills, approximately 25 miles (40 km) southeast of Sacramento.
History
Rancho Murieta was originally part of the Rancho San Juan Mexican land grant, which was granted to John A. Sutter in 1844. The land was later sold to John Bidwell, who then sold it to James Ben Ali Haggin in 1875. Haggin then sold the land to the Murieta Land and Water Company in 1876. The company was formed by a group of investors from San Francisco, who named the area after Joaquin Murieta, a legendary Mexican bandit.
The area was used primarily for cattle ranching and farming until the 1950s, when the first residential development began. The first homes were built in the early 1960s, and the community was officially incorporated in 1965.
Geography
Rancho Murieta is located at 38 25 25 North 121 10 17 West 38 423750 121 171417
According to the United States Census Bureau, the CDP has a total area of 8.3 square miles (21.5 km2), of which 8.2 square miles (21.3 km2) is land and 0.1 square miles (0.2 km2) (1.17%) is water.
Economy
Rancho Murieta is primarily a residential community, with most of its residents commuting to nearby cities for work. The community is home to several small businesses, including a golf course, a winery, and a few restaurants.
Demographics
As of the census of 2000, there were 7,543 people, 2,845 households, and 2,092 families residing in the CDP. The population density was 917.3 people per square mile (354.2/km2). There were 3,039 housing units at an average density of 369.3 per square mile (142.9/km2). The racial makeup of the CDP was 87.2% White, 0.7% African American, 0.7% Native American, 1.2% Asian, 0.1% Pacific Islander, 7.2% from other races, and 3.0% from two or more races. Hispanic or Latino of any race were 14.2% of the population.
There were 2,845 households, out of which 33.2% had children under the age of 18 living with them, 58.2% were married couples living together, 8.7% had a female householder with no husband present, and 28.7% were non-families. 22.2% of all households were made up of individuals, and 6.2% had someone living alone who was 65 years of age or older. The average household size was 2.64 and the average family size was 3.09.
In the CDP, the population was spread out, with 25.7% under the age of 18, 6.2% from 18 to 24, 28.2% from 25 to 44, 28.2% from 45 to 64, and 11.7% who were 65 years of age or older. The median age was 39 years. For every 100 females, there were 97.2 males. For every 100 females age 18 and over, there were 94.2 males.
The median income for a household in the CDP was $63,917, and the median income for a family was $71,917. Males had a median income of $50,000 versus $35,000 for females. The per capita income for the CDP was $30,917. About 2.2% of families and 3.2% of the population were below the poverty line, including 3.2% of those under age 18 and none of those age 65 or over.
Common Questions
What is Per Capita Income in Rancho Murieta?
Per Capita income in Rancho Murieta is $61,572.
What is the Median Family Income in Rancho Murieta?
Median Family Income in Rancho Murieta is $149,644.
What is the Median Household income in Rancho Murieta?
Median Household Income in Rancho Murieta is $127,128.
What is Income or Wage Gap in Rancho Murieta?
Income or Wage Gap in Rancho Murieta is 30.4%.
Women in Rancho Murieta earn 69.6 cents for every dollar earned by a man.
What is Family Income Deficit in Rancho Murieta?
Family Income Deficit in Rancho Murieta is $12,797.
Families that are below poverty line in Rancho Murieta earn $12,797 less on average than the poverty threshold level.
What is Inequality or Gini Index in Rancho Murieta?
Inequality or Gini Index in Rancho Murieta is 0.40.
What is the Total Population of Rancho Murieta?
Total Population of Rancho Murieta is 5,728.
What is the Total Male Population of Rancho Murieta?
Total Male Population of Rancho Murieta is 2,578.
What is the Total Female Population of Rancho Murieta?
Total Female Population of Rancho Murieta is 3,150.
What is the Ratio of Males per 100 Females in Rancho Murieta?
There are 81.84 Males per 100 Females in Rancho Murieta.
What is the Ratio of Females per 100 Males in Rancho Murieta?
There are 122.19 Females per 100 Males in Rancho Murieta.
What is the Median Population Age in Rancho Murieta?
Median Population Age in Rancho Murieta is 56.3 Years.
What is the Average Family Size in Rancho Murieta
Average Family Size in Rancho Murieta is 2.8 People.
What is the Average Household Size in Rancho Murieta
Average Household Size in Rancho Murieta is 2.4 People.
How Large is the Labor Force in Rancho Murieta?
There are 2,492 People in the Labor Forcein in Rancho Murieta.
What is the Percentage of People in the Labor Force in Rancho Murieta?
52.6% of People are in the Labor Force in Rancho Murieta.
What is the Unemployment Rate in Rancho Murieta?
Unemployment Rate in Rancho Murieta is 2.1%.