Kelly Ridge, CA Map & Demographics
Kelly Ridge Map
Kelly Ridge Overview
$39,998
PER CAPITA INCOME
$81,786
AVG FAMILY INCOME
$59,665
AVG HOUSEHOLD INCOME
0.46
INEQUALITY / GINI INDEX
3,168
TOTAL POPULATION
1,614
MALE POPULATION
1,554
FEMALE POPULATION
103.86
MALES / 100 FEMALES
96.28
FEMALES / 100 MALES
60.9
MEDIAN AGE
3.0
AVG FAMILY SIZE
2.2
AVG HOUSEHOLD SIZE
1,173
LABOR FORCE [ PEOPLE ]
41.0%
PERCENT IN LABOR FORCE
5.7%
UNEMPLOYMENT RATE
Income in Kelly Ridge
Income Overview in Kelly Ridge
Per Capita Income in Kelly Ridge is $39,998, while median incomes of families and households are $81,786 and $59,665 respectively.
| Characteristic | Number | Measure |
| Per Capita Income | 3,168 | $39,998 |
| Median Family Income | 786 | $81,786 |
| Mean Family Income | 786 | $106,681 |
| Median Household Income | 1,439 | $59,665 |
| Mean Household Income | 1,439 | $83,008 |
| Income Deficit | 786 | $0 |
| Wage / Income Gap (%) | 3,168 | 0.00% |
| Wage / Income Gap ($) | 3,168 | 100.00¢ per $1 |
| Gini / Inequality Index | 3,168 | 0.46 |
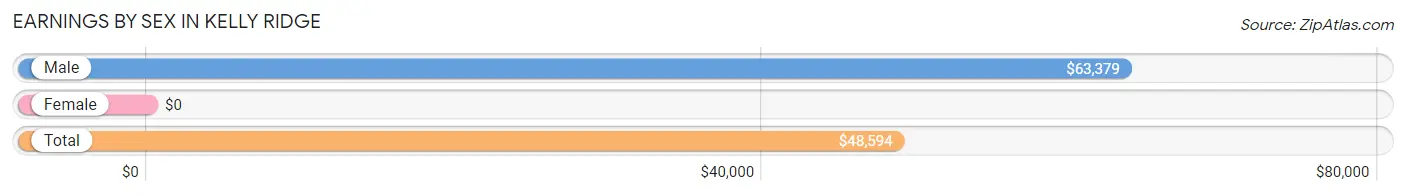
Earnings by Sex in Kelly Ridge
| Sex | Number | Average Earnings |
| Male | 743 (59.1%) | $63,379 |
| Female | 515 (40.9%) | $0 |
| Total | 1,258 (100.0%) | $48,594 |
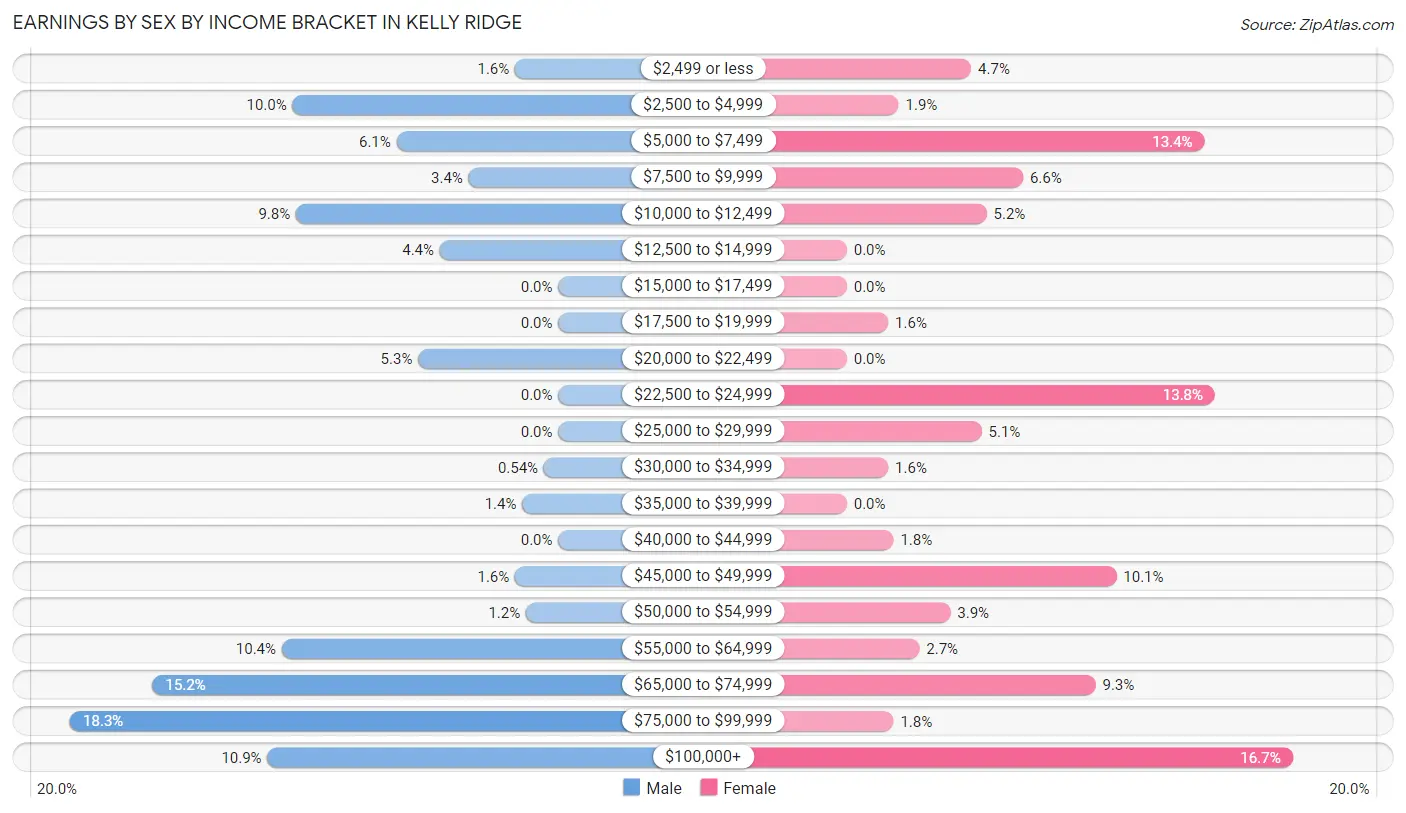
Earnings by Sex by Income Bracket in Kelly Ridge
The most common earnings brackets in Kelly Ridge are $75,000 to $99,999 for men (136 | 18.3%) and $100,000+ for women (86 | 16.7%).
| Income | Male | Female |
| $2,499 or less | 12 (1.6%) | 24 (4.7%) |
| $2,500 to $4,999 | 74 (10.0%) | 10 (1.9%) |
| $5,000 to $7,499 | 45 (6.1%) | 69 (13.4%) |
| $7,500 to $9,999 | 25 (3.4%) | 34 (6.6%) |
| $10,000 to $12,499 | 73 (9.8%) | 27 (5.2%) |
| $12,500 to $14,999 | 33 (4.4%) | 0 (0.0%) |
| $15,000 to $17,499 | 0 (0.0%) | 0 (0.0%) |
| $17,500 to $19,999 | 0 (0.0%) | 8 (1.5%) |
| $20,000 to $22,499 | 39 (5.2%) | 0 (0.0%) |
| $22,500 to $24,999 | 0 (0.0%) | 71 (13.8%) |
| $25,000 to $29,999 | 0 (0.0%) | 26 (5.1%) |
| $30,000 to $34,999 | 4 (0.5%) | 8 (1.5%) |
| $35,000 to $39,999 | 10 (1.3%) | 0 (0.0%) |
| $40,000 to $44,999 | 0 (0.0%) | 9 (1.8%) |
| $45,000 to $49,999 | 12 (1.6%) | 52 (10.1%) |
| $50,000 to $54,999 | 9 (1.2%) | 20 (3.9%) |
| $55,000 to $64,999 | 77 (10.4%) | 14 (2.7%) |
| $65,000 to $74,999 | 113 (15.2%) | 48 (9.3%) |
| $75,000 to $99,999 | 136 (18.3%) | 9 (1.8%) |
| $100,000+ | 81 (10.9%) | 86 (16.7%) |
| Total | 743 (100.0%) | 515 (100.0%) |
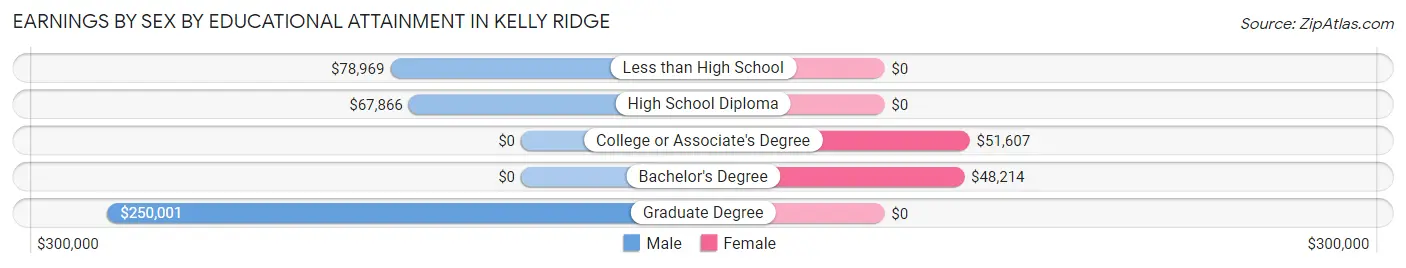
Earnings by Sex by Educational Attainment in Kelly Ridge
Average earnings in Kelly Ridge are $67,591 for men and $48,486 for women, a difference of 28.3%. Men with an educational attainment of graduate degree enjoy the highest average annual earnings of $250,001, while those with high school diploma education earn the least with $67,866. Women with an educational attainment of college or associate's degree earn the most with the average annual earnings of $51,607, while those with bachelor's degree education have the smallest earnings of $48,214.
| Educational Attainment | Male Income | Female Income |
| Less than High School | $78,969 | $0 |
| High School Diploma | $67,866 | $0 |
| College or Associate's Degree | - | - |
| Bachelor's Degree | - | - |
| Graduate Degree | $250,001 | $0 |
| Total | $67,591 | $48,486 |
Family Income in Kelly Ridge
Family Income Brackets in Kelly Ridge
According to the Kelly Ridge family income data, there are 152 families falling into the $100,000 to $149,999 income range, which is the most common income bracket and makes up 19.3% of all families. Conversely, the $15,000 to $24,999 income bracket is the least frequent group with only 7 families (0.9%) belonging to this category.
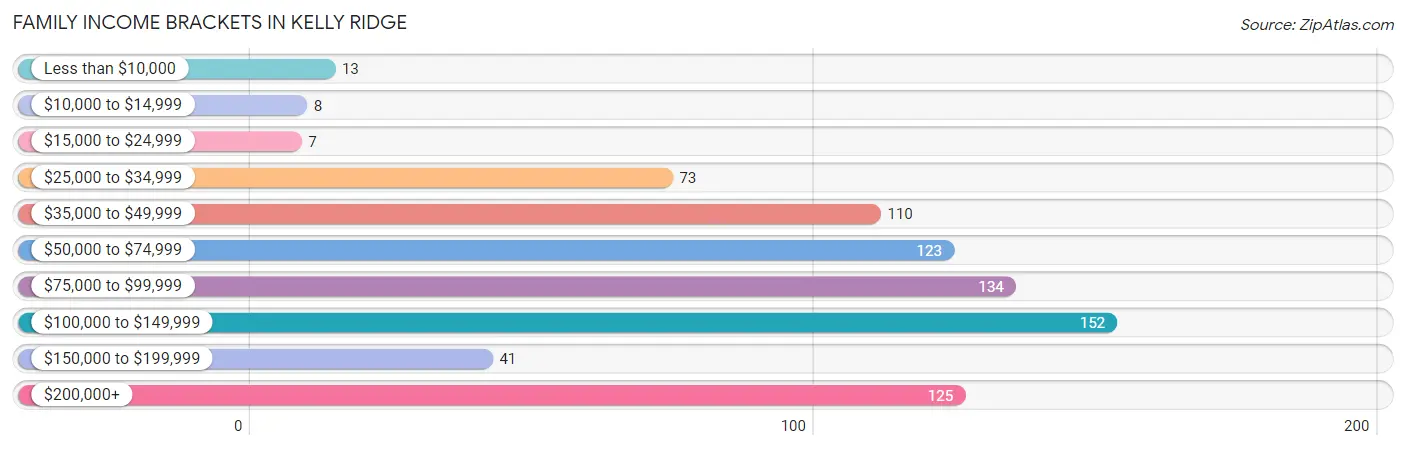
| Income Bracket | # Families | % Families |
| Less than $10,000 | 13 | 1.7% |
| $10,000 to $14,999 | 8 | 1.0% |
| $15,000 to $24,999 | 7 | 0.9% |
| $25,000 to $34,999 | 73 | 9.3% |
| $35,000 to $49,999 | 110 | 14.0% |
| $50,000 to $74,999 | 123 | 15.6% |
| $75,000 to $99,999 | 134 | 17.0% |
| $100,000 to $149,999 | 152 | 19.3% |
| $150,000 to $199,999 | 41 | 5.2% |
| $200,000+ | 125 | 15.9% |
Family Income by Famaliy Size in Kelly Ridge
4-person families (123 | 15.7%) account for the highest median family income in Kelly Ridge with $115,781 per family, while 3-person families (103 | 13.1%) have the highest median income of $36,164 per family member.
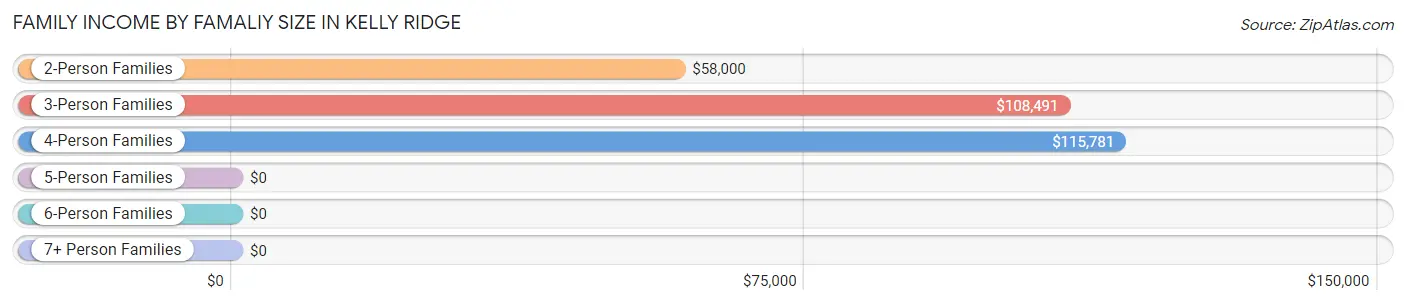
| Income Bracket | # Families | Median Income |
| 2-Person Families | 488 (62.1%) | $58,000 |
| 3-Person Families | 103 (13.1%) | $108,491 |
| 4-Person Families | 123 (15.7%) | $115,781 |
| 5-Person Families | 65 (8.3%) | $0 |
| 6-Person Families | 0 (0.0%) | $0 |
| 7+ Person Families | 7 (0.9%) | $0 |
| Total | 786 (100.0%) | $81,786 |
Family Income by Number of Earners in Kelly Ridge
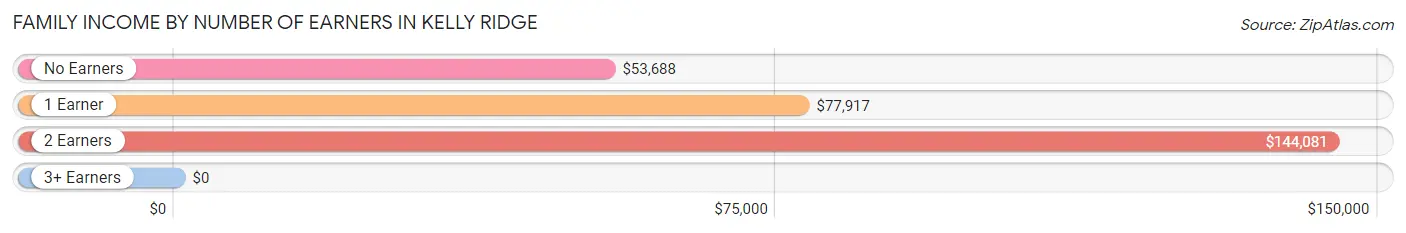
| Number of Earners | # Families | Median Income |
| No Earners | 301 (38.3%) | $53,688 |
| 1 Earner | 215 (27.4%) | $77,917 |
| 2 Earners | 201 (25.6%) | $144,081 |
| 3+ Earners | 69 (8.8%) | $0 |
| Total | 786 (100.0%) | $81,786 |
Household Income in Kelly Ridge
Household Income Brackets in Kelly Ridge
With 217 households falling in the category, the $75,000 to $99,999 income range is the most frequent in Kelly Ridge, accounting for 15.1% of all households. In contrast, only 27 households (1.9%) fall into the $10,000 to $14,999 income bracket, making it the least populous group.
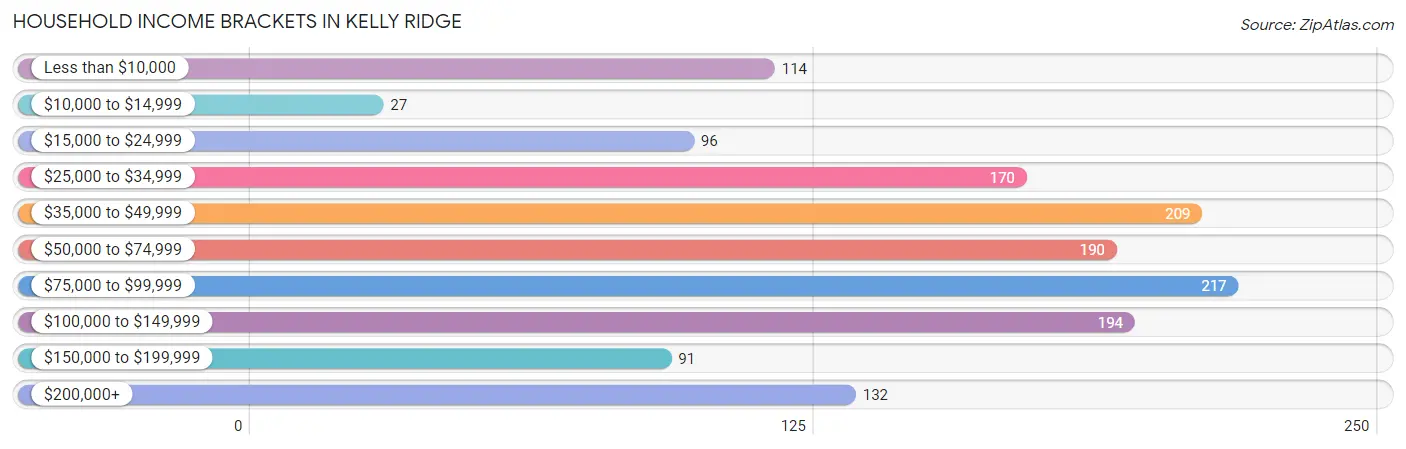
| Income Bracket | # Households | % Households |
| Less than $10,000 | 114 | 7.9% |
| $10,000 to $14,999 | 27 | 1.9% |
| $15,000 to $24,999 | 96 | 6.7% |
| $25,000 to $34,999 | 170 | 11.8% |
| $35,000 to $49,999 | 209 | 14.5% |
| $50,000 to $74,999 | 190 | 13.2% |
| $75,000 to $99,999 | 217 | 15.1% |
| $100,000 to $149,999 | 194 | 13.5% |
| $150,000 to $199,999 | 91 | 6.3% |
| $200,000+ | 132 | 9.2% |
Household Income by Householder Age in Kelly Ridge
The median household income in Kelly Ridge is $59,665, with the highest median household income of $91,719 found in the 25 to 44 years age bracket for the primary householder. A total of 217 households (15.1%) fall into this category. Meanwhile, the 15 to 24 years age bracket for the primary householder has the lowest median household income of $0, with 16 households (1.1%) in this group.
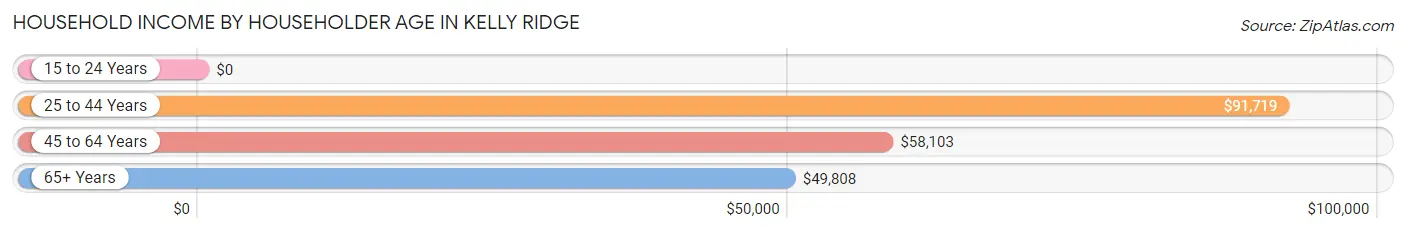
| Income Bracket | # Households | Median Income |
| 15 to 24 Years | 16 (1.1%) | $0 |
| 25 to 44 Years | 217 (15.1%) | $91,719 |
| 45 to 64 Years | 414 (28.8%) | $58,103 |
| 65+ Years | 792 (55.0%) | $49,808 |
| Total | 1,439 (100.0%) | $59,665 |
Poverty in Kelly Ridge
Income Below Poverty by Sex and Age in Kelly Ridge
With 5.1% poverty level for males and 12.2% for females among the residents of Kelly Ridge, 25 to 34 year old males and 45 to 54 year old females are the most vulnerable to poverty, with 20 males (21.3%) and 73 females (67.6%) in their respective age groups living below the poverty level.
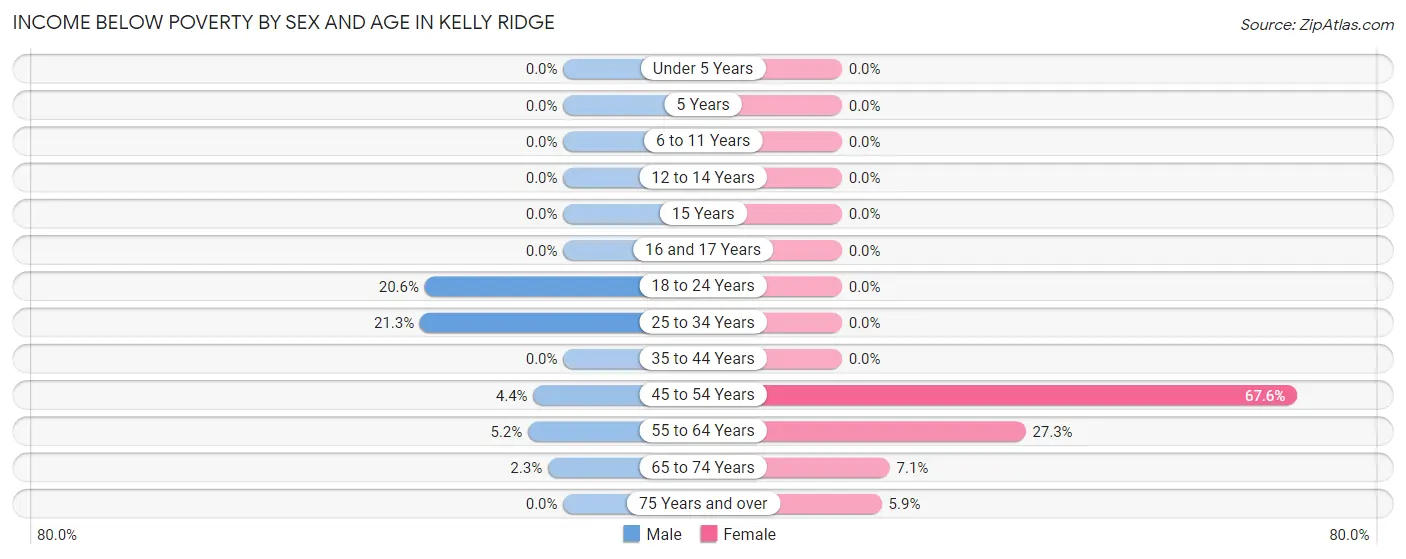
| Age Bracket | Male | Female |
| Under 5 Years | 0 (0.0%) | 0 (0.0%) |
| 5 Years | 0 (0.0%) | 0 (0.0%) |
| 6 to 11 Years | 0 (0.0%) | 0 (0.0%) |
| 12 to 14 Years | 0 (0.0%) | 0 (0.0%) |
| 15 Years | 0 (0.0%) | 0 (0.0%) |
| 16 and 17 Years | 0 (0.0%) | 0 (0.0%) |
| 18 to 24 Years | 36 (20.6%) | 0 (0.0%) |
| 25 to 34 Years | 20 (21.3%) | 0 (0.0%) |
| 35 to 44 Years | 0 (0.0%) | 0 (0.0%) |
| 45 to 54 Years | 8 (4.4%) | 73 (67.6%) |
| 55 to 64 Years | 8 (5.2%) | 72 (27.3%) |
| 65 to 74 Years | 11 (2.3%) | 25 (7.1%) |
| 75 Years and over | 0 (0.0%) | 20 (5.9%) |
| Total | 83 (5.1%) | 190 (12.2%) |
Income Above Poverty by Sex and Age in Kelly Ridge
According to the poverty statistics in Kelly Ridge, males aged under 5 years and females aged under 5 years are the age groups that are most secure financially, with 100.0% of males and 100.0% of females in these age groups living above the poverty line.
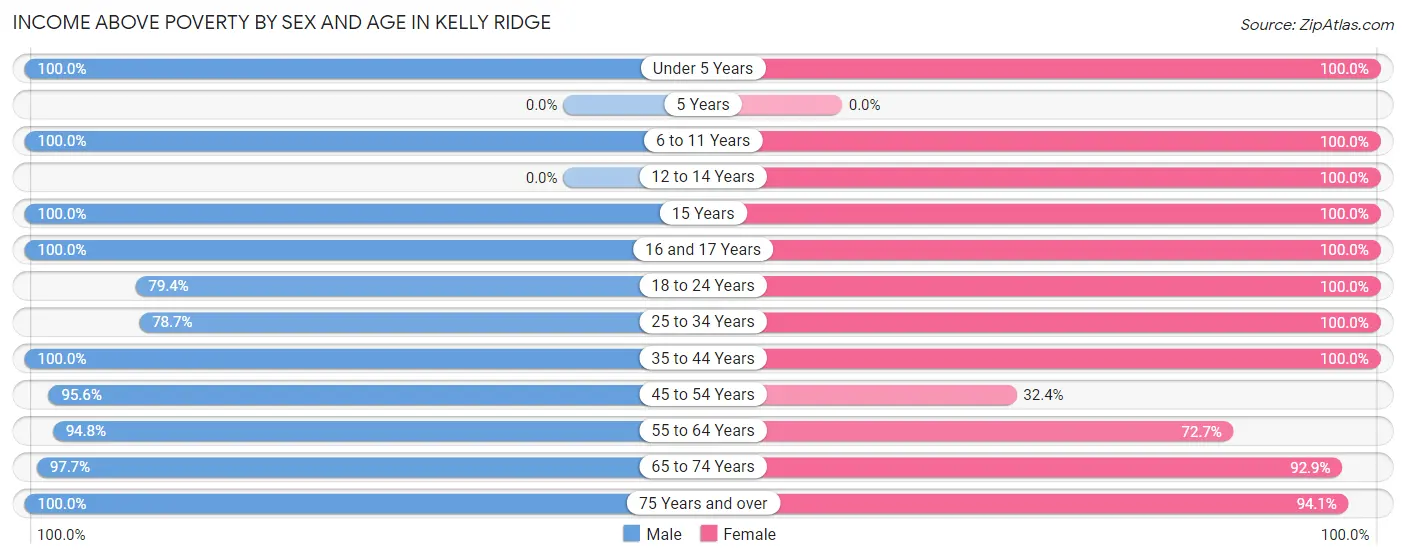
| Age Bracket | Male | Female |
| Under 5 Years | 26 (100.0%) | 46 (100.0%) |
| 5 Years | 0 (0.0%) | 0 (0.0%) |
| 6 to 11 Years | 55 (100.0%) | 81 (100.0%) |
| 12 to 14 Years | 0 (0.0%) | 40 (100.0%) |
| 15 Years | 49 (100.0%) | 10 (100.0%) |
| 16 and 17 Years | 17 (100.0%) | 44 (100.0%) |
| 18 to 24 Years | 139 (79.4%) | 98 (100.0%) |
| 25 to 34 Years | 74 (78.7%) | 58 (100.0%) |
| 35 to 44 Years | 164 (100.0%) | 115 (100.0%) |
| 45 to 54 Years | 172 (95.6%) | 35 (32.4%) |
| 55 to 64 Years | 145 (94.8%) | 192 (72.7%) |
| 65 to 74 Years | 472 (97.7%) | 327 (92.9%) |
| 75 Years and over | 218 (100.0%) | 318 (94.1%) |
| Total | 1,531 (94.9%) | 1,364 (87.8%) |
Income Below Poverty Among Married-Couple Families in Kelly Ridge
The poverty statistics for married-couple families in Kelly Ridge show that 1.2% or 8 of the total 670 families live below the poverty line. Families with no children have the highest poverty rate of 1.5%, comprising of 8 families. On the other hand, families with 1 or 2 children have the lowest poverty rate of 0.0%, which includes 0 families.
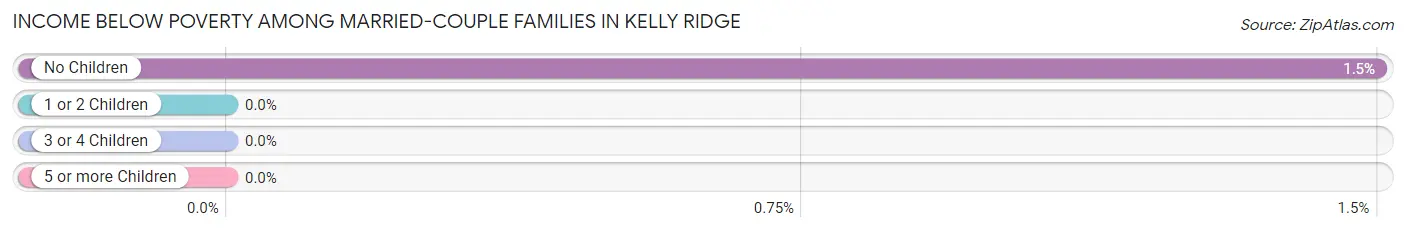
| Children | Above Poverty | Below Poverty |
| No Children | 525 (98.5%) | 8 (1.5%) |
| 1 or 2 Children | 116 (100.0%) | 0 (0.0%) |
| 3 or 4 Children | 14 (100.0%) | 0 (0.0%) |
| 5 or more Children | 7 (100.0%) | 0 (0.0%) |
| Total | 662 (98.8%) | 8 (1.2%) |
Income Below Poverty Among Single-Parent Households in Kelly Ridge
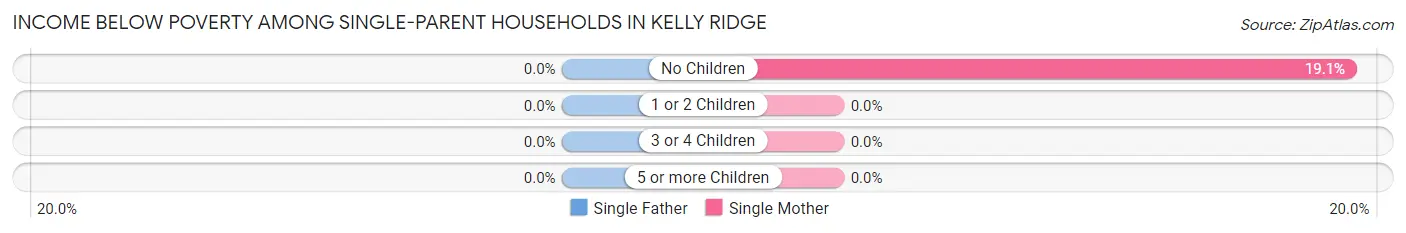
| Children | Single Father | Single Mother |
| No Children | 0 (0.0%) | 13 (19.1%) |
| 1 or 2 Children | 0 (0.0%) | 0 (0.0%) |
| 3 or 4 Children | 0 (0.0%) | 0 (0.0%) |
| 5 or more Children | 0 (0.0%) | 0 (0.0%) |
| Total | 0 (0.0%) | 13 (16.5%) |
Income Below Poverty Among Married-Couple vs Single-Parent Households in Kelly Ridge
The poverty data for Kelly Ridge shows that 8 of the married-couple family households (1.2%) and 13 of the single-parent households (11.2%) are living below the poverty level. Within the married-couple family households, those with no children have the highest poverty rate, with 8 households (1.5%) falling below the poverty line. Among the single-parent households, those with no children have the highest poverty rate, with 13 household (12.4%) living below poverty.
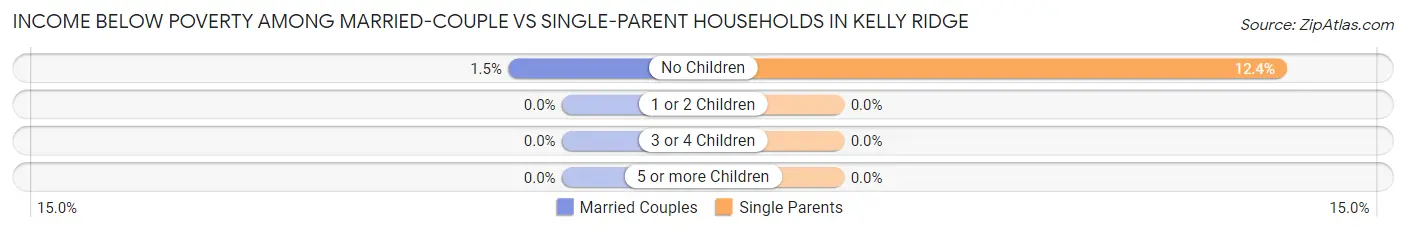
| Children | Married-Couple Families | Single-Parent Households |
| No Children | 8 (1.5%) | 13 (12.4%) |
| 1 or 2 Children | 0 (0.0%) | 0 (0.0%) |
| 3 or 4 Children | 0 (0.0%) | 0 (0.0%) |
| 5 or more Children | 0 (0.0%) | 0 (0.0%) |
| Total | 8 (1.2%) | 13 (11.2%) |
Race in Kelly Ridge
The most populous races in Kelly Ridge are White / Caucasian (2,609 | 82.4%), Two or more Races (256 | 8.1%), and Hispanic or Latino (255 | 8.1%).
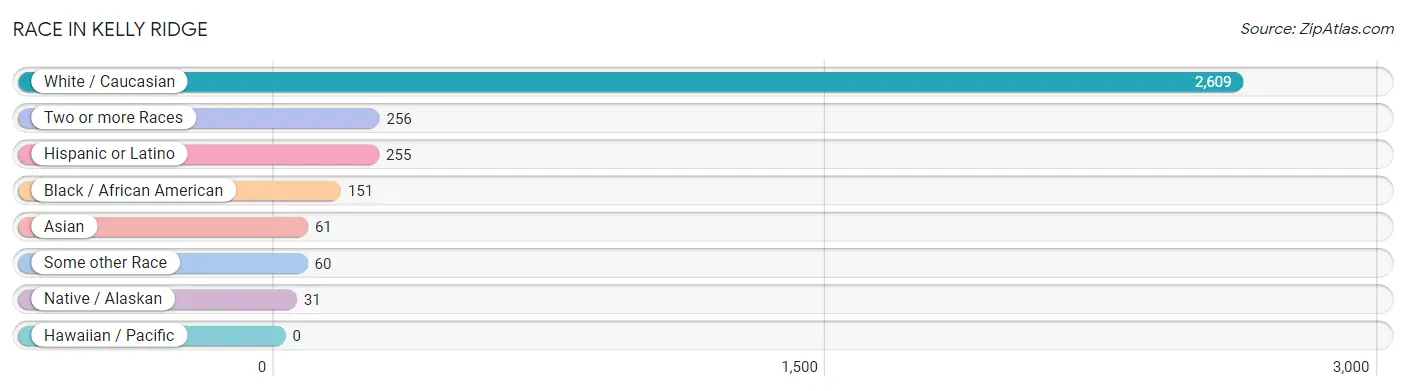
| Race | # Population | % Population |
| Asian | 61 | 1.9% |
| Black / African American | 151 | 4.8% |
| Hawaiian / Pacific | 0 | 0.0% |
| Hispanic or Latino | 255 | 8.1% |
| Native / Alaskan | 31 | 1.0% |
| White / Caucasian | 2,609 | 82.4% |
| Two or more Races | 256 | 8.1% |
| Some other Race | 60 | 1.9% |
| Total | 3,168 | 100.0% |
Ancestry in Kelly Ridge
The most populous ancestries reported in Kelly Ridge are English (564 | 17.8%), Irish (517 | 16.3%), German (374 | 11.8%), Mexican (236 | 7.4%), and Norwegian (229 | 7.2%), together accounting for 60.6% of all Kelly Ridge residents.
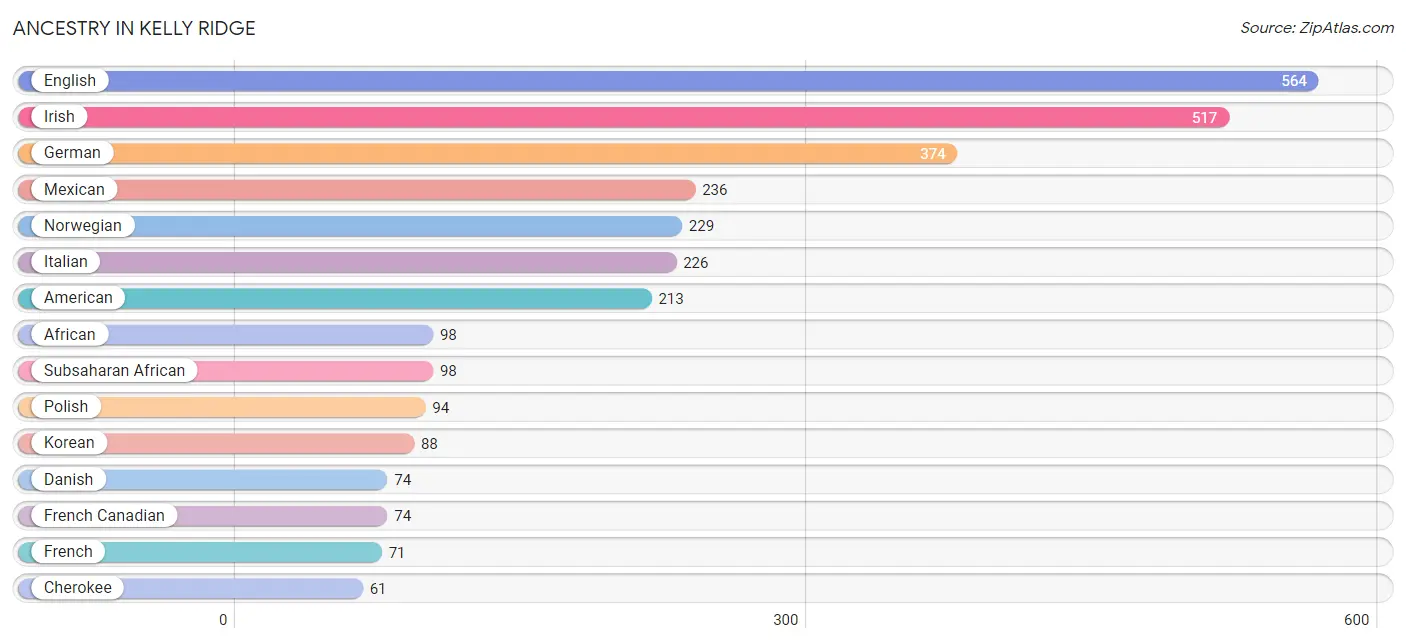
| Ancestry | # Population | % Population |
| Afghan | 16 | 0.5% |
| African | 98 | 3.1% |
| American | 213 | 6.7% |
| Austrian | 20 | 0.6% |
| British | 53 | 1.7% |
| Celtic | 34 | 1.1% |
| Cherokee | 61 | 1.9% |
| Chippewa | 8 | 0.3% |
| Choctaw | 37 | 1.2% |
| Czech | 19 | 0.6% |
| Danish | 74 | 2.3% |
| Dutch | 9 | 0.3% |
| Dutch West Indian | 24 | 0.8% |
| English | 564 | 17.8% |
| European | 40 | 1.3% |
| French | 71 | 2.2% |
| French Canadian | 74 | 2.3% |
| German | 374 | 11.8% |
| Greek | 34 | 1.1% |
| Irish | 517 | 16.3% |
| Italian | 226 | 7.1% |
| Jamaican | 14 | 0.4% |
| Korean | 88 | 2.8% |
| Mexican | 236 | 7.4% |
| Native Hawaiian | 7 | 0.2% |
| Norwegian | 229 | 7.2% |
| Paiute | 41 | 1.3% |
| Polish | 94 | 3.0% |
| Portuguese | 44 | 1.4% |
| Puget Sound Salish | 6 | 0.2% |
| Russian | 18 | 0.6% |
| Scotch-Irish | 27 | 0.9% |
| Scottish | 38 | 1.2% |
| Spaniard | 10 | 0.3% |
| Spanish | 9 | 0.3% |
| Subsaharan African | 98 | 3.1% |
| Swedish | 20 | 0.6% |
| Ukrainian | 9 | 0.3% |
| Welsh | 30 | 0.9% | View All 39 Rows |
Immigrants in Kelly Ridge
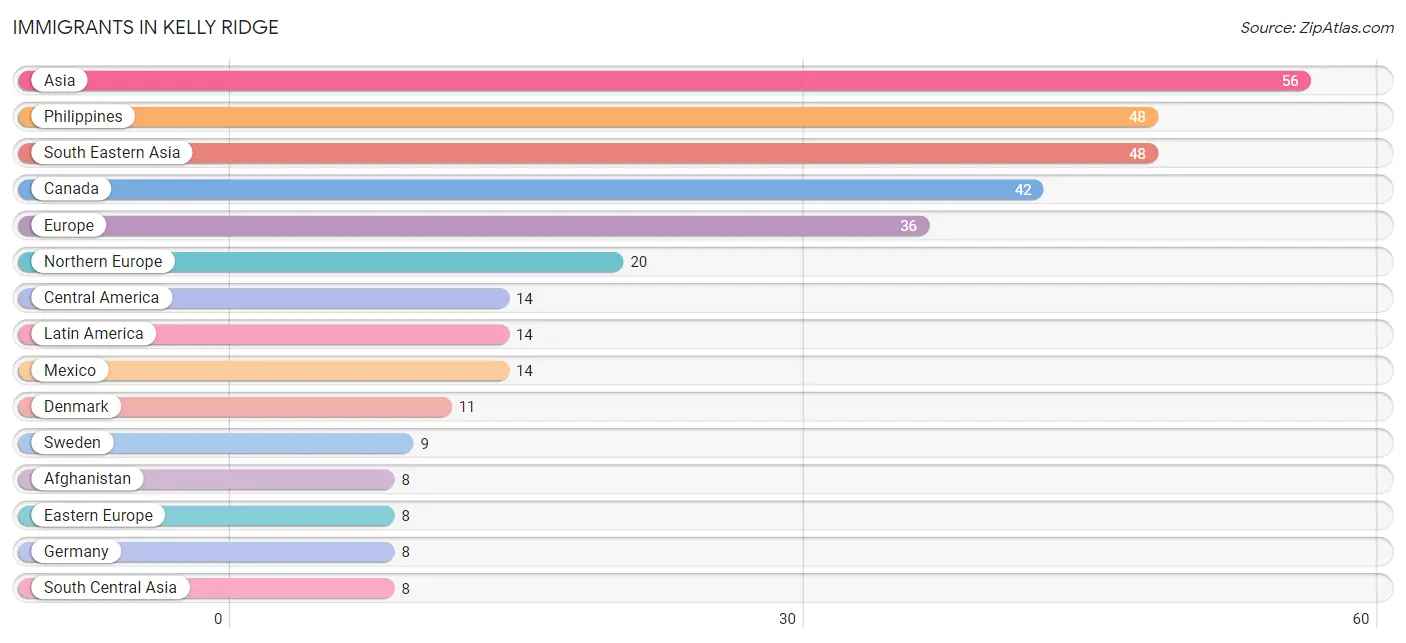
The most numerous immigrant groups reported in Kelly Ridge came from Asia (56 | 1.8%), Philippines (48 | 1.5%), South Eastern Asia (48 | 1.5%), Canada (42 | 1.3%), and Europe (36 | 1.1%), together accounting for 7.3% of all Kelly Ridge residents.
| Immigration Origin | # Population | % Population |
| Afghanistan | 8 | 0.3% |
| Asia | 56 | 1.8% |
| Canada | 42 | 1.3% |
| Central America | 14 | 0.4% |
| Denmark | 11 | 0.4% |
| Eastern Europe | 8 | 0.3% |
| Europe | 36 | 1.1% |
| Germany | 8 | 0.3% |
| Latin America | 14 | 0.4% |
| Mexico | 14 | 0.4% |
| Northern Europe | 20 | 0.6% |
| Philippines | 48 | 1.5% |
| South Central Asia | 8 | 0.3% |
| South Eastern Asia | 48 | 1.5% |
| Sweden | 9 | 0.3% |
| Western Europe | 8 | 0.3% | View All 16 Rows |
Sex and Age in Kelly Ridge
Sex and Age in Kelly Ridge
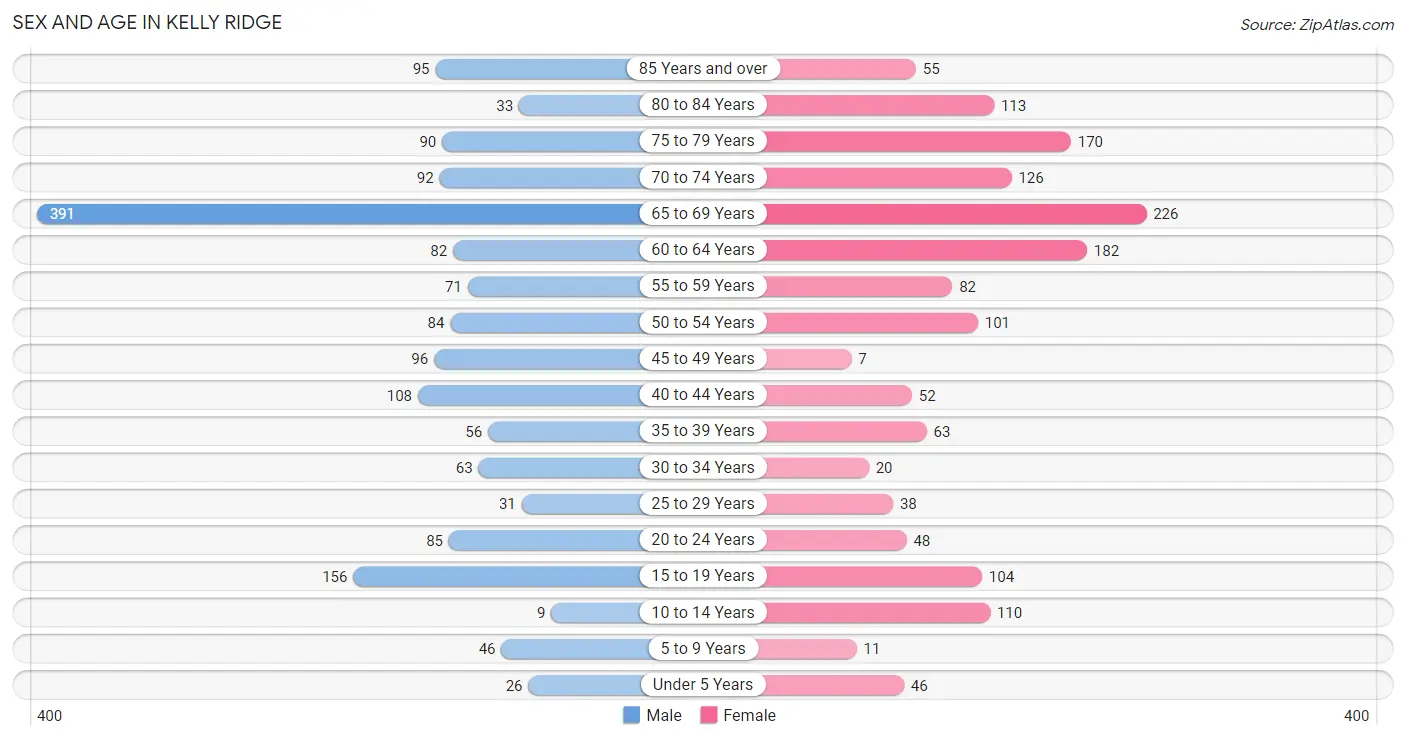
The most populous age groups in Kelly Ridge are 65 to 69 Years (391 | 24.2%) for men and 65 to 69 Years (226 | 14.5%) for women.
| Age Bracket | Male | Female |
| Under 5 Years | 26 (1.6%) | 46 (3.0%) |
| 5 to 9 Years | 46 (2.9%) | 11 (0.7%) |
| 10 to 14 Years | 9 (0.6%) | 110 (7.1%) |
| 15 to 19 Years | 156 (9.7%) | 104 (6.7%) |
| 20 to 24 Years | 85 (5.3%) | 48 (3.1%) |
| 25 to 29 Years | 31 (1.9%) | 38 (2.5%) |
| 30 to 34 Years | 63 (3.9%) | 20 (1.3%) |
| 35 to 39 Years | 56 (3.5%) | 63 (4.1%) |
| 40 to 44 Years | 108 (6.7%) | 52 (3.4%) |
| 45 to 49 Years | 96 (5.9%) | 7 (0.4%) |
| 50 to 54 Years | 84 (5.2%) | 101 (6.5%) |
| 55 to 59 Years | 71 (4.4%) | 82 (5.3%) |
| 60 to 64 Years | 82 (5.1%) | 182 (11.7%) |
| 65 to 69 Years | 391 (24.2%) | 226 (14.5%) |
| 70 to 74 Years | 92 (5.7%) | 126 (8.1%) |
| 75 to 79 Years | 90 (5.6%) | 170 (10.9%) |
| 80 to 84 Years | 33 (2.0%) | 113 (7.3%) |
| 85 Years and over | 95 (5.9%) | 55 (3.5%) |
| Total | 1,614 (100.0%) | 1,554 (100.0%) |
Families and Households in Kelly Ridge
Median Family Size in Kelly Ridge
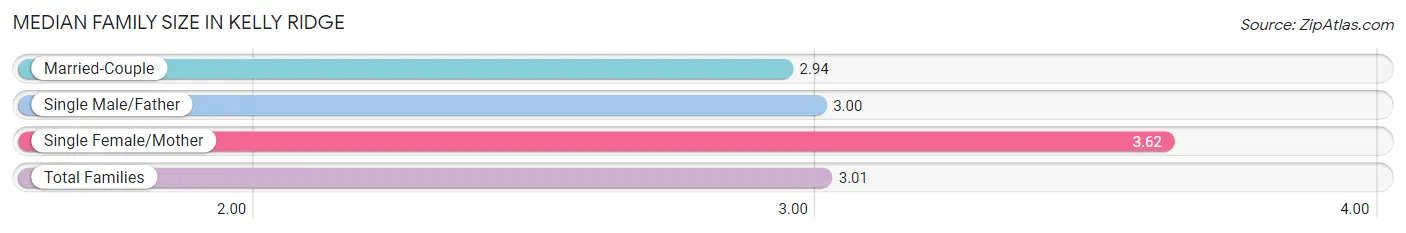
The median family size in Kelly Ridge is 3.01 persons per family, with single female/mother families (79 | 10.1%) accounting for the largest median family size of 3.62 persons per family. On the other hand, married-couple families (670 | 85.2%) represent the smallest median family size with 2.94 persons per family.
| Family Type | # Families | Family Size |
| Married-Couple | 670 (85.2%) | 2.94 |
| Single Male/Father | 37 (4.7%) | 3.00 |
| Single Female/Mother | 79 (10.1%) | 3.62 |
| Total Families | 786 (100.0%) | 3.01 |
Median Household Size in Kelly Ridge
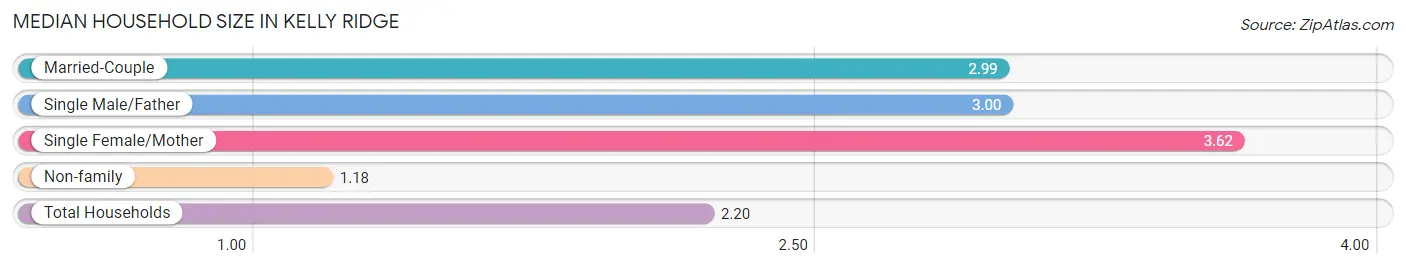
The median household size in Kelly Ridge is 2.20 persons per household, with single female/mother households (79 | 5.5%) accounting for the largest median household size of 3.62 persons per household. non-family households (653 | 45.4%) represent the smallest median household size with 1.18 persons per household.
| Household Type | # Households | Household Size |
| Married-Couple | 670 (46.6%) | 2.99 |
| Single Male/Father | 37 (2.6%) | 3.00 |
| Single Female/Mother | 79 (5.5%) | 3.62 |
| Non-family | 653 (45.4%) | 1.18 |
| Total Households | 1,439 (100.0%) | 2.20 |
Household Size by Marriage Status in Kelly Ridge
Out of a total of 1,439 households in Kelly Ridge, 786 (54.6%) are family households, while 653 (45.4%) are nonfamily households. The most numerous type of family households are 2-person households, comprising 488, and the most common type of nonfamily households are 1-person households, comprising 551.
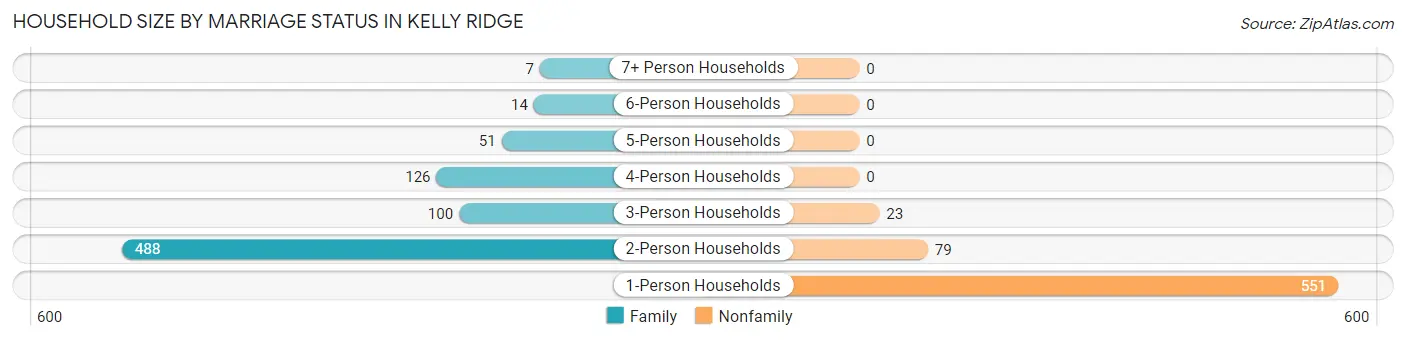
| Household Size | Family Households | Nonfamily Households |
| 1-Person Households | - | 551 (38.3%) |
| 2-Person Households | 488 (33.9%) | 79 (5.5%) |
| 3-Person Households | 100 (7.0%) | 23 (1.6%) |
| 4-Person Households | 126 (8.8%) | 0 (0.0%) |
| 5-Person Households | 51 (3.5%) | 0 (0.0%) |
| 6-Person Households | 14 (1.0%) | 0 (0.0%) |
| 7+ Person Households | 7 (0.5%) | 0 (0.0%) |
| Total | 786 (54.6%) | 653 (45.4%) |
Female Fertility in Kelly Ridge
Fertility by Age in Kelly Ridge
| Age Bracket | Women with Births | Births / 1,000 Women |
| 15 to 19 years | 0 (0.0%) | 0.0 |
| 20 to 34 years | 0 (0.0%) | 0.0 |
| 35 to 50 years | 0 (0.0%) | 0.0 |
| Total | 0 (0.0%) | 0.0 |
Fertility by Age by Marriage Status in Kelly Ridge
| Age Bracket | Married | Unmarried |
| 15 to 19 years | 0 (0.0%) | 0 (0.0%) |
| 20 to 34 years | 0 (0.0%) | 0 (0.0%) |
| 35 to 50 years | 0 (0.0%) | 0 (0.0%) |
| Total | 0 (0.0%) | 0 (0.0%) |
Fertility by Education in Kelly Ridge
| Educational Attainment | Women with Births | Births / 1,000 Women |
| Less than High School | 0 (0.0%) | 0.0 |
| High School Diploma | 0 (0.0%) | 0.0 |
| College or Associate's Degree | 0 (0.0%) | 0.0 |
| Bachelor's Degree | 0 (0.0%) | 0.0 |
| Graduate Degree | 0 (0.0%) | 0.0 |
| Total | 0 (0.0%) | 0.0 |
Fertility by Education by Marriage Status in Kelly Ridge
| Educational Attainment | Married | Unmarried |
| Less than High School | 0 (0.0%) | 0 (0.0%) |
| High School Diploma | 0 (0.0%) | 0 (0.0%) |
| College or Associate's Degree | 0 (0.0%) | 0 (0.0%) |
| Bachelor's Degree | 0 (0.0%) | 0 (0.0%) |
| Graduate Degree | 0 (0.0%) | 0 (0.0%) |
| Total | 0 (0.0%) | 0 (0.0%) |
Employment Characteristics in Kelly Ridge
Employment by Class of Employer in Kelly Ridge
Among the 1,044 employed individuals in Kelly Ridge, private company employees (578 | 55.4%), self-employed (not incorporated) (202 | 19.4%), and local government employees (119 | 11.4%) make up the most common classes of employment.
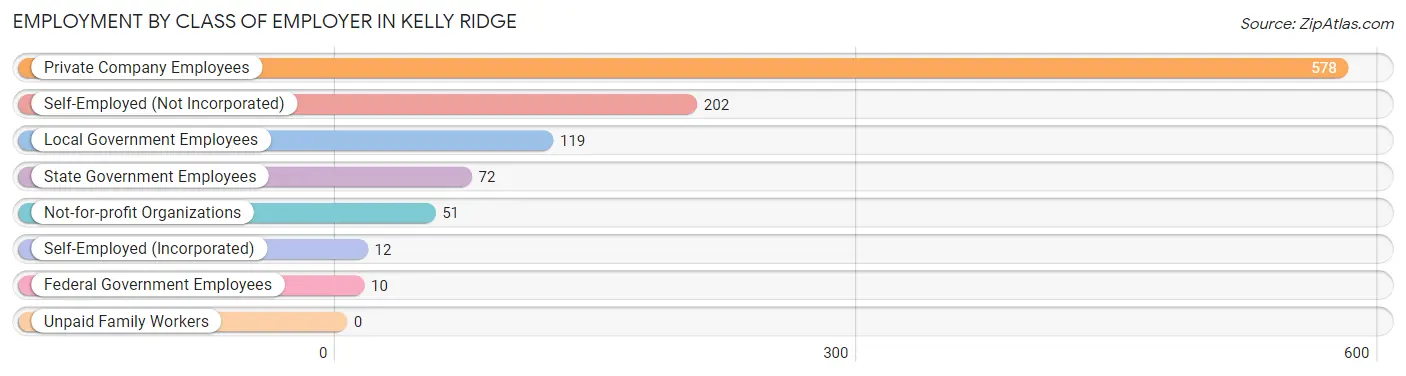
| Employer Class | # Employees | % Employees |
| Private Company Employees | 578 | 55.4% |
| Self-Employed (Incorporated) | 12 | 1.1% |
| Self-Employed (Not Incorporated) | 202 | 19.4% |
| Not-for-profit Organizations | 51 | 4.9% |
| Local Government Employees | 119 | 11.4% |
| State Government Employees | 72 | 6.9% |
| Federal Government Employees | 10 | 1.0% |
| Unpaid Family Workers | 0 | 0.0% |
| Total | 1,044 | 100.0% |
Employment Status by Age in Kelly Ridge
According to the labor force statistics for Kelly Ridge, out of the total population over 16 years of age (2,861), 41.0% or 1,173 individuals are in the labor force, with 5.7% or 67 of them unemployed. The age group with the highest labor force participation rate is 20 to 24 years, with 100.0% or 133 individuals in the labor force. Within the labor force, the 35 to 44 years age range has the highest percentage of unemployed individuals, with 14.7% or 32 of them being unemployed.
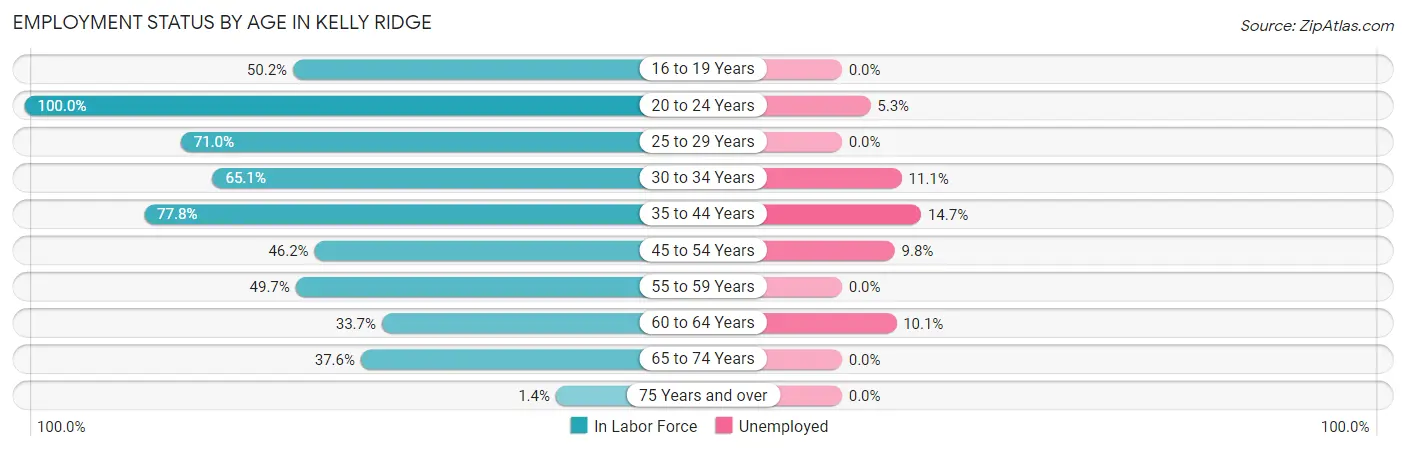
| Age Bracket | In Labor Force | Unemployed |
| 16 to 19 Years | 101 (50.2%) | 0 (0.0%) |
| 20 to 24 Years | 133 (100.0%) | 7 (5.3%) |
| 25 to 29 Years | 49 (71.0%) | 0 (0.0%) |
| 30 to 34 Years | 54 (65.1%) | 6 (11.1%) |
| 35 to 44 Years | 217 (77.8%) | 32 (14.7%) |
| 45 to 54 Years | 133 (46.2%) | 13 (9.8%) |
| 55 to 59 Years | 76 (49.7%) | 0 (0.0%) |
| 60 to 64 Years | 89 (33.7%) | 9 (10.1%) |
| 65 to 74 Years | 314 (37.6%) | 0 (0.0%) |
| 75 Years and over | 8 (1.4%) | 0 (0.0%) |
| Total | 1,173 (41.0%) | 67 (5.7%) |
Employment Status by Educational Attainment in Kelly Ridge
According to labor force statistics for Kelly Ridge, 54.4% of individuals (618) out of the total population between 25 and 64 years of age (1,136) are in the labor force, with 9.7% or 60 of them being unemployed. The group with the highest labor force participation rate are those with the educational attainment of college / associate degree, with 67.9% or 328 individuals in the labor force. Within the labor force, individuals with college / associate degree education have the highest percentage of unemployment, with 16.5% or 54 of them being unemployed.
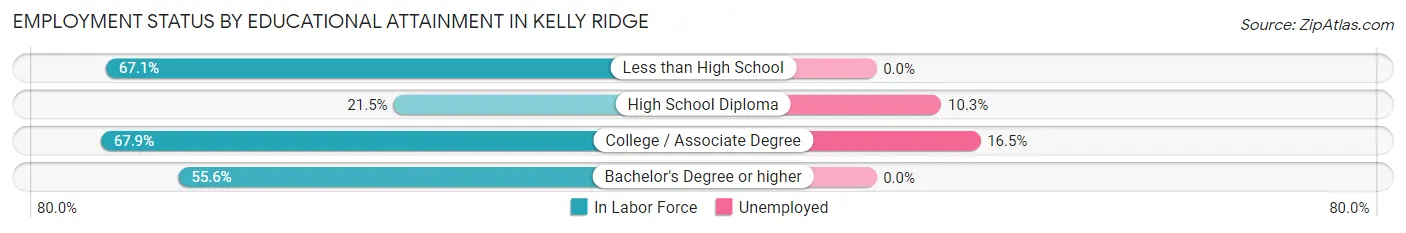
| Educational Attainment | In Labor Force | Unemployed |
| Less than High School | 112 (67.1%) | 0 (0.0%) |
| High School Diploma | 58 (21.5%) | 28 (10.3%) |
| College / Associate Degree | 328 (67.9%) | 80 (16.5%) |
| Bachelor's Degree or higher | 120 (55.6%) | 0 (0.0%) |
| Total | 618 (54.4%) | 110 (9.7%) |
Employment Occupations by Sex in Kelly Ridge
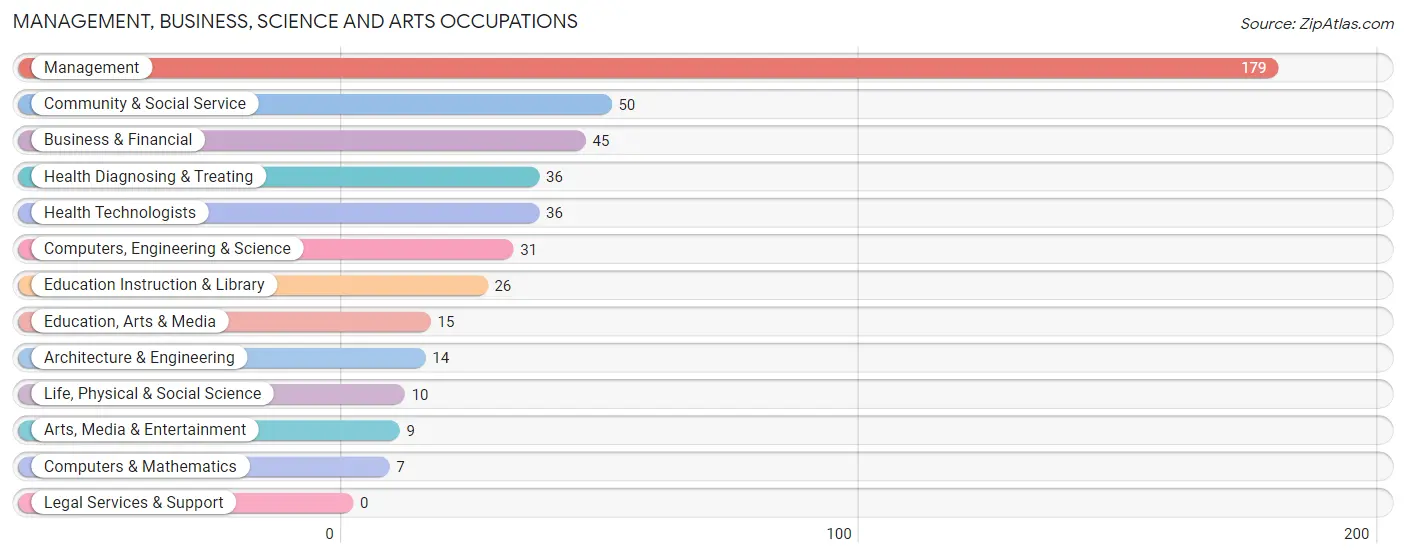
Management, Business, Science and Arts Occupations
The most common Management, Business, Science and Arts occupations in Kelly Ridge are Management (179 | 16.2%), Community & Social Service (50 | 4.5%), Business & Financial (45 | 4.1%), Health Diagnosing & Treating (36 | 3.3%), and Health Technologists (36 | 3.3%).
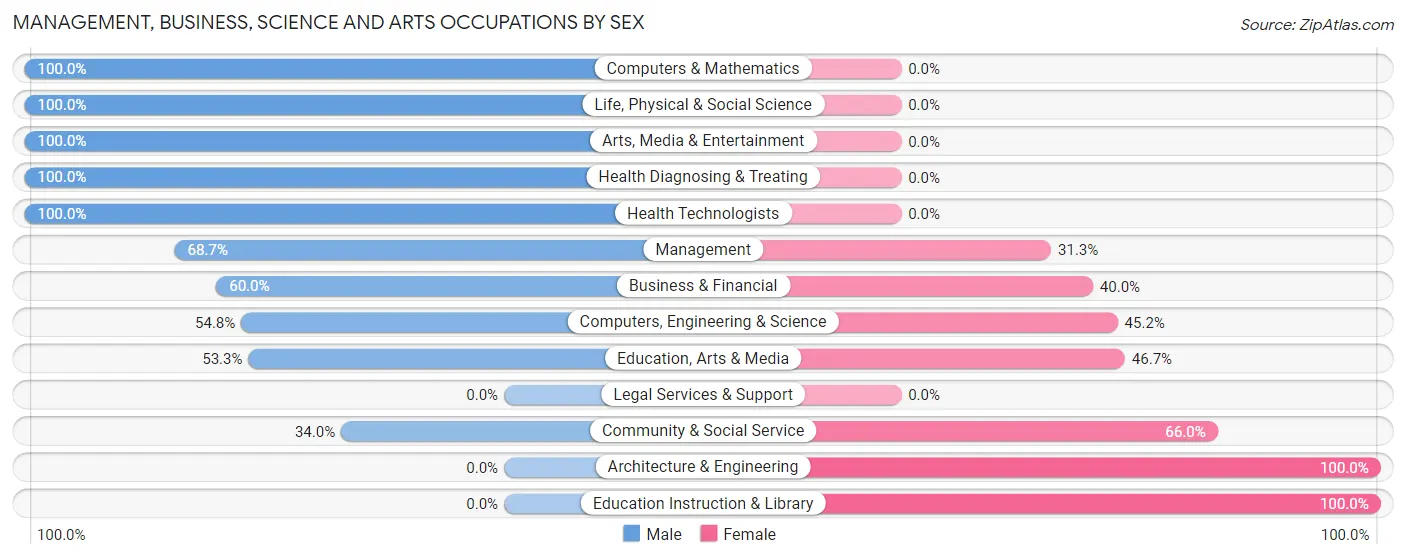
Management, Business, Science and Arts Occupations by Sex
Within the Management, Business, Science and Arts occupations in Kelly Ridge, the most male-oriented occupations are Computers & Mathematics (100.0%), Life, Physical & Social Science (100.0%), and Arts, Media & Entertainment (100.0%), while the most female-oriented occupations are Architecture & Engineering (100.0%), Education Instruction & Library (100.0%), and Community & Social Service (66.0%).
| Occupation | Male | Female |
| Management | 123 (68.7%) | 56 (31.3%) |
| Business & Financial | 27 (60.0%) | 18 (40.0%) |
| Computers, Engineering & Science | 17 (54.8%) | 14 (45.2%) |
| Computers & Mathematics | 7 (100.0%) | 0 (0.0%) |
| Architecture & Engineering | 0 (0.0%) | 14 (100.0%) |
| Life, Physical & Social Science | 10 (100.0%) | 0 (0.0%) |
| Community & Social Service | 17 (34.0%) | 33 (66.0%) |
| Education, Arts & Media | 8 (53.3%) | 7 (46.7%) |
| Legal Services & Support | 0 (0.0%) | 0 (0.0%) |
| Education Instruction & Library | 0 (0.0%) | 26 (100.0%) |
| Arts, Media & Entertainment | 9 (100.0%) | 0 (0.0%) |
| Health Diagnosing & Treating | 36 (100.0%) | 0 (0.0%) |
| Health Technologists | 36 (100.0%) | 0 (0.0%) |
| Total (Category) | 220 (64.5%) | 121 (35.5%) |
| Total (Overall) | 635 (57.4%) | 472 (42.6%) |
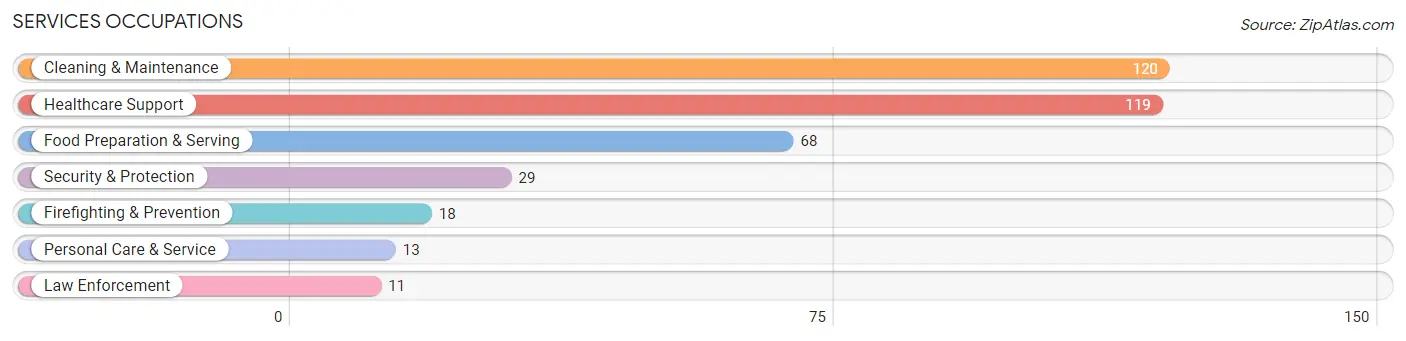
Services Occupations
The most common Services occupations in Kelly Ridge are Cleaning & Maintenance (120 | 10.8%), Healthcare Support (119 | 10.7%), Food Preparation & Serving (68 | 6.1%), Security & Protection (29 | 2.6%), and Firefighting & Prevention (18 | 1.6%).
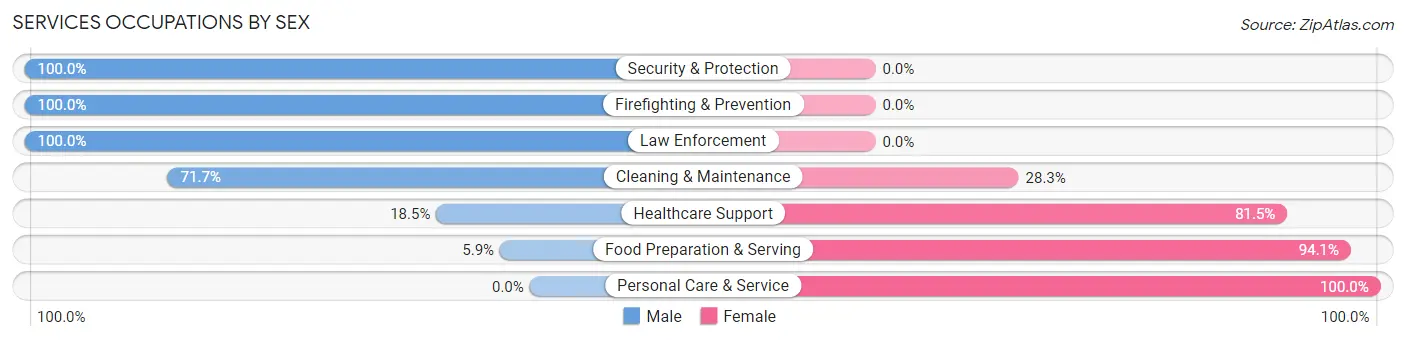
Services Occupations by Sex
Within the Services occupations in Kelly Ridge, the most male-oriented occupations are Security & Protection (100.0%), Firefighting & Prevention (100.0%), and Law Enforcement (100.0%), while the most female-oriented occupations are Personal Care & Service (100.0%), Food Preparation & Serving (94.1%), and Healthcare Support (81.5%).
| Occupation | Male | Female |
| Healthcare Support | 22 (18.5%) | 97 (81.5%) |
| Security & Protection | 29 (100.0%) | 0 (0.0%) |
| Firefighting & Prevention | 18 (100.0%) | 0 (0.0%) |
| Law Enforcement | 11 (100.0%) | 0 (0.0%) |
| Food Preparation & Serving | 4 (5.9%) | 64 (94.1%) |
| Cleaning & Maintenance | 86 (71.7%) | 34 (28.3%) |
| Personal Care & Service | 0 (0.0%) | 13 (100.0%) |
| Total (Category) | 141 (40.4%) | 208 (59.6%) |
| Total (Overall) | 635 (57.4%) | 472 (42.6%) |
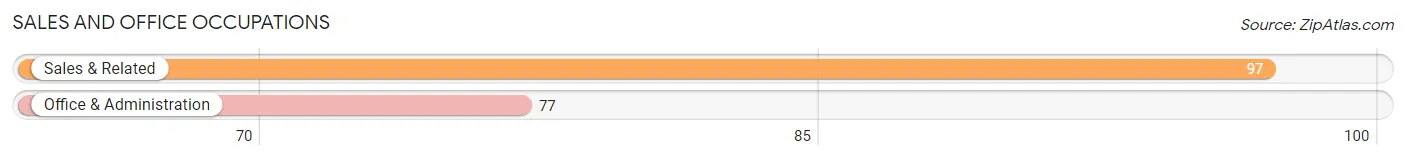
Sales and Office Occupations
The most common Sales and Office occupations in Kelly Ridge are Sales & Related (97 | 8.8%), and Office & Administration (77 | 7.0%).
Sales and Office Occupations by Sex
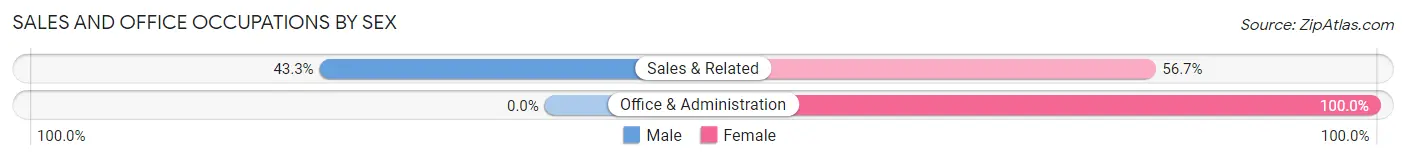
| Occupation | Male | Female |
| Sales & Related | 42 (43.3%) | 55 (56.7%) |
| Office & Administration | 0 (0.0%) | 77 (100.0%) |
| Total (Category) | 42 (24.1%) | 132 (75.9%) |
| Total (Overall) | 635 (57.4%) | 472 (42.6%) |
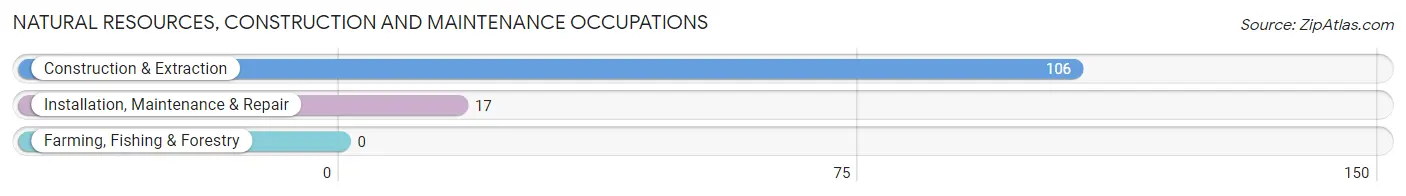
Natural Resources, Construction and Maintenance Occupations
The most common Natural Resources, Construction and Maintenance occupations in Kelly Ridge are Construction & Extraction (106 | 9.6%), and Installation, Maintenance & Repair (17 | 1.5%).
Natural Resources, Construction and Maintenance Occupations by Sex
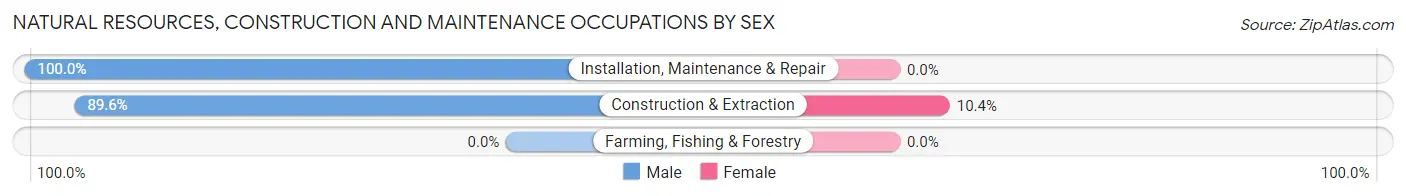
| Occupation | Male | Female |
| Farming, Fishing & Forestry | 0 (0.0%) | 0 (0.0%) |
| Construction & Extraction | 95 (89.6%) | 11 (10.4%) |
| Installation, Maintenance & Repair | 17 (100.0%) | 0 (0.0%) |
| Total (Category) | 112 (91.1%) | 11 (8.9%) |
| Total (Overall) | 635 (57.4%) | 472 (42.6%) |
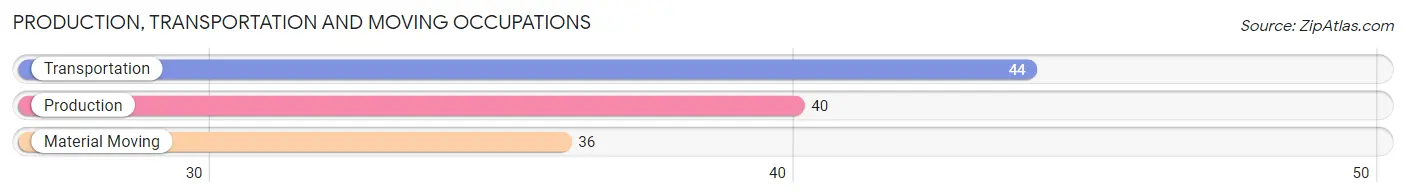
Production, Transportation and Moving Occupations
The most common Production, Transportation and Moving occupations in Kelly Ridge are Transportation (44 | 4.0%), Production (40 | 3.6%), and Material Moving (36 | 3.3%).
Production, Transportation and Moving Occupations by Sex
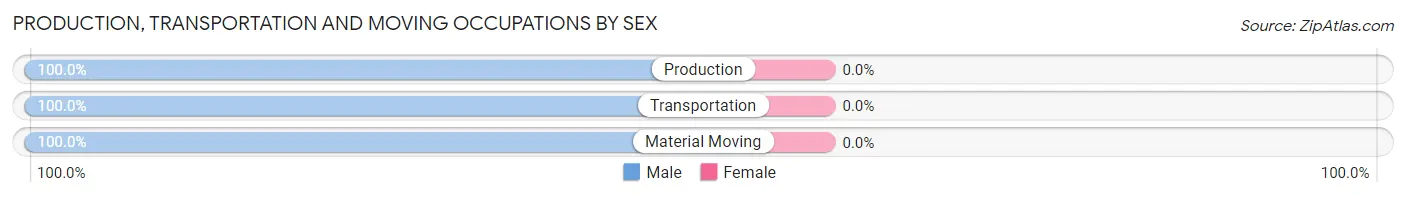
| Occupation | Male | Female |
| Production | 40 (100.0%) | 0 (0.0%) |
| Transportation | 44 (100.0%) | 0 (0.0%) |
| Material Moving | 36 (100.0%) | 0 (0.0%) |
| Total (Category) | 120 (100.0%) | 0 (0.0%) |
| Total (Overall) | 635 (57.4%) | 472 (42.6%) |
Employment Industries by Sex in Kelly Ridge
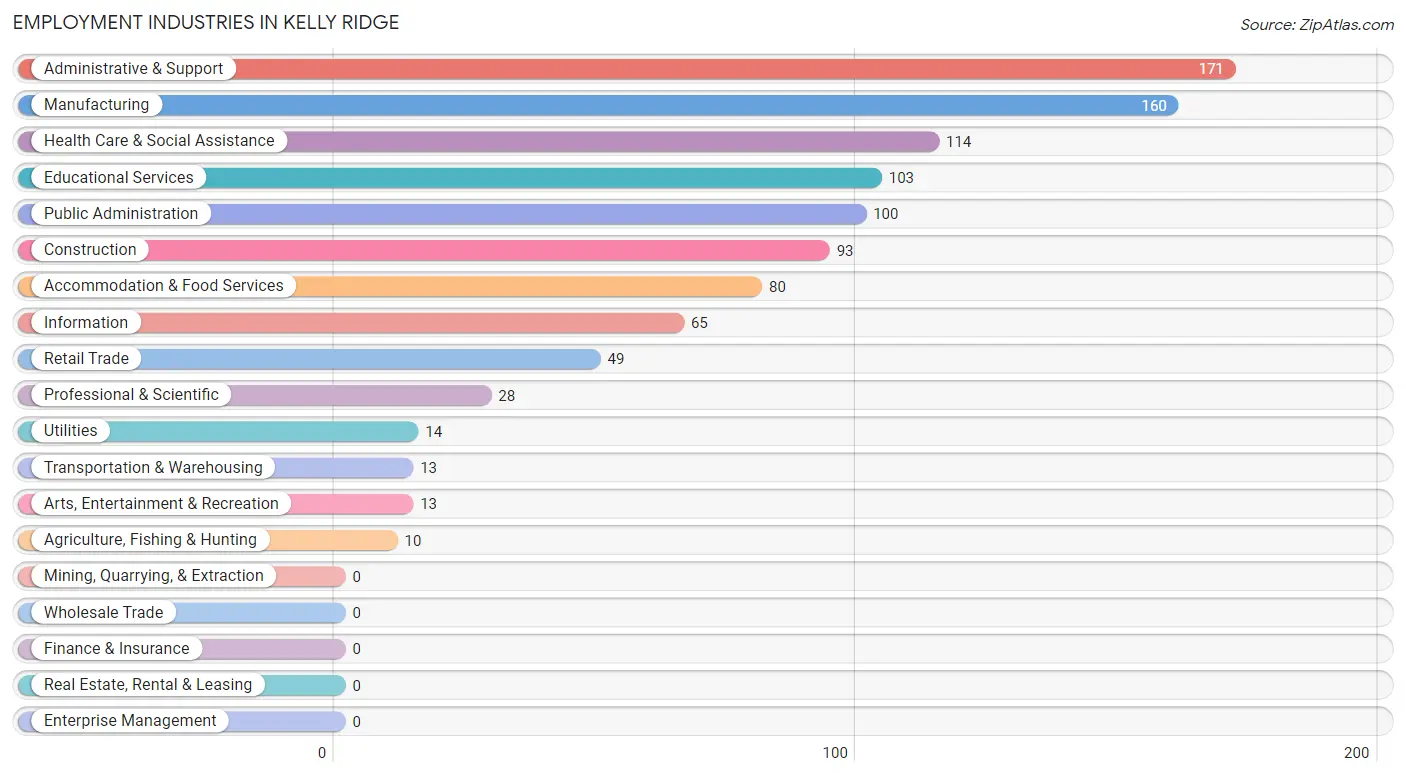
Employment Industries in Kelly Ridge
The major employment industries in Kelly Ridge include Administrative & Support (171 | 15.4%), Manufacturing (160 | 14.4%), Health Care & Social Assistance (114 | 10.3%), Educational Services (103 | 9.3%), and Public Administration (100 | 9.0%).
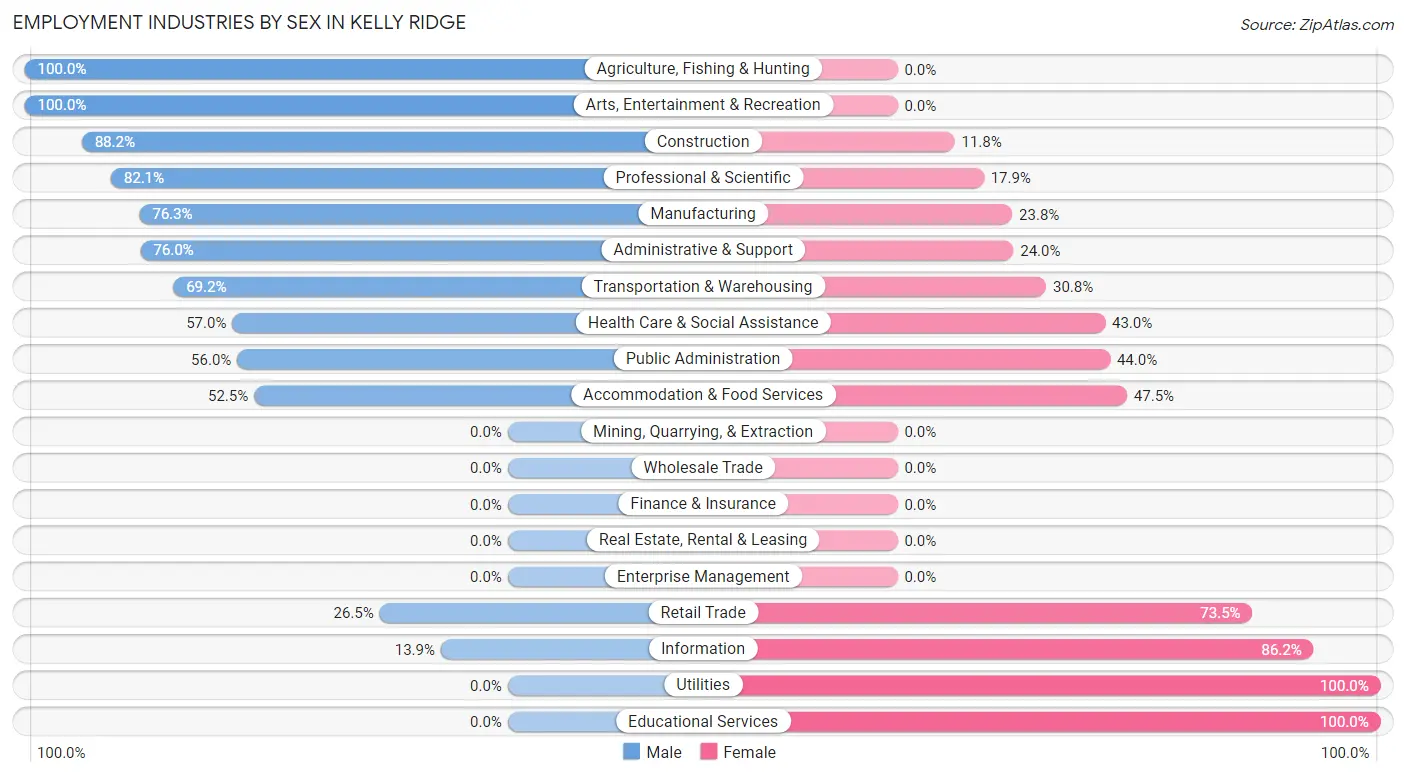
Employment Industries by Sex in Kelly Ridge
The Kelly Ridge industries that see more men than women are Agriculture, Fishing & Hunting (100.0%), Arts, Entertainment & Recreation (100.0%), and Construction (88.2%), whereas the industries that tend to have a higher number of women are Utilities (100.0%), Educational Services (100.0%), and Information (86.2%).
| Industry | Male | Female |
| Agriculture, Fishing & Hunting | 10 (100.0%) | 0 (0.0%) |
| Mining, Quarrying, & Extraction | 0 (0.0%) | 0 (0.0%) |
| Construction | 82 (88.2%) | 11 (11.8%) |
| Manufacturing | 122 (76.2%) | 38 (23.7%) |
| Wholesale Trade | 0 (0.0%) | 0 (0.0%) |
| Retail Trade | 13 (26.5%) | 36 (73.5%) |
| Transportation & Warehousing | 9 (69.2%) | 4 (30.8%) |
| Utilities | 0 (0.0%) | 14 (100.0%) |
| Information | 9 (13.9%) | 56 (86.2%) |
| Finance & Insurance | 0 (0.0%) | 0 (0.0%) |
| Real Estate, Rental & Leasing | 0 (0.0%) | 0 (0.0%) |
| Professional & Scientific | 23 (82.1%) | 5 (17.9%) |
| Enterprise Management | 0 (0.0%) | 0 (0.0%) |
| Administrative & Support | 130 (76.0%) | 41 (24.0%) |
| Educational Services | 0 (0.0%) | 103 (100.0%) |
| Health Care & Social Assistance | 65 (57.0%) | 49 (43.0%) |
| Arts, Entertainment & Recreation | 13 (100.0%) | 0 (0.0%) |
| Accommodation & Food Services | 42 (52.5%) | 38 (47.5%) |
| Public Administration | 56 (56.0%) | 44 (44.0%) |
| Total | 635 (57.4%) | 472 (42.6%) |
Education in Kelly Ridge
School Enrollment in Kelly Ridge
The most common levels of schooling among the 474 students in Kelly Ridge are high school (184 | 38.8%), middle school (99 | 20.9%), and college / undergraduate (97 | 20.5%).
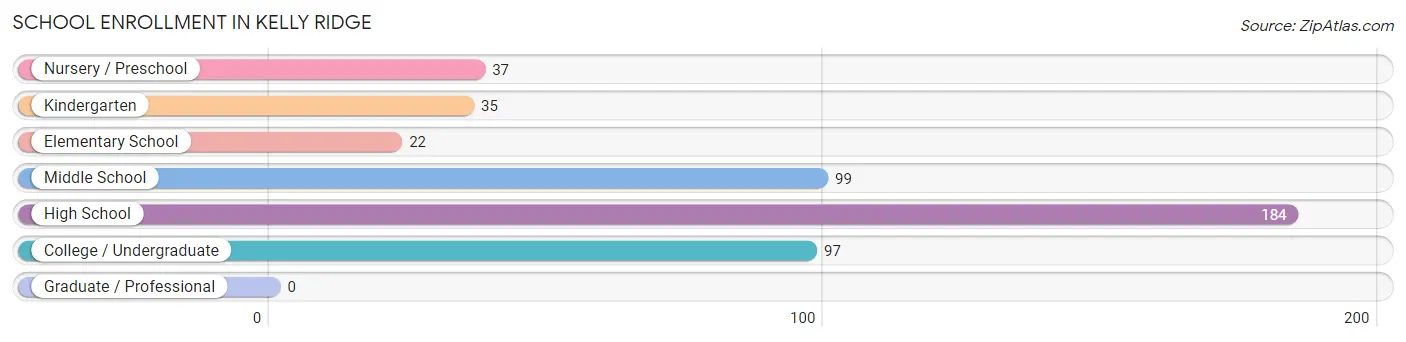
| School Level | # Students | % Students |
| Nursery / Preschool | 37 | 7.8% |
| Kindergarten | 35 | 7.4% |
| Elementary School | 22 | 4.6% |
| Middle School | 99 | 20.9% |
| High School | 184 | 38.8% |
| College / Undergraduate | 97 | 20.5% |
| Graduate / Professional | 0 | 0.0% |
| Total | 474 | 100.0% |
School Enrollment by Age by Funding Source in Kelly Ridge
Out of a total of 474 students who are enrolled in schools in Kelly Ridge, 57 (12.0%) attend a private institution, while the remaining 417 (88.0%) are enrolled in public schools. The age group of 3 to 4 year olds has the highest likelihood of being enrolled in private schools, with 37 (100.0% in the age bracket) enrolled. Conversely, the age group of 5 to 9 year old has the lowest likelihood of being enrolled in a private school, with 57 (100.0% in the age bracket) attending a public institution.
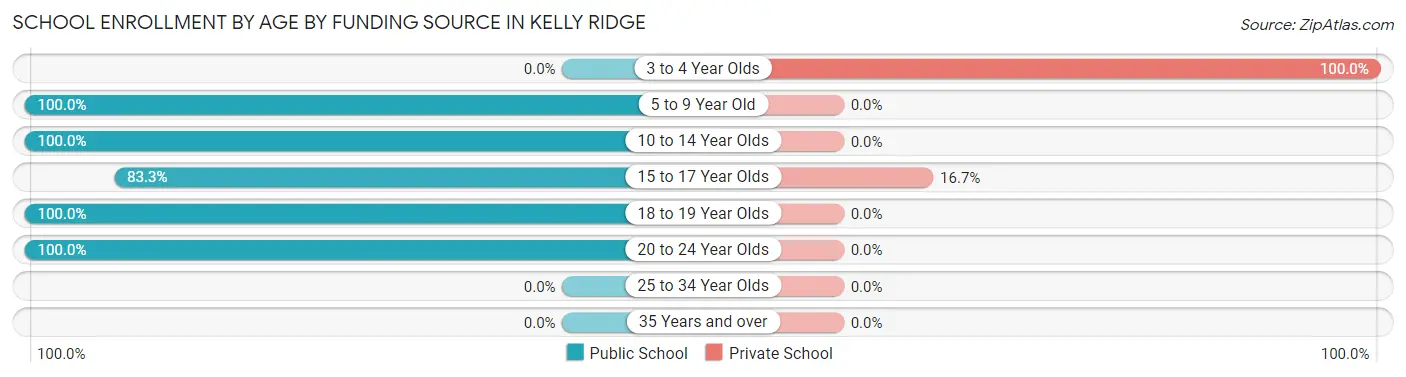
| Age Bracket | Public School | Private School |
| 3 to 4 Year Olds | 0 (0.0%) | 37 (100.0%) |
| 5 to 9 Year Old | 57 (100.0%) | 0 (0.0%) |
| 10 to 14 Year Olds | 119 (100.0%) | 0 (0.0%) |
| 15 to 17 Year Olds | 100 (83.3%) | 20 (16.7%) |
| 18 to 19 Year Olds | 114 (100.0%) | 0 (0.0%) |
| 20 to 24 Year Olds | 27 (100.0%) | 0 (0.0%) |
| 25 to 34 Year Olds | 0 (0.0%) | 0 (0.0%) |
| 35 Years and over | 0 (0.0%) | 0 (0.0%) |
| Total | 417 (88.0%) | 57 (12.0%) |
Educational Attainment by Field of Study in Kelly Ridge
Bio, nature & agricultural (144 | 24.6%), business (129 | 22.0%), social sciences (71 | 12.1%), science & technology (57 | 9.7%), and visual & performing arts (53 | 9.0%) are the most common fields of study among 586 individuals in Kelly Ridge who have obtained a bachelor's degree or higher.
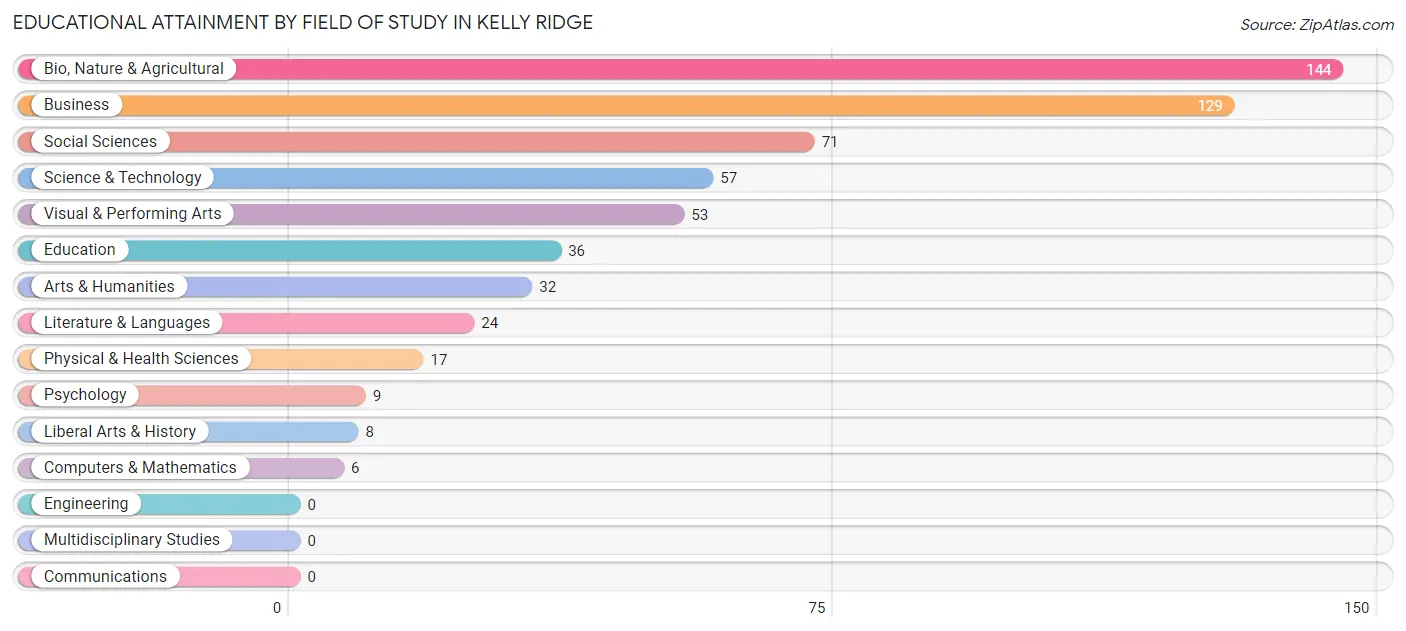
| Field of Study | # Graduates | % Graduates |
| Computers & Mathematics | 6 | 1.0% |
| Bio, Nature & Agricultural | 144 | 24.6% |
| Physical & Health Sciences | 17 | 2.9% |
| Psychology | 9 | 1.5% |
| Social Sciences | 71 | 12.1% |
| Engineering | 0 | 0.0% |
| Multidisciplinary Studies | 0 | 0.0% |
| Science & Technology | 57 | 9.7% |
| Business | 129 | 22.0% |
| Education | 36 | 6.1% |
| Literature & Languages | 24 | 4.1% |
| Liberal Arts & History | 8 | 1.4% |
| Visual & Performing Arts | 53 | 9.0% |
| Communications | 0 | 0.0% |
| Arts & Humanities | 32 | 5.5% |
| Total | 586 | 100.0% |
Transportation & Commute in Kelly Ridge
Vehicle Availability by Sex in Kelly Ridge
The most prevalent vehicle ownership categories in Kelly Ridge are males with 2 vehicles (287, accounting for 47.1%) and females with 2 vehicles (213, making up 66.0%).
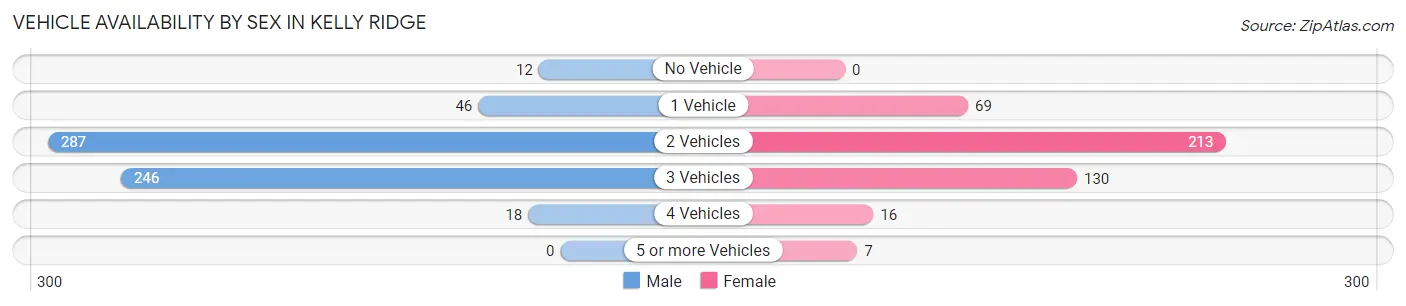
| Vehicles Available | Male | Female |
| No Vehicle | 12 (2.0%) | 0 (0.0%) |
| 1 Vehicle | 46 (7.5%) | 69 (15.9%) |
| 2 Vehicles | 287 (47.1%) | 213 (49.0%) |
| 3 Vehicles | 246 (40.4%) | 130 (29.9%) |
| 4 Vehicles | 18 (3.0%) | 16 (3.7%) |
| 5 or more Vehicles | 0 (0.0%) | 7 (1.6%) |
| Total | 609 (100.0%) | 435 (100.0%) |
Commute Time in Kelly Ridge
The most frequently occuring commute durations in Kelly Ridge are 15 to 19 minutes (217 commuters, 24.1%), 20 to 24 minutes (135 commuters, 15.0%), and 5 to 9 minutes (133 commuters, 14.8%).
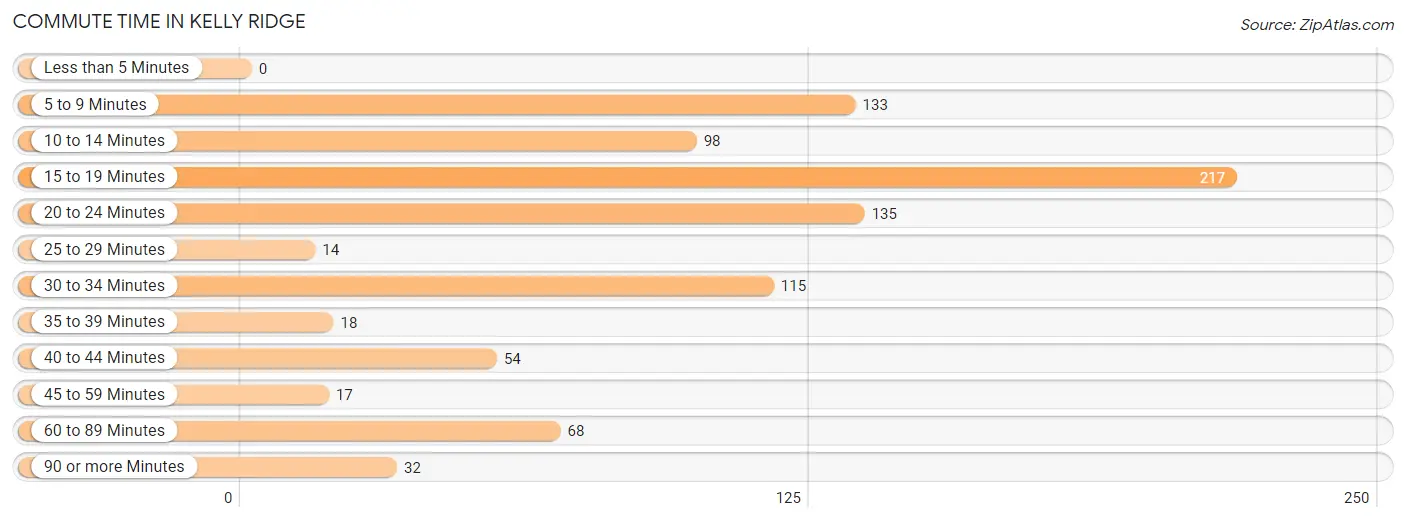
| Commute Time | # Commuters | % Commuters |
| Less than 5 Minutes | 0 | 0.0% |
| 5 to 9 Minutes | 133 | 14.8% |
| 10 to 14 Minutes | 98 | 10.9% |
| 15 to 19 Minutes | 217 | 24.1% |
| 20 to 24 Minutes | 135 | 15.0% |
| 25 to 29 Minutes | 14 | 1.5% |
| 30 to 34 Minutes | 115 | 12.8% |
| 35 to 39 Minutes | 18 | 2.0% |
| 40 to 44 Minutes | 54 | 6.0% |
| 45 to 59 Minutes | 17 | 1.9% |
| 60 to 89 Minutes | 68 | 7.5% |
| 90 or more Minutes | 32 | 3.5% |
Commute Time by Sex in Kelly Ridge
The most common commute times in Kelly Ridge are 30 to 34 minutes (115 commuters, 22.8%) for males and 15 to 19 minutes (162 commuters, 40.9%) for females.
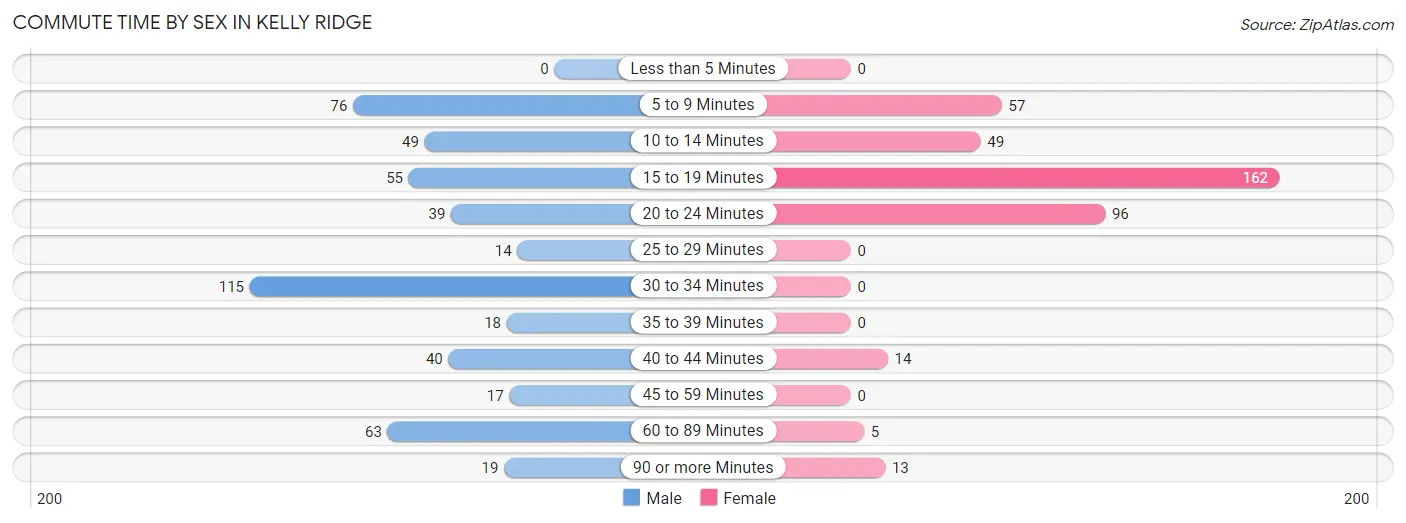
| Commute Time | Male | Female |
| Less than 5 Minutes | 0 (0.0%) | 0 (0.0%) |
| 5 to 9 Minutes | 76 (15.0%) | 57 (14.4%) |
| 10 to 14 Minutes | 49 (9.7%) | 49 (12.4%) |
| 15 to 19 Minutes | 55 (10.9%) | 162 (40.9%) |
| 20 to 24 Minutes | 39 (7.7%) | 96 (24.2%) |
| 25 to 29 Minutes | 14 (2.8%) | 0 (0.0%) |
| 30 to 34 Minutes | 115 (22.8%) | 0 (0.0%) |
| 35 to 39 Minutes | 18 (3.6%) | 0 (0.0%) |
| 40 to 44 Minutes | 40 (7.9%) | 14 (3.5%) |
| 45 to 59 Minutes | 17 (3.4%) | 0 (0.0%) |
| 60 to 89 Minutes | 63 (12.5%) | 5 (1.3%) |
| 90 or more Minutes | 19 (3.8%) | 13 (3.3%) |
Time of Departure to Work by Sex in Kelly Ridge
The most frequent times of departure to work in Kelly Ridge are 9:00 AM to 9:59 AM (73, 14.5%) for males and 8:00 AM to 8:29 AM (94, 23.7%) for females.
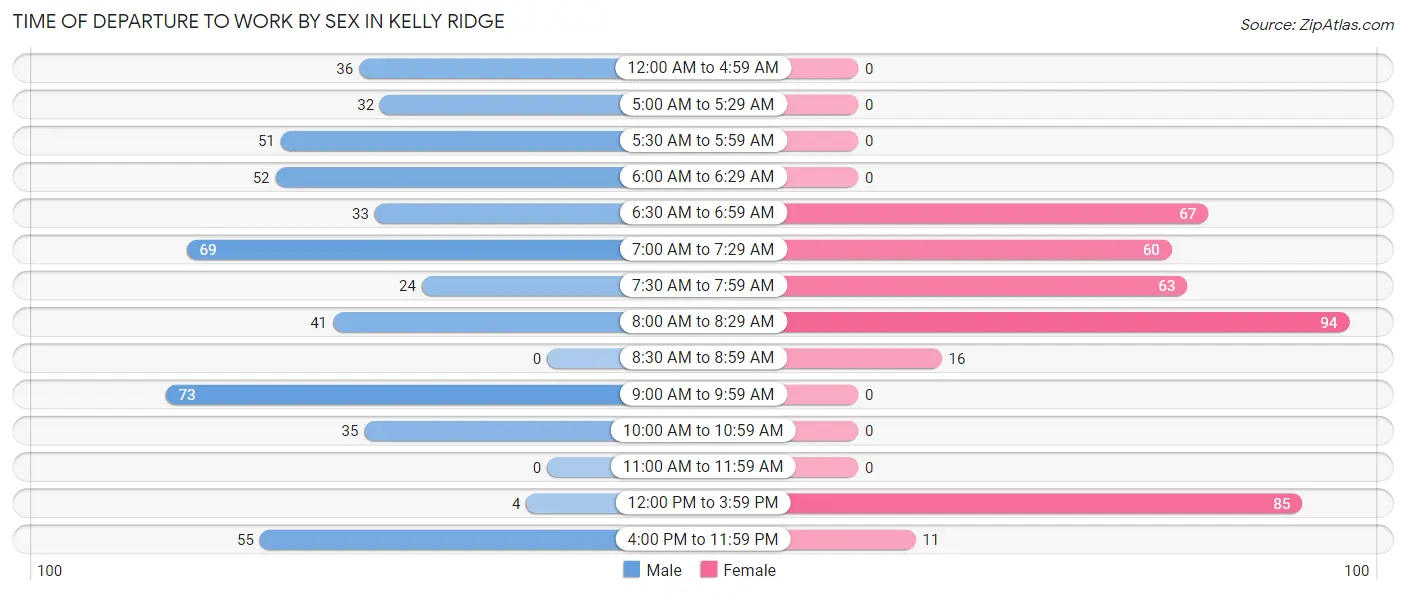
| Time of Departure | Male | Female |
| 12:00 AM to 4:59 AM | 36 (7.1%) | 0 (0.0%) |
| 5:00 AM to 5:29 AM | 32 (6.3%) | 0 (0.0%) |
| 5:30 AM to 5:59 AM | 51 (10.1%) | 0 (0.0%) |
| 6:00 AM to 6:29 AM | 52 (10.3%) | 0 (0.0%) |
| 6:30 AM to 6:59 AM | 33 (6.5%) | 67 (16.9%) |
| 7:00 AM to 7:29 AM | 69 (13.7%) | 60 (15.1%) |
| 7:30 AM to 7:59 AM | 24 (4.8%) | 63 (15.9%) |
| 8:00 AM to 8:29 AM | 41 (8.1%) | 94 (23.7%) |
| 8:30 AM to 8:59 AM | 0 (0.0%) | 16 (4.0%) |
| 9:00 AM to 9:59 AM | 73 (14.5%) | 0 (0.0%) |
| 10:00 AM to 10:59 AM | 35 (6.9%) | 0 (0.0%) |
| 11:00 AM to 11:59 AM | 0 (0.0%) | 0 (0.0%) |
| 12:00 PM to 3:59 PM | 4 (0.8%) | 85 (21.5%) |
| 4:00 PM to 11:59 PM | 55 (10.9%) | 11 (2.8%) |
| Total | 505 (100.0%) | 396 (100.0%) |
Housing Occupancy in Kelly Ridge
Occupancy by Ownership in Kelly Ridge
Of the total 1,439 dwellings in Kelly Ridge, owner-occupied units account for 1,307 (90.8%), while renter-occupied units make up 132 (9.2%).
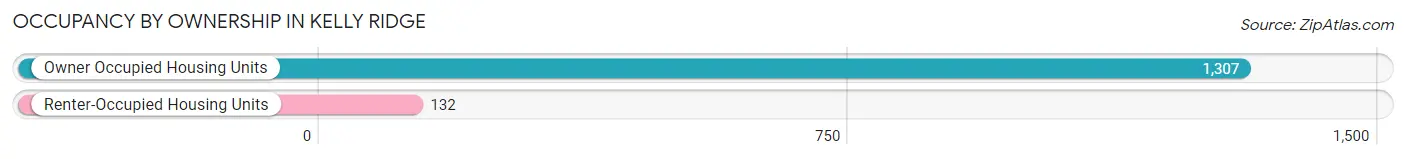
| Occupancy | # Housing Units | % Housing Units |
| Owner Occupied Housing Units | 1,307 | 90.8% |
| Renter-Occupied Housing Units | 132 | 9.2% |
| Total Occupied Housing Units | 1,439 | 100.0% |
Occupancy by Household Size in Kelly Ridge
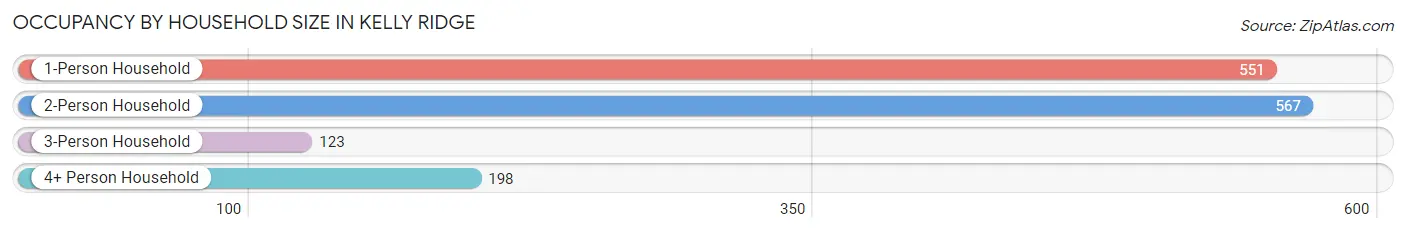
| Household Size | # Housing Units | % Housing Units |
| 1-Person Household | 551 | 38.3% |
| 2-Person Household | 567 | 39.4% |
| 3-Person Household | 123 | 8.6% |
| 4+ Person Household | 198 | 13.8% |
| Total Housing Units | 1,439 | 100.0% |
Occupancy by Ownership by Household Size in Kelly Ridge
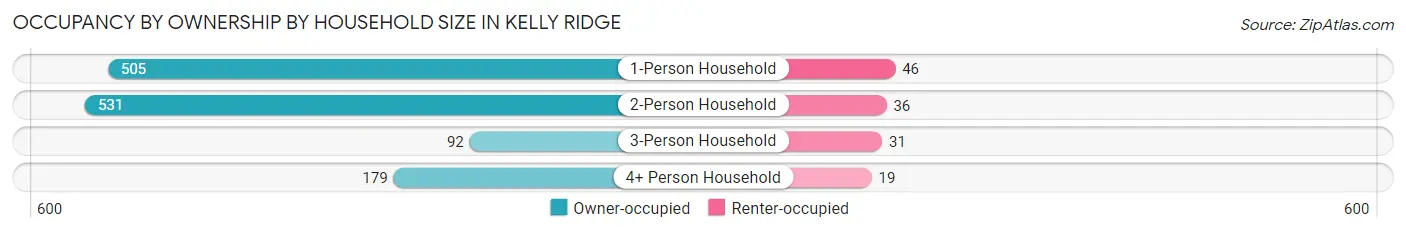
| Household Size | Owner-occupied | Renter-occupied |
| 1-Person Household | 505 (91.6%) | 46 (8.4%) |
| 2-Person Household | 531 (93.6%) | 36 (6.4%) |
| 3-Person Household | 92 (74.8%) | 31 (25.2%) |
| 4+ Person Household | 179 (90.4%) | 19 (9.6%) |
| Total Housing Units | 1,307 (90.8%) | 132 (9.2%) |
Occupancy by Educational Attainment in Kelly Ridge
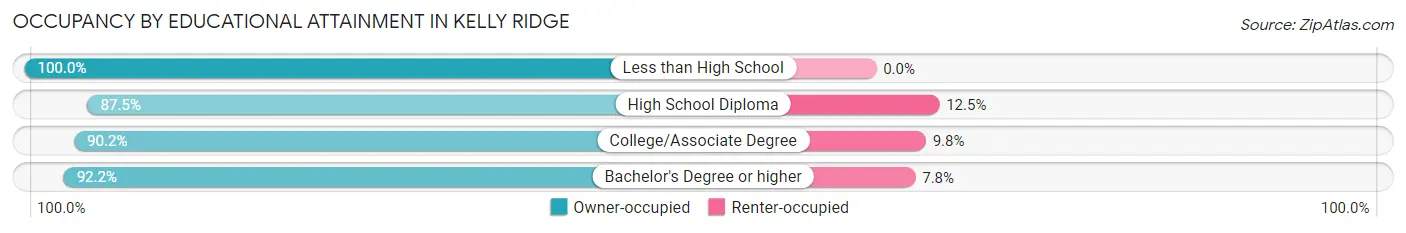
| Household Size | Owner-occupied | Renter-occupied |
| Less than High School | 94 (100.0%) | 0 (0.0%) |
| High School Diploma | 231 (87.5%) | 33 (12.5%) |
| College/Associate Degree | 661 (90.2%) | 72 (9.8%) |
| Bachelor's Degree or higher | 321 (92.2%) | 27 (7.8%) |
Occupancy by Age of Householder in Kelly Ridge
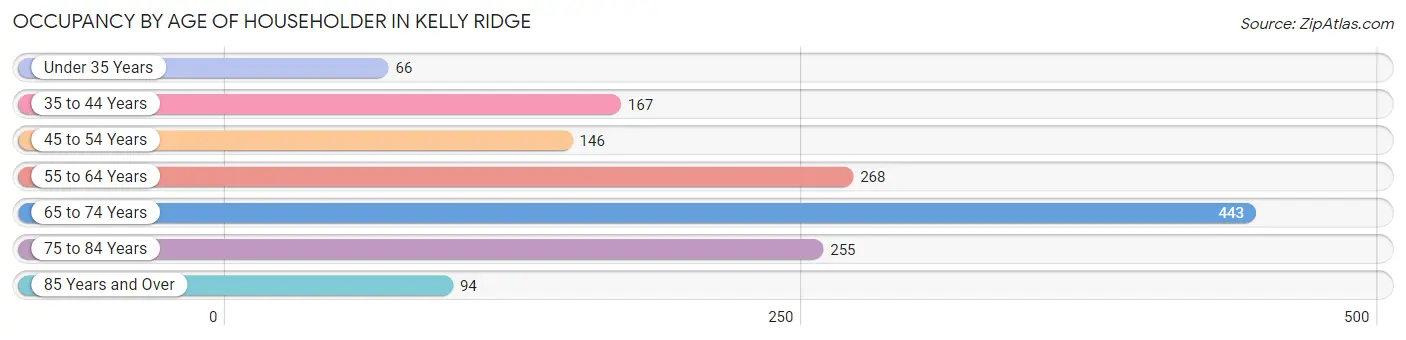
| Age Bracket | # Households | % Households |
| Under 35 Years | 66 | 4.6% |
| 35 to 44 Years | 167 | 11.6% |
| 45 to 54 Years | 146 | 10.2% |
| 55 to 64 Years | 268 | 18.6% |
| 65 to 74 Years | 443 | 30.8% |
| 75 to 84 Years | 255 | 17.7% |
| 85 Years and Over | 94 | 6.5% |
| Total | 1,439 | 100.0% |
Housing Finances in Kelly Ridge
Median Income by Occupancy in Kelly Ridge
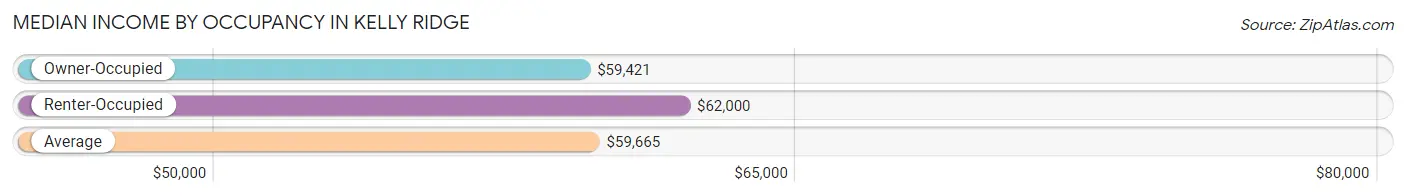
| Occupancy Type | # Households | Median Income |
| Owner-Occupied | 1,307 (90.8%) | $59,421 |
| Renter-Occupied | 132 (9.2%) | $62,000 |
| Average | 1,439 (100.0%) | $59,665 |
Occupancy by Householder Income Bracket in Kelly Ridge
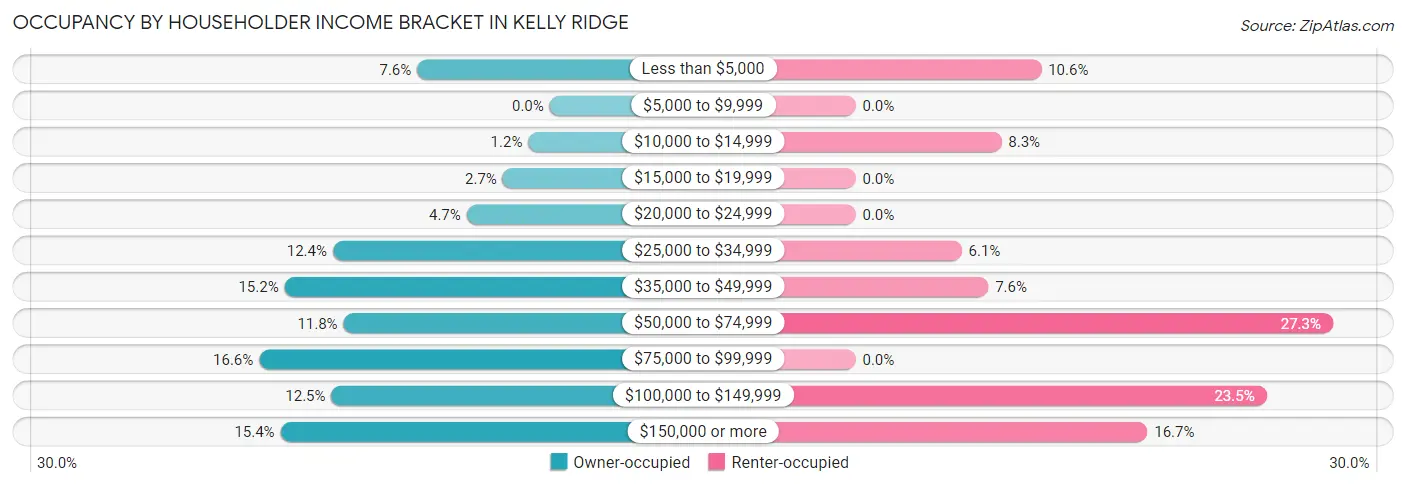
| Income Bracket | Owner-occupied | Renter-occupied |
| Less than $5,000 | 99 (7.6%) | 14 (10.6%) |
| $5,000 to $9,999 | 0 (0.0%) | 0 (0.0%) |
| $10,000 to $14,999 | 16 (1.2%) | 11 (8.3%) |
| $15,000 to $19,999 | 35 (2.7%) | 0 (0.0%) |
| $20,000 to $24,999 | 62 (4.7%) | 0 (0.0%) |
| $25,000 to $34,999 | 162 (12.4%) | 8 (6.1%) |
| $35,000 to $49,999 | 198 (15.1%) | 10 (7.6%) |
| $50,000 to $74,999 | 154 (11.8%) | 36 (27.3%) |
| $75,000 to $99,999 | 217 (16.6%) | 0 (0.0%) |
| $100,000 to $149,999 | 163 (12.5%) | 31 (23.5%) |
| $150,000 or more | 201 (15.4%) | 22 (16.7%) |
| Total | 1,307 (100.0%) | 132 (100.0%) |
Monthly Housing Cost Tiers in Kelly Ridge
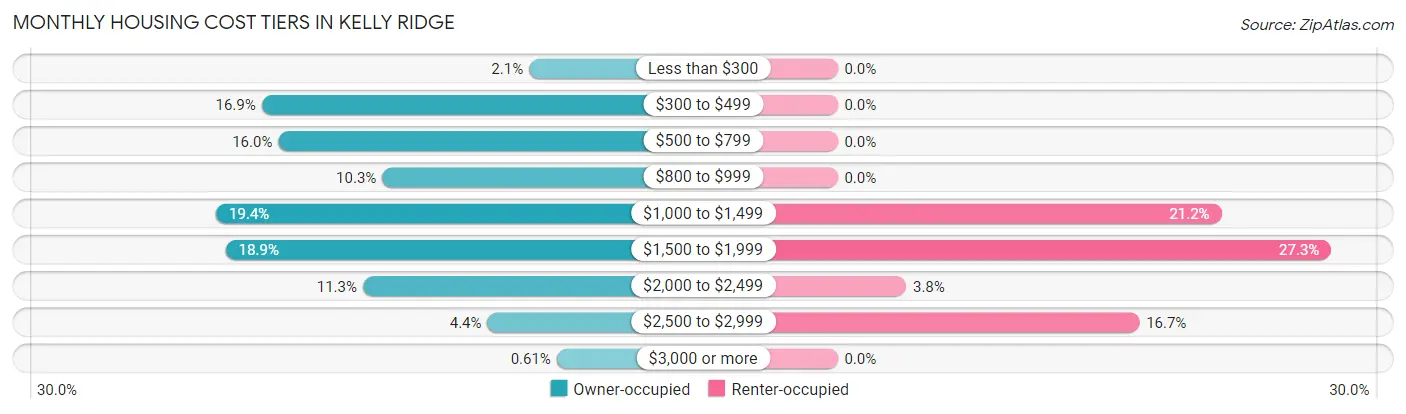
| Monthly Cost | Owner-occupied | Renter-occupied |
| Less than $300 | 28 (2.1%) | 0 (0.0%) |
| $300 to $499 | 221 (16.9%) | 0 (0.0%) |
| $500 to $799 | 209 (16.0%) | 0 (0.0%) |
| $800 to $999 | 134 (10.2%) | 0 (0.0%) |
| $1,000 to $1,499 | 254 (19.4%) | 28 (21.2%) |
| $1,500 to $1,999 | 247 (18.9%) | 36 (27.3%) |
| $2,000 to $2,499 | 148 (11.3%) | 5 (3.8%) |
| $2,500 to $2,999 | 58 (4.4%) | 22 (16.7%) |
| $3,000 or more | 8 (0.6%) | 0 (0.0%) |
| Total | 1,307 (100.0%) | 132 (100.0%) |
Physical Housing Characteristics in Kelly Ridge
Housing Structures in Kelly Ridge
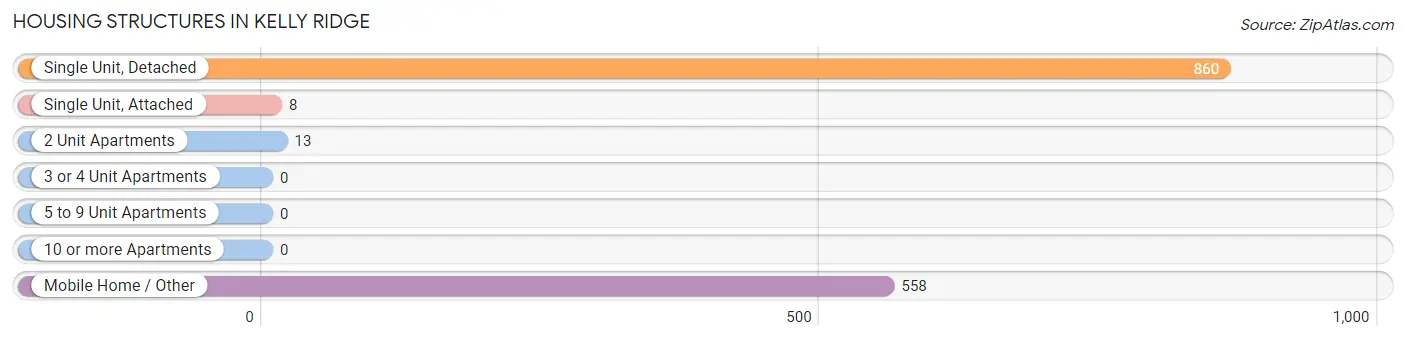
| Structure Type | # Housing Units | % Housing Units |
| Single Unit, Detached | 860 | 59.8% |
| Single Unit, Attached | 8 | 0.6% |
| 2 Unit Apartments | 13 | 0.9% |
| 3 or 4 Unit Apartments | 0 | 0.0% |
| 5 to 9 Unit Apartments | 0 | 0.0% |
| 10 or more Apartments | 0 | 0.0% |
| Mobile Home / Other | 558 | 38.8% |
| Total | 1,439 | 100.0% |
Housing Structures by Occupancy in Kelly Ridge
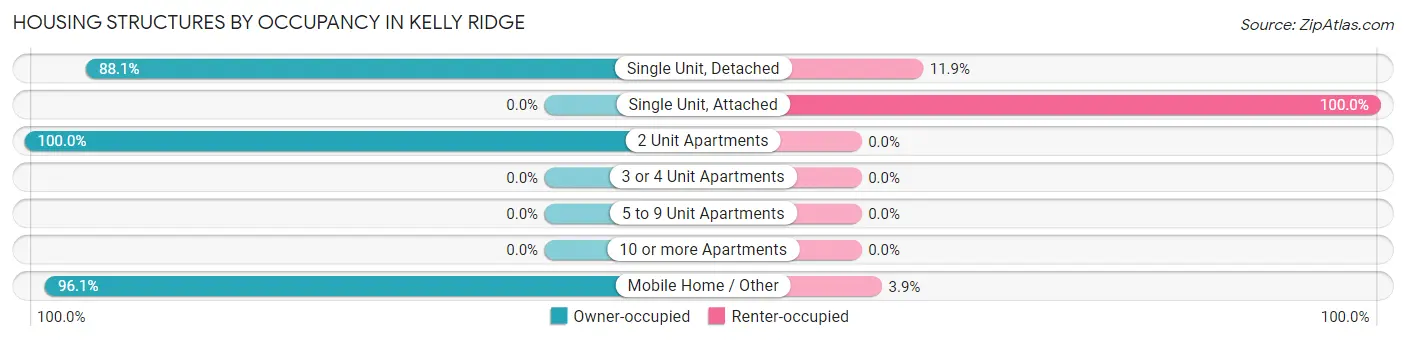
| Structure Type | Owner-occupied | Renter-occupied |
| Single Unit, Detached | 758 (88.1%) | 102 (11.9%) |
| Single Unit, Attached | 0 (0.0%) | 8 (100.0%) |
| 2 Unit Apartments | 13 (100.0%) | 0 (0.0%) |
| 3 or 4 Unit Apartments | 0 (0.0%) | 0 (0.0%) |
| 5 to 9 Unit Apartments | 0 (0.0%) | 0 (0.0%) |
| 10 or more Apartments | 0 (0.0%) | 0 (0.0%) |
| Mobile Home / Other | 536 (96.1%) | 22 (3.9%) |
| Total | 1,307 (90.8%) | 132 (9.2%) |
Housing Structures by Number of Rooms in Kelly Ridge
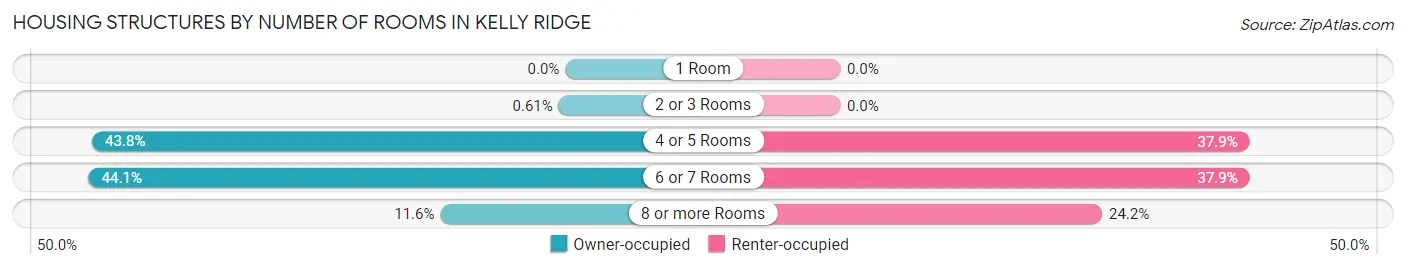
| Number of Rooms | Owner-occupied | Renter-occupied |
| 1 Room | 0 (0.0%) | 0 (0.0%) |
| 2 or 3 Rooms | 8 (0.6%) | 0 (0.0%) |
| 4 or 5 Rooms | 572 (43.8%) | 50 (37.9%) |
| 6 or 7 Rooms | 576 (44.1%) | 50 (37.9%) |
| 8 or more Rooms | 151 (11.6%) | 32 (24.2%) |
| Total | 1,307 (100.0%) | 132 (100.0%) |
Housing Structure by Heating Type in Kelly Ridge
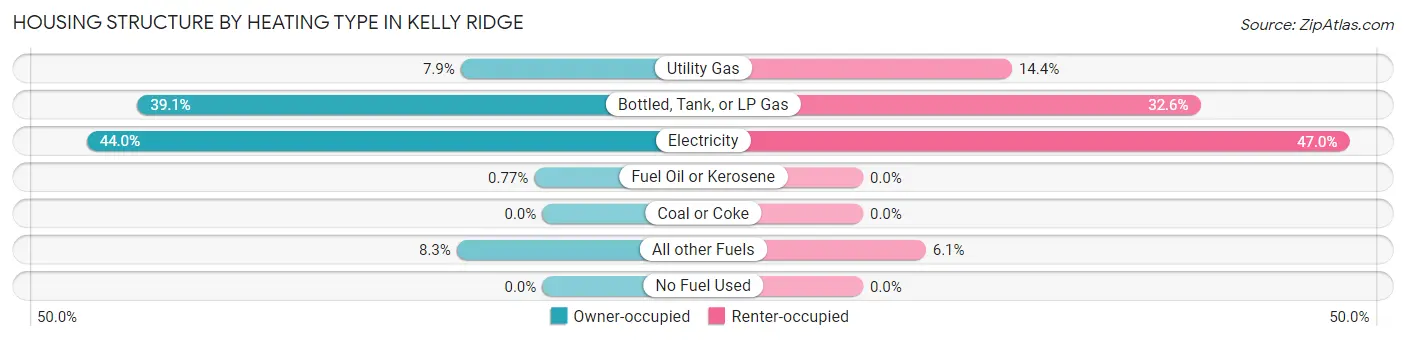
| Heating Type | Owner-occupied | Renter-occupied |
| Utility Gas | 103 (7.9%) | 19 (14.4%) |
| Bottled, Tank, or LP Gas | 511 (39.1%) | 43 (32.6%) |
| Electricity | 575 (44.0%) | 62 (47.0%) |
| Fuel Oil or Kerosene | 10 (0.8%) | 0 (0.0%) |
| Coal or Coke | 0 (0.0%) | 0 (0.0%) |
| All other Fuels | 108 (8.3%) | 8 (6.1%) |
| No Fuel Used | 0 (0.0%) | 0 (0.0%) |
| Total | 1,307 (100.0%) | 132 (100.0%) |
Household Vehicle Usage in Kelly Ridge
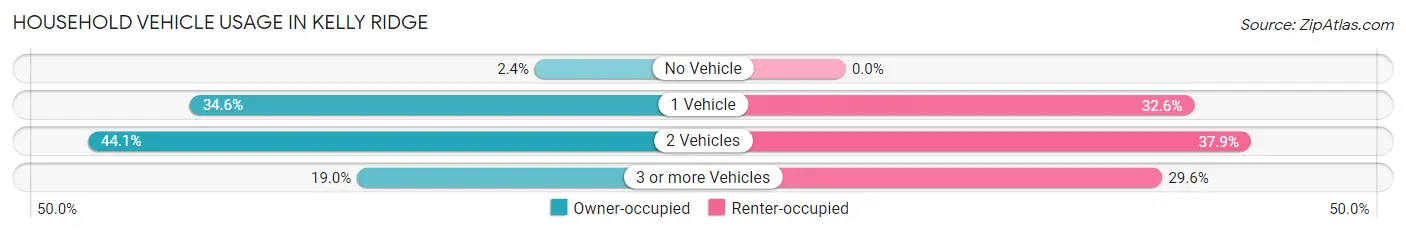
| Vehicles per Household | Owner-occupied | Renter-occupied |
| No Vehicle | 31 (2.4%) | 0 (0.0%) |
| 1 Vehicle | 452 (34.6%) | 43 (32.6%) |
| 2 Vehicles | 576 (44.1%) | 50 (37.9%) |
| 3 or more Vehicles | 248 (19.0%) | 39 (29.5%) |
| Total | 1,307 (100.0%) | 132 (100.0%) |
Real Estate & Mortgages in Kelly Ridge
Real Estate and Mortgage Overview in Kelly Ridge
| Characteristic | Without Mortgage | With Mortgage |
| Housing Units | 640 | 667 |
| Median Property Value | $223,200 | $274,200 |
| Median Household Income | $43,889 | $142 |
| Monthly Housing Costs | $654 | $8 |
| Real Estate Taxes | $1,413 | $0 |
Property Value by Mortgage Status in Kelly Ridge
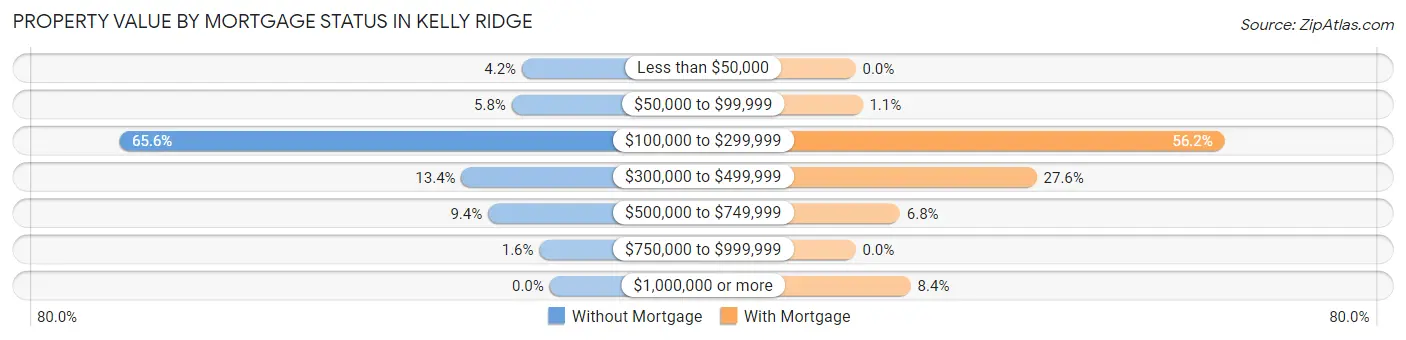
| Property Value | Without Mortgage | With Mortgage |
| Less than $50,000 | 27 (4.2%) | 0 (0.0%) |
| $50,000 to $99,999 | 37 (5.8%) | 7 (1.1%) |
| $100,000 to $299,999 | 420 (65.6%) | 375 (56.2%) |
| $300,000 to $499,999 | 86 (13.4%) | 184 (27.6%) |
| $500,000 to $749,999 | 60 (9.4%) | 45 (6.8%) |
| $750,000 to $999,999 | 10 (1.6%) | 0 (0.0%) |
| $1,000,000 or more | 0 (0.0%) | 56 (8.4%) |
| Total | 640 (100.0%) | 667 (100.0%) |
Household Income by Mortgage Status in Kelly Ridge
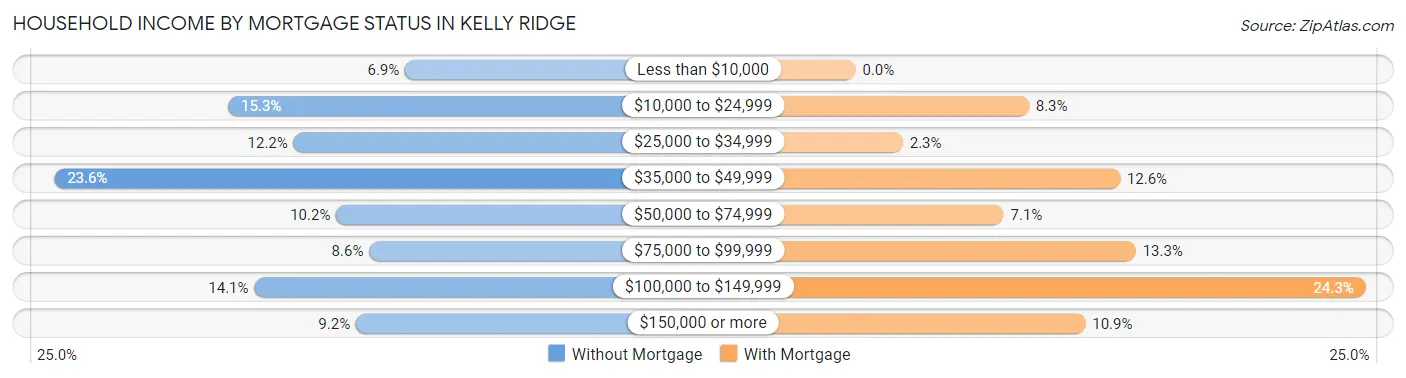
| Household Income | Without Mortgage | With Mortgage |
| Less than $10,000 | 44 (6.9%) | 0 (0.0%) |
| $10,000 to $24,999 | 98 (15.3%) | 55 (8.3%) |
| $25,000 to $34,999 | 78 (12.2%) | 15 (2.2%) |
| $35,000 to $49,999 | 151 (23.6%) | 84 (12.6%) |
| $50,000 to $74,999 | 65 (10.2%) | 47 (7.0%) |
| $75,000 to $99,999 | 55 (8.6%) | 89 (13.3%) |
| $100,000 to $149,999 | 90 (14.1%) | 162 (24.3%) |
| $150,000 or more | 59 (9.2%) | 73 (10.9%) |
| Total | 640 (100.0%) | 667 (100.0%) |
Property Value to Household Income Ratio in Kelly Ridge
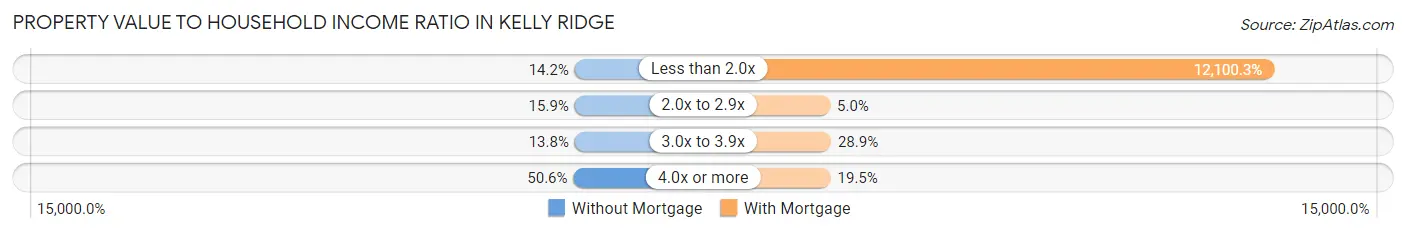
| Value-to-Income Ratio | Without Mortgage | With Mortgage |
| Less than 2.0x | 91 (14.2%) | 80,709 (12,100.3%) |
| 2.0x to 2.9x | 102 (15.9%) | 33 (5.0%) |
| 3.0x to 3.9x | 88 (13.8%) | 193 (28.9%) |
| 4.0x or more | 324 (50.6%) | 130 (19.5%) |
| Total | 640 (100.0%) | 667 (100.0%) |
Real Estate Taxes by Mortgage Status in Kelly Ridge
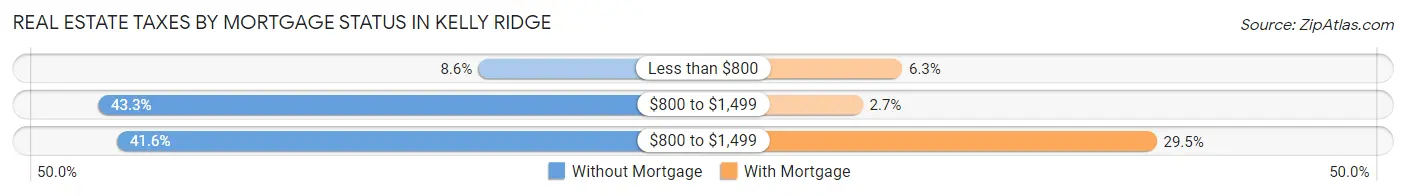
| Property Taxes | Without Mortgage | With Mortgage |
| Less than $800 | 55 (8.6%) | 42 (6.3%) |
| $800 to $1,499 | 277 (43.3%) | 18 (2.7%) |
| $800 to $1,499 | 266 (41.6%) | 197 (29.5%) |
| Total | 640 (100.0%) | 667 (100.0%) |
Health & Disability in Kelly Ridge
Health Insurance Coverage by Age in Kelly Ridge
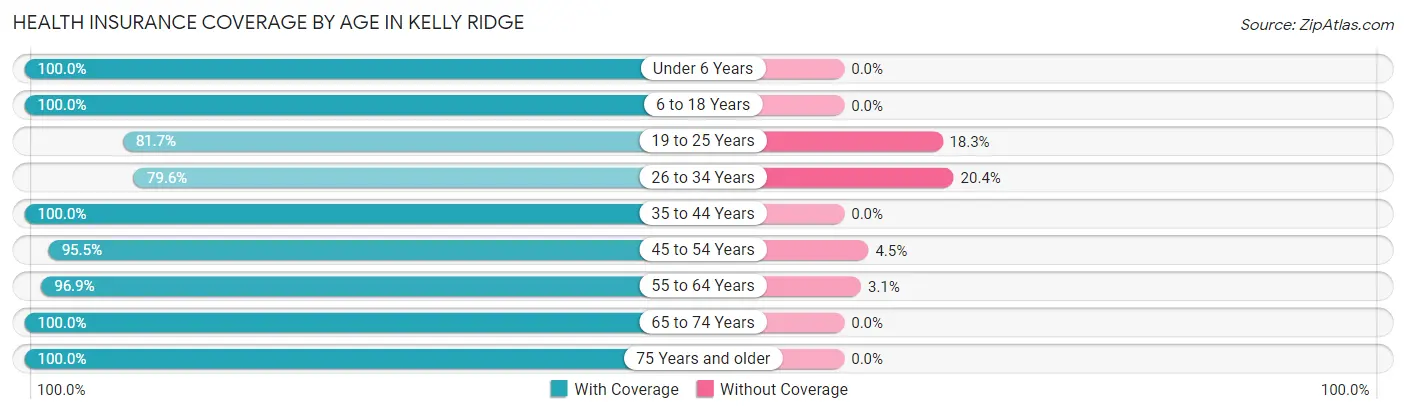
| Age Bracket | With Coverage | Without Coverage |
| Under 6 Years | 72 (100.0%) | 0 (0.0%) |
| 6 to 18 Years | 345 (100.0%) | 0 (0.0%) |
| 19 to 25 Years | 183 (81.7%) | 41 (18.3%) |
| 26 to 34 Years | 121 (79.6%) | 31 (20.4%) |
| 35 to 44 Years | 279 (100.0%) | 0 (0.0%) |
| 45 to 54 Years | 275 (95.5%) | 13 (4.5%) |
| 55 to 64 Years | 404 (96.9%) | 13 (3.1%) |
| 65 to 74 Years | 835 (100.0%) | 0 (0.0%) |
| 75 Years and older | 556 (100.0%) | 0 (0.0%) |
| Total | 3,070 (96.9%) | 98 (3.1%) |
Health Insurance Coverage by Citizenship Status in Kelly Ridge
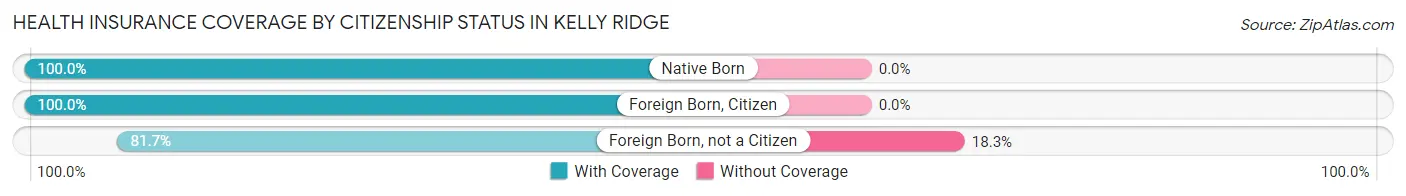
| Citizenship Status | With Coverage | Without Coverage |
| Native Born | 72 (100.0%) | 0 (0.0%) |
| Foreign Born, Citizen | 345 (100.0%) | 0 (0.0%) |
| Foreign Born, not a Citizen | 183 (81.7%) | 41 (18.3%) |
Health Insurance Coverage by Household Income in Kelly Ridge
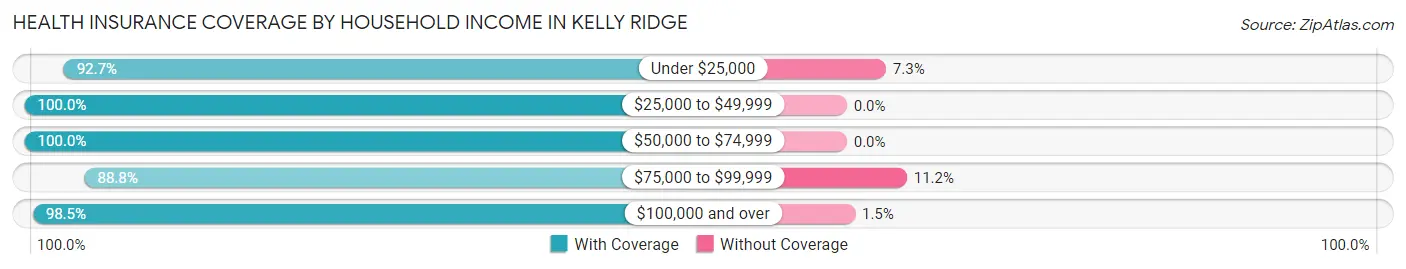
| Household Income | With Coverage | Without Coverage |
| Under $25,000 | 253 (92.7%) | 20 (7.3%) |
| $25,000 to $49,999 | 692 (100.0%) | 0 (0.0%) |
| $50,000 to $74,999 | 444 (100.0%) | 0 (0.0%) |
| $75,000 to $99,999 | 466 (88.8%) | 59 (11.2%) |
| $100,000 and over | 1,215 (98.5%) | 19 (1.5%) |
Public vs Private Health Insurance Coverage by Age in Kelly Ridge
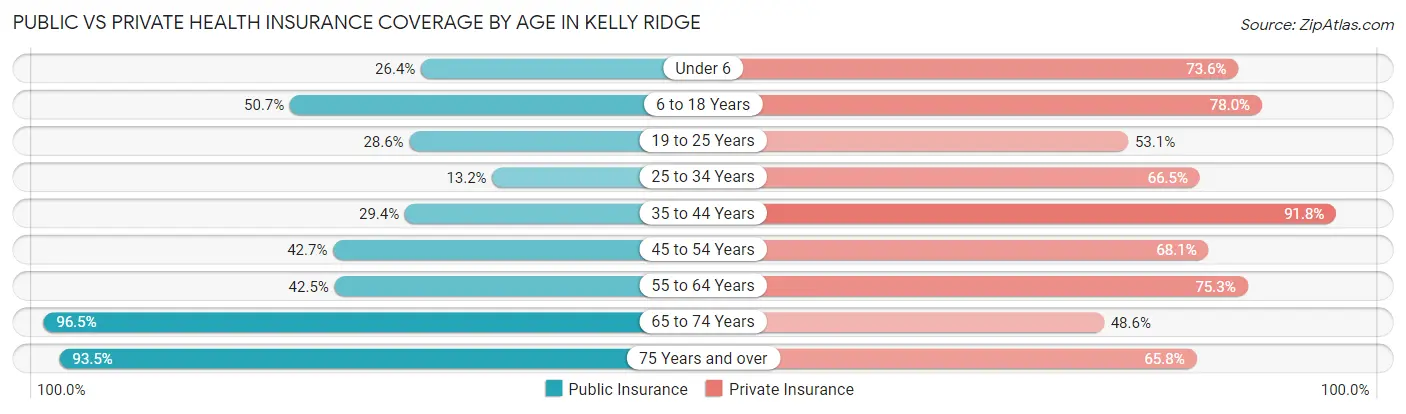
| Age Bracket | Public Insurance | Private Insurance |
| Under 6 | 19 (26.4%) | 53 (73.6%) |
| 6 to 18 Years | 175 (50.7%) | 269 (78.0%) |
| 19 to 25 Years | 64 (28.6%) | 119 (53.1%) |
| 25 to 34 Years | 20 (13.2%) | 101 (66.4%) |
| 35 to 44 Years | 82 (29.4%) | 256 (91.8%) |
| 45 to 54 Years | 123 (42.7%) | 196 (68.1%) |
| 55 to 64 Years | 177 (42.4%) | 314 (75.3%) |
| 65 to 74 Years | 806 (96.5%) | 406 (48.6%) |
| 75 Years and over | 520 (93.5%) | 366 (65.8%) |
| Total | 1,986 (62.7%) | 2,080 (65.7%) |
Disability Status by Sex by Age in Kelly Ridge
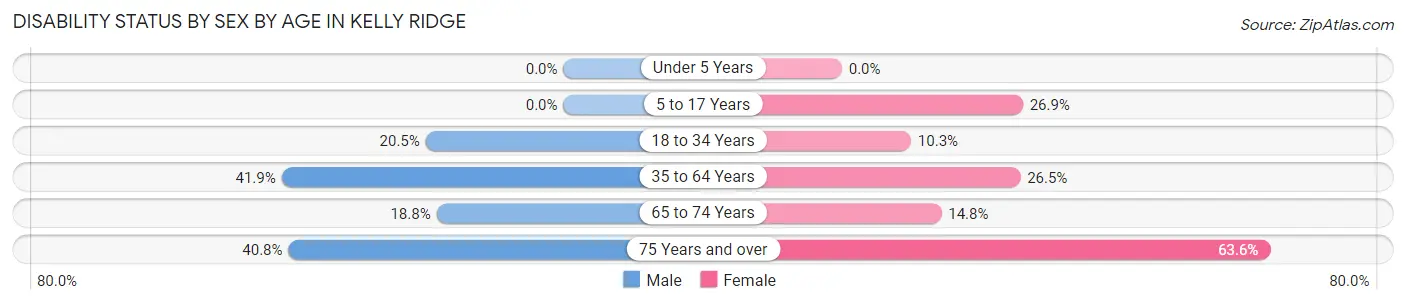
| Age Bracket | Male | Female |
| Under 5 Years | 0 (0.0%) | 0 (0.0%) |
| 5 to 17 Years | 0 (0.0%) | 47 (26.9%) |
| 18 to 34 Years | 55 (20.4%) | 16 (10.3%) |
| 35 to 64 Years | 208 (41.8%) | 129 (26.5%) |
| 65 to 74 Years | 91 (18.8%) | 52 (14.8%) |
| 75 Years and over | 89 (40.8%) | 215 (63.6%) |
Disability Class by Sex by Age in Kelly Ridge
Disability Class: Hearing Difficulty
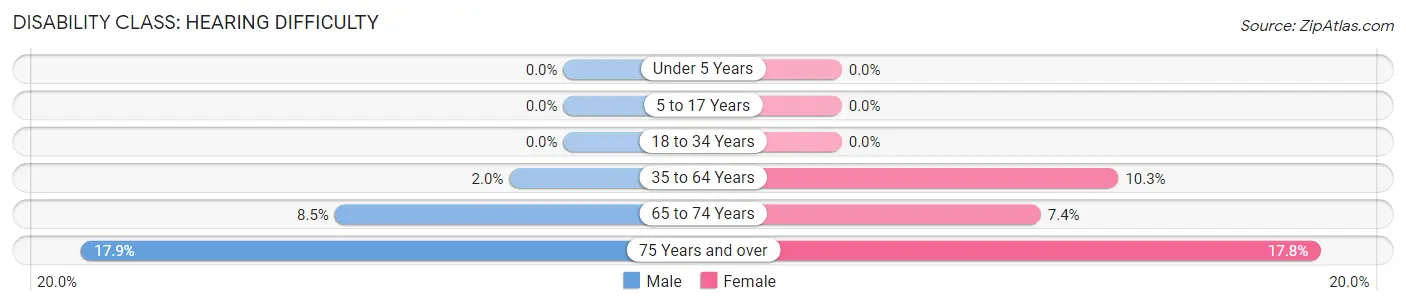
| Age Bracket | Male | Female |
| Under 5 Years | 0 (0.0%) | 0 (0.0%) |
| 5 to 17 Years | 0 (0.0%) | 0 (0.0%) |
| 18 to 34 Years | 0 (0.0%) | 0 (0.0%) |
| 35 to 64 Years | 10 (2.0%) | 50 (10.3%) |
| 65 to 74 Years | 41 (8.5%) | 26 (7.4%) |
| 75 Years and over | 39 (17.9%) | 60 (17.7%) |
Disability Class: Vision Difficulty
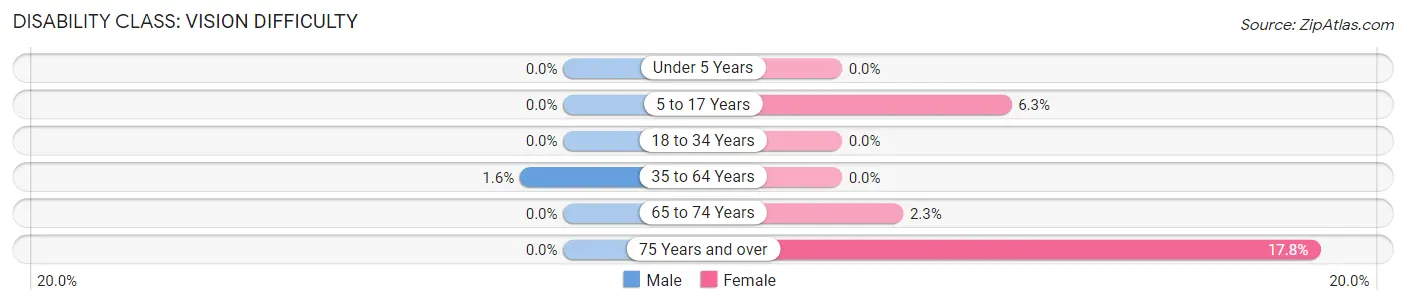
| Age Bracket | Male | Female |
| Under 5 Years | 0 (0.0%) | 0 (0.0%) |
| 5 to 17 Years | 0 (0.0%) | 11 (6.3%) |
| 18 to 34 Years | 0 (0.0%) | 0 (0.0%) |
| 35 to 64 Years | 8 (1.6%) | 0 (0.0%) |
| 65 to 74 Years | 0 (0.0%) | 8 (2.3%) |
| 75 Years and over | 0 (0.0%) | 60 (17.7%) |
Disability Class: Cognitive Difficulty
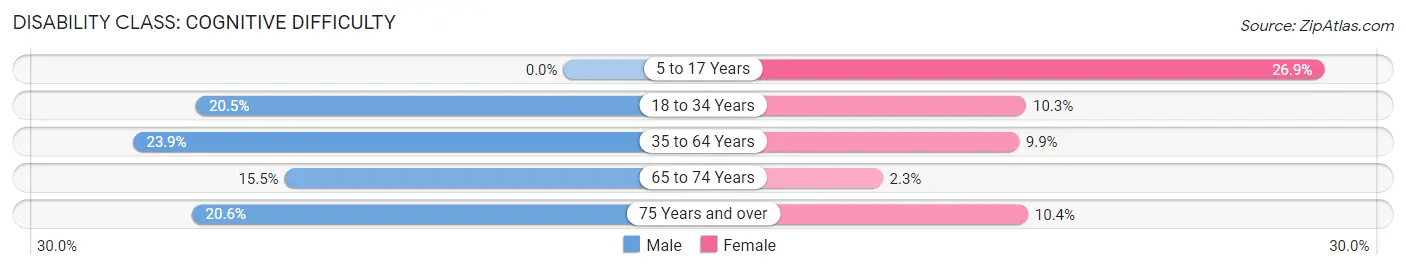
| Age Bracket | Male | Female |
| 5 to 17 Years | 0 (0.0%) | 47 (26.9%) |
| 18 to 34 Years | 55 (20.4%) | 16 (10.3%) |
| 35 to 64 Years | 119 (23.9%) | 48 (9.9%) |
| 65 to 74 Years | 75 (15.5%) | 8 (2.3%) |
| 75 Years and over | 45 (20.6%) | 35 (10.4%) |
Disability Class: Ambulatory Difficulty
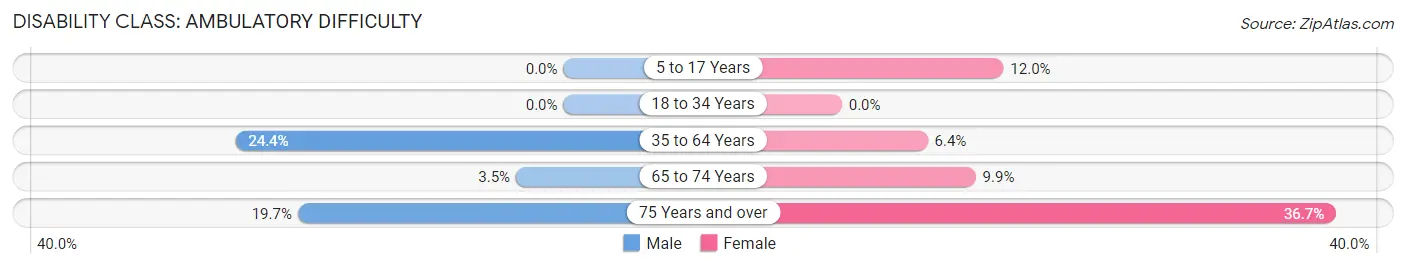
| Age Bracket | Male | Female |
| 5 to 17 Years | 0 (0.0%) | 21 (12.0%) |
| 18 to 34 Years | 0 (0.0%) | 0 (0.0%) |
| 35 to 64 Years | 121 (24.3%) | 31 (6.4%) |
| 65 to 74 Years | 17 (3.5%) | 35 (9.9%) |
| 75 Years and over | 43 (19.7%) | 124 (36.7%) |
Disability Class: Self-Care Difficulty
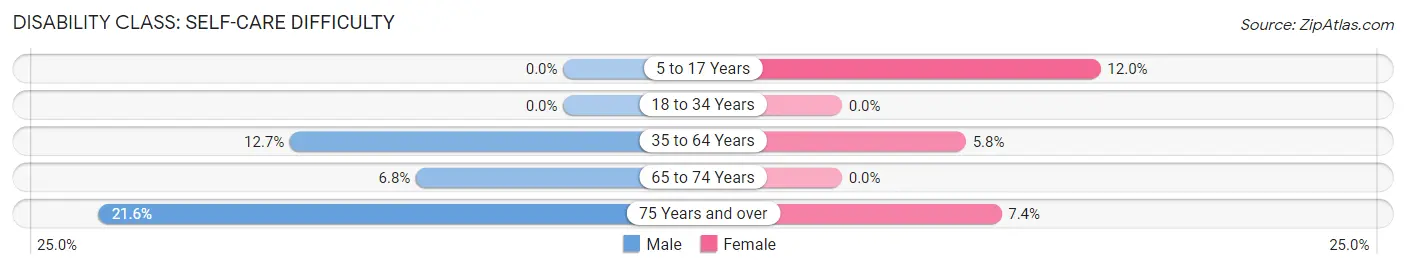
| Age Bracket | Male | Female |
| 5 to 17 Years | 0 (0.0%) | 21 (12.0%) |
| 18 to 34 Years | 0 (0.0%) | 0 (0.0%) |
| 35 to 64 Years | 63 (12.7%) | 28 (5.8%) |
| 65 to 74 Years | 33 (6.8%) | 0 (0.0%) |
| 75 Years and over | 47 (21.6%) | 25 (7.4%) |
Technology Access in Kelly Ridge
Computing Device Access in Kelly Ridge
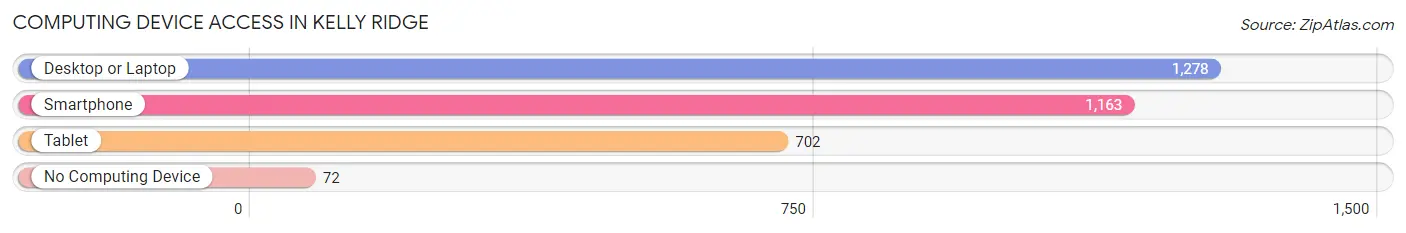
| Device Type | # Households | % Households |
| Desktop or Laptop | 1,278 | 88.8% |
| Smartphone | 1,163 | 80.8% |
| Tablet | 702 | 48.8% |
| No Computing Device | 72 | 5.0% |
| Total | 1,439 | 100.0% |
Internet Access in Kelly Ridge
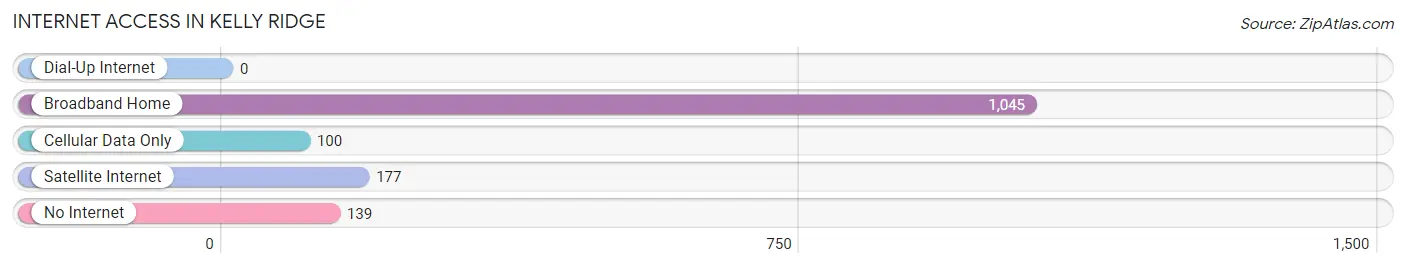
| Internet Type | # Households | % Households |
| Dial-Up Internet | 0 | 0.0% |
| Broadband Home | 1,045 | 72.6% |
| Cellular Data Only | 100 | 7.0% |
| Satellite Internet | 177 | 12.3% |
| No Internet | 139 | 9.7% |
| Total | 1,439 | 100.0% |
Kelly Ridge Summary
Ridgecrest, California, is a city located in Kern County, California, United States. It is located in the Indian Wells Valley, near the base of the Sierra Nevada mountain range. The city is the largest in the Indian Wells Valley, with a population of approximately 28,000 people.
History
Ridgecrest was founded in 1910 by the Southern Pacific Railroad. The city was named after the nearby ridge, which was named after the nearby mountain range. The city was originally a small farming community, but it quickly grew into a larger city due to the nearby military base, China Lake Naval Air Weapons Station. The base was established in 1943 and has since become the largest employer in the city.
Geography
Ridgecrest is located in the Indian Wells Valley, which is a desert valley located in the northern part of the Mojave Desert. The city is located at the base of the Sierra Nevada mountain range, and is surrounded by several mountain ranges, including the Coso Range, the Argus Range, and the Inyo Mountains. The city is located at an elevation of 2,835 feet (864 m).
Economy
Ridgecrest’s economy is largely driven by the nearby military base, China Lake Naval Air Weapons Station. The base is the largest employer in the city, and provides jobs for over 10,000 people. Other major employers in the city include the Ridgecrest Regional Hospital, the Kern County Fire Department, and the Ridgecrest Unified School District.
The city also has a thriving tourism industry, with many visitors coming to the area to explore the nearby mountains and desert. The city is also home to several museums, including the Maturango Museum, the Indian Wells Valley Historical Society, and the Kern County Museum.
Demographics
As of the 2010 census, the population of Ridgecrest was 27,616. The racial makeup of the city was 73.3% White, 5.2% African American, 1.2% Native American, 1.3% Asian, 0.3% Pacific Islander, 15.2% from other races, and 3.7% from two or more races. Hispanic or Latino of any race were 28.3% of the population.
The median income for a household in the city was $45,813, and the median income for a family was $51,856. The per capita income for the city was $20,845. About 14.2% of families and 17.7% of the population were below the poverty line, including 25.2% of those under age 18 and 8.2% of those age 65 or over.
Ridgecrest is a diverse city with a rich history and a vibrant economy. The city is home to a large military base, which provides jobs for many of its residents. The city also has a thriving tourism industry, with many visitors coming to explore the nearby mountains and desert. The city is also home to several museums, which provide a glimpse into the city’s past. The city has a diverse population, with a mix of different races and ethnicities.
Common Questions
What is Per Capita Income in Kelly Ridge?
Per Capita income in Kelly Ridge is $39,998.
What is the Median Family Income in Kelly Ridge?
Median Family Income in Kelly Ridge is $81,786.
What is the Median Household income in Kelly Ridge?
Median Household Income in Kelly Ridge is $59,665.
What is Inequality or Gini Index in Kelly Ridge?
Inequality or Gini Index in Kelly Ridge is 0.46.
What is the Total Population of Kelly Ridge?
Total Population of Kelly Ridge is 3,168.
What is the Total Male Population of Kelly Ridge?
Total Male Population of Kelly Ridge is 1,614.
What is the Total Female Population of Kelly Ridge?
Total Female Population of Kelly Ridge is 1,554.
What is the Ratio of Males per 100 Females in Kelly Ridge?
There are 103.86 Males per 100 Females in Kelly Ridge.
What is the Ratio of Females per 100 Males in Kelly Ridge?
There are 96.28 Females per 100 Males in Kelly Ridge.
What is the Median Population Age in Kelly Ridge?
Median Population Age in Kelly Ridge is 60.9 Years.
What is the Average Family Size in Kelly Ridge
Average Family Size in Kelly Ridge is 3.0 People.
What is the Average Household Size in Kelly Ridge
Average Household Size in Kelly Ridge is 2.2 People.
How Large is the Labor Force in Kelly Ridge?
There are 1,173 People in the Labor Forcein in Kelly Ridge.
What is the Percentage of People in the Labor Force in Kelly Ridge?
41.0% of People are in the Labor Force in Kelly Ridge.
What is the Unemployment Rate in Kelly Ridge?
Unemployment Rate in Kelly Ridge is 5.7%.