Mission Canyon, CA Map & Demographics
Mission Canyon Map
Mission Canyon Overview
$103,913
PER CAPITA INCOME
$197,031
AVG FAMILY INCOME
$196,667
AVG HOUSEHOLD INCOME
36.2%
WAGE / INCOME GAP [ % ]
63.8¢/ $1
WAGE / INCOME GAP [ $ ]
0.48
INEQUALITY / GINI INDEX
2,500
TOTAL POPULATION
1,077
MALE POPULATION
1,423
FEMALE POPULATION
75.69
MALES / 100 FEMALES
132.13
FEMALES / 100 MALES
48.0
MEDIAN AGE
3.1
AVG FAMILY SIZE
2.7
AVG HOUSEHOLD SIZE
1,364
LABOR FORCE [ PEOPLE ]
63.7%
PERCENT IN LABOR FORCE
1.5%
UNEMPLOYMENT RATE
Income in Mission Canyon
Income Overview in Mission Canyon
Per Capita Income in Mission Canyon is $103,913, while median incomes of families and households are $197,031 and $196,667 respectively.
| Characteristic | Number | Measure |
| Per Capita Income | 2,500 | $103,913 |
| Median Family Income | 611 | $197,031 |
| Mean Family Income | 611 | $269,635 |
| Median Household Income | 936 | $196,667 |
| Mean Household Income | 936 | $271,510 |
| Income Deficit | 611 | $0 |
| Wage / Income Gap (%) | 2,500 | 36.23% |
| Wage / Income Gap ($) | 2,500 | 63.77¢ per $1 |
| Gini / Inequality Index | 2,500 | 0.48 |
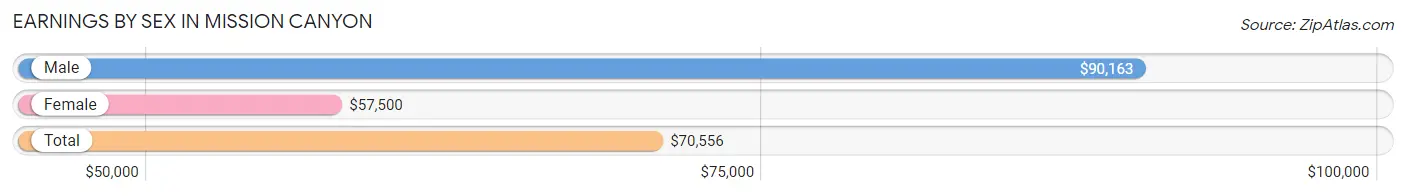
Earnings by Sex in Mission Canyon
Average Earnings in Mission Canyon are $70,556, $90,163 for men and $57,500 for women, a difference of 36.2%.
| Sex | Number | Average Earnings |
| Male | 708 (47.8%) | $90,163 |
| Female | 772 (52.2%) | $57,500 |
| Total | 1,480 (100.0%) | $70,556 |
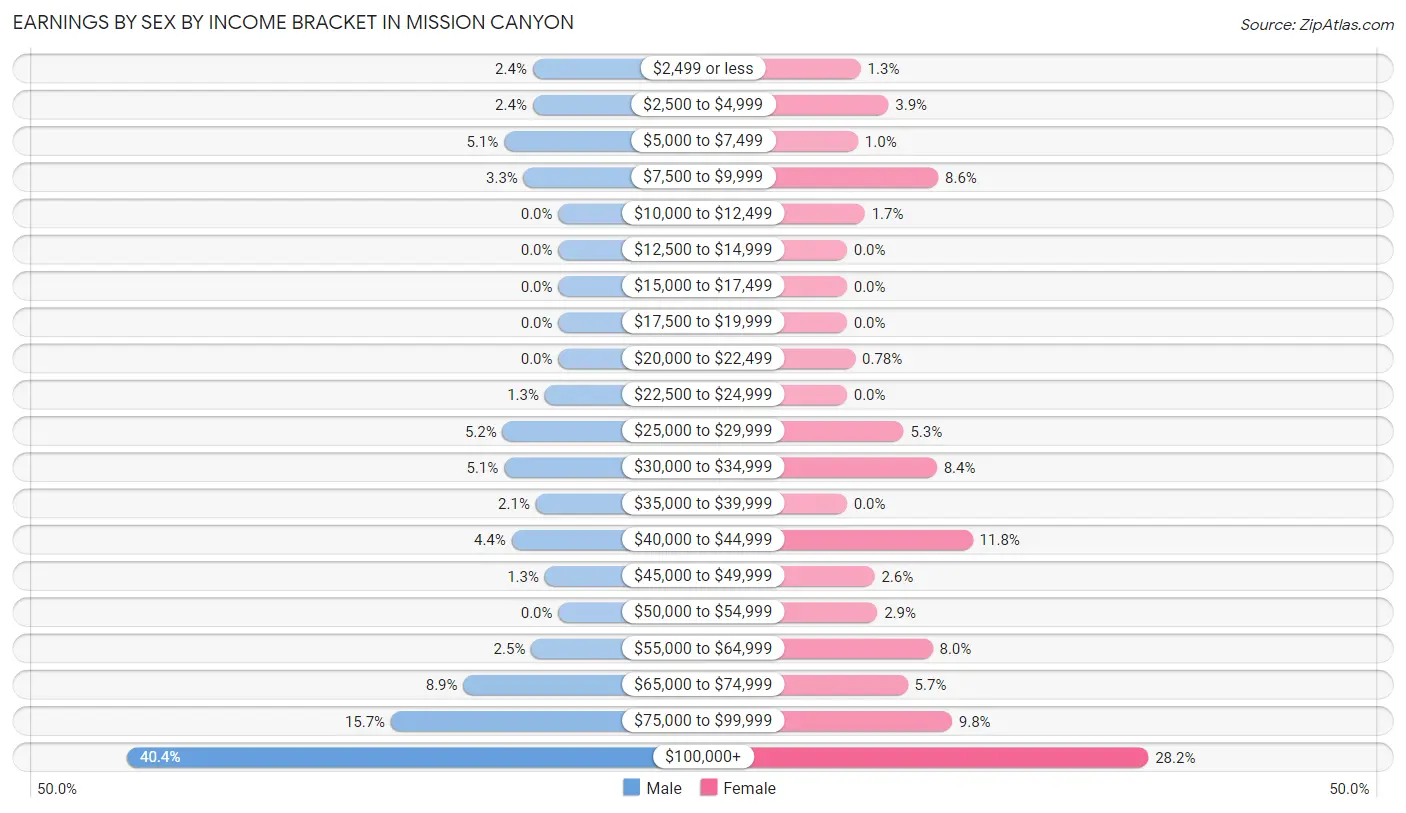
Earnings by Sex by Income Bracket in Mission Canyon
The most common earnings brackets in Mission Canyon are $100,000+ for men (286 | 40.4%) and $100,000+ for women (218 | 28.2%).
| Income | Male | Female |
| $2,499 or less | 17 (2.4%) | 10 (1.3%) |
| $2,500 to $4,999 | 17 (2.4%) | 30 (3.9%) |
| $5,000 to $7,499 | 36 (5.1%) | 8 (1.0%) |
| $7,500 to $9,999 | 23 (3.3%) | 66 (8.6%) |
| $10,000 to $12,499 | 0 (0.0%) | 13 (1.7%) |
| $12,500 to $14,999 | 0 (0.0%) | 0 (0.0%) |
| $15,000 to $17,499 | 0 (0.0%) | 0 (0.0%) |
| $17,500 to $19,999 | 0 (0.0%) | 0 (0.0%) |
| $20,000 to $22,499 | 0 (0.0%) | 6 (0.8%) |
| $22,500 to $24,999 | 9 (1.3%) | 0 (0.0%) |
| $25,000 to $29,999 | 37 (5.2%) | 41 (5.3%) |
| $30,000 to $34,999 | 36 (5.1%) | 65 (8.4%) |
| $35,000 to $39,999 | 15 (2.1%) | 0 (0.0%) |
| $40,000 to $44,999 | 31 (4.4%) | 91 (11.8%) |
| $45,000 to $49,999 | 9 (1.3%) | 20 (2.6%) |
| $50,000 to $54,999 | 0 (0.0%) | 22 (2.9%) |
| $55,000 to $64,999 | 18 (2.5%) | 62 (8.0%) |
| $65,000 to $74,999 | 63 (8.9%) | 44 (5.7%) |
| $75,000 to $99,999 | 111 (15.7%) | 76 (9.8%) |
| $100,000+ | 286 (40.4%) | 218 (28.2%) |
| Total | 708 (100.0%) | 772 (100.0%) |
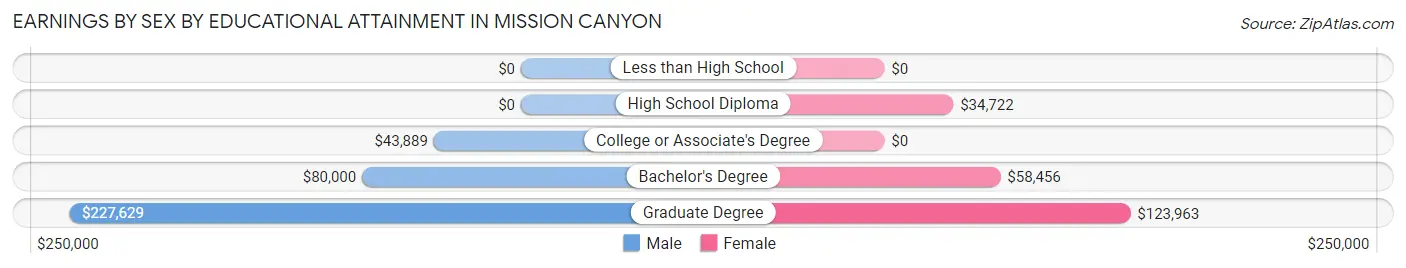
Earnings by Sex by Educational Attainment in Mission Canyon
Average earnings in Mission Canyon are $90,897 for men and $59,200 for women, a difference of 34.9%. Men with an educational attainment of graduate degree enjoy the highest average annual earnings of $227,629, while those with college or associate's degree education earn the least with $43,889. Women with an educational attainment of graduate degree earn the most with the average annual earnings of $123,963, while those with high school diploma education have the smallest earnings of $34,722.
| Educational Attainment | Male Income | Female Income |
| Less than High School | - | - |
| High School Diploma | - | - |
| College or Associate's Degree | $43,889 | $0 |
| Bachelor's Degree | $80,000 | $58,456 |
| Graduate Degree | $227,629 | $123,963 |
| Total | $90,897 | $59,200 |
Family Income in Mission Canyon
Family Income Brackets in Mission Canyon
According to the Mission Canyon family income data, there are 301 families falling into the $200,000+ income range, which is the most common income bracket and makes up 49.3% of all families.
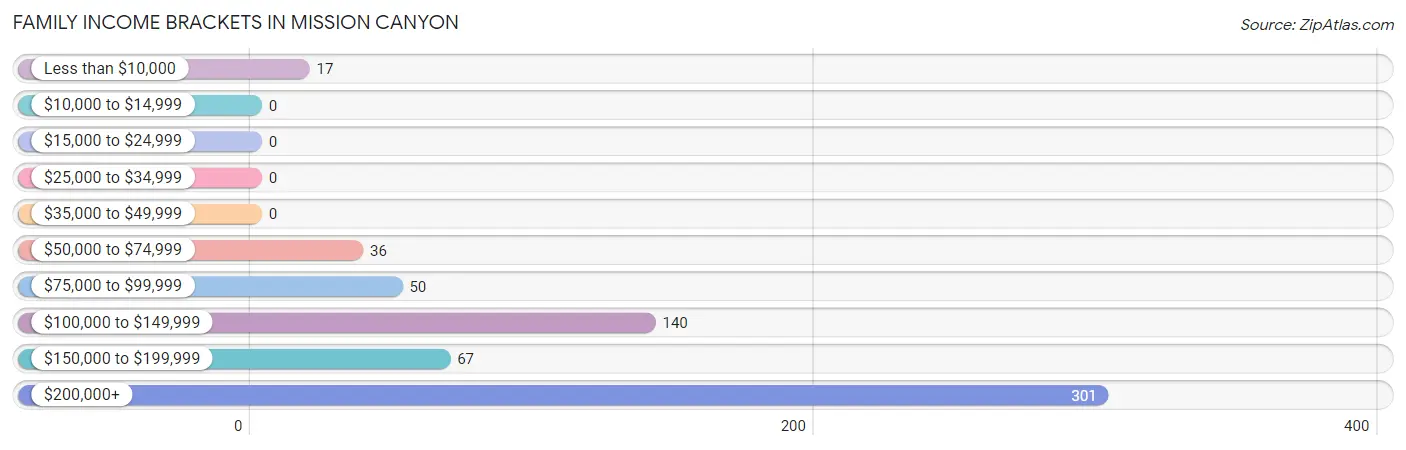
| Income Bracket | # Families | % Families |
| Less than $10,000 | 17 | 2.8% |
| $10,000 to $14,999 | 0 | 0.0% |
| $15,000 to $24,999 | 0 | 0.0% |
| $25,000 to $34,999 | 0 | 0.0% |
| $35,000 to $49,999 | 0 | 0.0% |
| $50,000 to $74,999 | 36 | 5.9% |
| $75,000 to $99,999 | 50 | 8.2% |
| $100,000 to $149,999 | 140 | 22.9% |
| $150,000 to $199,999 | 67 | 11.0% |
| $200,000+ | 301 | 49.3% |
Family Income by Famaliy Size in Mission Canyon
3-person families (143 | 23.4%) account for the highest median family income in Mission Canyon with $250,001 per family, while 3-person families (143 | 23.4%) have the highest median income of $83,334 per family member.
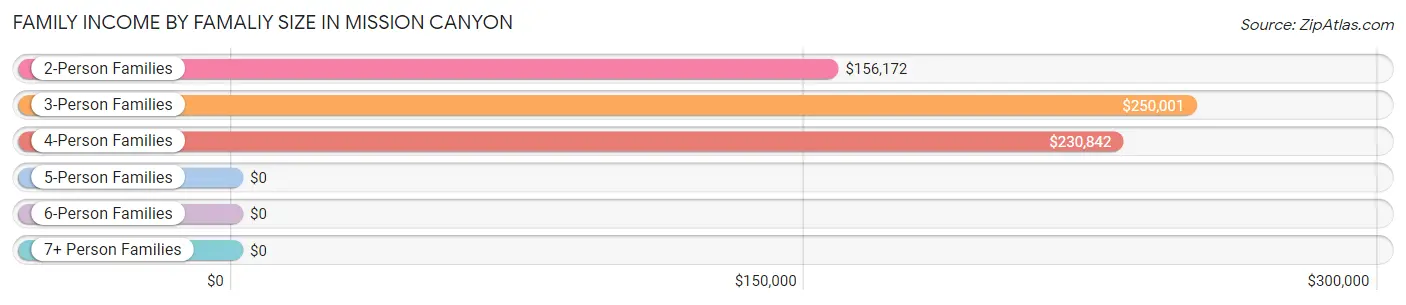
| Income Bracket | # Families | Median Income |
| 2-Person Families | 299 (48.9%) | $156,172 |
| 3-Person Families | 143 (23.4%) | $250,001 |
| 4-Person Families | 127 (20.8%) | $230,842 |
| 5-Person Families | 15 (2.5%) | $0 |
| 6-Person Families | 27 (4.4%) | $0 |
| 7+ Person Families | 0 (0.0%) | $0 |
| Total | 611 (100.0%) | $197,031 |
Family Income by Number of Earners in Mission Canyon
The median family income in Mission Canyon is $197,031, with families comprising 2 earners (318) having the highest median family income of $231,522, while families with 1 earner (103) have the lowest median family income of $104,844, accounting for 52.0% and 16.9% of families, respectively.
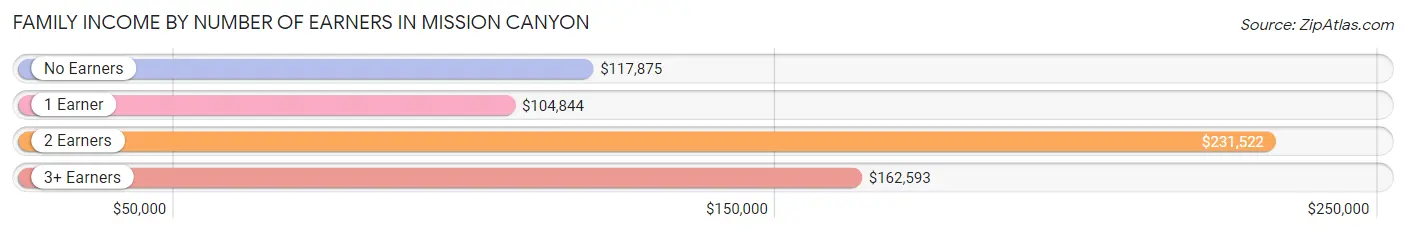
| Number of Earners | # Families | Median Income |
| No Earners | 104 (17.0%) | $117,875 |
| 1 Earner | 103 (16.9%) | $104,844 |
| 2 Earners | 318 (52.0%) | $231,522 |
| 3+ Earners | 86 (14.1%) | $162,593 |
| Total | 611 (100.0%) | $197,031 |
Household Income in Mission Canyon
Household Income Brackets in Mission Canyon
With 460 households falling in the category, the $200,000+ income range is the most frequent in Mission Canyon, accounting for 49.1% of all households.
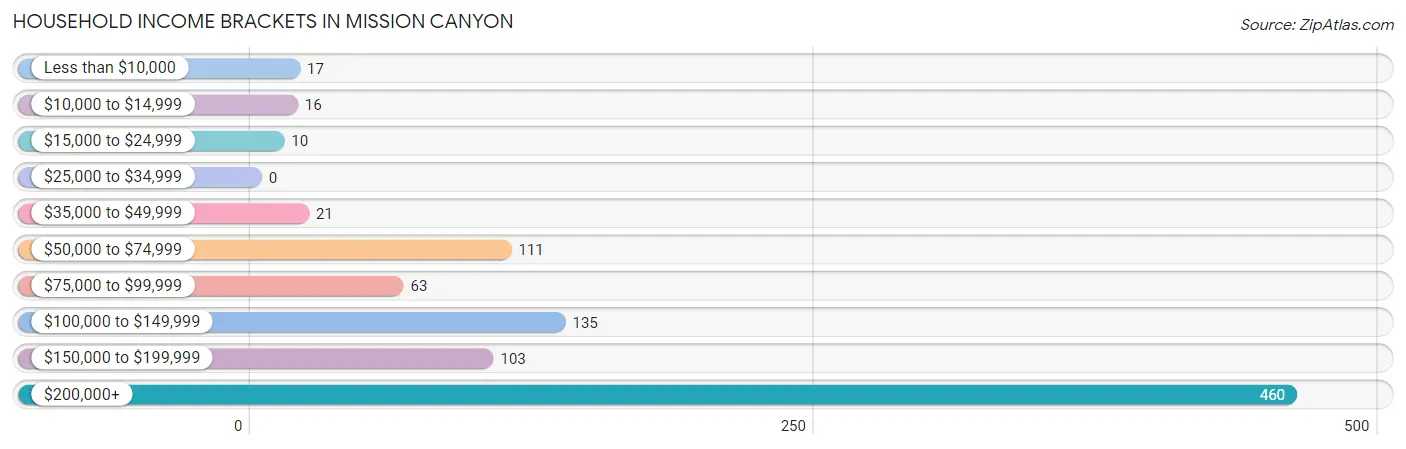
| Income Bracket | # Households | % Households |
| Less than $10,000 | 17 | 1.8% |
| $10,000 to $14,999 | 16 | 1.7% |
| $15,000 to $24,999 | 10 | 1.1% |
| $25,000 to $34,999 | 0 | 0.0% |
| $35,000 to $49,999 | 21 | 2.2% |
| $50,000 to $74,999 | 111 | 11.9% |
| $75,000 to $99,999 | 63 | 6.7% |
| $100,000 to $149,999 | 135 | 14.4% |
| $150,000 to $199,999 | 103 | 11.0% |
| $200,000+ | 460 | 49.1% |
Household Income by Householder Age in Mission Canyon
The median household income in Mission Canyon is $196,667, with the highest median household income of $250,001 found in the 25 to 44 years age bracket for the primary householder. A total of 242 households (25.9%) fall into this category.
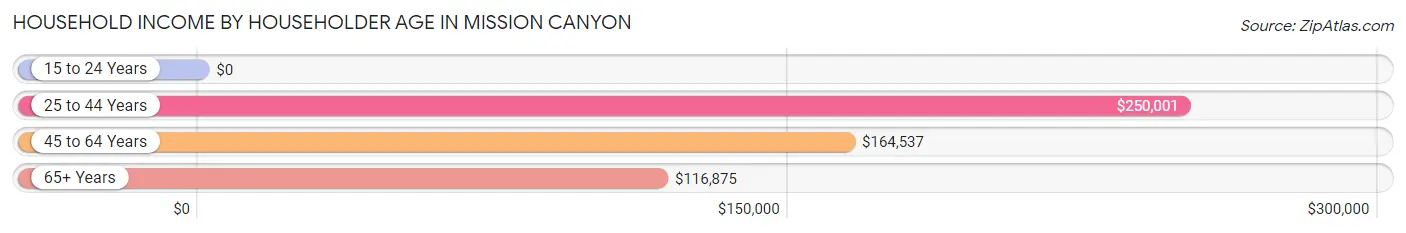
| Income Bracket | # Households | Median Income |
| 15 to 24 Years | 0 (0.0%) | $0 |
| 25 to 44 Years | 242 (25.9%) | $250,001 |
| 45 to 64 Years | 330 (35.3%) | $164,537 |
| 65+ Years | 364 (38.9%) | $116,875 |
| Total | 936 (100.0%) | $196,667 |
Poverty in Mission Canyon
Income Below Poverty by Sex and Age in Mission Canyon
With 4.2% poverty level for males and 6.0% for females among the residents of Mission Canyon, 5 year old males and 18 to 24 year old females are the most vulnerable to poverty, with 16 males (100.0%) and 26 females (15.6%) in their respective age groups living below the poverty level.
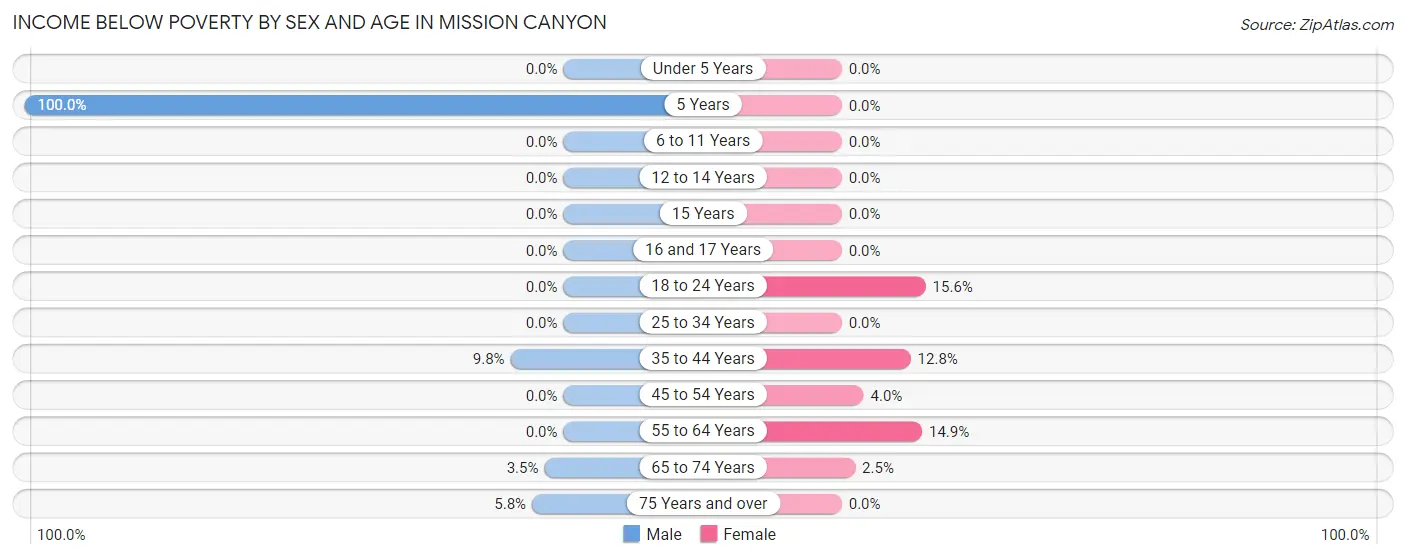
| Age Bracket | Male | Female |
| Under 5 Years | 0 (0.0%) | 0 (0.0%) |
| 5 Years | 16 (100.0%) | 0 (0.0%) |
| 6 to 11 Years | 0 (0.0%) | 0 (0.0%) |
| 12 to 14 Years | 0 (0.0%) | 0 (0.0%) |
| 15 Years | 0 (0.0%) | 0 (0.0%) |
| 16 and 17 Years | 0 (0.0%) | 0 (0.0%) |
| 18 to 24 Years | 0 (0.0%) | 26 (15.6%) |
| 25 to 34 Years | 0 (0.0%) | 0 (0.0%) |
| 35 to 44 Years | 16 (9.8%) | 17 (12.8%) |
| 45 to 54 Years | 0 (0.0%) | 8 (4.0%) |
| 55 to 64 Years | 0 (0.0%) | 28 (14.9%) |
| 65 to 74 Years | 6 (3.5%) | 6 (2.5%) |
| 75 Years and over | 7 (5.8%) | 0 (0.0%) |
| Total | 45 (4.2%) | 85 (6.0%) |
Income Above Poverty by Sex and Age in Mission Canyon
According to the poverty statistics in Mission Canyon, males aged under 5 years and females aged under 5 years are the age groups that are most secure financially, with 100.0% of males and 100.0% of females in these age groups living above the poverty line.
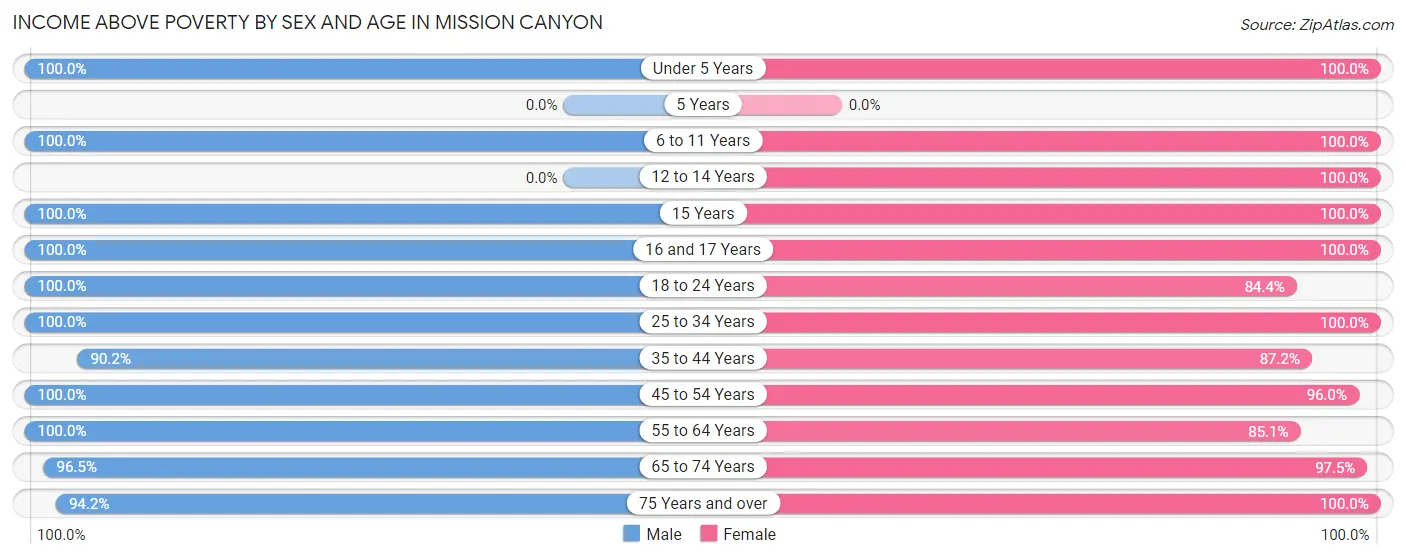
| Age Bracket | Male | Female |
| Under 5 Years | 87 (100.0%) | 107 (100.0%) |
| 5 Years | 0 (0.0%) | 0 (0.0%) |
| 6 to 11 Years | 43 (100.0%) | 61 (100.0%) |
| 12 to 14 Years | 0 (0.0%) | 7 (100.0%) |
| 15 Years | 10 (100.0%) | 27 (100.0%) |
| 16 and 17 Years | 22 (100.0%) | 48 (100.0%) |
| 18 to 24 Years | 17 (100.0%) | 141 (84.4%) |
| 25 to 34 Years | 108 (100.0%) | 174 (100.0%) |
| 35 to 44 Years | 147 (90.2%) | 116 (87.2%) |
| 45 to 54 Years | 135 (100.0%) | 190 (96.0%) |
| 55 to 64 Years | 186 (100.0%) | 160 (85.1%) |
| 65 to 74 Years | 164 (96.5%) | 236 (97.5%) |
| 75 Years and over | 113 (94.2%) | 71 (100.0%) |
| Total | 1,032 (95.8%) | 1,338 (94.0%) |
Income Below Poverty Among Married-Couple Families in Mission Canyon
The poverty statistics for married-couple families in Mission Canyon show that 3.1% or 17 of the total 546 families live below the poverty line. Families with 1 or 2 children have the highest poverty rate of 8.6%, comprising of 17 families. On the other hand, families with no children have the lowest poverty rate of 0.0%, which includes 0 families.
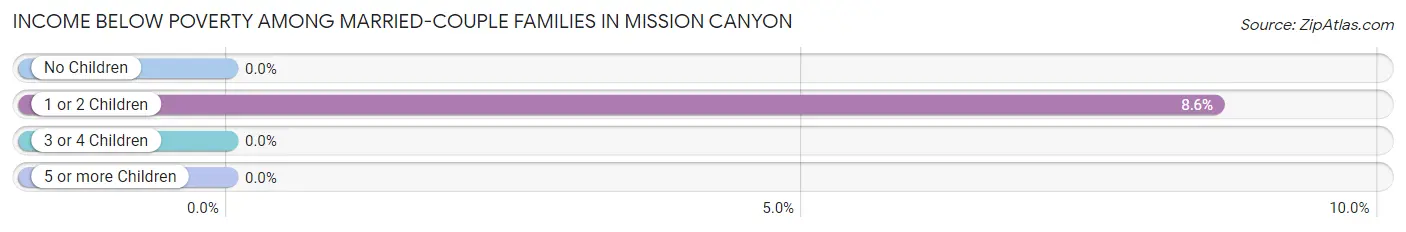
| Children | Above Poverty | Below Poverty |
| No Children | 348 (100.0%) | 0 (0.0%) |
| 1 or 2 Children | 181 (91.4%) | 17 (8.6%) |
| 3 or 4 Children | 0 (0.0%) | 0 (0.0%) |
| 5 or more Children | 0 (0.0%) | 0 (0.0%) |
| Total | 529 (96.9%) | 17 (3.1%) |
Income Below Poverty Among Single-Parent Households in Mission Canyon
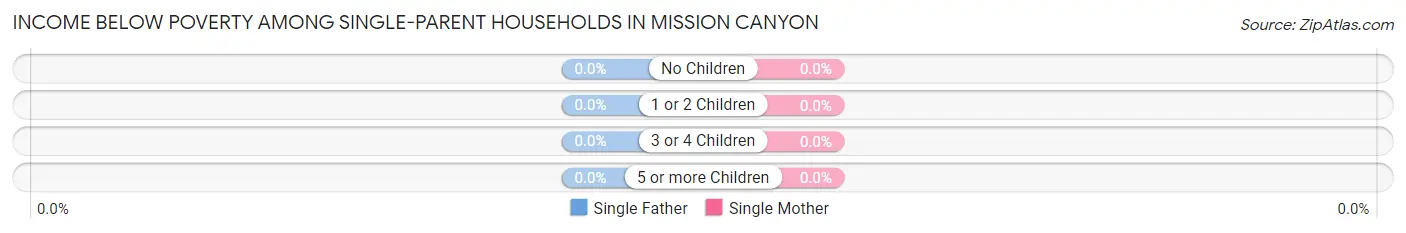
| Children | Single Father | Single Mother |
| No Children | 0 (0.0%) | 0 (0.0%) |
| 1 or 2 Children | 0 (0.0%) | 0 (0.0%) |
| 3 or 4 Children | 0 (0.0%) | 0 (0.0%) |
| 5 or more Children | 0 (0.0%) | 0 (0.0%) |
| Total | 0 (0.0%) | 0 (0.0%) |
Income Below Poverty Among Married-Couple vs Single-Parent Households in Mission Canyon
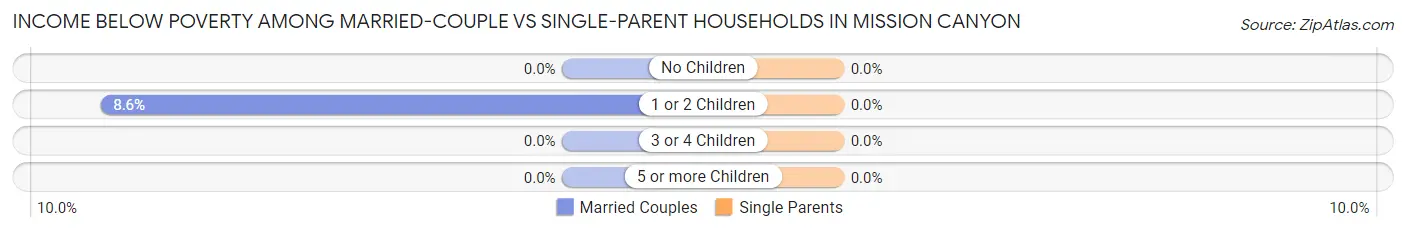
| Children | Married-Couple Families | Single-Parent Households |
| No Children | 0 (0.0%) | 0 (0.0%) |
| 1 or 2 Children | 17 (8.6%) | 0 (0.0%) |
| 3 or 4 Children | 0 (0.0%) | 0 (0.0%) |
| 5 or more Children | 0 (0.0%) | 0 (0.0%) |
| Total | 17 (3.1%) | 0 (0.0%) |
Race in Mission Canyon
The most populous races in Mission Canyon are White / Caucasian (2,130 | 85.2%), Two or more Races (199 | 8.0%), and Hispanic or Latino (188 | 7.5%).
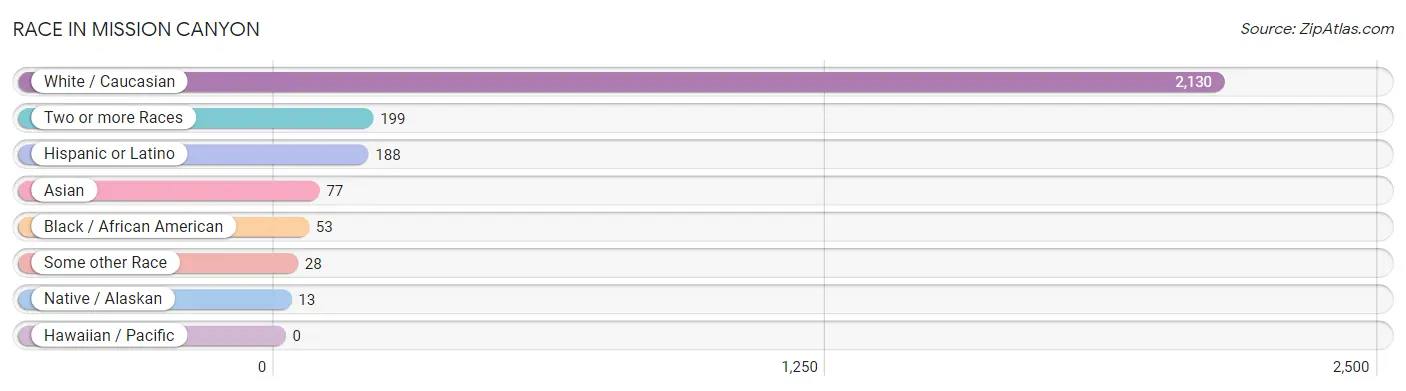
| Race | # Population | % Population |
| Asian | 77 | 3.1% |
| Black / African American | 53 | 2.1% |
| Hawaiian / Pacific | 0 | 0.0% |
| Hispanic or Latino | 188 | 7.5% |
| Native / Alaskan | 13 | 0.5% |
| White / Caucasian | 2,130 | 85.2% |
| Two or more Races | 199 | 8.0% |
| Some other Race | 28 | 1.1% |
| Total | 2,500 | 100.0% |
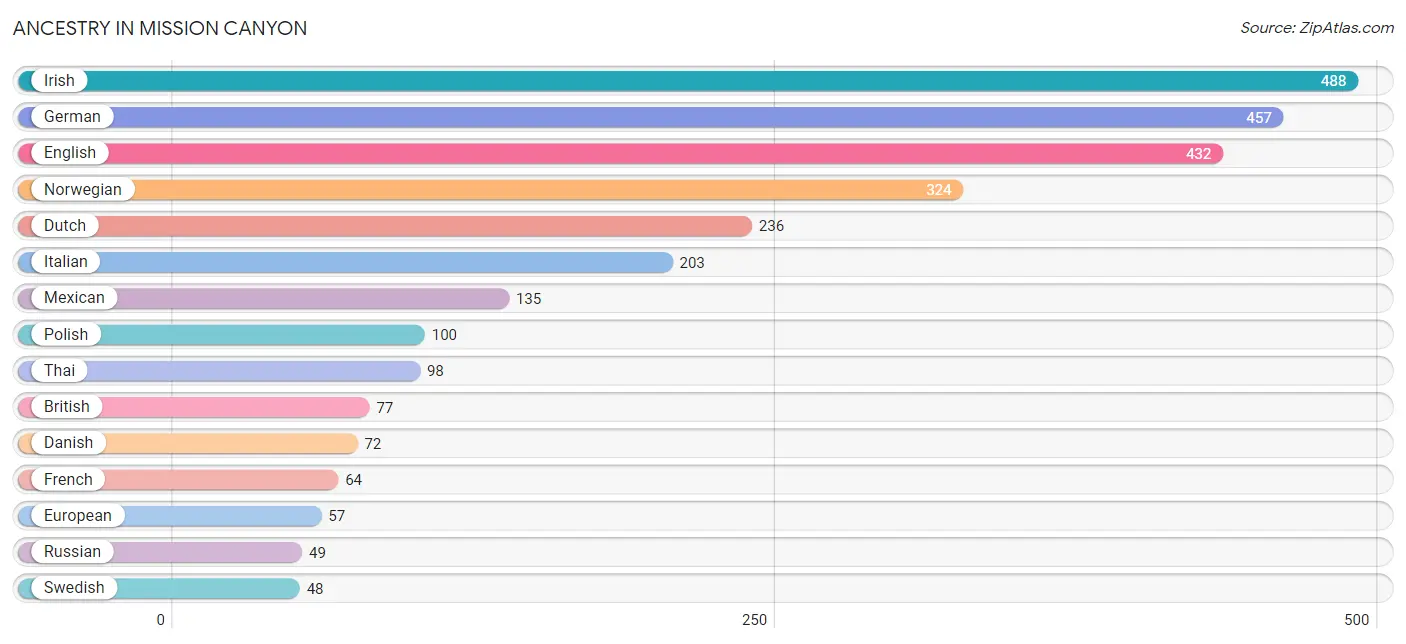
Ancestry in Mission Canyon
The most populous ancestries reported in Mission Canyon are Irish (488 | 19.5%), German (457 | 18.3%), English (432 | 17.3%), Norwegian (324 | 13.0%), and Dutch (236 | 9.4%), together accounting for 77.5% of all Mission Canyon residents.
| Ancestry | # Population | % Population |
| American | 42 | 1.7% |
| Argentinean | 12 | 0.5% |
| Armenian | 6 | 0.2% |
| Austrian | 10 | 0.4% |
| British | 77 | 3.1% |
| Central American | 9 | 0.4% |
| Colombian | 13 | 0.5% |
| Danish | 72 | 2.9% |
| Dutch | 236 | 9.4% |
| English | 432 | 17.3% |
| European | 57 | 2.3% |
| French | 64 | 2.6% |
| French Canadian | 19 | 0.8% |
| German | 457 | 18.3% |
| Greek | 7 | 0.3% |
| Honduran | 9 | 0.4% |
| Hungarian | 44 | 1.8% |
| Irish | 488 | 19.5% |
| Italian | 203 | 8.1% |
| Mexican | 135 | 5.4% |
| Norwegian | 324 | 13.0% |
| Polish | 100 | 4.0% |
| Portuguese | 28 | 1.1% |
| Puerto Rican | 19 | 0.8% |
| Romanian | 14 | 0.6% |
| Russian | 49 | 2.0% |
| Scotch-Irish | 43 | 1.7% |
| Scottish | 39 | 1.6% |
| South American | 25 | 1.0% |
| Swedish | 48 | 1.9% |
| Thai | 98 | 3.9% |
| Turkish | 9 | 0.4% |
| Ukrainian | 34 | 1.4% |
| Welsh | 7 | 0.3% | View All 34 Rows |
Immigrants in Mission Canyon
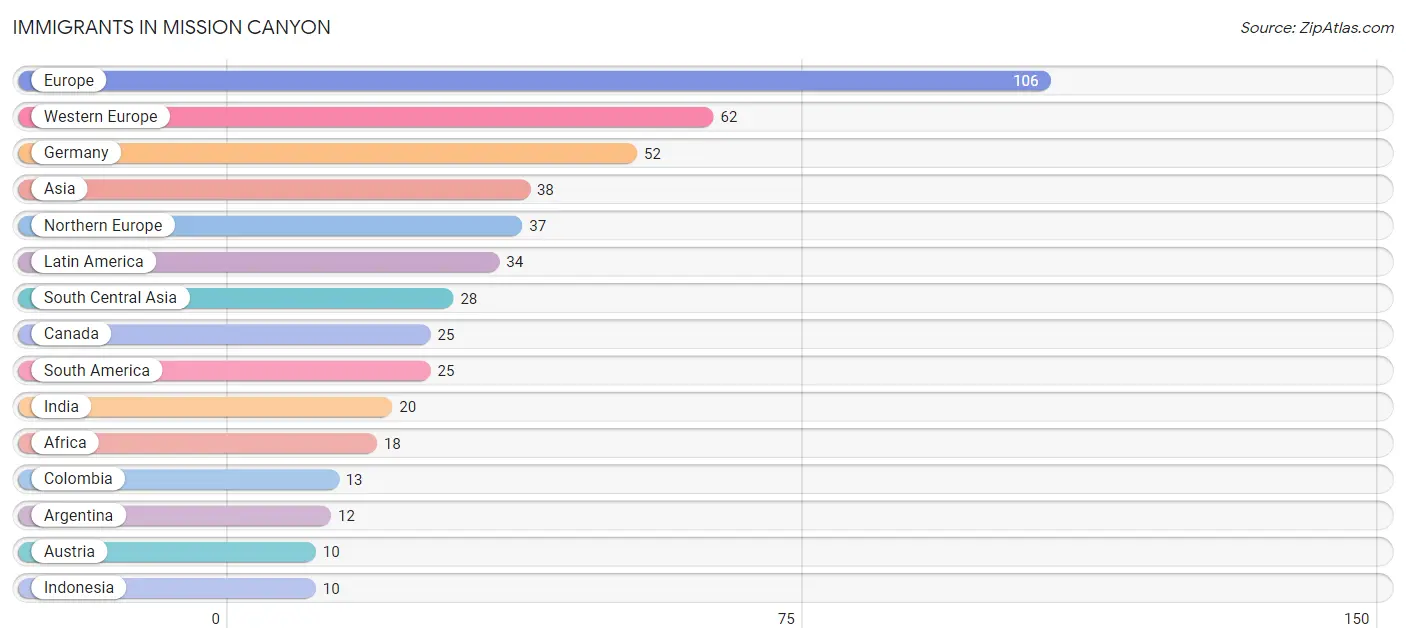
The most numerous immigrant groups reported in Mission Canyon came from Europe (106 | 4.2%), Western Europe (62 | 2.5%), Germany (52 | 2.1%), Asia (38 | 1.5%), and Northern Europe (37 | 1.5%), together accounting for 11.8% of all Mission Canyon residents.
| Immigration Origin | # Population | % Population |
| Africa | 18 | 0.7% |
| Argentina | 12 | 0.5% |
| Asia | 38 | 1.5% |
| Austria | 10 | 0.4% |
| Canada | 25 | 1.0% |
| Central America | 9 | 0.4% |
| Colombia | 13 | 0.5% |
| Eastern Africa | 9 | 0.4% |
| Europe | 106 | 4.2% |
| Germany | 52 | 2.1% |
| Honduras | 9 | 0.4% |
| India | 20 | 0.8% |
| Indonesia | 10 | 0.4% |
| Italy | 7 | 0.3% |
| Latin America | 34 | 1.4% |
| Nepal | 8 | 0.3% |
| Northern Europe | 37 | 1.5% |
| South Africa | 9 | 0.4% |
| South America | 25 | 1.0% |
| South Central Asia | 28 | 1.1% |
| South Eastern Asia | 10 | 0.4% |
| Southern Europe | 7 | 0.3% |
| Western Europe | 62 | 2.5% |
| Zimbabwe | 9 | 0.4% | View All 24 Rows |
Sex and Age in Mission Canyon
Sex and Age in Mission Canyon
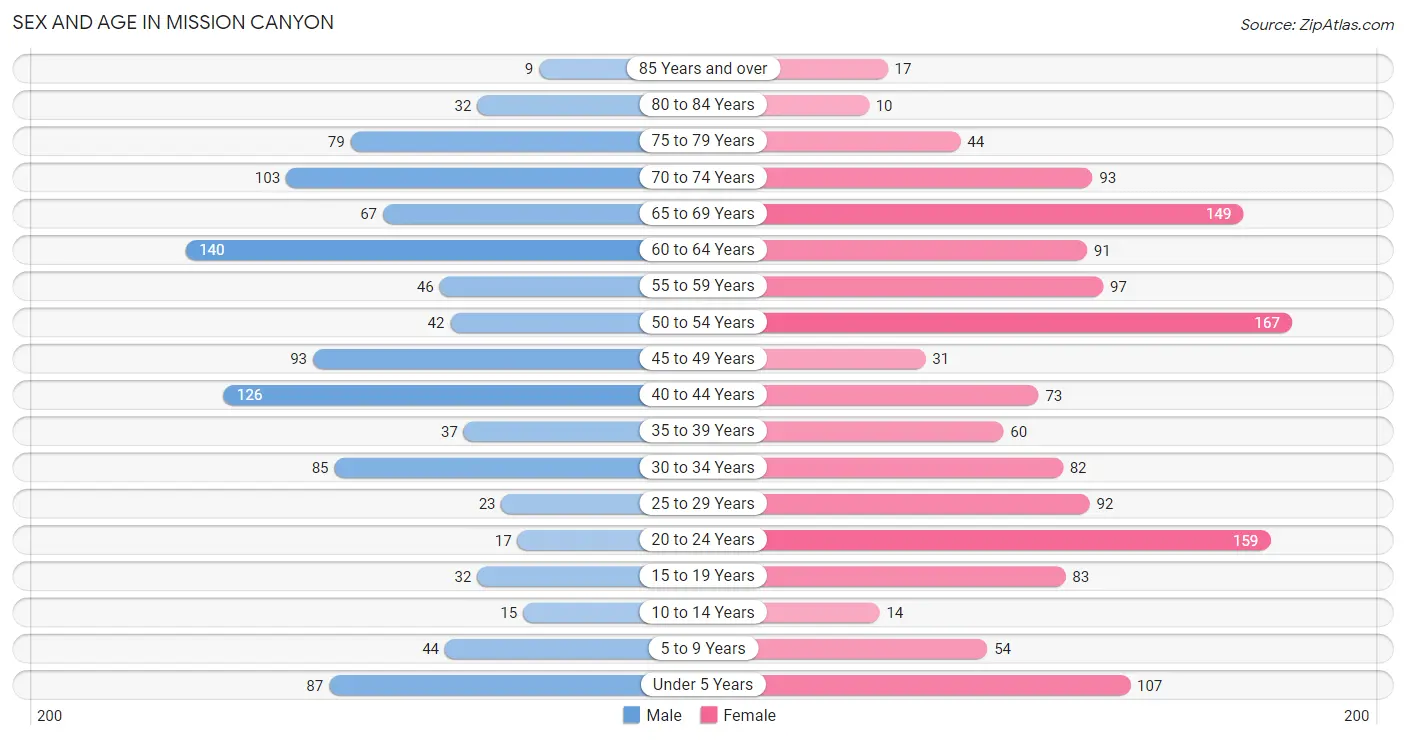
The most populous age groups in Mission Canyon are 60 to 64 Years (140 | 13.0%) for men and 50 to 54 Years (167 | 11.7%) for women.
| Age Bracket | Male | Female |
| Under 5 Years | 87 (8.1%) | 107 (7.5%) |
| 5 to 9 Years | 44 (4.1%) | 54 (3.8%) |
| 10 to 14 Years | 15 (1.4%) | 14 (1.0%) |
| 15 to 19 Years | 32 (3.0%) | 83 (5.8%) |
| 20 to 24 Years | 17 (1.6%) | 159 (11.2%) |
| 25 to 29 Years | 23 (2.1%) | 92 (6.5%) |
| 30 to 34 Years | 85 (7.9%) | 82 (5.8%) |
| 35 to 39 Years | 37 (3.4%) | 60 (4.2%) |
| 40 to 44 Years | 126 (11.7%) | 73 (5.1%) |
| 45 to 49 Years | 93 (8.6%) | 31 (2.2%) |
| 50 to 54 Years | 42 (3.9%) | 167 (11.7%) |
| 55 to 59 Years | 46 (4.3%) | 97 (6.8%) |
| 60 to 64 Years | 140 (13.0%) | 91 (6.4%) |
| 65 to 69 Years | 67 (6.2%) | 149 (10.5%) |
| 70 to 74 Years | 103 (9.6%) | 93 (6.5%) |
| 75 to 79 Years | 79 (7.3%) | 44 (3.1%) |
| 80 to 84 Years | 32 (3.0%) | 10 (0.7%) |
| 85 Years and over | 9 (0.8%) | 17 (1.2%) |
| Total | 1,077 (100.0%) | 1,423 (100.0%) |
Families and Households in Mission Canyon
Median Family Size in Mission Canyon
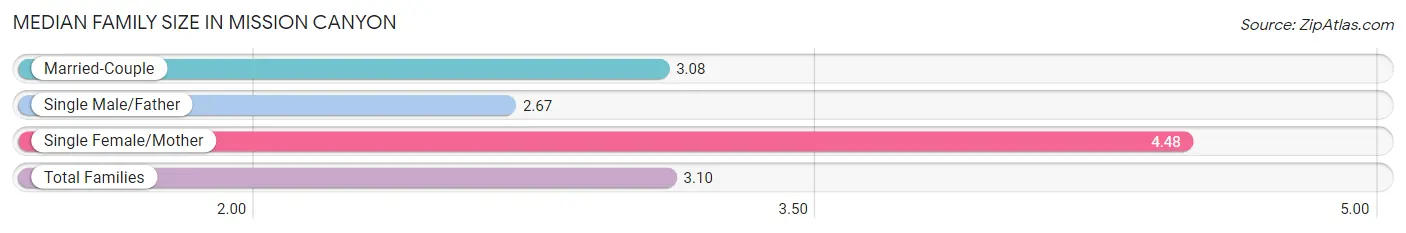
The median family size in Mission Canyon is 3.10 persons per family, with single female/mother families (23 | 3.8%) accounting for the largest median family size of 4.48 persons per family. On the other hand, single male/father families (42 | 6.9%) represent the smallest median family size with 2.67 persons per family.
| Family Type | # Families | Family Size |
| Married-Couple | 546 (89.4%) | 3.08 |
| Single Male/Father | 42 (6.9%) | 2.67 |
| Single Female/Mother | 23 (3.8%) | 4.48 |
| Total Families | 611 (100.0%) | 3.10 |
Median Household Size in Mission Canyon
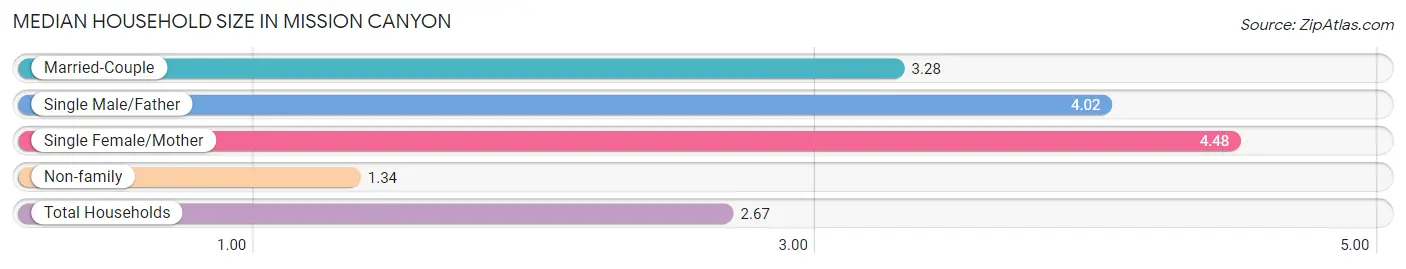
The median household size in Mission Canyon is 2.67 persons per household, with single female/mother households (23 | 2.5%) accounting for the largest median household size of 4.48 persons per household. non-family households (325 | 34.7%) represent the smallest median household size with 1.34 persons per household.
| Household Type | # Households | Household Size |
| Married-Couple | 546 (58.3%) | 3.28 |
| Single Male/Father | 42 (4.5%) | 4.02 |
| Single Female/Mother | 23 (2.5%) | 4.48 |
| Non-family | 325 (34.7%) | 1.34 |
| Total Households | 936 (100.0%) | 2.67 |
Household Size by Marriage Status in Mission Canyon
Out of a total of 936 households in Mission Canyon, 611 (65.3%) are family households, while 325 (34.7%) are nonfamily households. The most numerous type of family households are 2-person households, comprising 259, and the most common type of nonfamily households are 1-person households, comprising 247.
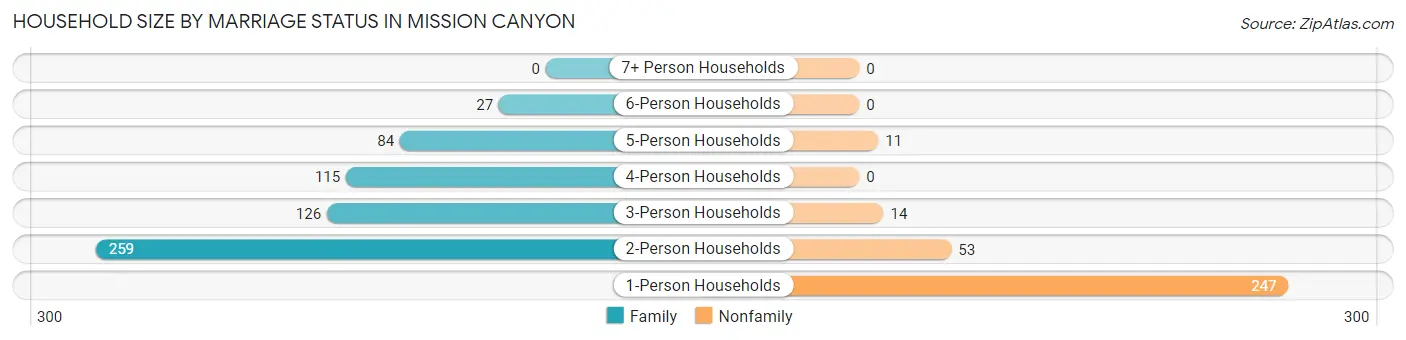
| Household Size | Family Households | Nonfamily Households |
| 1-Person Households | - | 247 (26.4%) |
| 2-Person Households | 259 (27.7%) | 53 (5.7%) |
| 3-Person Households | 126 (13.5%) | 14 (1.5%) |
| 4-Person Households | 115 (12.3%) | 0 (0.0%) |
| 5-Person Households | 84 (9.0%) | 11 (1.2%) |
| 6-Person Households | 27 (2.9%) | 0 (0.0%) |
| 7+ Person Households | 0 (0.0%) | 0 (0.0%) |
| Total | 611 (65.3%) | 325 (34.7%) |
Female Fertility in Mission Canyon
Fertility by Age in Mission Canyon
Average fertility rate in Mission Canyon is 96.0 births per 1,000 women. Women in the age bracket of 35 to 50 years have the highest fertility rate with 209.0 births per 1,000 women. Women in the age bracket of 35 to 50 years acount for 69.5% of all women with births.
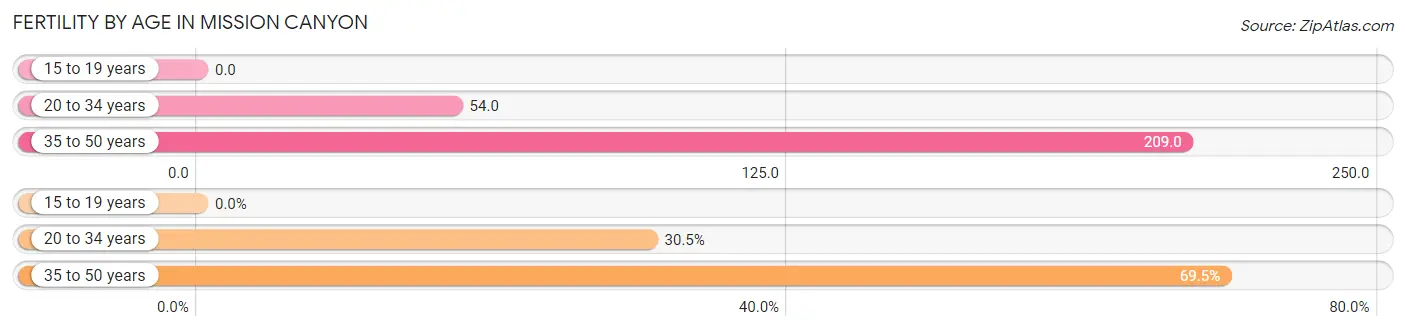
| Age Bracket | Women with Births | Births / 1,000 Women |
| 15 to 19 years | 0 (0.0%) | 0.0 |
| 20 to 34 years | 18 (30.5%) | 54.0 |
| 35 to 50 years | 41 (69.5%) | 209.0 |
| Total | 59 (100.0%) | 96.0 |
Fertility by Age by Marriage Status in Mission Canyon
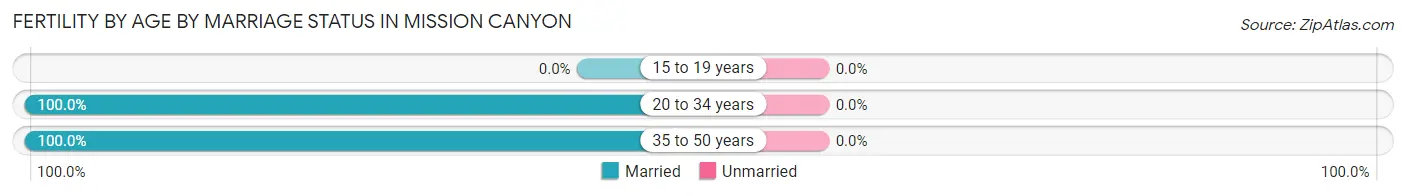
| Age Bracket | Married | Unmarried |
| 15 to 19 years | 0 (0.0%) | 0 (0.0%) |
| 20 to 34 years | 18 (100.0%) | 0 (0.0%) |
| 35 to 50 years | 41 (100.0%) | 0 (0.0%) |
| Total | 59 (100.0%) | 0 (0.0%) |
Fertility by Education in Mission Canyon
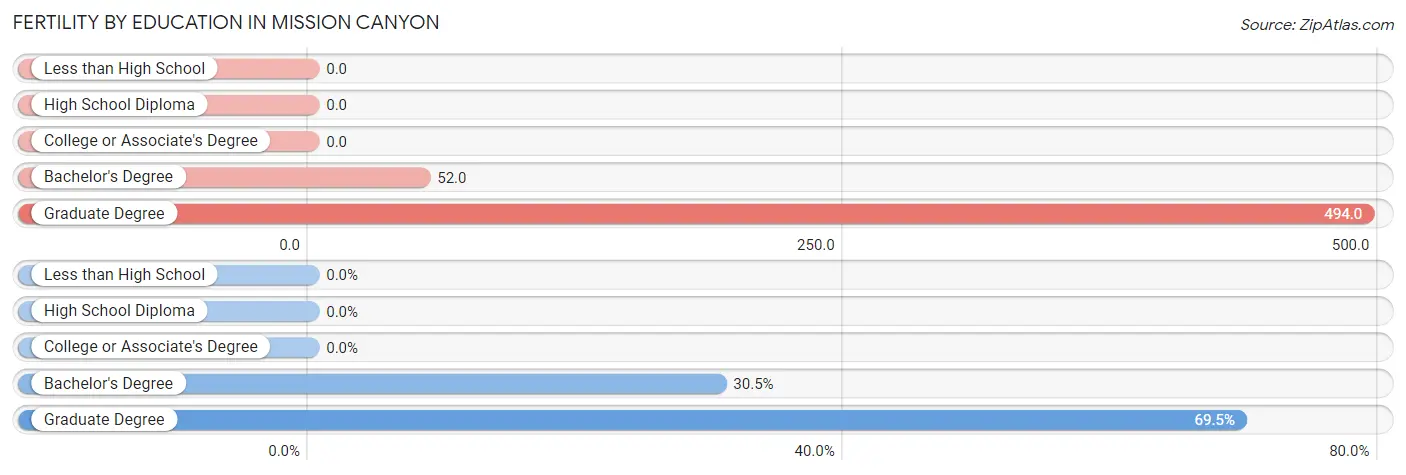
| Educational Attainment | Women with Births | Births / 1,000 Women |
| Less than High School | 0 (0.0%) | 0.0 |
| High School Diploma | 0 (0.0%) | 0.0 |
| College or Associate's Degree | 0 (0.0%) | 0.0 |
| Bachelor's Degree | 18 (30.5%) | 52.0 |
| Graduate Degree | 41 (69.5%) | 494.0 |
| Total | 59 (100.0%) | 96.0 |
Fertility by Education by Marriage Status in Mission Canyon
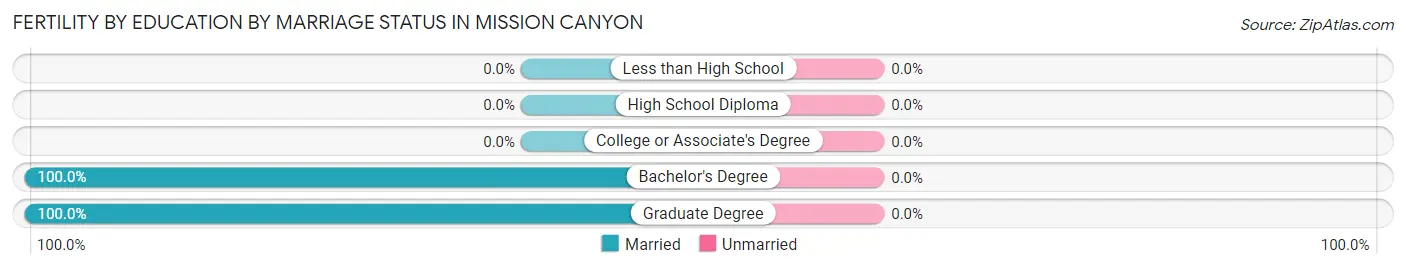
| Educational Attainment | Married | Unmarried |
| Less than High School | 0 (0.0%) | 0 (0.0%) |
| High School Diploma | 0 (0.0%) | 0 (0.0%) |
| College or Associate's Degree | 0 (0.0%) | 0 (0.0%) |
| Bachelor's Degree | 18 (100.0%) | 0 (0.0%) |
| Graduate Degree | 41 (100.0%) | 0 (0.0%) |
| Total | 59 (100.0%) | 0 (0.0%) |
Employment Characteristics in Mission Canyon
Employment by Class of Employer in Mission Canyon
Among the 1,335 employed individuals in Mission Canyon, private company employees (761 | 57.0%), self-employed (not incorporated) (154 | 11.5%), and not-for-profit organizations (150 | 11.2%) make up the most common classes of employment.
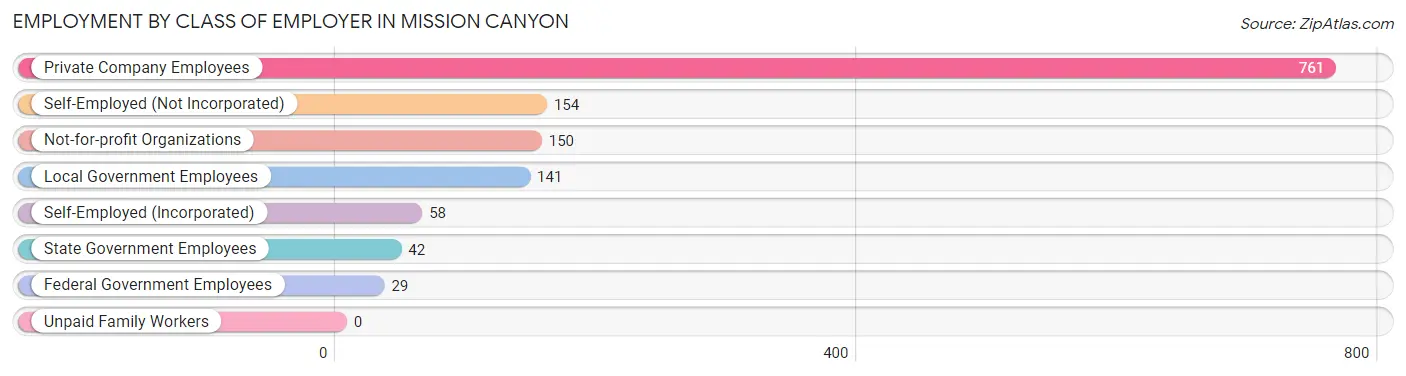
| Employer Class | # Employees | % Employees |
| Private Company Employees | 761 | 57.0% |
| Self-Employed (Incorporated) | 58 | 4.3% |
| Self-Employed (Not Incorporated) | 154 | 11.5% |
| Not-for-profit Organizations | 150 | 11.2% |
| Local Government Employees | 141 | 10.6% |
| State Government Employees | 42 | 3.2% |
| Federal Government Employees | 29 | 2.2% |
| Unpaid Family Workers | 0 | 0.0% |
| Total | 1,335 | 100.0% |
Employment Status by Age in Mission Canyon
According to the labor force statistics for Mission Canyon, out of the total population over 16 years of age (2,142), 63.7% or 1,364 individuals are in the labor force, with 1.5% or 20 of them unemployed. The age group with the highest labor force participation rate is 30 to 34 years, with 100.0% or 167 individuals in the labor force. Within the labor force, the 20 to 24 years age range has the highest percentage of unemployed individuals, with 15.7% or 14 of them being unemployed.
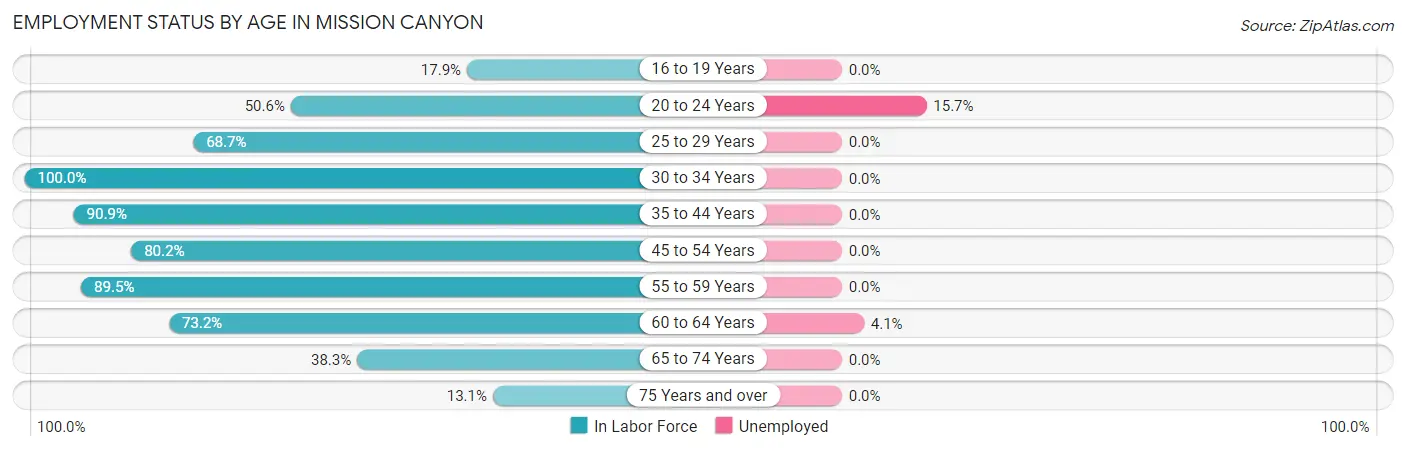
| Age Bracket | In Labor Force | Unemployed |
| 16 to 19 Years | 14 (17.9%) | 0 (0.0%) |
| 20 to 24 Years | 89 (50.6%) | 14 (15.7%) |
| 25 to 29 Years | 79 (68.7%) | 0 (0.0%) |
| 30 to 34 Years | 167 (100.0%) | 0 (0.0%) |
| 35 to 44 Years | 269 (90.9%) | 0 (0.0%) |
| 45 to 54 Years | 267 (80.2%) | 0 (0.0%) |
| 55 to 59 Years | 128 (89.5%) | 0 (0.0%) |
| 60 to 64 Years | 169 (73.2%) | 7 (4.1%) |
| 65 to 74 Years | 158 (38.3%) | 0 (0.0%) |
| 75 Years and over | 25 (13.1%) | 0 (0.0%) |
| Total | 1,364 (63.7%) | 20 (1.5%) |
Employment Status by Educational Attainment in Mission Canyon
According to labor force statistics for Mission Canyon, 84.0% of individuals (1,079) out of the total population between 25 and 64 years of age (1,285) are in the labor force, with 0.6% or 6 of them being unemployed. The group with the highest labor force participation rate are those with the educational attainment of less than high school, with 100.0% or 65 individuals in the labor force. Within the labor force, individuals with college / associate degree education have the highest percentage of unemployment, with 5.4% or 7 of them being unemployed.
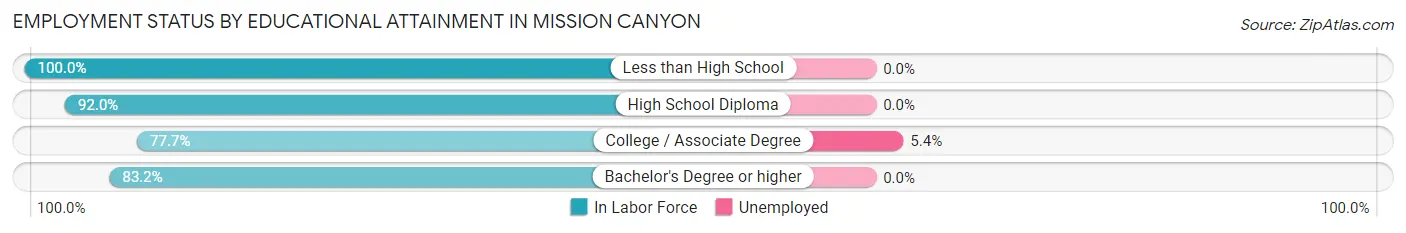
| Educational Attainment | In Labor Force | Unemployed |
| Less than High School | 65 (100.0%) | 0 (0.0%) |
| High School Diploma | 80 (92.0%) | 0 (0.0%) |
| College / Associate Degree | 129 (77.7%) | 9 (5.4%) |
| Bachelor's Degree or higher | 805 (83.2%) | 0 (0.0%) |
| Total | 1,079 (84.0%) | 8 (0.6%) |
Employment Occupations by Sex in Mission Canyon
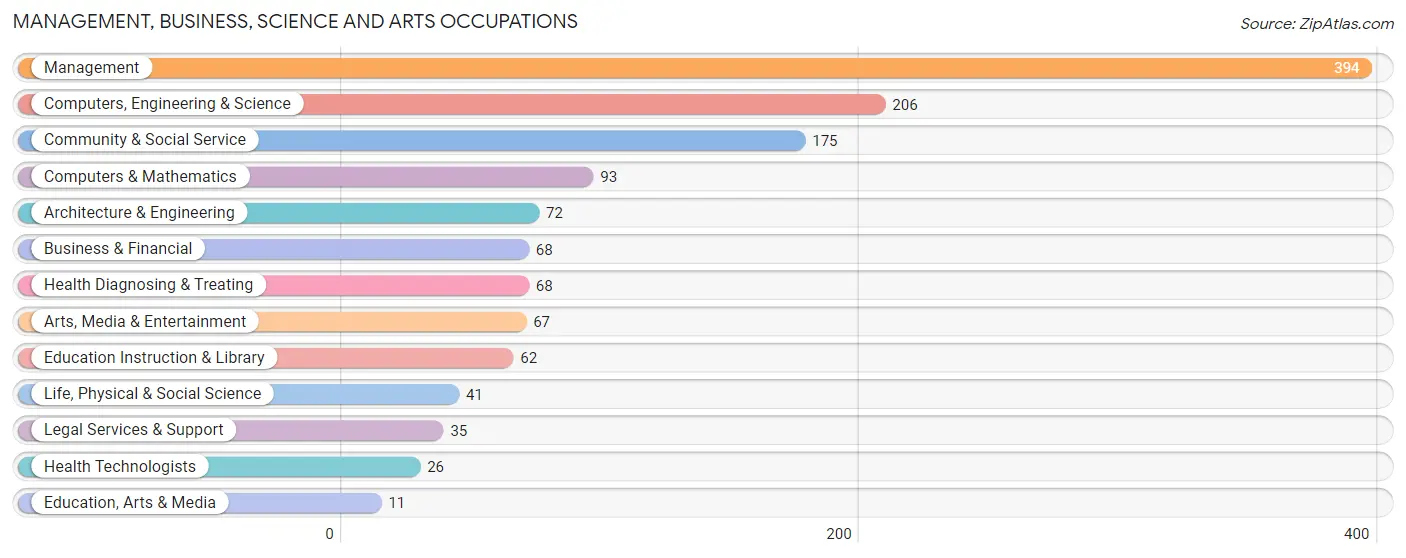
Management, Business, Science and Arts Occupations
The most common Management, Business, Science and Arts occupations in Mission Canyon are Management (394 | 29.3%), Computers, Engineering & Science (206 | 15.3%), Community & Social Service (175 | 13.0%), Computers & Mathematics (93 | 6.9%), and Architecture & Engineering (72 | 5.4%).
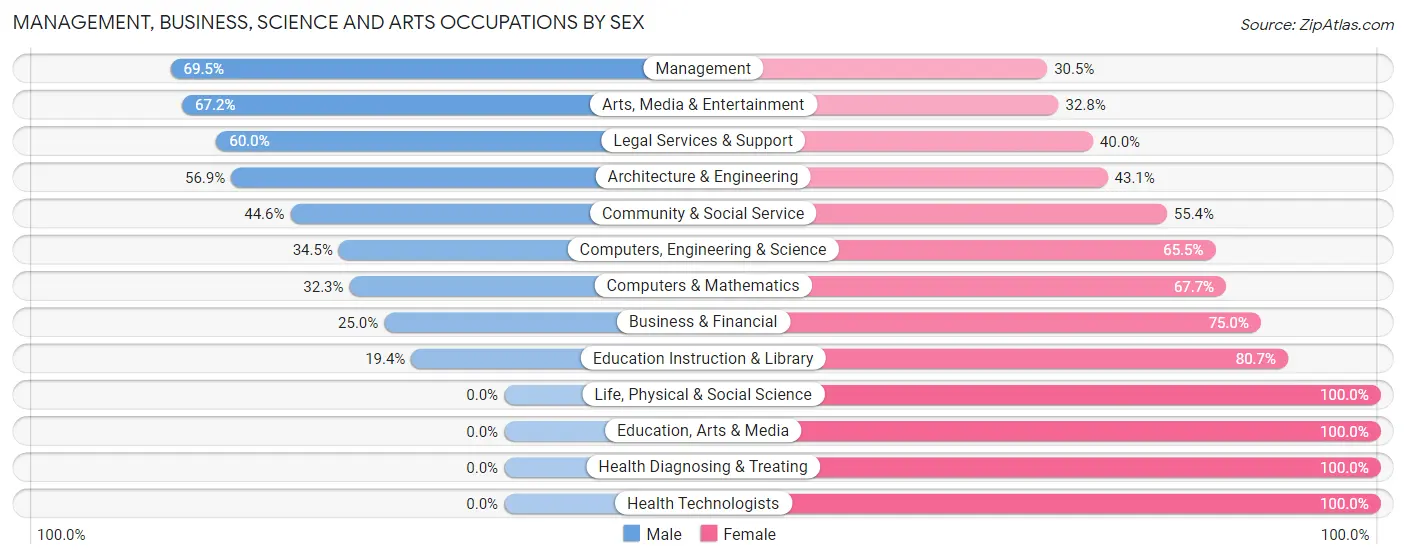
Management, Business, Science and Arts Occupations by Sex
Within the Management, Business, Science and Arts occupations in Mission Canyon, the most male-oriented occupations are Management (69.5%), Arts, Media & Entertainment (67.2%), and Legal Services & Support (60.0%), while the most female-oriented occupations are Life, Physical & Social Science (100.0%), Education, Arts & Media (100.0%), and Health Diagnosing & Treating (100.0%).
| Occupation | Male | Female |
| Management | 274 (69.5%) | 120 (30.5%) |
| Business & Financial | 17 (25.0%) | 51 (75.0%) |
| Computers, Engineering & Science | 71 (34.5%) | 135 (65.5%) |
| Computers & Mathematics | 30 (32.3%) | 63 (67.7%) |
| Architecture & Engineering | 41 (56.9%) | 31 (43.1%) |
| Life, Physical & Social Science | 0 (0.0%) | 41 (100.0%) |
| Community & Social Service | 78 (44.6%) | 97 (55.4%) |
| Education, Arts & Media | 0 (0.0%) | 11 (100.0%) |
| Legal Services & Support | 21 (60.0%) | 14 (40.0%) |
| Education Instruction & Library | 12 (19.4%) | 50 (80.6%) |
| Arts, Media & Entertainment | 45 (67.2%) | 22 (32.8%) |
| Health Diagnosing & Treating | 0 (0.0%) | 68 (100.0%) |
| Health Technologists | 0 (0.0%) | 26 (100.0%) |
| Total (Category) | 440 (48.3%) | 471 (51.7%) |
| Total (Overall) | 645 (48.0%) | 699 (52.0%) |
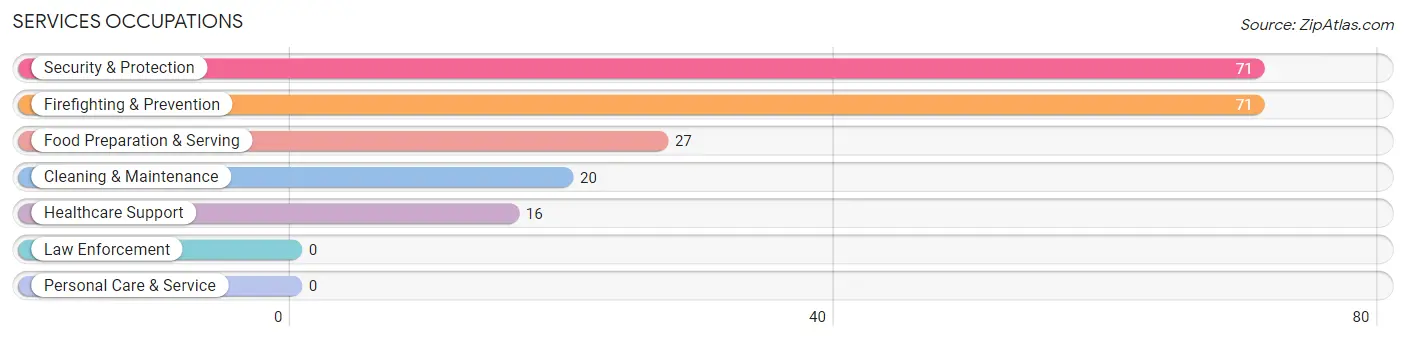
Services Occupations
The most common Services occupations in Mission Canyon are Security & Protection (71 | 5.3%), Firefighting & Prevention (71 | 5.3%), Food Preparation & Serving (27 | 2.0%), Cleaning & Maintenance (20 | 1.5%), and Healthcare Support (16 | 1.2%).
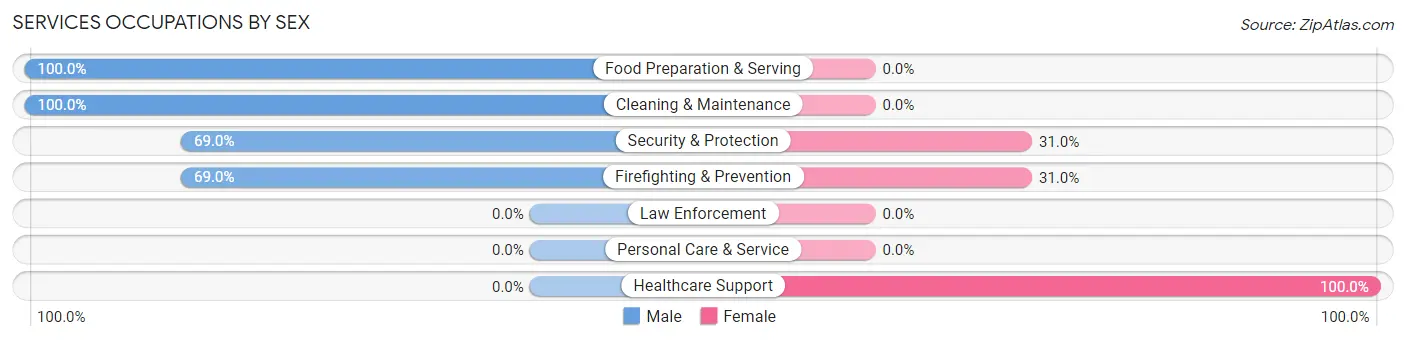
Services Occupations by Sex
Within the Services occupations in Mission Canyon, the most male-oriented occupations are Food Preparation & Serving (100.0%), Cleaning & Maintenance (100.0%), and Security & Protection (69.0%), while the most female-oriented occupations are Healthcare Support (100.0%), Security & Protection (31.0%), and Firefighting & Prevention (31.0%).
| Occupation | Male | Female |
| Healthcare Support | 0 (0.0%) | 16 (100.0%) |
| Security & Protection | 49 (69.0%) | 22 (31.0%) |
| Firefighting & Prevention | 49 (69.0%) | 22 (31.0%) |
| Law Enforcement | 0 (0.0%) | 0 (0.0%) |
| Food Preparation & Serving | 27 (100.0%) | 0 (0.0%) |
| Cleaning & Maintenance | 20 (100.0%) | 0 (0.0%) |
| Personal Care & Service | 0 (0.0%) | 0 (0.0%) |
| Total (Category) | 96 (71.6%) | 38 (28.4%) |
| Total (Overall) | 645 (48.0%) | 699 (52.0%) |
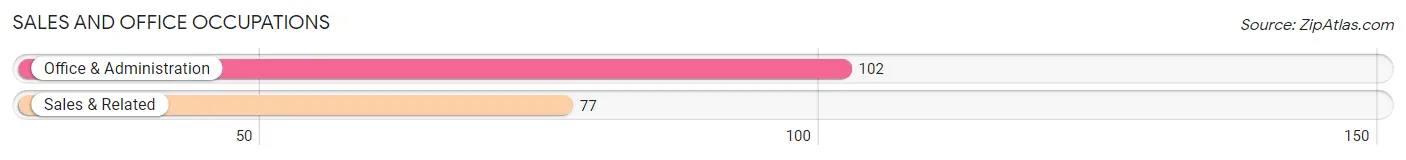
Sales and Office Occupations
The most common Sales and Office occupations in Mission Canyon are Office & Administration (102 | 7.6%), and Sales & Related (77 | 5.7%).
Sales and Office Occupations by Sex
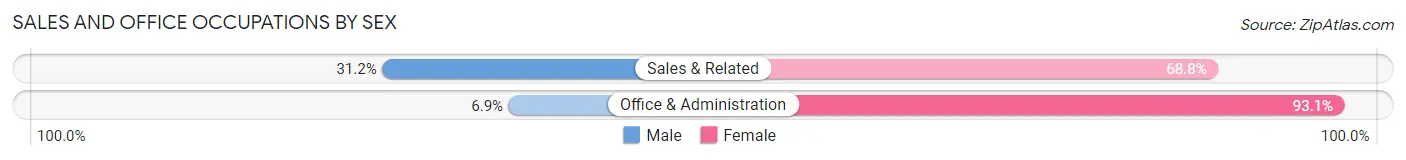
| Occupation | Male | Female |
| Sales & Related | 24 (31.2%) | 53 (68.8%) |
| Office & Administration | 7 (6.9%) | 95 (93.1%) |
| Total (Category) | 31 (17.3%) | 148 (82.7%) |
| Total (Overall) | 645 (48.0%) | 699 (52.0%) |
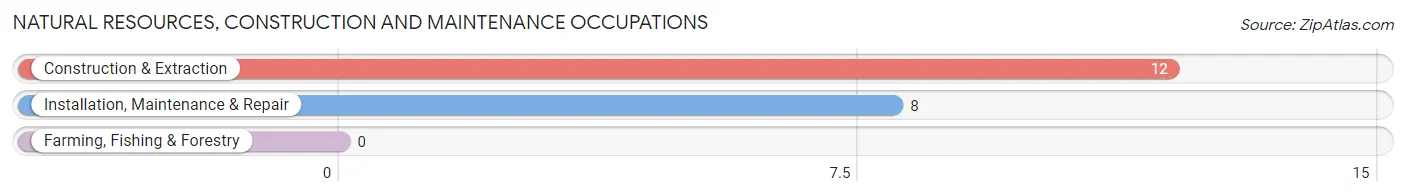
Natural Resources, Construction and Maintenance Occupations
The most common Natural Resources, Construction and Maintenance occupations in Mission Canyon are Construction & Extraction (12 | 0.9%), and Installation, Maintenance & Repair (8 | 0.6%).
Natural Resources, Construction and Maintenance Occupations by Sex
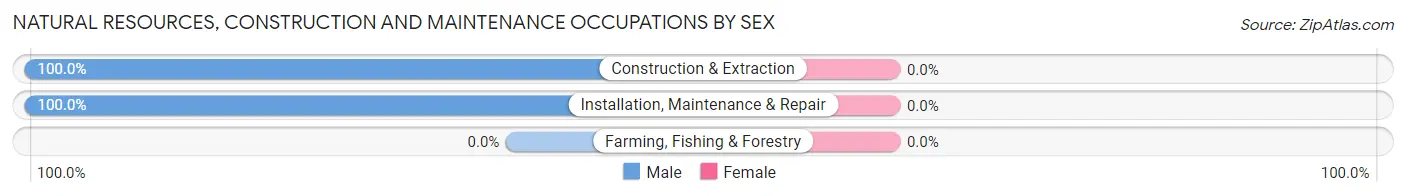
| Occupation | Male | Female |
| Farming, Fishing & Forestry | 0 (0.0%) | 0 (0.0%) |
| Construction & Extraction | 12 (100.0%) | 0 (0.0%) |
| Installation, Maintenance & Repair | 8 (100.0%) | 0 (0.0%) |
| Total (Category) | 20 (100.0%) | 0 (0.0%) |
| Total (Overall) | 645 (48.0%) | 699 (52.0%) |
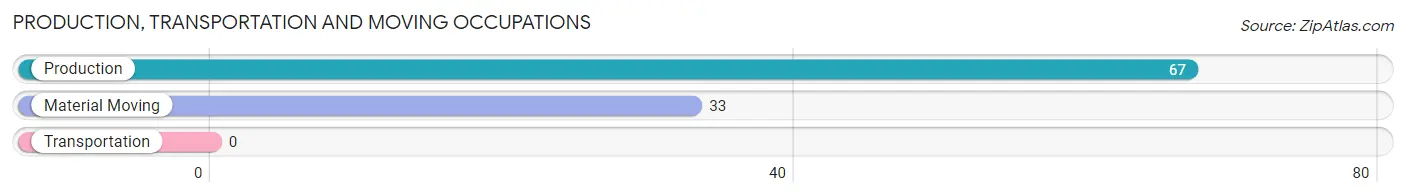
Production, Transportation and Moving Occupations
The most common Production, Transportation and Moving occupations in Mission Canyon are Production (67 | 5.0%), and Material Moving (33 | 2.5%).
Production, Transportation and Moving Occupations by Sex
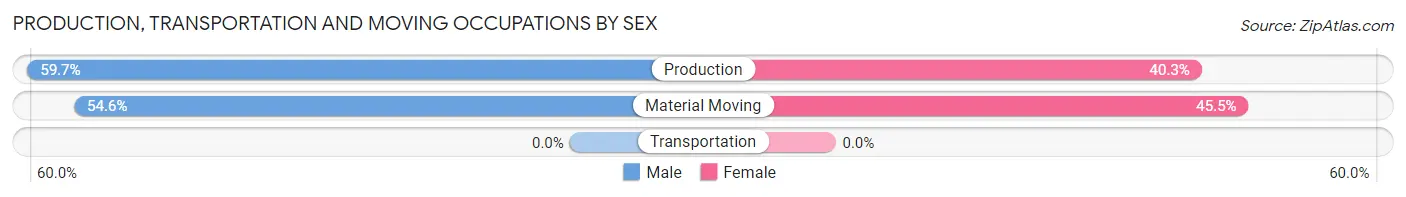
| Occupation | Male | Female |
| Production | 40 (59.7%) | 27 (40.3%) |
| Transportation | 0 (0.0%) | 0 (0.0%) |
| Material Moving | 18 (54.5%) | 15 (45.5%) |
| Total (Category) | 58 (58.0%) | 42 (42.0%) |
| Total (Overall) | 645 (48.0%) | 699 (52.0%) |
Employment Industries by Sex in Mission Canyon
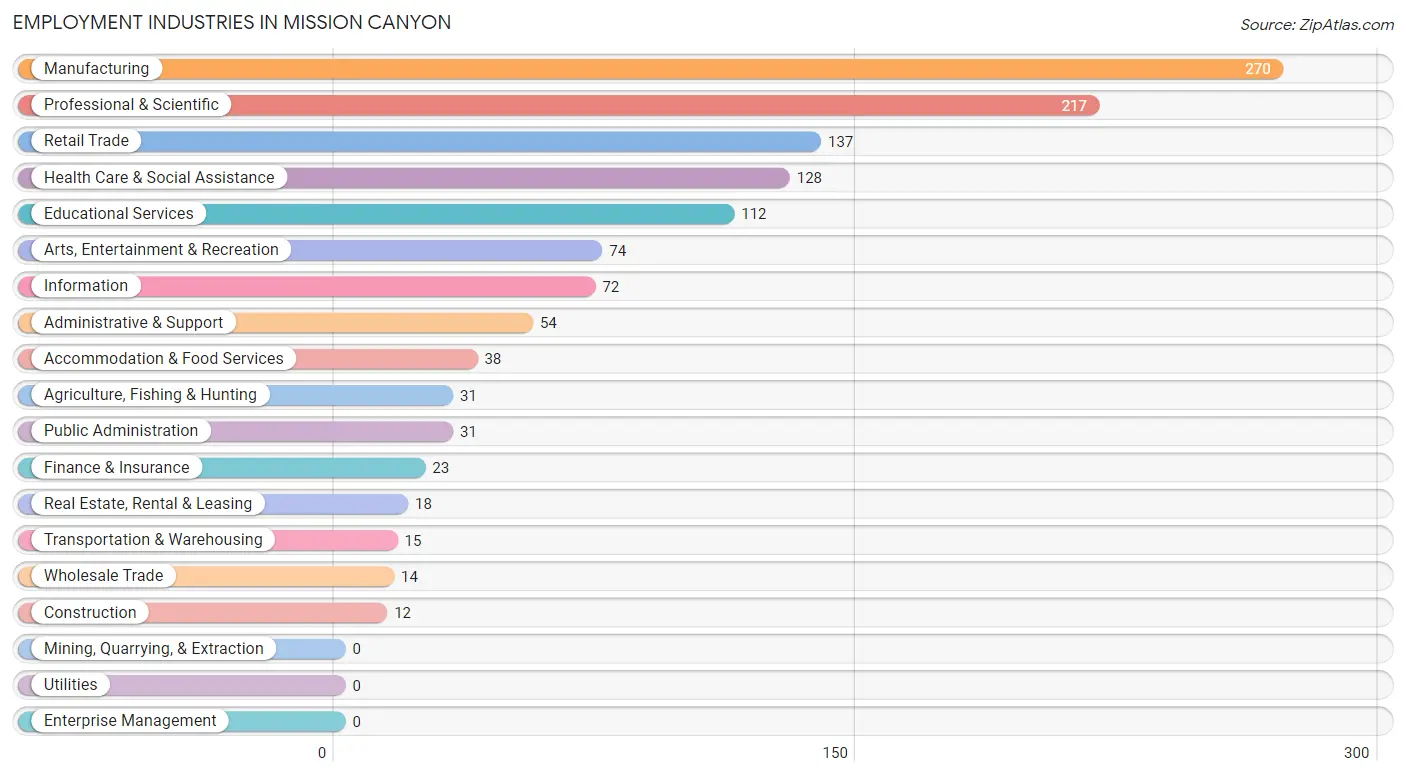
Employment Industries in Mission Canyon
The major employment industries in Mission Canyon include Manufacturing (270 | 20.1%), Professional & Scientific (217 | 16.2%), Retail Trade (137 | 10.2%), Health Care & Social Assistance (128 | 9.5%), and Educational Services (112 | 8.3%).
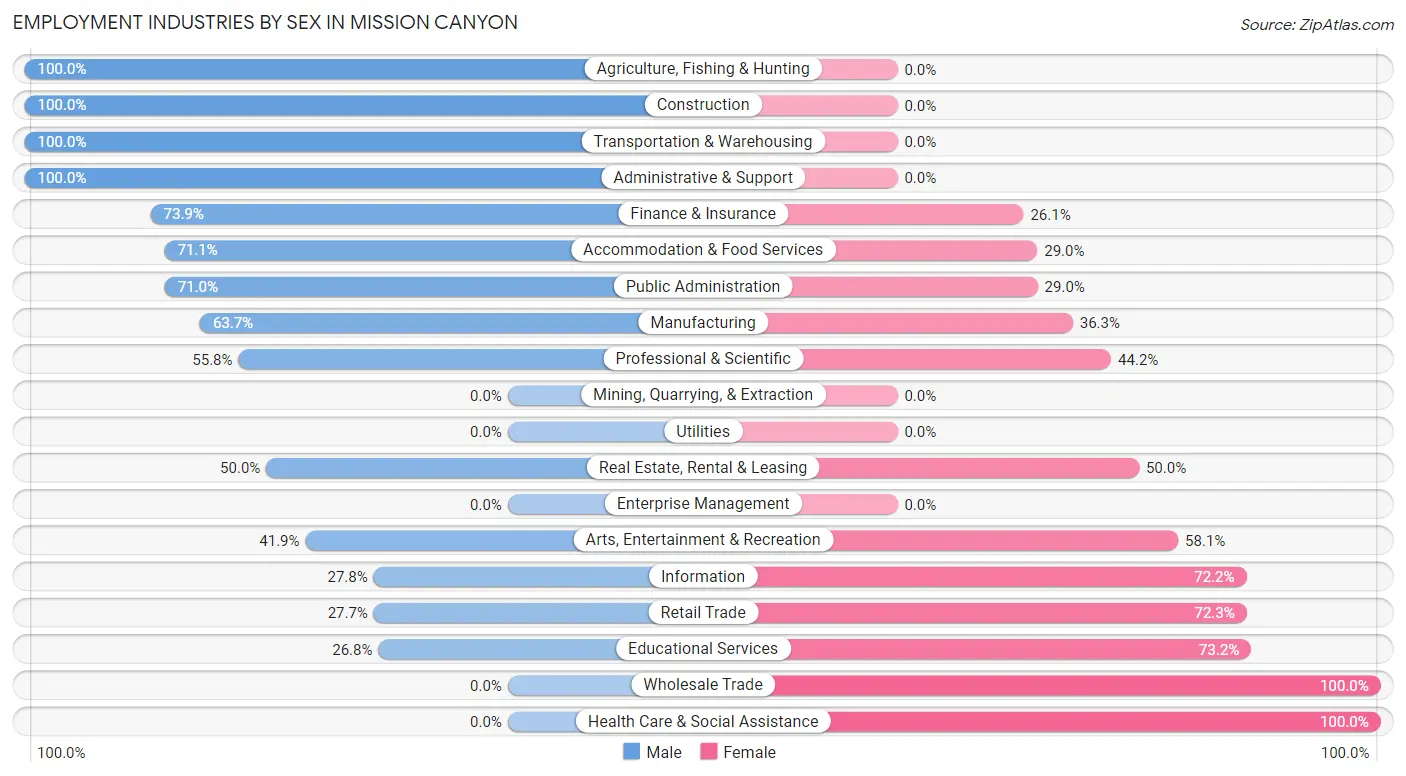
Employment Industries by Sex in Mission Canyon
The Mission Canyon industries that see more men than women are Agriculture, Fishing & Hunting (100.0%), Construction (100.0%), and Transportation & Warehousing (100.0%), whereas the industries that tend to have a higher number of women are Wholesale Trade (100.0%), Health Care & Social Assistance (100.0%), and Educational Services (73.2%).
| Industry | Male | Female |
| Agriculture, Fishing & Hunting | 31 (100.0%) | 0 (0.0%) |
| Mining, Quarrying, & Extraction | 0 (0.0%) | 0 (0.0%) |
| Construction | 12 (100.0%) | 0 (0.0%) |
| Manufacturing | 172 (63.7%) | 98 (36.3%) |
| Wholesale Trade | 0 (0.0%) | 14 (100.0%) |
| Retail Trade | 38 (27.7%) | 99 (72.3%) |
| Transportation & Warehousing | 15 (100.0%) | 0 (0.0%) |
| Utilities | 0 (0.0%) | 0 (0.0%) |
| Information | 20 (27.8%) | 52 (72.2%) |
| Finance & Insurance | 17 (73.9%) | 6 (26.1%) |
| Real Estate, Rental & Leasing | 9 (50.0%) | 9 (50.0%) |
| Professional & Scientific | 121 (55.8%) | 96 (44.2%) |
| Enterprise Management | 0 (0.0%) | 0 (0.0%) |
| Administrative & Support | 54 (100.0%) | 0 (0.0%) |
| Educational Services | 30 (26.8%) | 82 (73.2%) |
| Health Care & Social Assistance | 0 (0.0%) | 128 (100.0%) |
| Arts, Entertainment & Recreation | 31 (41.9%) | 43 (58.1%) |
| Accommodation & Food Services | 27 (71.1%) | 11 (28.9%) |
| Public Administration | 22 (71.0%) | 9 (29.0%) |
| Total | 645 (48.0%) | 699 (52.0%) |
Education in Mission Canyon
School Enrollment in Mission Canyon
The most common levels of schooling among the 499 students in Mission Canyon are college / undergraduate (136 | 27.3%), high school (107 | 21.4%), and nursery / preschool (100 | 20.0%).
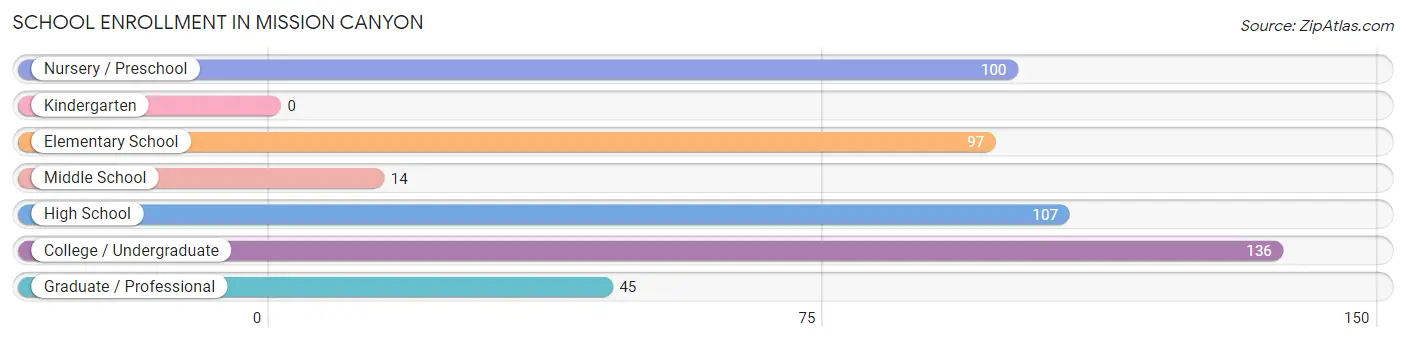
| School Level | # Students | % Students |
| Nursery / Preschool | 100 | 20.0% |
| Kindergarten | 0 | 0.0% |
| Elementary School | 97 | 19.4% |
| Middle School | 14 | 2.8% |
| High School | 107 | 21.4% |
| College / Undergraduate | 136 | 27.3% |
| Graduate / Professional | 45 | 9.0% |
| Total | 499 | 100.0% |
School Enrollment by Age by Funding Source in Mission Canyon
Out of a total of 499 students who are enrolled in schools in Mission Canyon, 227 (45.5%) attend a private institution, while the remaining 272 (54.5%) are enrolled in public schools. The age group of 3 to 4 year olds has the highest likelihood of being enrolled in private schools, with 100 (100.0% in the age bracket) enrolled. Conversely, the age group of 18 to 19 year olds has the lowest likelihood of being enrolled in a private school, with 8 (100.0% in the age bracket) attending a public institution.
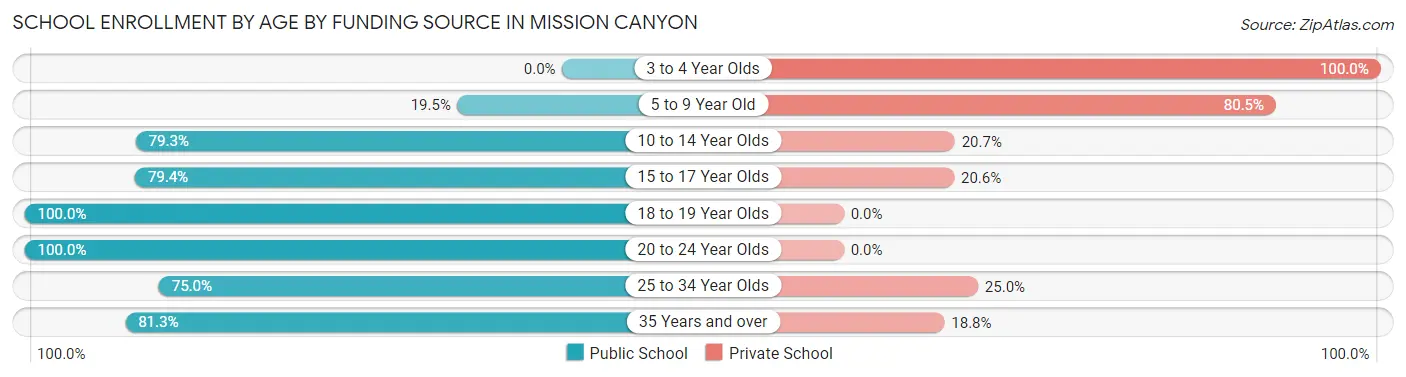
| Age Bracket | Public School | Private School |
| 3 to 4 Year Olds | 0 (0.0%) | 100 (100.0%) |
| 5 to 9 Year Old | 16 (19.5%) | 66 (80.5%) |
| 10 to 14 Year Olds | 23 (79.3%) | 6 (20.7%) |
| 15 to 17 Year Olds | 85 (79.4%) | 22 (20.6%) |
| 18 to 19 Year Olds | 8 (100.0%) | 0 (0.0%) |
| 20 to 24 Year Olds | 17 (100.0%) | 0 (0.0%) |
| 25 to 34 Year Olds | 45 (75.0%) | 15 (25.0%) |
| 35 Years and over | 78 (81.2%) | 18 (18.8%) |
| Total | 272 (54.5%) | 227 (45.5%) |
Educational Attainment by Field of Study in Mission Canyon
Social sciences (319 | 21.6%), business (182 | 12.3%), liberal arts & history (144 | 9.7%), visual & performing arts (124 | 8.4%), and engineering (115 | 7.8%) are the most common fields of study among 1,478 individuals in Mission Canyon who have obtained a bachelor's degree or higher.
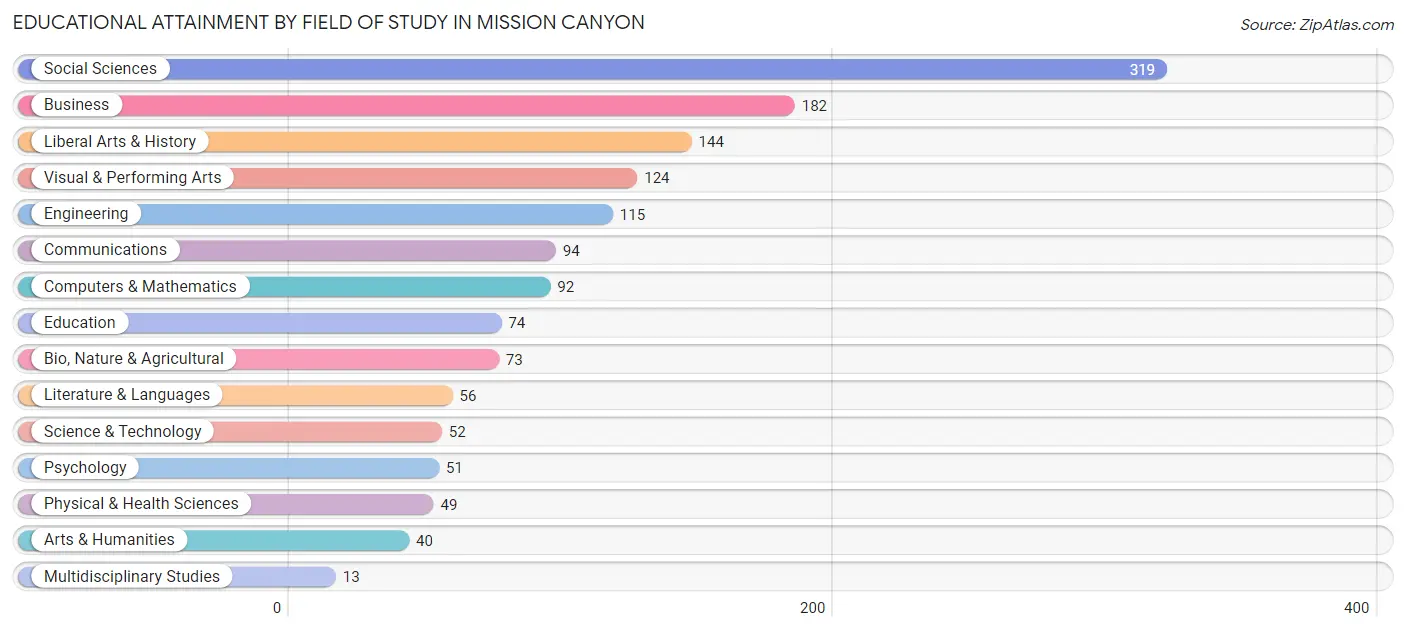
| Field of Study | # Graduates | % Graduates |
| Computers & Mathematics | 92 | 6.2% |
| Bio, Nature & Agricultural | 73 | 4.9% |
| Physical & Health Sciences | 49 | 3.3% |
| Psychology | 51 | 3.5% |
| Social Sciences | 319 | 21.6% |
| Engineering | 115 | 7.8% |
| Multidisciplinary Studies | 13 | 0.9% |
| Science & Technology | 52 | 3.5% |
| Business | 182 | 12.3% |
| Education | 74 | 5.0% |
| Literature & Languages | 56 | 3.8% |
| Liberal Arts & History | 144 | 9.7% |
| Visual & Performing Arts | 124 | 8.4% |
| Communications | 94 | 6.4% |
| Arts & Humanities | 40 | 2.7% |
| Total | 1,478 | 100.0% |
Transportation & Commute in Mission Canyon
Vehicle Availability by Sex in Mission Canyon
The most prevalent vehicle ownership categories in Mission Canyon are males with 2 vehicles (371, accounting for 58.3%) and females with 2 vehicles (347, making up 53.1%).
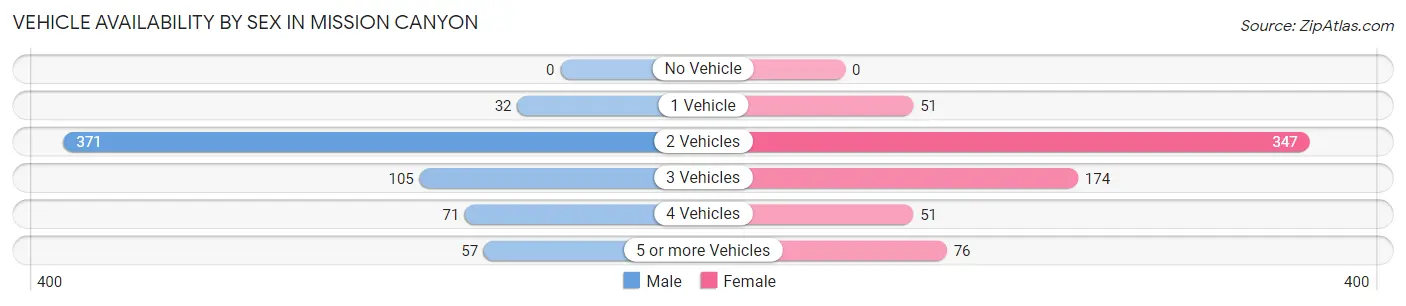
| Vehicles Available | Male | Female |
| No Vehicle | 0 (0.0%) | 0 (0.0%) |
| 1 Vehicle | 32 (5.0%) | 51 (7.3%) |
| 2 Vehicles | 371 (58.3%) | 347 (49.6%) |
| 3 Vehicles | 105 (16.5%) | 174 (24.9%) |
| 4 Vehicles | 71 (11.2%) | 51 (7.3%) |
| 5 or more Vehicles | 57 (9.0%) | 76 (10.9%) |
| Total | 636 (100.0%) | 699 (100.0%) |
Commute Time in Mission Canyon
The most frequently occuring commute durations in Mission Canyon are 15 to 19 minutes (254 commuters, 28.6%), 10 to 14 minutes (180 commuters, 20.3%), and 5 to 9 minutes (161 commuters, 18.1%).
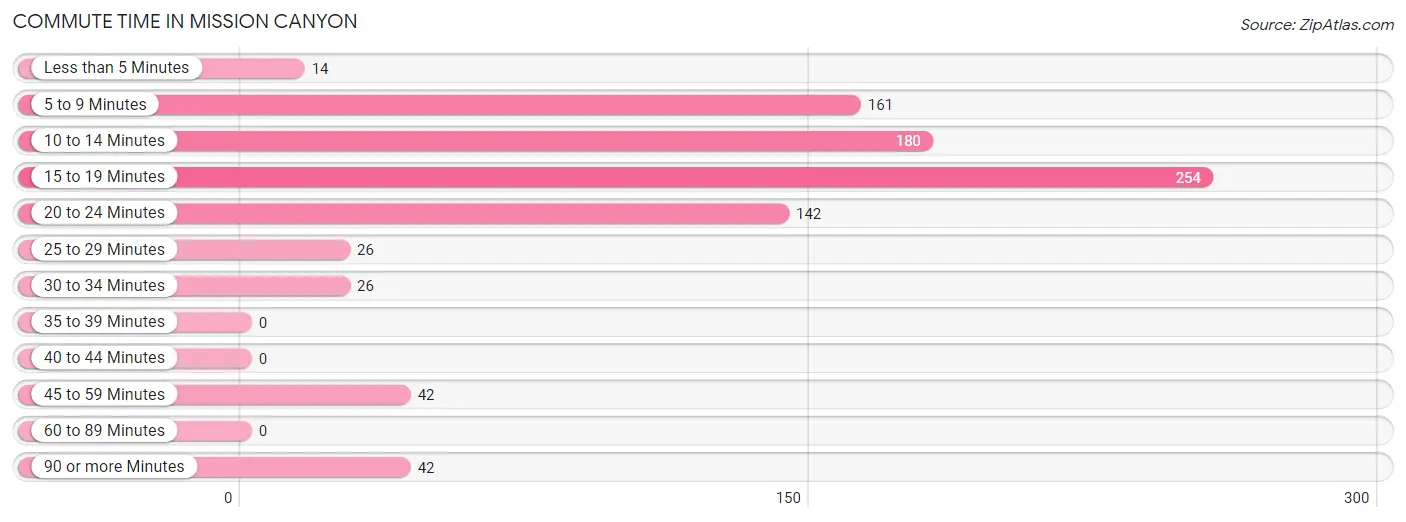
| Commute Time | # Commuters | % Commuters |
| Less than 5 Minutes | 14 | 1.6% |
| 5 to 9 Minutes | 161 | 18.1% |
| 10 to 14 Minutes | 180 | 20.3% |
| 15 to 19 Minutes | 254 | 28.6% |
| 20 to 24 Minutes | 142 | 16.0% |
| 25 to 29 Minutes | 26 | 2.9% |
| 30 to 34 Minutes | 26 | 2.9% |
| 35 to 39 Minutes | 0 | 0.0% |
| 40 to 44 Minutes | 0 | 0.0% |
| 45 to 59 Minutes | 42 | 4.7% |
| 60 to 89 Minutes | 0 | 0.0% |
| 90 or more Minutes | 42 | 4.7% |
Commute Time by Sex in Mission Canyon
The most common commute times in Mission Canyon are 10 to 14 minutes (110 commuters, 28.8%) for males and 15 to 19 minutes (166 commuters, 32.9%) for females.
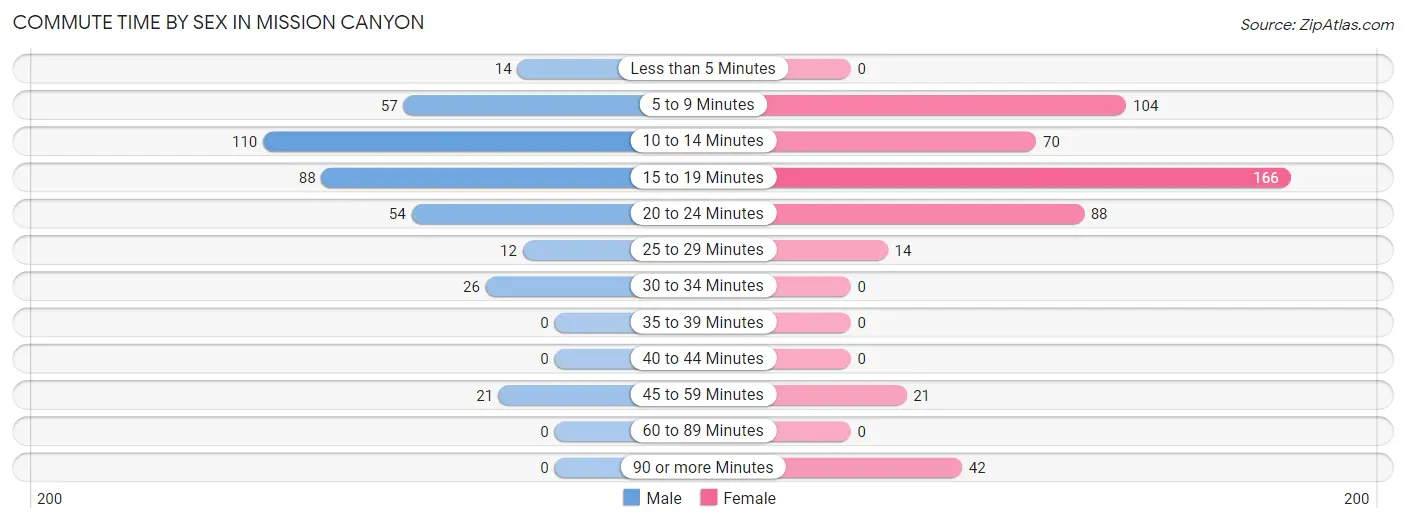
| Commute Time | Male | Female |
| Less than 5 Minutes | 14 (3.7%) | 0 (0.0%) |
| 5 to 9 Minutes | 57 (14.9%) | 104 (20.6%) |
| 10 to 14 Minutes | 110 (28.8%) | 70 (13.9%) |
| 15 to 19 Minutes | 88 (23.0%) | 166 (32.9%) |
| 20 to 24 Minutes | 54 (14.1%) | 88 (17.4%) |
| 25 to 29 Minutes | 12 (3.1%) | 14 (2.8%) |
| 30 to 34 Minutes | 26 (6.8%) | 0 (0.0%) |
| 35 to 39 Minutes | 0 (0.0%) | 0 (0.0%) |
| 40 to 44 Minutes | 0 (0.0%) | 0 (0.0%) |
| 45 to 59 Minutes | 21 (5.5%) | 21 (4.2%) |
| 60 to 89 Minutes | 0 (0.0%) | 0 (0.0%) |
| 90 or more Minutes | 0 (0.0%) | 42 (8.3%) |
Time of Departure to Work by Sex in Mission Canyon
The most frequent times of departure to work in Mission Canyon are 8:00 AM to 8:29 AM (118, 30.9%) for males and 9:00 AM to 9:59 AM (156, 30.9%) for females.
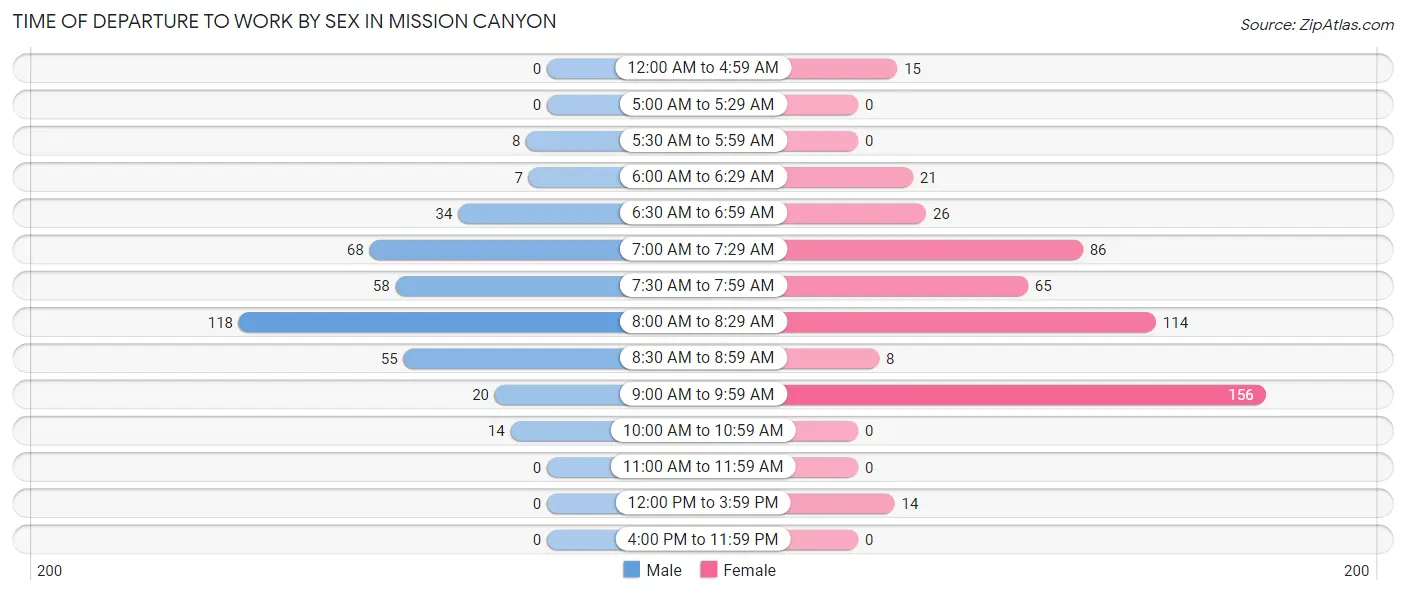
| Time of Departure | Male | Female |
| 12:00 AM to 4:59 AM | 0 (0.0%) | 15 (3.0%) |
| 5:00 AM to 5:29 AM | 0 (0.0%) | 0 (0.0%) |
| 5:30 AM to 5:59 AM | 8 (2.1%) | 0 (0.0%) |
| 6:00 AM to 6:29 AM | 7 (1.8%) | 21 (4.2%) |
| 6:30 AM to 6:59 AM | 34 (8.9%) | 26 (5.1%) |
| 7:00 AM to 7:29 AM | 68 (17.8%) | 86 (17.0%) |
| 7:30 AM to 7:59 AM | 58 (15.2%) | 65 (12.9%) |
| 8:00 AM to 8:29 AM | 118 (30.9%) | 114 (22.6%) |
| 8:30 AM to 8:59 AM | 55 (14.4%) | 8 (1.6%) |
| 9:00 AM to 9:59 AM | 20 (5.2%) | 156 (30.9%) |
| 10:00 AM to 10:59 AM | 14 (3.7%) | 0 (0.0%) |
| 11:00 AM to 11:59 AM | 0 (0.0%) | 0 (0.0%) |
| 12:00 PM to 3:59 PM | 0 (0.0%) | 14 (2.8%) |
| 4:00 PM to 11:59 PM | 0 (0.0%) | 0 (0.0%) |
| Total | 382 (100.0%) | 505 (100.0%) |
Housing Occupancy in Mission Canyon
Occupancy by Ownership in Mission Canyon
Of the total 936 dwellings in Mission Canyon, owner-occupied units account for 684 (73.1%), while renter-occupied units make up 252 (26.9%).
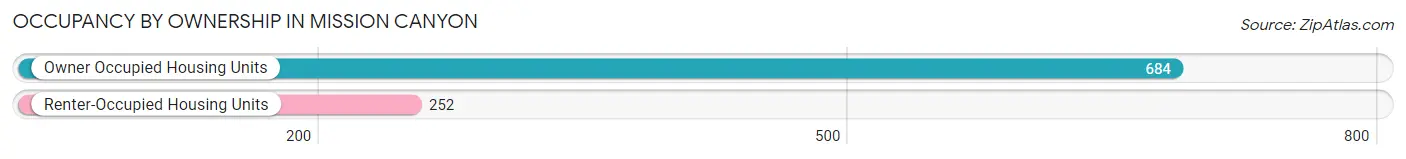
| Occupancy | # Housing Units | % Housing Units |
| Owner Occupied Housing Units | 684 | 73.1% |
| Renter-Occupied Housing Units | 252 | 26.9% |
| Total Occupied Housing Units | 936 | 100.0% |
Occupancy by Household Size in Mission Canyon
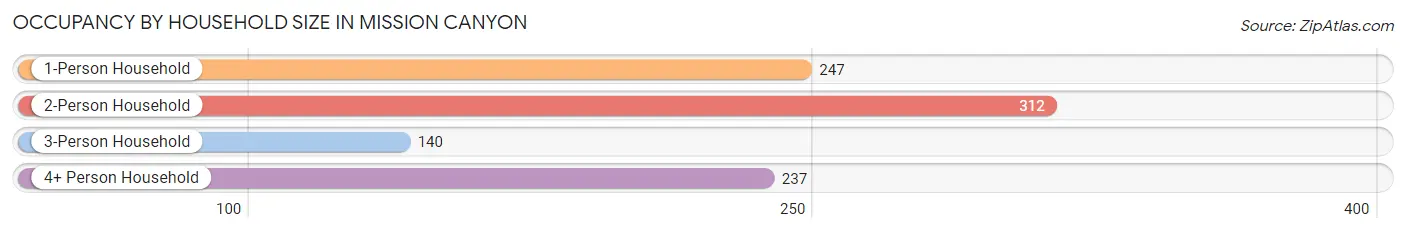
| Household Size | # Housing Units | % Housing Units |
| 1-Person Household | 247 | 26.4% |
| 2-Person Household | 312 | 33.3% |
| 3-Person Household | 140 | 15.0% |
| 4+ Person Household | 237 | 25.3% |
| Total Housing Units | 936 | 100.0% |
Occupancy by Ownership by Household Size in Mission Canyon
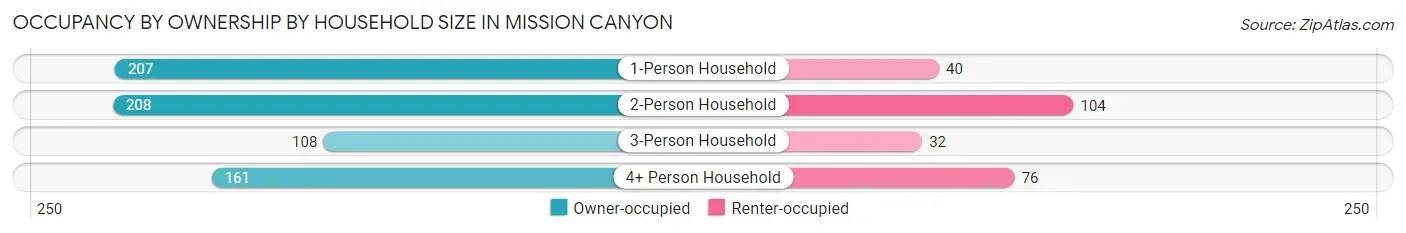
| Household Size | Owner-occupied | Renter-occupied |
| 1-Person Household | 207 (83.8%) | 40 (16.2%) |
| 2-Person Household | 208 (66.7%) | 104 (33.3%) |
| 3-Person Household | 108 (77.1%) | 32 (22.9%) |
| 4+ Person Household | 161 (67.9%) | 76 (32.1%) |
| Total Housing Units | 684 (73.1%) | 252 (26.9%) |
Occupancy by Educational Attainment in Mission Canyon
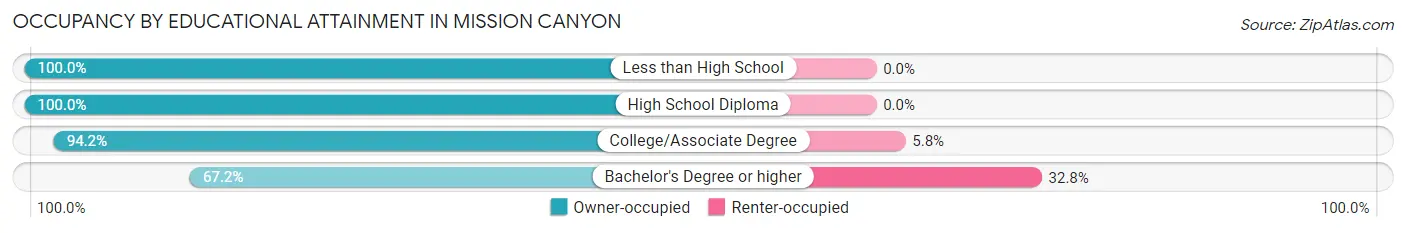
| Household Size | Owner-occupied | Renter-occupied |
| Less than High School | 22 (100.0%) | 0 (0.0%) |
| High School Diploma | 46 (100.0%) | 0 (0.0%) |
| College/Associate Degree | 114 (94.2%) | 7 (5.8%) |
| Bachelor's Degree or higher | 502 (67.2%) | 245 (32.8%) |
Occupancy by Age of Householder in Mission Canyon
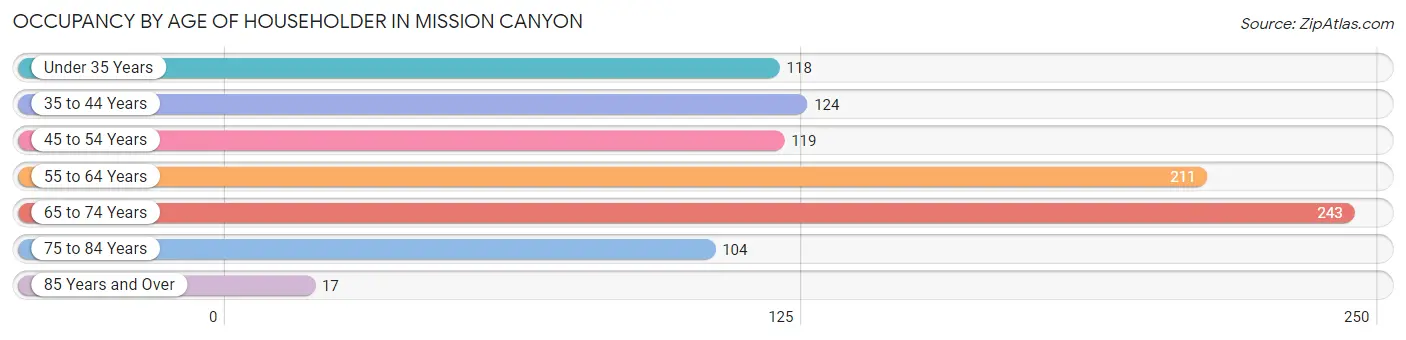
| Age Bracket | # Households | % Households |
| Under 35 Years | 118 | 12.6% |
| 35 to 44 Years | 124 | 13.3% |
| 45 to 54 Years | 119 | 12.7% |
| 55 to 64 Years | 211 | 22.5% |
| 65 to 74 Years | 243 | 26.0% |
| 75 to 84 Years | 104 | 11.1% |
| 85 Years and Over | 17 | 1.8% |
| Total | 936 | 100.0% |
Housing Finances in Mission Canyon
Median Income by Occupancy in Mission Canyon
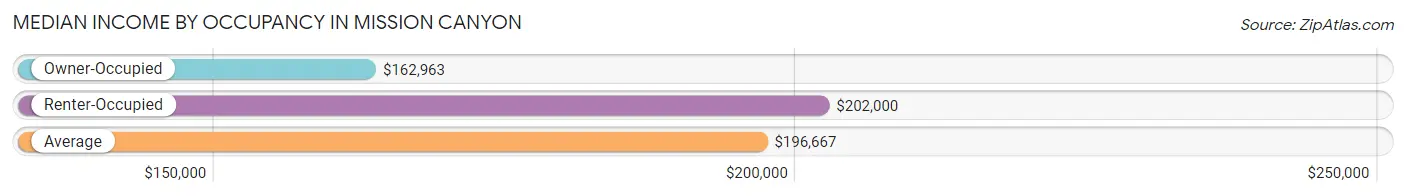
| Occupancy Type | # Households | Median Income |
| Owner-Occupied | 684 (73.1%) | $162,963 |
| Renter-Occupied | 252 (26.9%) | $202,000 |
| Average | 936 (100.0%) | $196,667 |
Occupancy by Householder Income Bracket in Mission Canyon
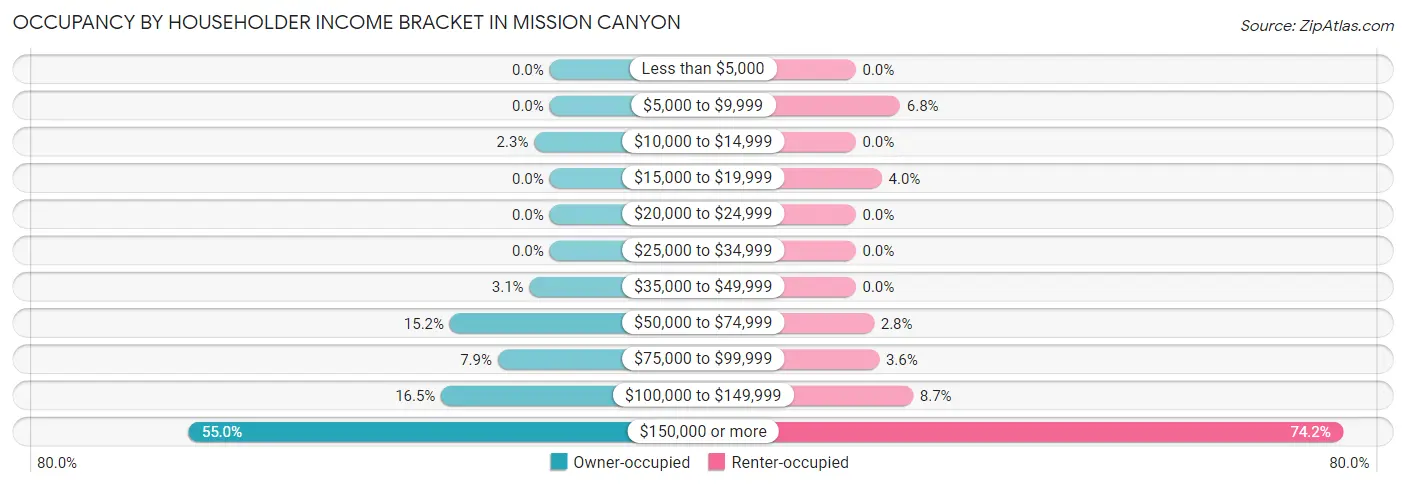
| Income Bracket | Owner-occupied | Renter-occupied |
| Less than $5,000 | 0 (0.0%) | 0 (0.0%) |
| $5,000 to $9,999 | 0 (0.0%) | 17 (6.8%) |
| $10,000 to $14,999 | 16 (2.3%) | 0 (0.0%) |
| $15,000 to $19,999 | 0 (0.0%) | 10 (4.0%) |
| $20,000 to $24,999 | 0 (0.0%) | 0 (0.0%) |
| $25,000 to $34,999 | 0 (0.0%) | 0 (0.0%) |
| $35,000 to $49,999 | 21 (3.1%) | 0 (0.0%) |
| $50,000 to $74,999 | 104 (15.2%) | 7 (2.8%) |
| $75,000 to $99,999 | 54 (7.9%) | 9 (3.6%) |
| $100,000 to $149,999 | 113 (16.5%) | 22 (8.7%) |
| $150,000 or more | 376 (55.0%) | 187 (74.2%) |
| Total | 684 (100.0%) | 252 (100.0%) |
Monthly Housing Cost Tiers in Mission Canyon
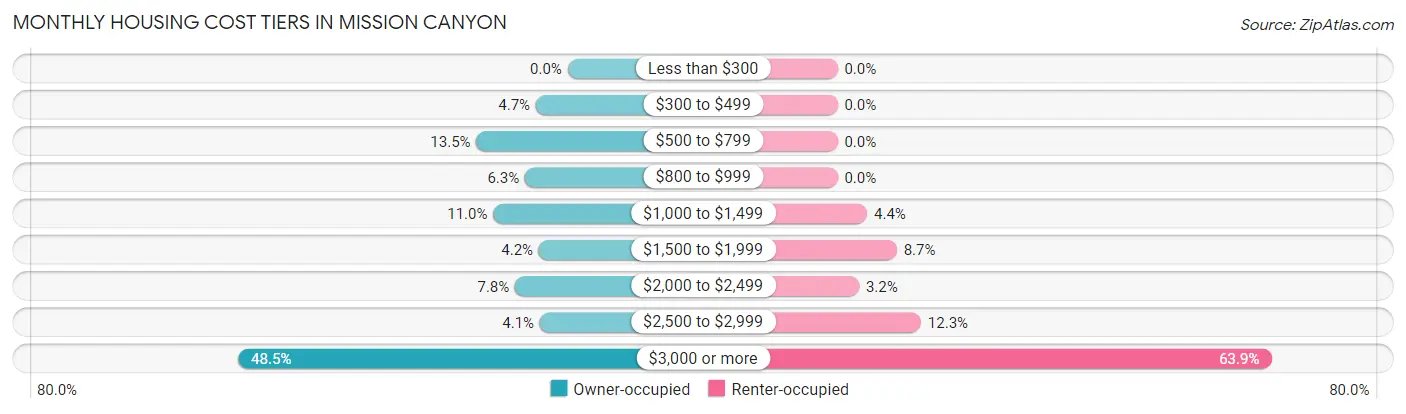
| Monthly Cost | Owner-occupied | Renter-occupied |
| Less than $300 | 0 (0.0%) | 0 (0.0%) |
| $300 to $499 | 32 (4.7%) | 0 (0.0%) |
| $500 to $799 | 92 (13.5%) | 0 (0.0%) |
| $800 to $999 | 43 (6.3%) | 0 (0.0%) |
| $1,000 to $1,499 | 75 (11.0%) | 11 (4.4%) |
| $1,500 to $1,999 | 29 (4.2%) | 22 (8.7%) |
| $2,000 to $2,499 | 53 (7.7%) | 8 (3.2%) |
| $2,500 to $2,999 | 28 (4.1%) | 31 (12.3%) |
| $3,000 or more | 332 (48.5%) | 161 (63.9%) |
| Total | 684 (100.0%) | 252 (100.0%) |
Physical Housing Characteristics in Mission Canyon
Housing Structures in Mission Canyon
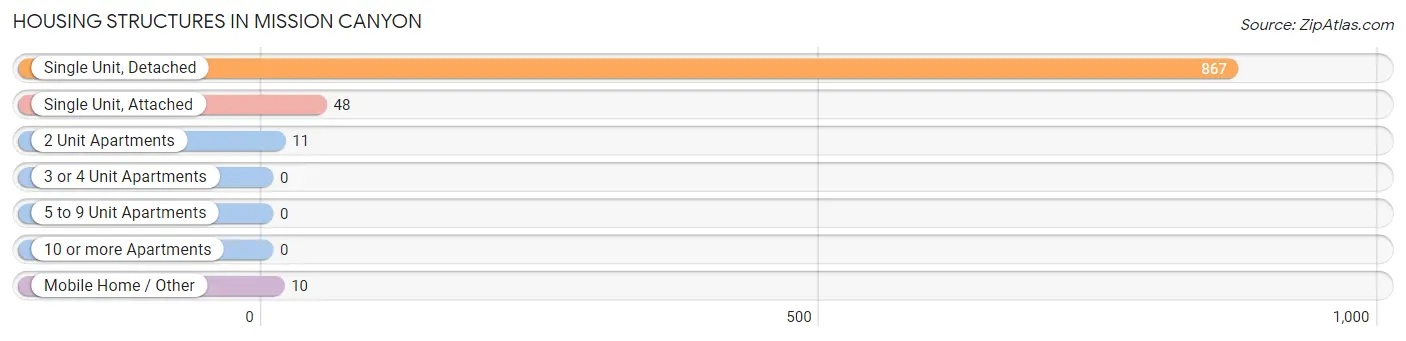
| Structure Type | # Housing Units | % Housing Units |
| Single Unit, Detached | 867 | 92.6% |
| Single Unit, Attached | 48 | 5.1% |
| 2 Unit Apartments | 11 | 1.2% |
| 3 or 4 Unit Apartments | 0 | 0.0% |
| 5 to 9 Unit Apartments | 0 | 0.0% |
| 10 or more Apartments | 0 | 0.0% |
| Mobile Home / Other | 10 | 1.1% |
| Total | 936 | 100.0% |
Housing Structures by Occupancy in Mission Canyon
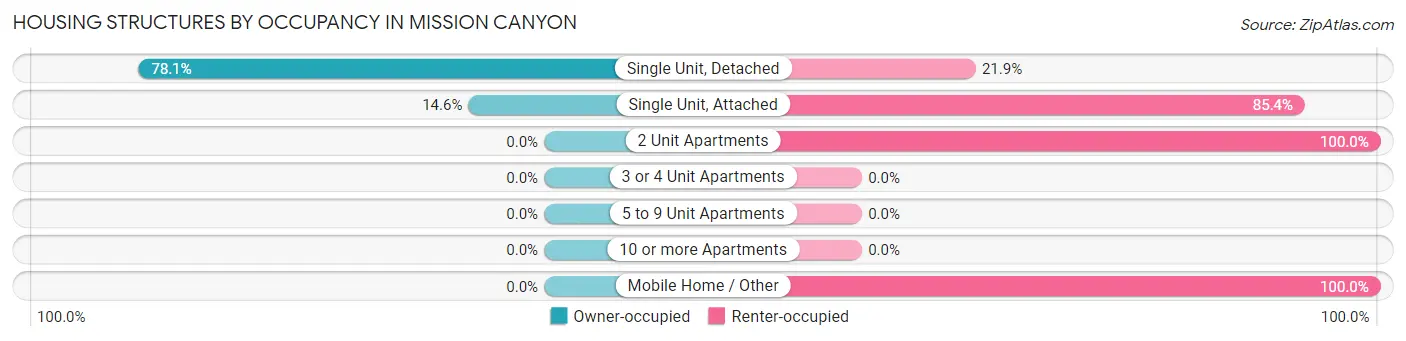
| Structure Type | Owner-occupied | Renter-occupied |
| Single Unit, Detached | 677 (78.1%) | 190 (21.9%) |
| Single Unit, Attached | 7 (14.6%) | 41 (85.4%) |
| 2 Unit Apartments | 0 (0.0%) | 11 (100.0%) |
| 3 or 4 Unit Apartments | 0 (0.0%) | 0 (0.0%) |
| 5 to 9 Unit Apartments | 0 (0.0%) | 0 (0.0%) |
| 10 or more Apartments | 0 (0.0%) | 0 (0.0%) |
| Mobile Home / Other | 0 (0.0%) | 10 (100.0%) |
| Total | 684 (73.1%) | 252 (26.9%) |
Housing Structures by Number of Rooms in Mission Canyon
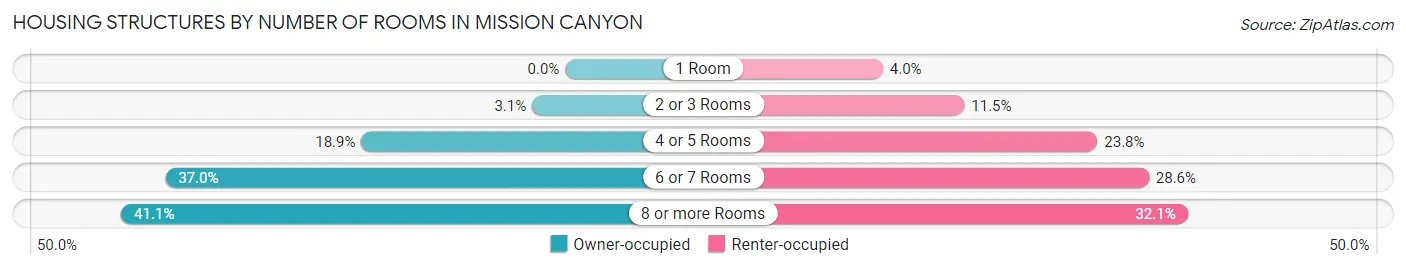
| Number of Rooms | Owner-occupied | Renter-occupied |
| 1 Room | 0 (0.0%) | 10 (4.0%) |
| 2 or 3 Rooms | 21 (3.1%) | 29 (11.5%) |
| 4 or 5 Rooms | 129 (18.9%) | 60 (23.8%) |
| 6 or 7 Rooms | 253 (37.0%) | 72 (28.6%) |
| 8 or more Rooms | 281 (41.1%) | 81 (32.1%) |
| Total | 684 (100.0%) | 252 (100.0%) |
Housing Structure by Heating Type in Mission Canyon
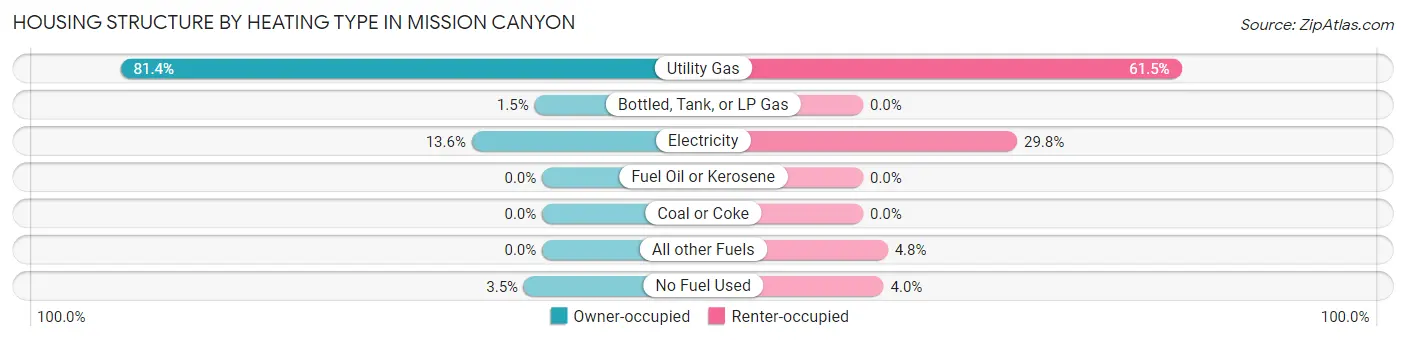
| Heating Type | Owner-occupied | Renter-occupied |
| Utility Gas | 557 (81.4%) | 155 (61.5%) |
| Bottled, Tank, or LP Gas | 10 (1.5%) | 0 (0.0%) |
| Electricity | 93 (13.6%) | 75 (29.8%) |
| Fuel Oil or Kerosene | 0 (0.0%) | 0 (0.0%) |
| Coal or Coke | 0 (0.0%) | 0 (0.0%) |
| All other Fuels | 0 (0.0%) | 12 (4.8%) |
| No Fuel Used | 24 (3.5%) | 10 (4.0%) |
| Total | 684 (100.0%) | 252 (100.0%) |
Household Vehicle Usage in Mission Canyon
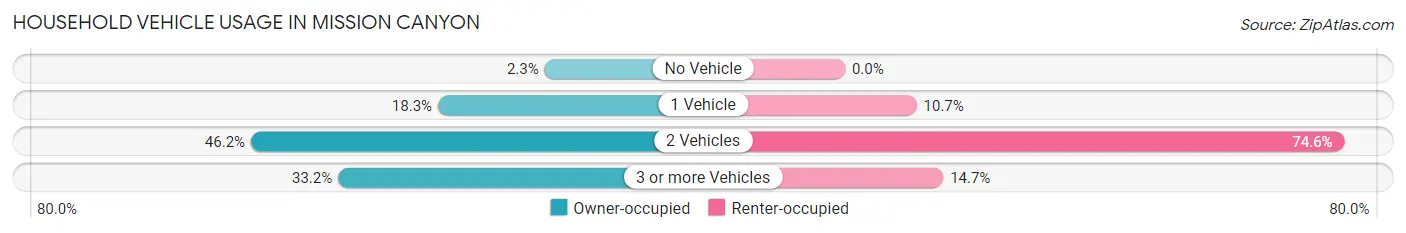
| Vehicles per Household | Owner-occupied | Renter-occupied |
| No Vehicle | 16 (2.3%) | 0 (0.0%) |
| 1 Vehicle | 125 (18.3%) | 27 (10.7%) |
| 2 Vehicles | 316 (46.2%) | 188 (74.6%) |
| 3 or more Vehicles | 227 (33.2%) | 37 (14.7%) |
| Total | 684 (100.0%) | 252 (100.0%) |
Real Estate & Mortgages in Mission Canyon
Real Estate and Mortgage Overview in Mission Canyon
| Characteristic | Without Mortgage | With Mortgage |
| Housing Units | 241 | 443 |
| Median Property Value | $1,708,300 | $1,770,800 |
| Median Household Income | $160,284 | $253 |
| Monthly Housing Costs | $913 | $332 |
| Real Estate Taxes | $5,711 | $8 |
Property Value by Mortgage Status in Mission Canyon
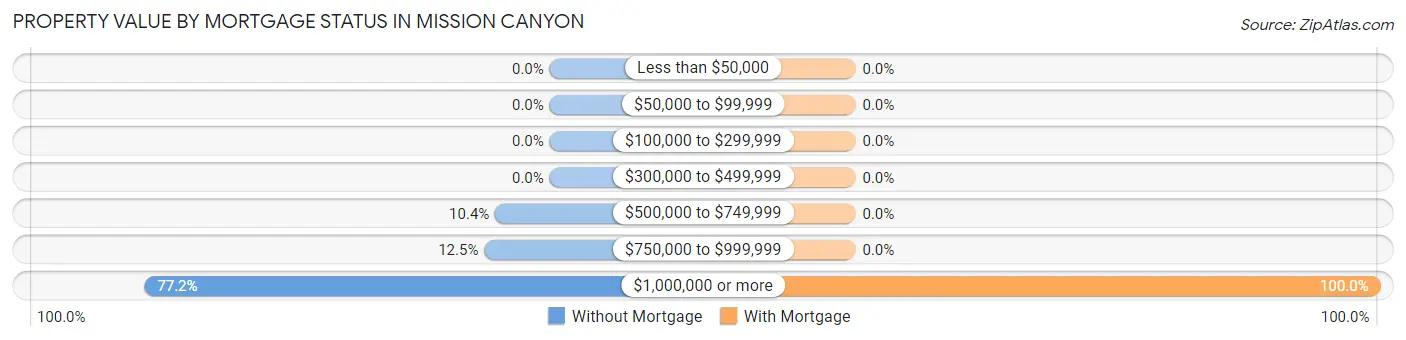
| Property Value | Without Mortgage | With Mortgage |
| Less than $50,000 | 0 (0.0%) | 0 (0.0%) |
| $50,000 to $99,999 | 0 (0.0%) | 0 (0.0%) |
| $100,000 to $299,999 | 0 (0.0%) | 0 (0.0%) |
| $300,000 to $499,999 | 0 (0.0%) | 0 (0.0%) |
| $500,000 to $749,999 | 25 (10.4%) | 0 (0.0%) |
| $750,000 to $999,999 | 30 (12.4%) | 0 (0.0%) |
| $1,000,000 or more | 186 (77.2%) | 443 (100.0%) |
| Total | 241 (100.0%) | 443 (100.0%) |
Household Income by Mortgage Status in Mission Canyon
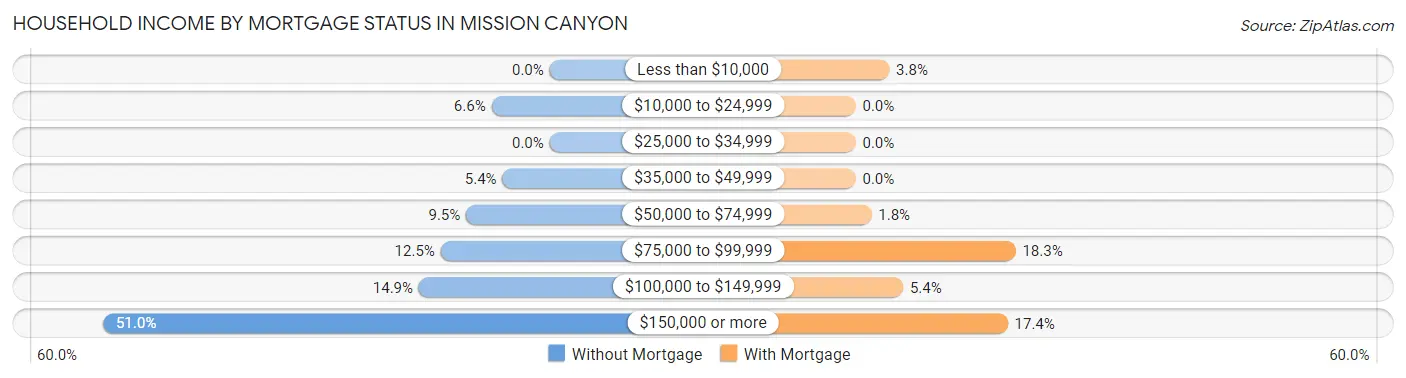
| Household Income | Without Mortgage | With Mortgage |
| Less than $10,000 | 0 (0.0%) | 17 (3.8%) |
| $10,000 to $24,999 | 16 (6.6%) | 0 (0.0%) |
| $25,000 to $34,999 | 0 (0.0%) | 0 (0.0%) |
| $35,000 to $49,999 | 13 (5.4%) | 0 (0.0%) |
| $50,000 to $74,999 | 23 (9.5%) | 8 (1.8%) |
| $75,000 to $99,999 | 30 (12.4%) | 81 (18.3%) |
| $100,000 to $149,999 | 36 (14.9%) | 24 (5.4%) |
| $150,000 or more | 123 (51.0%) | 77 (17.4%) |
| Total | 241 (100.0%) | 443 (100.0%) |
Property Value to Household Income Ratio in Mission Canyon
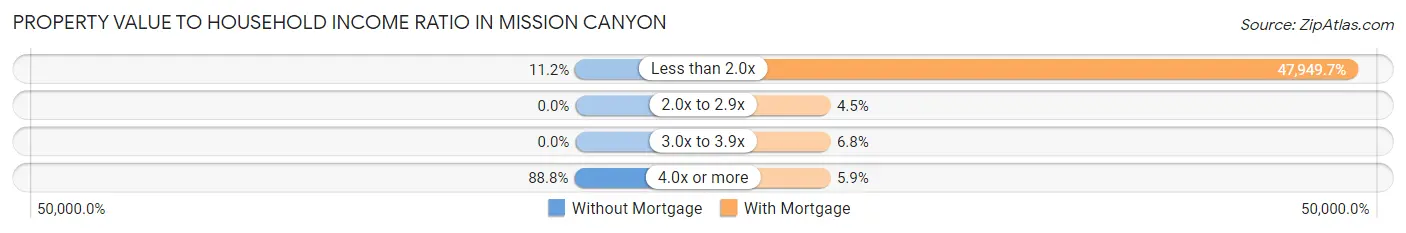
| Value-to-Income Ratio | Without Mortgage | With Mortgage |
| Less than 2.0x | 27 (11.2%) | 212,417 (47,949.7%) |
| 2.0x to 2.9x | 0 (0.0%) | 20 (4.5%) |
| 3.0x to 3.9x | 0 (0.0%) | 30 (6.8%) |
| 4.0x or more | 214 (88.8%) | 26 (5.9%) |
| Total | 241 (100.0%) | 443 (100.0%) |
Real Estate Taxes by Mortgage Status in Mission Canyon
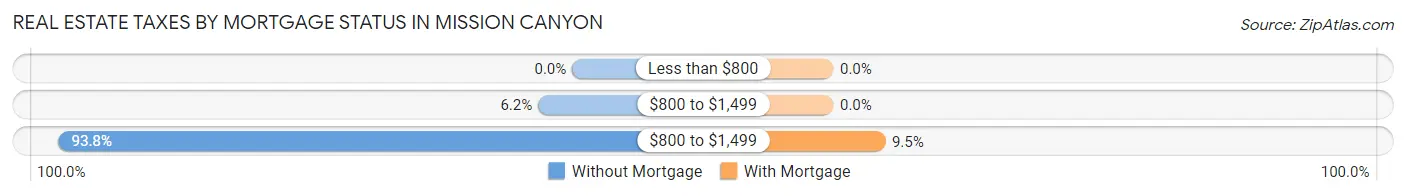
| Property Taxes | Without Mortgage | With Mortgage |
| Less than $800 | 0 (0.0%) | 0 (0.0%) |
| $800 to $1,499 | 15 (6.2%) | 0 (0.0%) |
| $800 to $1,499 | 226 (93.8%) | 42 (9.5%) |
| Total | 241 (100.0%) | 443 (100.0%) |
Health & Disability in Mission Canyon
Health Insurance Coverage by Age in Mission Canyon
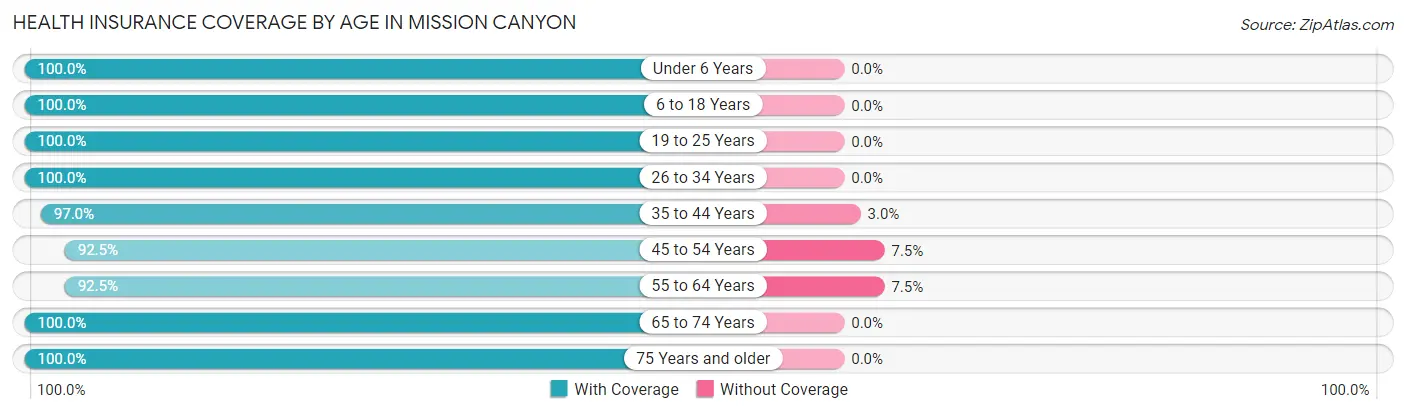
| Age Bracket | With Coverage | Without Coverage |
| Under 6 Years | 210 (100.0%) | 0 (0.0%) |
| 6 to 18 Years | 218 (100.0%) | 0 (0.0%) |
| 19 to 25 Years | 219 (100.0%) | 0 (0.0%) |
| 26 to 34 Years | 247 (100.0%) | 0 (0.0%) |
| 35 to 44 Years | 287 (97.0%) | 9 (3.0%) |
| 45 to 54 Years | 308 (92.5%) | 25 (7.5%) |
| 55 to 64 Years | 346 (92.5%) | 28 (7.5%) |
| 65 to 74 Years | 412 (100.0%) | 0 (0.0%) |
| 75 Years and older | 191 (100.0%) | 0 (0.0%) |
| Total | 2,438 (97.5%) | 62 (2.5%) |
Health Insurance Coverage by Citizenship Status in Mission Canyon
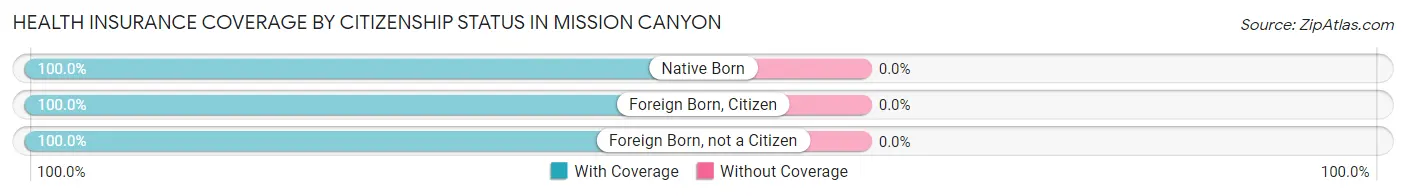
| Citizenship Status | With Coverage | Without Coverage |
| Native Born | 210 (100.0%) | 0 (0.0%) |
| Foreign Born, Citizen | 218 (100.0%) | 0 (0.0%) |
| Foreign Born, not a Citizen | 219 (100.0%) | 0 (0.0%) |
Health Insurance Coverage by Household Income in Mission Canyon
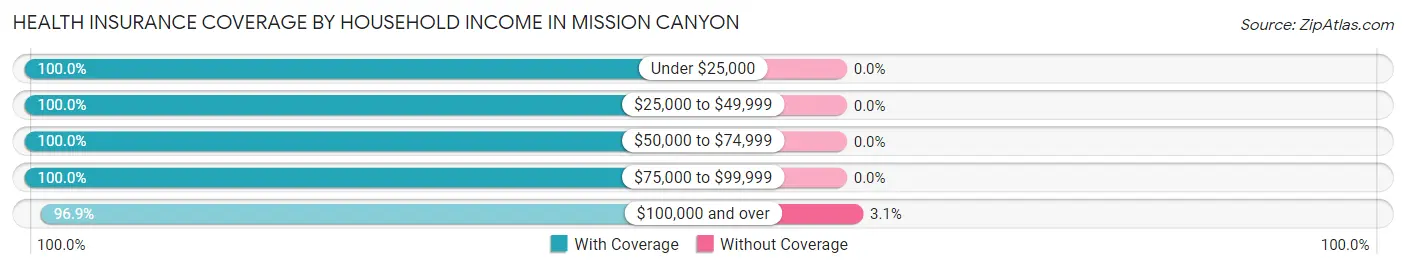
| Household Income | With Coverage | Without Coverage |
| Under $25,000 | 75 (100.0%) | 0 (0.0%) |
| $25,000 to $49,999 | 34 (100.0%) | 0 (0.0%) |
| $50,000 to $74,999 | 169 (100.0%) | 0 (0.0%) |
| $75,000 to $99,999 | 194 (100.0%) | 0 (0.0%) |
| $100,000 and over | 1,966 (96.9%) | 62 (3.1%) |
Public vs Private Health Insurance Coverage by Age in Mission Canyon
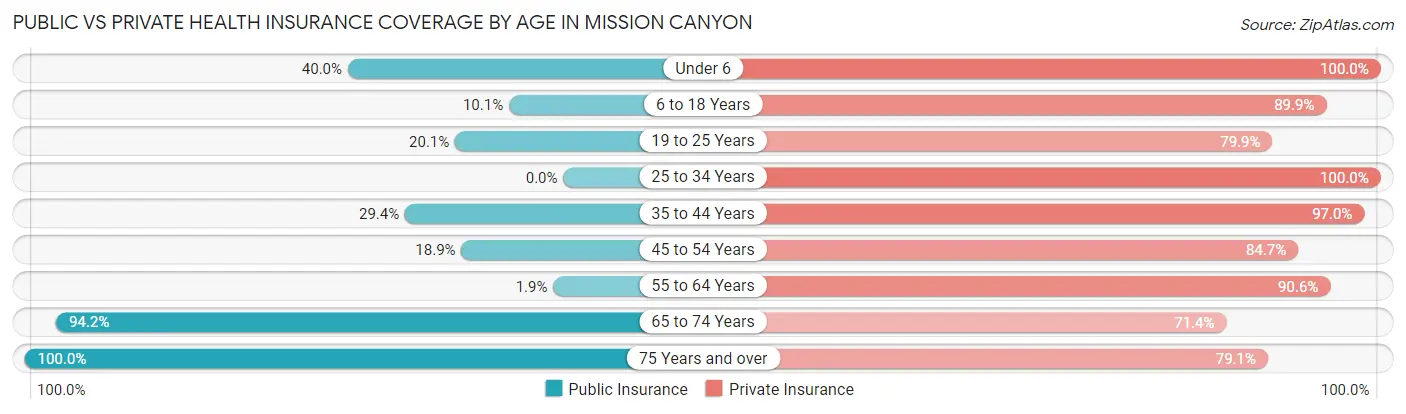
| Age Bracket | Public Insurance | Private Insurance |
| Under 6 | 84 (40.0%) | 210 (100.0%) |
| 6 to 18 Years | 22 (10.1%) | 196 (89.9%) |
| 19 to 25 Years | 44 (20.1%) | 175 (79.9%) |
| 25 to 34 Years | 0 (0.0%) | 247 (100.0%) |
| 35 to 44 Years | 87 (29.4%) | 287 (97.0%) |
| 45 to 54 Years | 63 (18.9%) | 282 (84.7%) |
| 55 to 64 Years | 7 (1.9%) | 339 (90.6%) |
| 65 to 74 Years | 388 (94.2%) | 294 (71.4%) |
| 75 Years and over | 191 (100.0%) | 151 (79.1%) |
| Total | 886 (35.4%) | 2,181 (87.2%) |
Disability Status by Sex by Age in Mission Canyon
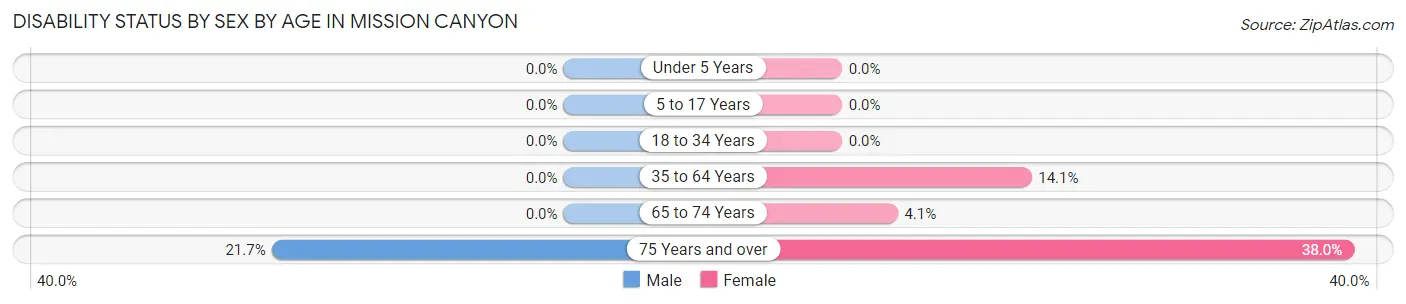
| Age Bracket | Male | Female |
| Under 5 Years | 0 (0.0%) | 0 (0.0%) |
| 5 to 17 Years | 0 (0.0%) | 0 (0.0%) |
| 18 to 34 Years | 0 (0.0%) | 0 (0.0%) |
| 35 to 64 Years | 0 (0.0%) | 73 (14.1%) |
| 65 to 74 Years | 0 (0.0%) | 10 (4.1%) |
| 75 Years and over | 26 (21.7%) | 27 (38.0%) |
Disability Class by Sex by Age in Mission Canyon
Disability Class: Hearing Difficulty
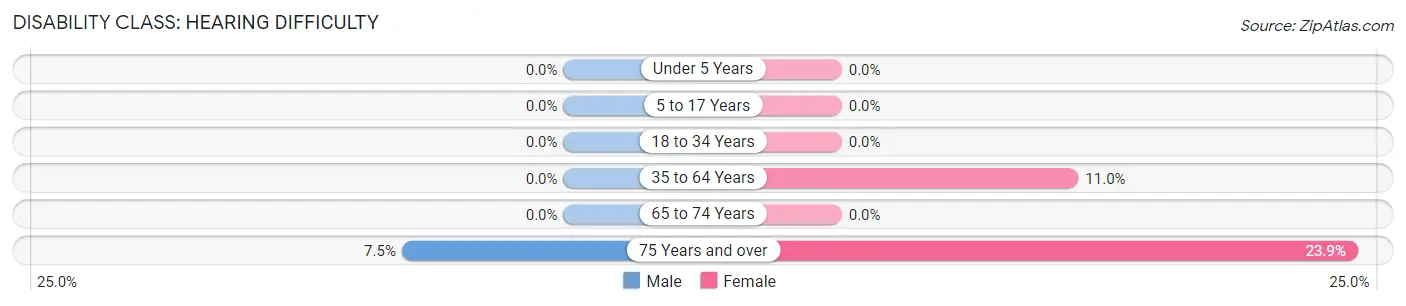
| Age Bracket | Male | Female |
| Under 5 Years | 0 (0.0%) | 0 (0.0%) |
| 5 to 17 Years | 0 (0.0%) | 0 (0.0%) |
| 18 to 34 Years | 0 (0.0%) | 0 (0.0%) |
| 35 to 64 Years | 0 (0.0%) | 57 (11.0%) |
| 65 to 74 Years | 0 (0.0%) | 0 (0.0%) |
| 75 Years and over | 9 (7.5%) | 17 (23.9%) |
Disability Class: Vision Difficulty
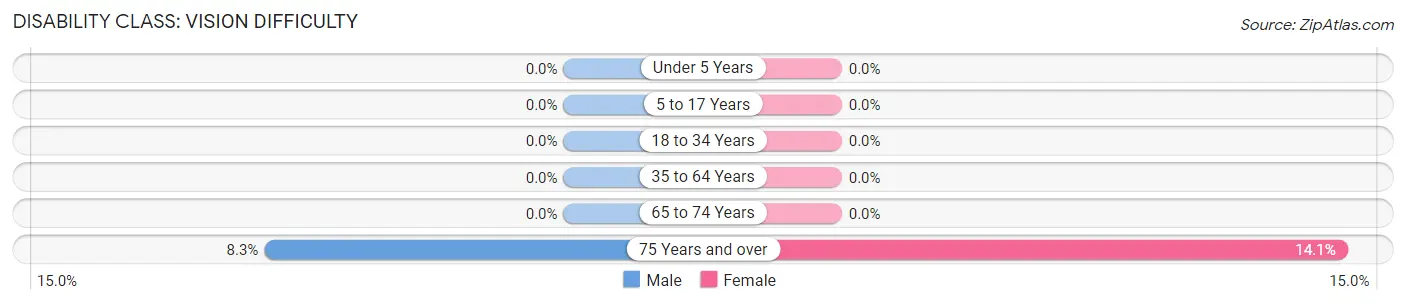
| Age Bracket | Male | Female |
| Under 5 Years | 0 (0.0%) | 0 (0.0%) |
| 5 to 17 Years | 0 (0.0%) | 0 (0.0%) |
| 18 to 34 Years | 0 (0.0%) | 0 (0.0%) |
| 35 to 64 Years | 0 (0.0%) | 0 (0.0%) |
| 65 to 74 Years | 0 (0.0%) | 0 (0.0%) |
| 75 Years and over | 10 (8.3%) | 10 (14.1%) |
Disability Class: Cognitive Difficulty

| Age Bracket | Male | Female |
| 5 to 17 Years | 0 (0.0%) | 0 (0.0%) |
| 18 to 34 Years | 0 (0.0%) | 0 (0.0%) |
| 35 to 64 Years | 0 (0.0%) | 0 (0.0%) |
| 65 to 74 Years | 0 (0.0%) | 0 (0.0%) |
| 75 Years and over | 10 (8.3%) | 9 (12.7%) |
Disability Class: Ambulatory Difficulty
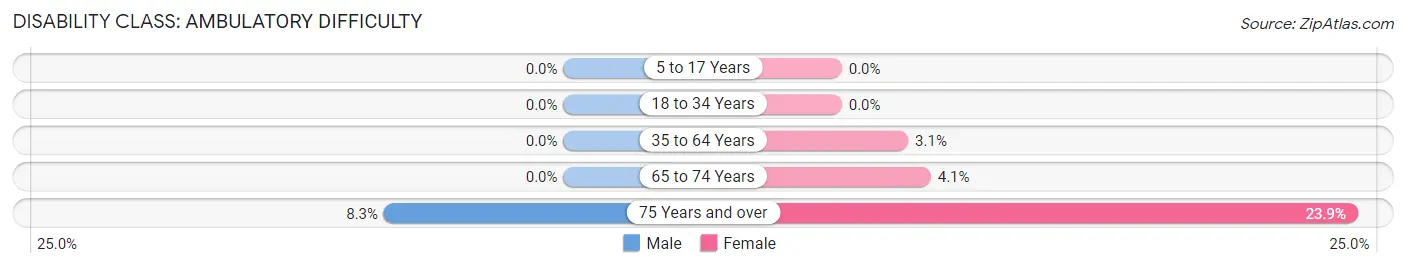
| Age Bracket | Male | Female |
| 5 to 17 Years | 0 (0.0%) | 0 (0.0%) |
| 18 to 34 Years | 0 (0.0%) | 0 (0.0%) |
| 35 to 64 Years | 0 (0.0%) | 16 (3.1%) |
| 65 to 74 Years | 0 (0.0%) | 10 (4.1%) |
| 75 Years and over | 10 (8.3%) | 17 (23.9%) |
Disability Class: Self-Care Difficulty
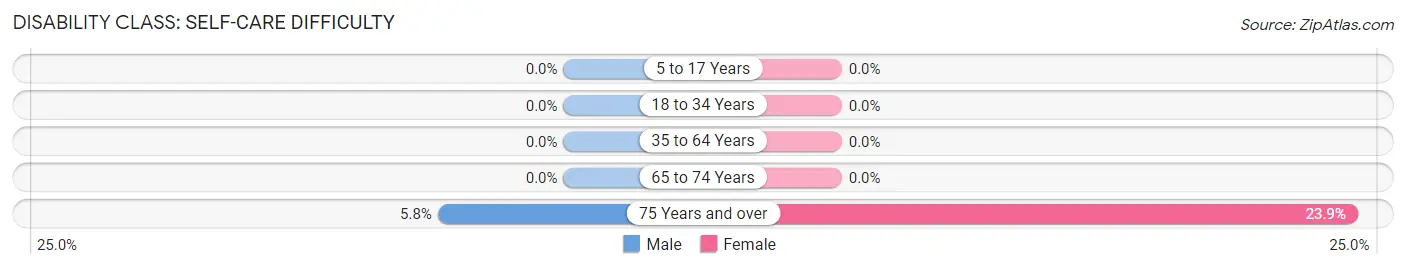
| Age Bracket | Male | Female |
| 5 to 17 Years | 0 (0.0%) | 0 (0.0%) |
| 18 to 34 Years | 0 (0.0%) | 0 (0.0%) |
| 35 to 64 Years | 0 (0.0%) | 0 (0.0%) |
| 65 to 74 Years | 0 (0.0%) | 0 (0.0%) |
| 75 Years and over | 7 (5.8%) | 17 (23.9%) |
Technology Access in Mission Canyon
Computing Device Access in Mission Canyon
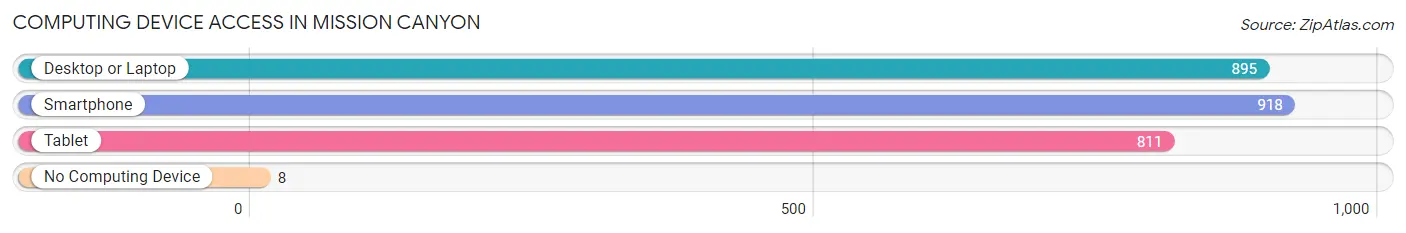
| Device Type | # Households | % Households |
| Desktop or Laptop | 895 | 95.6% |
| Smartphone | 918 | 98.1% |
| Tablet | 811 | 86.7% |
| No Computing Device | 8 | 0.9% |
| Total | 936 | 100.0% |
Internet Access in Mission Canyon
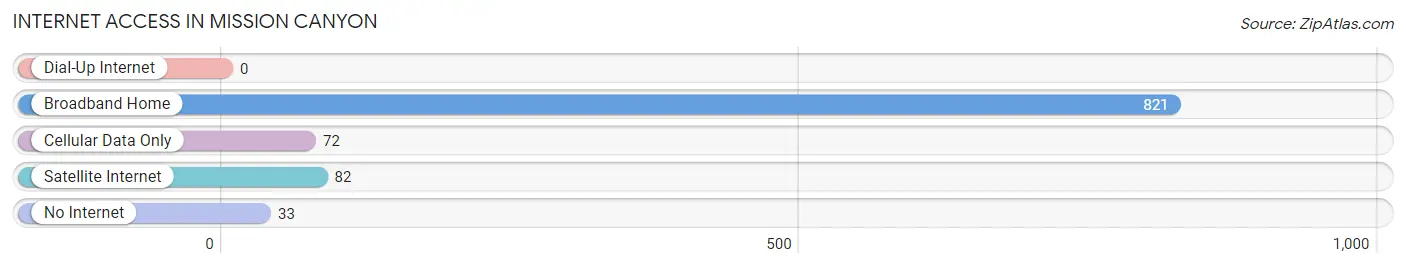
| Internet Type | # Households | % Households |
| Dial-Up Internet | 0 | 0.0% |
| Broadband Home | 821 | 87.7% |
| Cellular Data Only | 72 | 7.7% |
| Satellite Internet | 82 | 8.8% |
| No Internet | 33 | 3.5% |
| Total | 936 | 100.0% |
Mission Canyon Summary
History
Mission Canyon is a small unincorporated community located in Santa Barbara County, California. It is situated in the foothills of the Santa Ynez Mountains, just north of the city of Santa Barbara. The area was originally inhabited by the Chumash people, who lived in the area for thousands of years before the arrival of Europeans. The first Europeans to explore the area were Spanish missionaries, who established the nearby Mission Santa Barbara in 1786. The canyon was named after the mission, and the area was used for grazing and farming by the mission’s residents.
In the late 19th century, the area was developed as a residential community. The first homes were built in the 1880s, and the area quickly grew in popularity. By the early 20th century, the canyon was home to a number of wealthy families, including the prominent Stearns family. The Stearns family built a large estate in the canyon, which is now a popular tourist attraction.
Geography
Mission Canyon is located in the foothills of the Santa Ynez Mountains, just north of the city of Santa Barbara. The canyon is approximately two miles long and one mile wide, and is bordered by the Santa Ynez River to the east and the Santa Barbara Channel to the west. The area is characterized by rolling hills, oak woodlands, and chaparral vegetation. The climate is Mediterranean, with mild temperatures and low precipitation.
Economy
The economy of Mission Canyon is largely based on tourism. The area is home to a number of popular attractions, including the Stearns family estate, the Santa Barbara Mission, and the Santa Barbara Botanic Garden. The canyon is also home to a number of restaurants, shops, and galleries. In addition, the area is popular with hikers and mountain bikers, and is home to a number of trails and parks.
Demographics
As of the 2010 census, the population of Mission Canyon was 1,845. The population is predominantly white (83.3%), with smaller percentages of Hispanic (7.2%), Asian (3.7%), and African American (2.2%) residents. The median household income is $87,917, and the median home value is $1,072,000. The area is largely residential, with a small number of businesses and services.
Common Questions
What is Per Capita Income in Mission Canyon?
Per Capita income in Mission Canyon is $103,913.
What is the Median Family Income in Mission Canyon?
Median Family Income in Mission Canyon is $197,031.
What is the Median Household income in Mission Canyon?
Median Household Income in Mission Canyon is $196,667.
What is Income or Wage Gap in Mission Canyon?
Income or Wage Gap in Mission Canyon is 36.2%.
Women in Mission Canyon earn 63.8 cents for every dollar earned by a man.
What is Inequality or Gini Index in Mission Canyon?
Inequality or Gini Index in Mission Canyon is 0.48.
What is the Total Population of Mission Canyon?
Total Population of Mission Canyon is 2,500.
What is the Total Male Population of Mission Canyon?
Total Male Population of Mission Canyon is 1,077.
What is the Total Female Population of Mission Canyon?
Total Female Population of Mission Canyon is 1,423.
What is the Ratio of Males per 100 Females in Mission Canyon?
There are 75.69 Males per 100 Females in Mission Canyon.
What is the Ratio of Females per 100 Males in Mission Canyon?
There are 132.13 Females per 100 Males in Mission Canyon.
What is the Median Population Age in Mission Canyon?
Median Population Age in Mission Canyon is 48.0 Years.
What is the Average Family Size in Mission Canyon
Average Family Size in Mission Canyon is 3.1 People.
What is the Average Household Size in Mission Canyon
Average Household Size in Mission Canyon is 2.7 People.
How Large is the Labor Force in Mission Canyon?
There are 1,364 People in the Labor Forcein in Mission Canyon.
What is the Percentage of People in the Labor Force in Mission Canyon?
63.7% of People are in the Labor Force in Mission Canyon.
What is the Unemployment Rate in Mission Canyon?
Unemployment Rate in Mission Canyon is 1.5%.