Cities with the Lowest Poverty Level Among Seniors Over the Age of 75 in Ohio
RELATED REPORTS & OPTIONS
Lowest Poverty | Seniors 75+
Ohio
Compare Cities
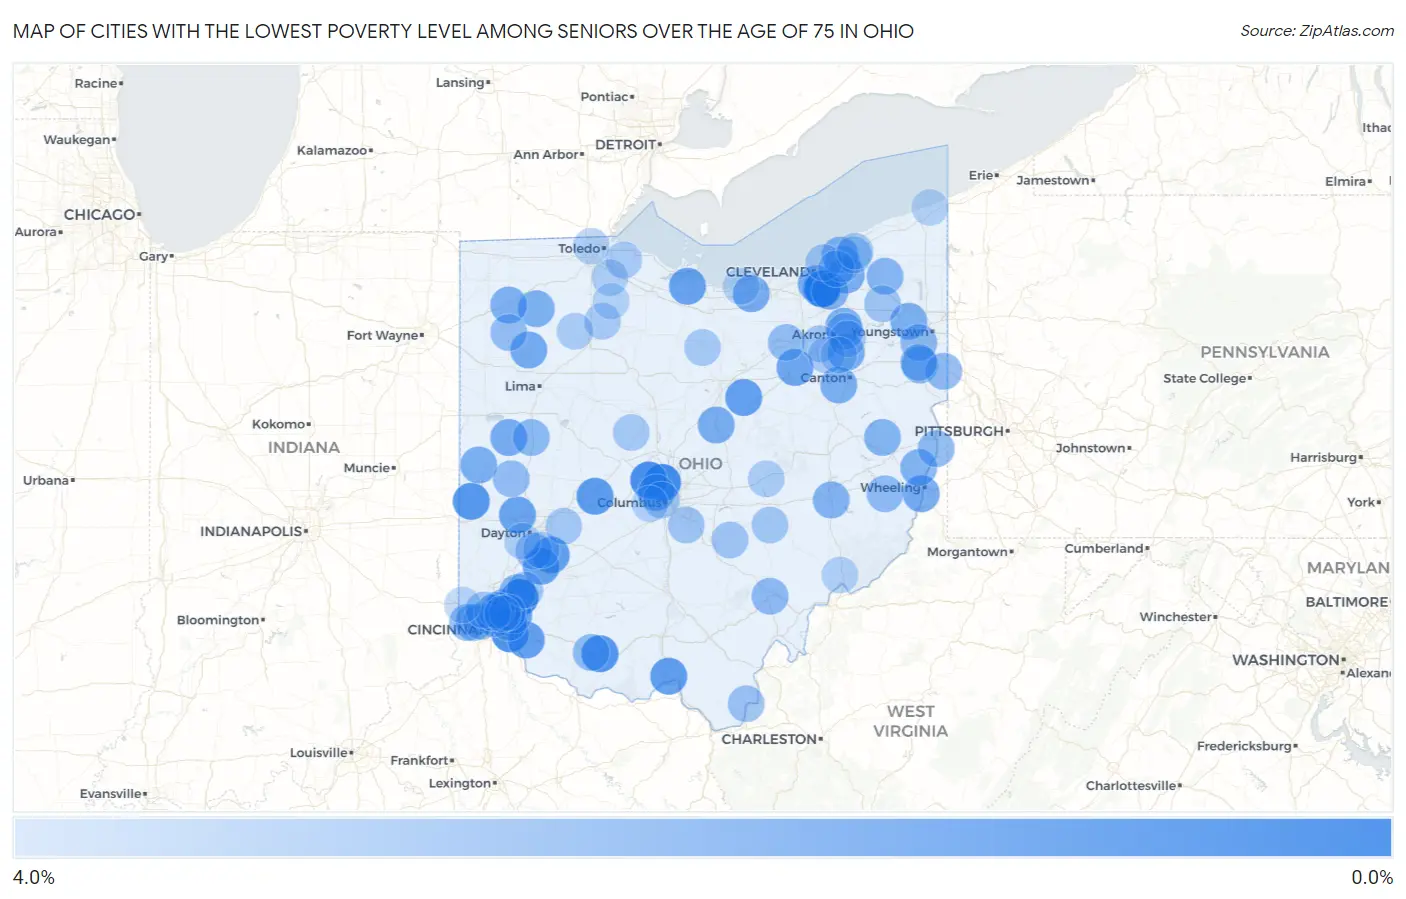
Map of Cities with the Lowest Poverty Level Among Seniors Over the Age of 75 in Ohio
4.0%
0.0%
Cities with the Lowest Poverty Level Among Seniors Over the Age of 75 in Ohio
| City | Senior Poverty | vs State | vs National | |
| 1. | Independence | 0.19% | 9.7%(-9.55)#1 | 11.1%(-10.9)#12 |
| 2. | Landen | 0.35% | 9.7%(-9.39)#2 | 11.1%(-10.7)#34 |
| 3. | Worthington | 0.48% | 9.7%(-9.26)#3 | 11.1%(-10.6)#54 |
| 4. | Dublin | 0.73% | 9.7%(-9.01)#4 | 11.1%(-10.3)#91 |
| 5. | Fruit Hill | 0.80% | 9.7%(-8.94)#5 | 11.1%(-10.3)#108 |
| 6. | Madeira | 1.1% | 9.7%(-8.69)#6 | 11.1%(-10.0)#148 |
| 7. | Seaman | 1.1% | 9.7%(-8.66)#7 | 11.1%(-9.98)#154 |
| 8. | New Madison | 1.1% | 9.7%(-8.62)#8 | 11.1%(-9.94)#167 |
| 9. | Catawba | 1.3% | 9.7%(-8.41)#9 | 11.1%(-9.73)#233 |
| 10. | Rosemount | 1.4% | 9.7%(-8.38)#10 | 11.1%(-9.70)#241 |
| 11. | Spring Valley | 1.4% | 9.7%(-8.34)#11 | 11.1%(-9.66)#261 |
| 12. | Reading | 1.5% | 9.7%(-8.28)#12 | 11.1%(-9.60)#279 |
| 13. | Amelia | 1.5% | 9.7%(-8.27)#13 | 11.1%(-9.59)#285 |
| 14. | Perrysville | 1.5% | 9.7%(-8.25)#14 | 11.1%(-9.57)#292 |
| 15. | Waynesville | 1.6% | 9.7%(-8.16)#15 | 11.1%(-9.48)#333 |
| 16. | Castalia | 1.6% | 9.7%(-8.13)#16 | 11.1%(-9.45)#344 |
| 17. | Clayton | 1.7% | 9.7%(-8.09)#17 | 11.1%(-9.41)#364 |
| 18. | The Village Of Indian Hill | 1.8% | 9.7%(-7.92)#18 | 11.1%(-9.24)#432 |
| 19. | Smithville | 1.8% | 9.7%(-7.91)#19 | 11.1%(-9.23)#439 |
| 20. | Evendale | 1.9% | 9.7%(-7.88)#20 | 11.1%(-9.21)#455 |
| 21. | Kalida | 2.0% | 9.7%(-7.77)#21 | 11.1%(-9.09)#509 |
| 22. | Bellaire | 2.0% | 9.7%(-7.72)#22 | 11.1%(-9.04)#537 |
| 23. | Uniontown | 2.0% | 9.7%(-7.70)#23 | 11.1%(-9.02)#555 |
| 24. | South Amherst | 2.1% | 9.7%(-7.69)#24 | 11.1%(-9.01)#558 |
| 25. | Minster | 2.1% | 9.7%(-7.67)#25 | 11.1%(-8.99)#571 |
| 26. | Fredericktown | 2.1% | 9.7%(-7.61)#26 | 11.1%(-8.93)#609 |
| 27. | Hunting Valley | 2.2% | 9.7%(-7.59)#27 | 11.1%(-8.92)#617 |
| 28. | Brooklyn Heights | 2.2% | 9.7%(-7.59)#28 | 11.1%(-8.91)#624 |
| 29. | Richville | 2.2% | 9.7%(-7.57)#29 | 11.1%(-8.89)#632 |
| 30. | Ansonia | 2.2% | 9.7%(-7.57)#30 | 11.1%(-8.89)#638 |
| 31. | Valley View | 2.2% | 9.7%(-7.53)#31 | 11.1%(-8.85)#664 |
| 32. | Holgate | 2.2% | 9.7%(-7.51)#32 | 11.1%(-8.83)#681 |
| 33. | Lordstown | 2.3% | 9.7%(-7.49)#33 | 11.1%(-8.81)#689 |
| 34. | Upper Arlington | 2.3% | 9.7%(-7.47)#34 | 11.1%(-8.79)#710 |
| 35. | Defiance | 2.3% | 9.7%(-7.45)#35 | 11.1%(-8.77)#719 |
| 36. | Munroe Falls | 2.3% | 9.7%(-7.43)#36 | 11.1%(-8.75)#729 |
| 37. | Walton Hills | 2.4% | 9.7%(-7.38)#37 | 11.1%(-8.70)#757 |
| 38. | Dillonvale | 2.4% | 9.7%(-7.34)#38 | 11.1%(-8.66)#785 |
| 39. | Byesville | 2.4% | 9.7%(-7.31)#39 | 11.1%(-8.63)#802 |
| 40. | Wickliffe | 2.5% | 9.7%(-7.27)#40 | 11.1%(-8.59)#834 |
| 41. | Scio | 2.5% | 9.7%(-7.25)#41 | 11.1%(-8.57)#862 |
| 42. | Mason | 2.5% | 9.7%(-7.21)#42 | 11.1%(-8.53)#884 |
| 43. | Middlefield | 2.6% | 9.7%(-7.17)#43 | 11.1%(-8.49)#910 |
| 44. | Leetonia | 2.6% | 9.7%(-7.11)#44 | 11.1%(-8.44)#952 |
| 45. | Anna | 2.7% | 9.7%(-7.04)#45 | 11.1%(-8.36)#996 |
| 46. | Winchester | 2.7% | 9.7%(-7.04)#46 | 11.1%(-8.36)#997 |
| 47. | Tallmadge | 2.7% | 9.7%(-7.04)#47 | 11.1%(-8.36)#1,007 |
| 48. | Mingo Junction | 2.7% | 9.7%(-7.03)#48 | 11.1%(-8.35)#1,015 |
| 49. | Mack | 2.7% | 9.7%(-7.03)#49 | 11.1%(-8.35)#1,016 |
| 50. | Canfield | 2.7% | 9.7%(-7.03)#50 | 11.1%(-8.35)#1,019 |
| 51. | East Palestine | 2.7% | 9.7%(-7.01)#51 | 11.1%(-8.34)#1,035 |
| 52. | Athens | 2.8% | 9.7%(-6.99)#52 | 11.1%(-8.31)#1,052 |
| 53. | Bethesda | 2.8% | 9.7%(-6.97)#53 | 11.1%(-8.29)#1,060 |
| 54. | Washingtonville | 2.8% | 9.7%(-6.93)#54 | 11.1%(-8.25)#1,103 |
| 55. | North Bend | 2.8% | 9.7%(-6.92)#55 | 11.1%(-8.24)#1,113 |
| 56. | Westfield Center | 2.8% | 9.7%(-6.90)#56 | 11.1%(-8.22)#1,118 |
| 57. | Covington | 2.9% | 9.7%(-6.80)#57 | 11.1%(-8.13)#1,183 |
| 58. | Oakwood | 3.0% | 9.7%(-6.79)#58 | 11.1%(-8.11)#1,208 |
| 59. | St Bernard | 3.0% | 9.7%(-6.75)#59 | 11.1%(-8.07)#1,241 |
| 60. | Crown City | 3.0% | 9.7%(-6.72)#60 | 11.1%(-8.04)#1,269 |
| 61. | Centerville | 3.0% | 9.7%(-6.70)#61 | 11.1%(-8.03)#1,277 |
| 62. | Cheviot | 3.1% | 9.7%(-6.68)#62 | 11.1%(-8.00)#1,298 |
| 63. | Groesbeck | 3.1% | 9.7%(-6.61)#63 | 11.1%(-7.94)#1,358 |
| 64. | Bremen | 3.2% | 9.7%(-6.52)#64 | 11.1%(-7.84)#1,426 |
| 65. | Garrettsville | 3.2% | 9.7%(-6.50)#65 | 11.1%(-7.82)#1,454 |
| 66. | Mayfield | 3.2% | 9.7%(-6.50)#66 | 11.1%(-7.82)#1,458 |
| 67. | Lithopolis | 3.3% | 9.7%(-6.49)#67 | 11.1%(-7.81)#1,463 |
| 68. | South Lebanon | 3.3% | 9.7%(-6.43)#68 | 11.1%(-7.76)#1,506 |
| 69. | Grandview Heights | 3.3% | 9.7%(-6.42)#69 | 11.1%(-7.74)#1,514 |
| 70. | Mariemont | 3.3% | 9.7%(-6.41)#70 | 11.1%(-7.73)#1,516 |
| 71. | Norton | 3.3% | 9.7%(-6.40)#71 | 11.1%(-7.72)#1,542 |
| 72. | Roseville | 3.4% | 9.7%(-6.38)#72 | 11.1%(-7.71)#1,558 |
| 73. | Kirtland | 3.4% | 9.7%(-6.37)#73 | 11.1%(-7.69)#1,569 |
| 74. | Bratenahl | 3.4% | 9.7%(-6.31)#74 | 11.1%(-7.64)#1,620 |
| 75. | Lyndhurst | 3.4% | 9.7%(-6.30)#75 | 11.1%(-7.62)#1,623 |
| 76. | Bellbrook | 3.4% | 9.7%(-6.30)#76 | 11.1%(-7.62)#1,625 |
| 77. | Yellow Springs | 3.5% | 9.7%(-6.29)#77 | 11.1%(-7.61)#1,649 |
| 78. | Richwood | 3.5% | 9.7%(-6.27)#78 | 11.1%(-7.59)#1,658 |
| 79. | Plymouth | 3.5% | 9.7%(-6.27)#79 | 11.1%(-7.59)#1,662 |
| 80. | Wyoming | 3.6% | 9.7%(-6.18)#80 | 11.1%(-7.51)#1,723 |
| 81. | Mogadore | 3.6% | 9.7%(-6.17)#81 | 11.1%(-7.50)#1,736 |
| 82. | Rossmoyne | 3.6% | 9.7%(-6.17)#82 | 11.1%(-7.50)#1,737 |
| 83. | Bloomdale | 3.6% | 9.7%(-6.17)#83 | 11.1%(-7.50)#1,747 |
| 84. | Clay Center | 3.6% | 9.7%(-6.17)#84 | 11.1%(-7.50)#1,760 |
| 85. | New Franklin | 3.6% | 9.7%(-6.17)#85 | 11.1%(-7.49)#1,763 |
| 86. | Mccomb | 3.6% | 9.7%(-6.15)#86 | 11.1%(-7.47)#1,776 |
| 87. | Frazeysburg | 3.6% | 9.7%(-6.13)#87 | 11.1%(-7.45)#1,790 |
| 88. | Kirtland Hills | 3.6% | 9.7%(-6.11)#88 | 11.1%(-7.43)#1,809 |
| 89. | Moraine | 3.7% | 9.7%(-6.08)#89 | 11.1%(-7.40)#1,831 |
| 90. | Finneytown | 3.7% | 9.7%(-6.06)#90 | 11.1%(-7.38)#1,853 |
| 91. | Luckey | 3.7% | 9.7%(-6.04)#91 | 11.1%(-7.36)#1,869 |
| 92. | Amberley | 3.7% | 9.7%(-6.02)#92 | 11.1%(-7.34)#1,892 |
| 93. | Devola | 3.8% | 9.7%(-5.98)#93 | 11.1%(-7.31)#1,925 |
| 94. | Ottawa Hills | 3.8% | 9.7%(-5.96)#94 | 11.1%(-7.28)#1,957 |
| 95. | Lincoln Village | 3.8% | 9.7%(-5.94)#95 | 11.1%(-7.26)#1,979 |
| 96. | Green | 3.8% | 9.7%(-5.91)#96 | 11.1%(-7.24)#1,995 |
| 97. | Vermilion | 3.8% | 9.7%(-5.91)#97 | 11.1%(-7.23)#2,002 |
| 98. | Wayne | 3.8% | 9.7%(-5.90)#98 | 11.1%(-7.22)#2,008 |
| 99. | North Kingsville | 3.9% | 9.7%(-5.88)#99 | 11.1%(-7.20)#2,042 |
| 100. | Harrison | 3.9% | 9.7%(-5.82)#100 | 11.1%(-7.14)#2,106 |
Common Questions
What are the Top 10 Cities with the Lowest Poverty Level Among Seniors Over the Age of 75 in Ohio?
Top 10 Cities with the Lowest Poverty Level Among Seniors Over the Age of 75 in Ohio are:
#1
0.19%
#2
0.35%
#3
0.48%
#4
0.73%
#5
0.80%
#6
1.1%
#7
1.1%
#8
1.1%
#9
1.3%
#10
1.4%
What city has the Lowest Poverty Level Among Seniors Over the Age of 75 in Ohio?
Independence has the Lowest Poverty Level Among Seniors Over the Age of 75 in Ohio with 0.19%.
What is the Poverty Level Among Seniors Over the Age of 75 in the State of Ohio?
Poverty Level Among Seniors Over the Age of 75 in Ohio is 9.7%.
What is the Poverty Level Among Seniors Over the Age of 75 in the United States?
Poverty Level Among Seniors Over the Age of 75 in the United States is 11.1%.