Indian Wells, CA Map & Demographics
Indian Wells Map
Indian Wells Overview
$127,143
PER CAPITA INCOME
$197,976
AVG FAMILY INCOME
$132,479
AVG HOUSEHOLD INCOME
32.0%
WAGE / INCOME GAP [ % ]
68.0¢/ $1
WAGE / INCOME GAP [ $ ]
0.59
INEQUALITY / GINI INDEX
4,832
TOTAL POPULATION
2,345
MALE POPULATION
2,487
FEMALE POPULATION
94.29
MALES / 100 FEMALES
106.06
FEMALES / 100 MALES
68.3
MEDIAN AGE
2.3
AVG FAMILY SIZE
1.9
AVG HOUSEHOLD SIZE
1,748
LABOR FORCE [ PEOPLE ]
38.3%
PERCENT IN LABOR FORCE
6.4%
UNEMPLOYMENT RATE
Indian Wells Zip Codes
Indian Wells Area Codes
Income in Indian Wells
Income Overview in Indian Wells
Per Capita Income in Indian Wells is $127,143, while median incomes of families and households are $197,976 and $132,479 respectively.
| Characteristic | Number | Measure |
| Per Capita Income | 4,832 | $127,143 |
| Median Family Income | 1,498 | $197,976 |
| Mean Family Income | 1,498 | $319,512 |
| Median Household Income | 2,581 | $132,479 |
| Mean Household Income | 2,581 | $239,525 |
| Income Deficit | 1,498 | $0 |
| Wage / Income Gap (%) | 4,832 | 32.01% |
| Wage / Income Gap ($) | 4,832 | 67.99¢ per $1 |
| Gini / Inequality Index | 4,832 | 0.59 |
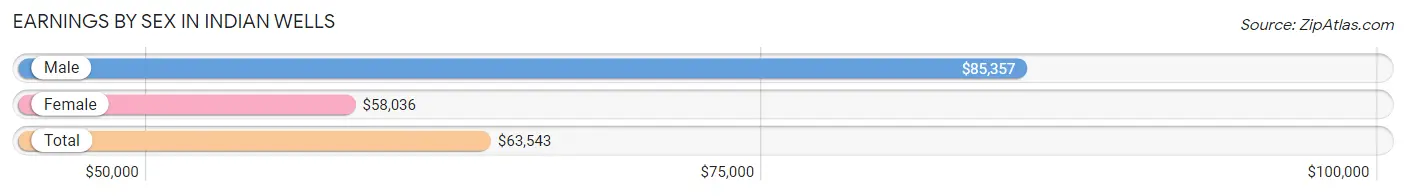
Earnings by Sex in Indian Wells
Average Earnings in Indian Wells are $63,543, $85,357 for men and $58,036 for women, a difference of 32.0%.
| Sex | Number | Average Earnings |
| Male | 1,124 (57.0%) | $85,357 |
| Female | 849 (43.0%) | $58,036 |
| Total | 1,973 (100.0%) | $63,543 |
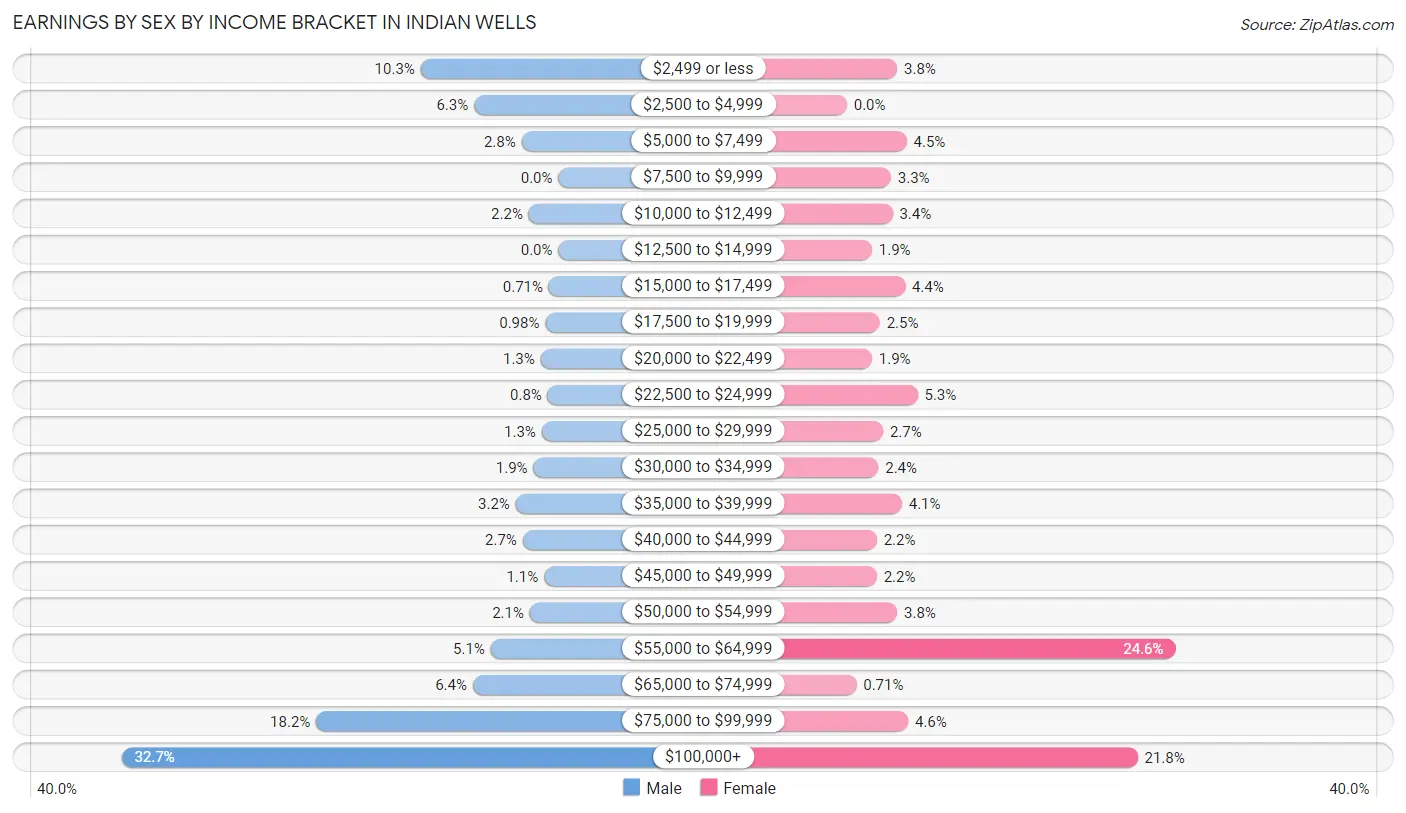
Earnings by Sex by Income Bracket in Indian Wells
The most common earnings brackets in Indian Wells are $100,000+ for men (368 | 32.7%) and $55,000 to $64,999 for women (209 | 24.6%).
| Income | Male | Female |
| $2,499 or less | 116 (10.3%) | 32 (3.8%) |
| $2,500 to $4,999 | 71 (6.3%) | 0 (0.0%) |
| $5,000 to $7,499 | 31 (2.8%) | 38 (4.5%) |
| $7,500 to $9,999 | 0 (0.0%) | 28 (3.3%) |
| $10,000 to $12,499 | 25 (2.2%) | 29 (3.4%) |
| $12,500 to $14,999 | 0 (0.0%) | 16 (1.9%) |
| $15,000 to $17,499 | 8 (0.7%) | 37 (4.4%) |
| $17,500 to $19,999 | 11 (1.0%) | 21 (2.5%) |
| $20,000 to $22,499 | 15 (1.3%) | 16 (1.9%) |
| $22,500 to $24,999 | 9 (0.8%) | 45 (5.3%) |
| $25,000 to $29,999 | 14 (1.3%) | 23 (2.7%) |
| $30,000 to $34,999 | 21 (1.9%) | 20 (2.4%) |
| $35,000 to $39,999 | 36 (3.2%) | 35 (4.1%) |
| $40,000 to $44,999 | 30 (2.7%) | 19 (2.2%) |
| $45,000 to $49,999 | 12 (1.1%) | 19 (2.2%) |
| $50,000 to $54,999 | 24 (2.1%) | 32 (3.8%) |
| $55,000 to $64,999 | 57 (5.1%) | 209 (24.6%) |
| $65,000 to $74,999 | 72 (6.4%) | 6 (0.7%) |
| $75,000 to $99,999 | 204 (18.1%) | 39 (4.6%) |
| $100,000+ | 368 (32.7%) | 185 (21.8%) |
| Total | 1,124 (100.0%) | 849 (100.0%) |
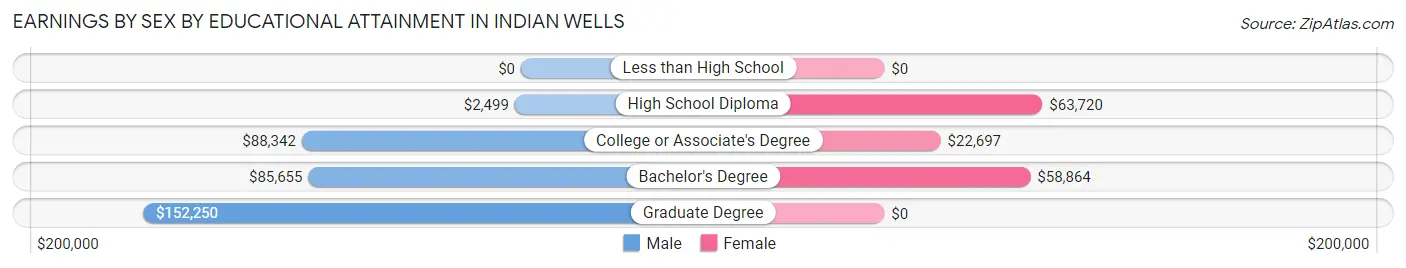
Earnings by Sex by Educational Attainment in Indian Wells
Average earnings in Indian Wells are $87,577 for men and $59,226 for women, a difference of 32.4%. Men with an educational attainment of graduate degree enjoy the highest average annual earnings of $152,250, while those with high school diploma education earn the least with $2,499. Women with an educational attainment of high school diploma earn the most with the average annual earnings of $63,720, while those with college or associate's degree education have the smallest earnings of $22,697.
| Educational Attainment | Male Income | Female Income |
| Less than High School | - | - |
| High School Diploma | $2,499 | $63,720 |
| College or Associate's Degree | $88,342 | $22,697 |
| Bachelor's Degree | $85,655 | $58,864 |
| Graduate Degree | $152,250 | $0 |
| Total | $87,577 | $59,226 |
Family Income in Indian Wells
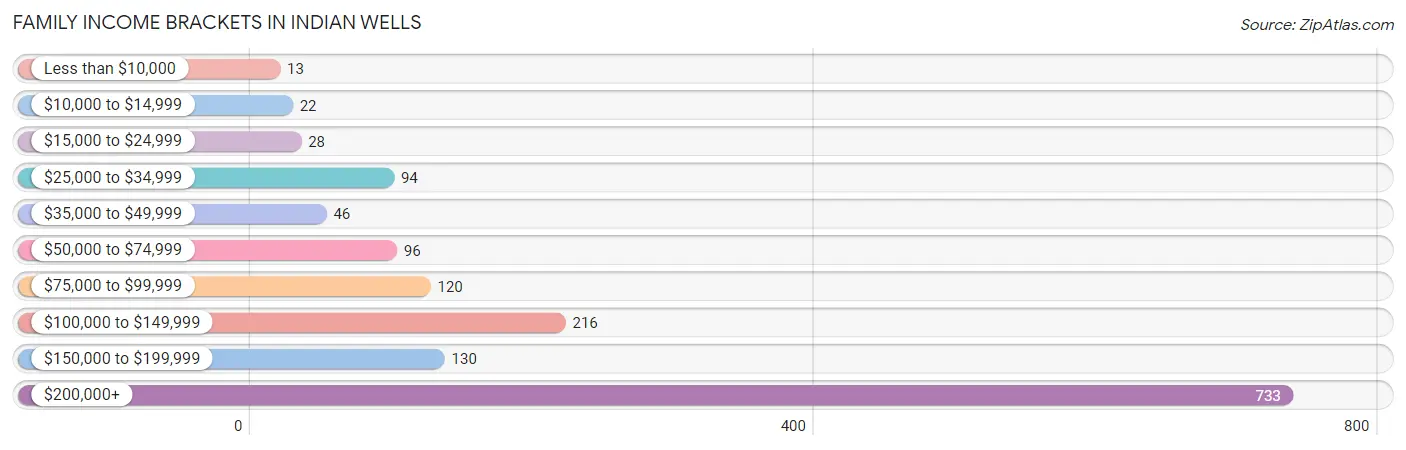
Family Income Brackets in Indian Wells
According to the Indian Wells family income data, there are 733 families falling into the $200,000+ income range, which is the most common income bracket and makes up 48.9% of all families. Conversely, the less than $10,000 income bracket is the least frequent group with only 13 families (0.9%) belonging to this category.
| Income Bracket | # Families | % Families |
| Less than $10,000 | 13 | 0.9% |
| $10,000 to $14,999 | 22 | 1.5% |
| $15,000 to $24,999 | 28 | 1.9% |
| $25,000 to $34,999 | 94 | 6.3% |
| $35,000 to $49,999 | 46 | 3.1% |
| $50,000 to $74,999 | 96 | 6.4% |
| $75,000 to $99,999 | 120 | 8.0% |
| $100,000 to $149,999 | 216 | 14.4% |
| $150,000 to $199,999 | 130 | 8.7% |
| $200,000+ | 733 | 48.9% |
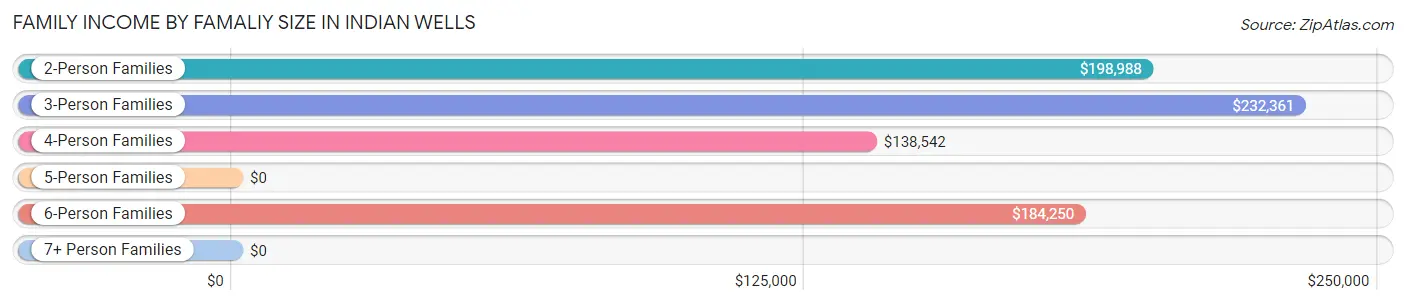
Family Income by Famaliy Size in Indian Wells
3-person families (39 | 2.6%) account for the highest median family income in Indian Wells with $232,361 per family, while 2-person families (1,337 | 89.2%) have the highest median income of $99,494 per family member.
| Income Bracket | # Families | Median Income |
| 2-Person Families | 1,337 (89.2%) | $198,988 |
| 3-Person Families | 39 (2.6%) | $232,361 |
| 4-Person Families | 79 (5.3%) | $138,542 |
| 5-Person Families | 11 (0.7%) | $0 |
| 6-Person Families | 22 (1.5%) | $184,250 |
| 7+ Person Families | 10 (0.7%) | $0 |
| Total | 1,498 (100.0%) | $197,976 |
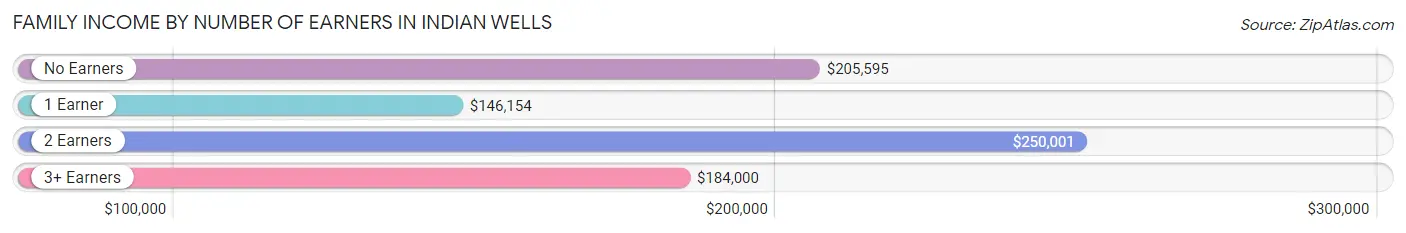
Family Income by Number of Earners in Indian Wells
The median family income in Indian Wells is $197,976, with families comprising 2 earners (348) having the highest median family income of $250,001, while families with 1 earner (474) have the lowest median family income of $146,154, accounting for 23.2% and 31.6% of families, respectively.
| Number of Earners | # Families | Median Income |
| No Earners | 628 (41.9%) | $205,595 |
| 1 Earner | 474 (31.6%) | $146,154 |
| 2 Earners | 348 (23.2%) | $250,001 |
| 3+ Earners | 48 (3.2%) | $184,000 |
| Total | 1,498 (100.0%) | $197,976 |
Household Income in Indian Wells
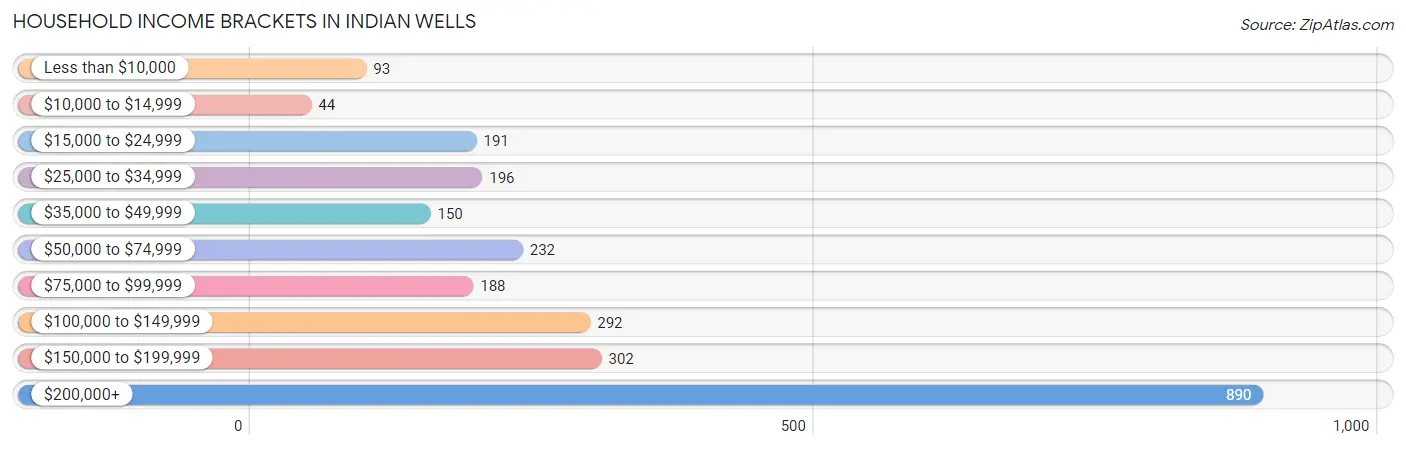
Household Income Brackets in Indian Wells
With 890 households falling in the category, the $200,000+ income range is the most frequent in Indian Wells, accounting for 34.5% of all households. In contrast, only 44 households (1.7%) fall into the $10,000 to $14,999 income bracket, making it the least populous group.
| Income Bracket | # Households | % Households |
| Less than $10,000 | 93 | 3.6% |
| $10,000 to $14,999 | 44 | 1.7% |
| $15,000 to $24,999 | 191 | 7.4% |
| $25,000 to $34,999 | 196 | 7.6% |
| $35,000 to $49,999 | 150 | 5.8% |
| $50,000 to $74,999 | 232 | 9.0% |
| $75,000 to $99,999 | 188 | 7.3% |
| $100,000 to $149,999 | 292 | 11.3% |
| $150,000 to $199,999 | 302 | 11.7% |
| $200,000+ | 890 | 34.5% |
Household Income by Householder Age in Indian Wells
The median household income in Indian Wells is $132,479, with the highest median household income of $151,258 found in the 45 to 64 years age bracket for the primary householder. A total of 681 households (26.4%) fall into this category.
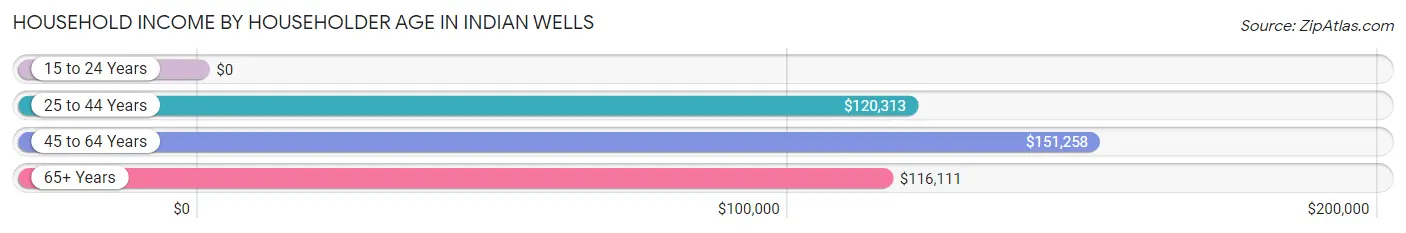
| Income Bracket | # Households | Median Income |
| 15 to 24 Years | 0 (0.0%) | $0 |
| 25 to 44 Years | 88 (3.4%) | $120,313 |
| 45 to 64 Years | 681 (26.4%) | $151,258 |
| 65+ Years | 1,812 (70.2%) | $116,111 |
| Total | 2,581 (100.0%) | $132,479 |
Poverty in Indian Wells
Income Below Poverty by Sex and Age in Indian Wells
With 4.9% poverty level for males and 4.6% for females among the residents of Indian Wells, 18 to 24 year old males and 55 to 64 year old females are the most vulnerable to poverty, with 12 males (44.4%) and 56 females (8.0%) in their respective age groups living below the poverty level.
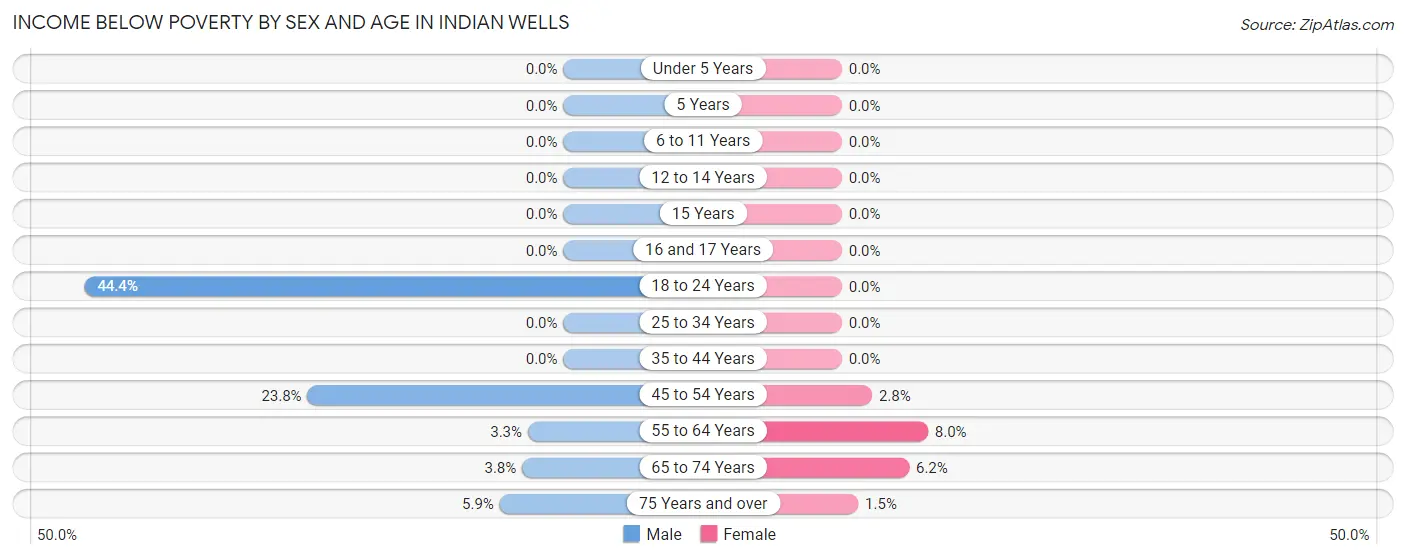
| Age Bracket | Male | Female |
| Under 5 Years | 0 (0.0%) | 0 (0.0%) |
| 5 Years | 0 (0.0%) | 0 (0.0%) |
| 6 to 11 Years | 0 (0.0%) | 0 (0.0%) |
| 12 to 14 Years | 0 (0.0%) | 0 (0.0%) |
| 15 Years | 0 (0.0%) | 0 (0.0%) |
| 16 and 17 Years | 0 (0.0%) | 0 (0.0%) |
| 18 to 24 Years | 12 (44.4%) | 0 (0.0%) |
| 25 to 34 Years | 0 (0.0%) | 0 (0.0%) |
| 35 to 44 Years | 0 (0.0%) | 0 (0.0%) |
| 45 to 54 Years | 19 (23.7%) | 3 (2.8%) |
| 55 to 64 Years | 16 (3.3%) | 56 (8.0%) |
| 65 to 74 Years | 21 (3.8%) | 45 (6.2%) |
| 75 Years and over | 46 (5.9%) | 11 (1.5%) |
| Total | 114 (4.9%) | 115 (4.6%) |
Income Above Poverty by Sex and Age in Indian Wells
According to the poverty statistics in Indian Wells, males aged under 5 years and females aged under 5 years are the age groups that are most secure financially, with 100.0% of males and 100.0% of females in these age groups living above the poverty line.
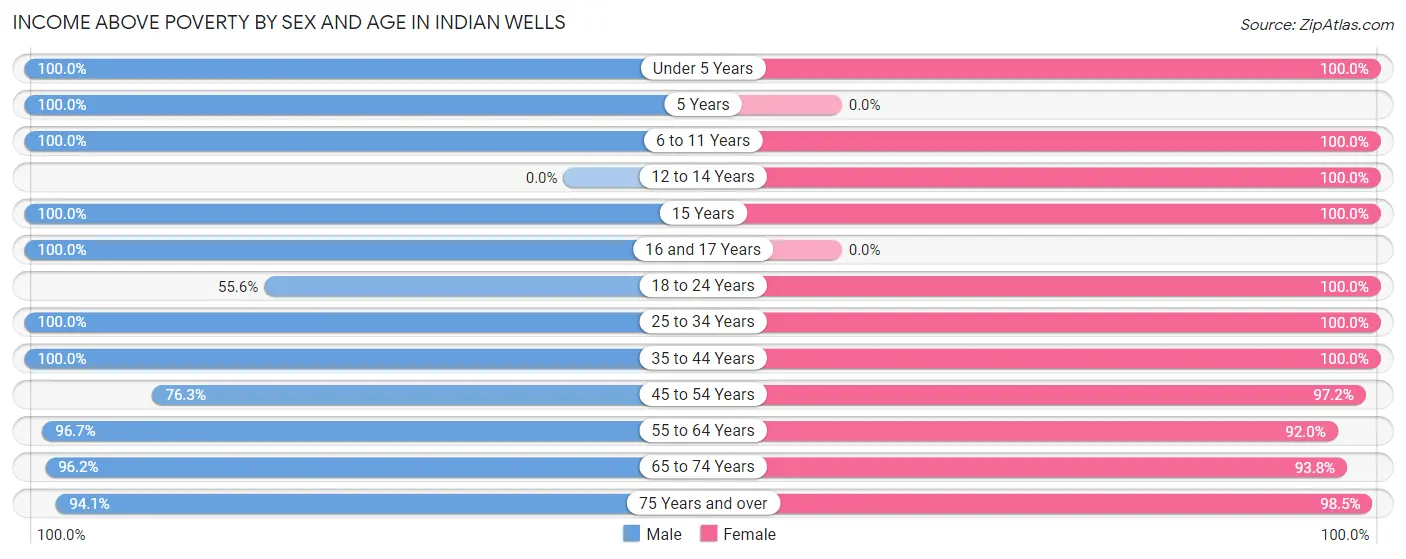
| Age Bracket | Male | Female |
| Under 5 Years | 48 (100.0%) | 32 (100.0%) |
| 5 Years | 7 (100.0%) | 0 (0.0%) |
| 6 to 11 Years | 110 (100.0%) | 10 (100.0%) |
| 12 to 14 Years | 0 (0.0%) | 11 (100.0%) |
| 15 Years | 19 (100.0%) | 30 (100.0%) |
| 16 and 17 Years | 19 (100.0%) | 0 (0.0%) |
| 18 to 24 Years | 15 (55.6%) | 20 (100.0%) |
| 25 to 34 Years | 146 (100.0%) | 69 (100.0%) |
| 35 to 44 Years | 76 (100.0%) | 63 (100.0%) |
| 45 to 54 Years | 61 (76.2%) | 104 (97.2%) |
| 55 to 64 Years | 470 (96.7%) | 645 (92.0%) |
| 65 to 74 Years | 528 (96.2%) | 676 (93.8%) |
| 75 Years and over | 732 (94.1%) | 712 (98.5%) |
| Total | 2,231 (95.1%) | 2,372 (95.4%) |
Income Below Poverty Among Married-Couple Families in Indian Wells
The poverty statistics for married-couple families in Indian Wells show that 2.6% or 35 of the total 1,340 families live below the poverty line. Families with no children have the highest poverty rate of 2.9%, comprising of 35 families. On the other hand, families with 1 or 2 children have the lowest poverty rate of 0.0%, which includes 0 families.
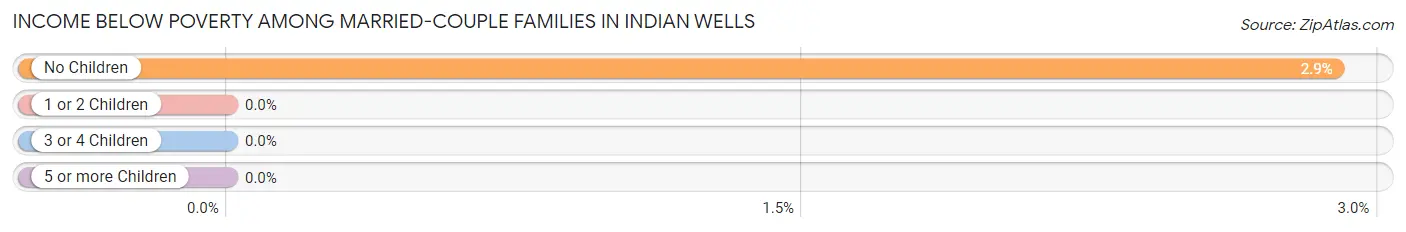
| Children | Above Poverty | Below Poverty |
| No Children | 1,178 (97.1%) | 35 (2.9%) |
| 1 or 2 Children | 100 (100.0%) | 0 (0.0%) |
| 3 or 4 Children | 17 (100.0%) | 0 (0.0%) |
| 5 or more Children | 10 (100.0%) | 0 (0.0%) |
| Total | 1,305 (97.4%) | 35 (2.6%) |
Income Below Poverty Among Single-Parent Households in Indian Wells
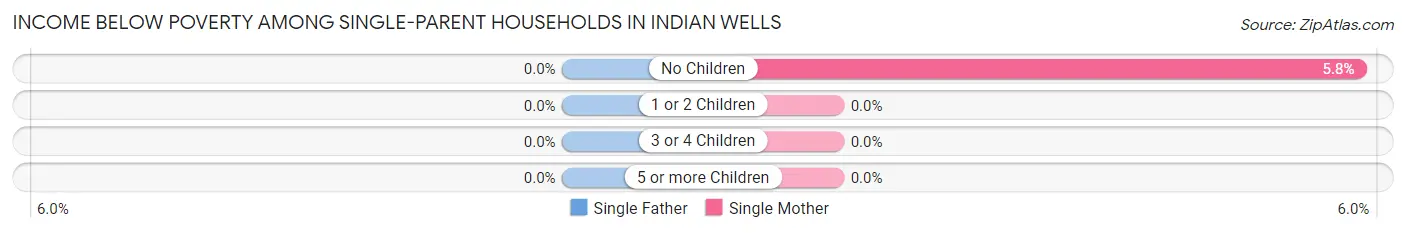
| Children | Single Father | Single Mother |
| No Children | 0 (0.0%) | 9 (5.8%) |
| 1 or 2 Children | 0 (0.0%) | 0 (0.0%) |
| 3 or 4 Children | 0 (0.0%) | 0 (0.0%) |
| 5 or more Children | 0 (0.0%) | 0 (0.0%) |
| Total | 0 (0.0%) | 9 (5.7%) |
Income Below Poverty Among Married-Couple vs Single-Parent Households in Indian Wells
The poverty data for Indian Wells shows that 35 of the married-couple family households (2.6%) and 9 of the single-parent households (5.7%) are living below the poverty level. Within the married-couple family households, those with no children have the highest poverty rate, with 35 households (2.9%) falling below the poverty line. Among the single-parent households, those with no children have the highest poverty rate, with 9 household (5.8%) living below poverty.
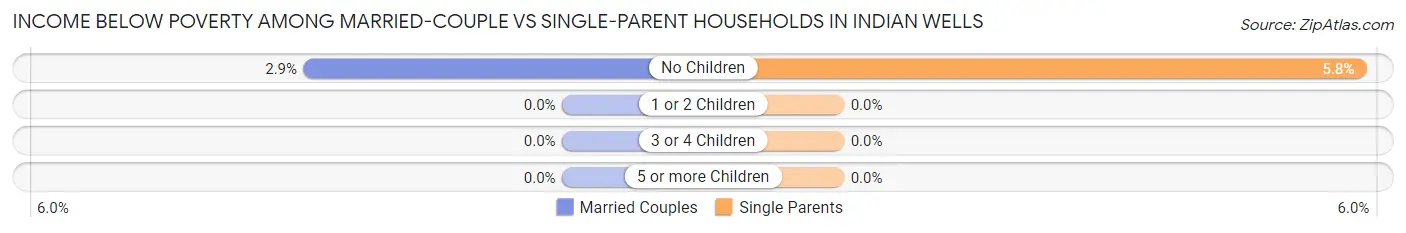
| Children | Married-Couple Families | Single-Parent Households |
| No Children | 35 (2.9%) | 9 (5.8%) |
| 1 or 2 Children | 0 (0.0%) | 0 (0.0%) |
| 3 or 4 Children | 0 (0.0%) | 0 (0.0%) |
| 5 or more Children | 0 (0.0%) | 0 (0.0%) |
| Total | 35 (2.6%) | 9 (5.7%) |
Race in Indian Wells
The most populous races in Indian Wells are White / Caucasian (4,303 | 89.0%), Two or more Races (184 | 3.8%), and Black / African American (169 | 3.5%).
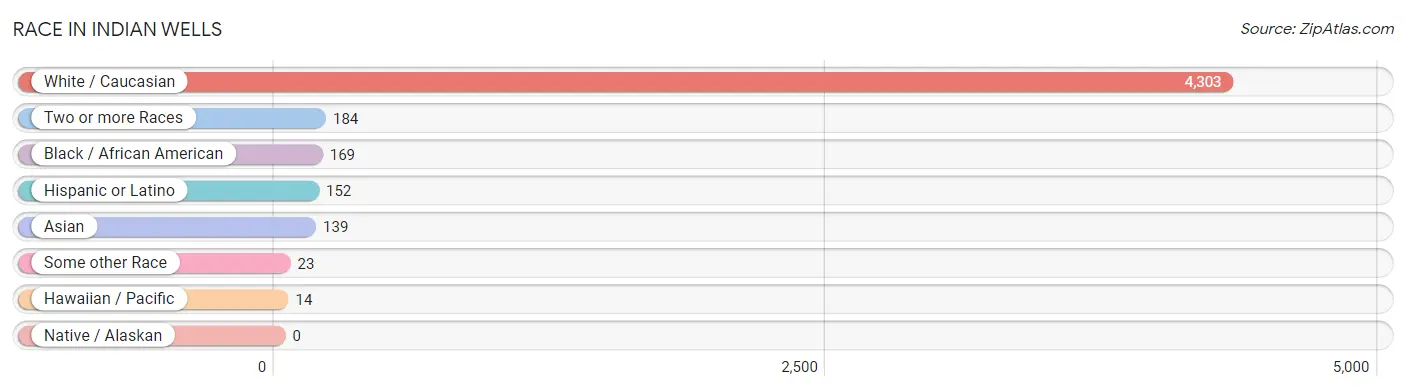
| Race | # Population | % Population |
| Asian | 139 | 2.9% |
| Black / African American | 169 | 3.5% |
| Hawaiian / Pacific | 14 | 0.3% |
| Hispanic or Latino | 152 | 3.2% |
| Native / Alaskan | 0 | 0.0% |
| White / Caucasian | 4,303 | 89.0% |
| Two or more Races | 184 | 3.8% |
| Some other Race | 23 | 0.5% |
| Total | 4,832 | 100.0% |
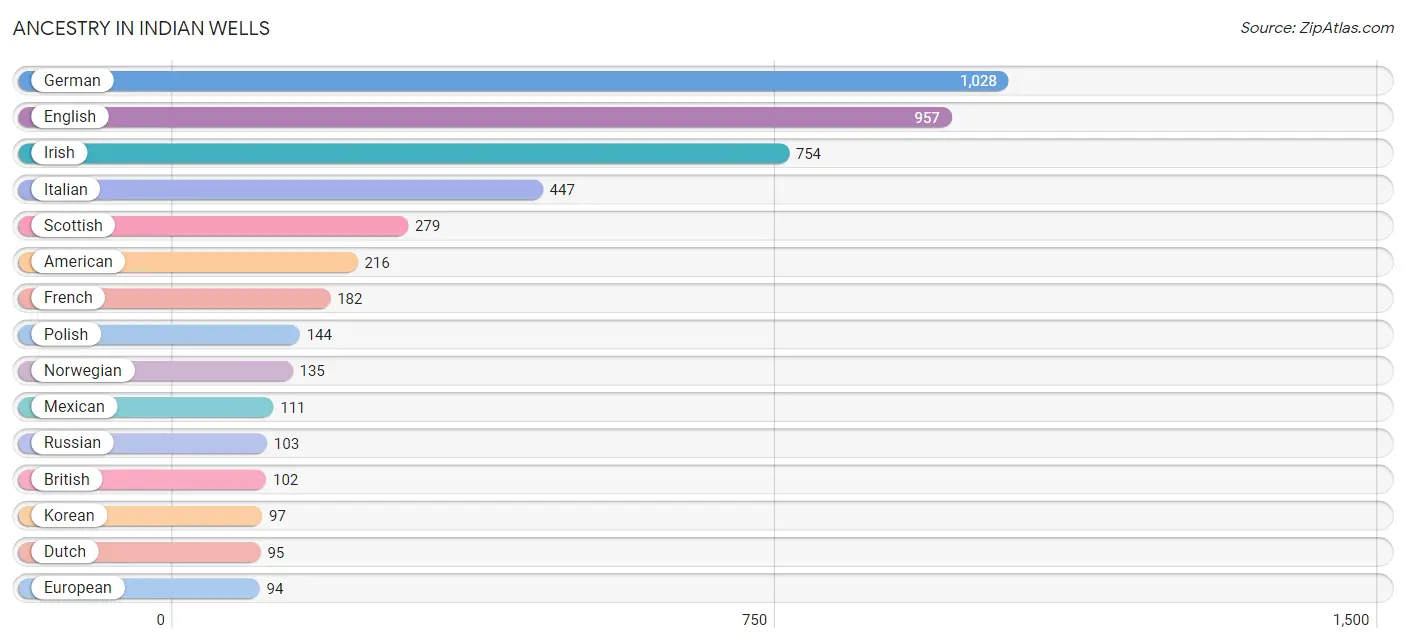
Ancestry in Indian Wells
The most populous ancestries reported in Indian Wells are German (1,028 | 21.3%), English (957 | 19.8%), Irish (754 | 15.6%), Italian (447 | 9.2%), and Scottish (279 | 5.8%), together accounting for 71.7% of all Indian Wells residents.
| Ancestry | # Population | % Population |
| American | 216 | 4.5% |
| Arab | 24 | 0.5% |
| Armenian | 7 | 0.1% |
| Assyrian / Chaldean / Syriac | 21 | 0.4% |
| Austrian | 28 | 0.6% |
| Belgian | 13 | 0.3% |
| Bhutanese | 35 | 0.7% |
| British | 102 | 2.1% |
| Burmese | 26 | 0.5% |
| Canadian | 72 | 1.5% |
| Central American | 16 | 0.3% |
| Costa Rican | 16 | 0.3% |
| Czech | 33 | 0.7% |
| Czechoslovakian | 6 | 0.1% |
| Danish | 29 | 0.6% |
| Dutch | 95 | 2.0% |
| Eastern European | 40 | 0.8% |
| English | 957 | 19.8% |
| European | 94 | 1.9% |
| French | 182 | 3.8% |
| French Canadian | 32 | 0.7% |
| German | 1,028 | 21.3% |
| Greek | 64 | 1.3% |
| Guamanian / Chamorro | 14 | 0.3% |
| Hungarian | 14 | 0.3% |
| Indian (Asian) | 43 | 0.9% |
| Iranian | 14 | 0.3% |
| Irish | 754 | 15.6% |
| Italian | 447 | 9.2% |
| Korean | 97 | 2.0% |
| Lebanese | 9 | 0.2% |
| Lithuanian | 9 | 0.2% |
| Mexican | 111 | 2.3% |
| Nigerian | 7 | 0.1% |
| Northern European | 18 | 0.4% |
| Norwegian | 135 | 2.8% |
| Polish | 144 | 3.0% |
| Romanian | 20 | 0.4% |
| Russian | 103 | 2.1% |
| Scandinavian | 19 | 0.4% |
| Scotch-Irish | 31 | 0.6% |
| Scottish | 279 | 5.8% |
| Serbian | 39 | 0.8% |
| Slovene | 7 | 0.1% |
| Spaniard | 7 | 0.1% |
| Spanish | 18 | 0.4% |
| Subsaharan African | 7 | 0.1% |
| Swedish | 65 | 1.3% |
| Swiss | 16 | 0.3% |
| Syrian | 15 | 0.3% |
| Ukrainian | 34 | 0.7% |
| Welsh | 68 | 1.4% |
| Yugoslavian | 35 | 0.7% | View All 53 Rows |
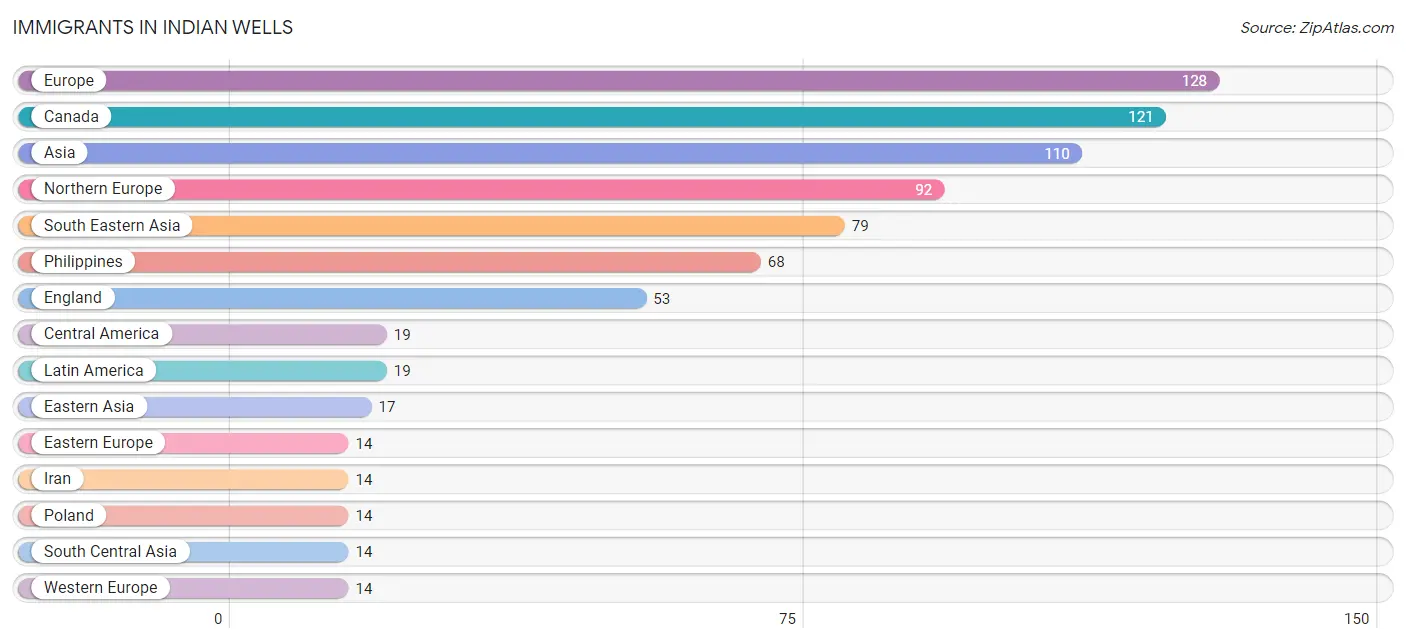
Immigrants in Indian Wells
The most numerous immigrant groups reported in Indian Wells came from Europe (128 | 2.6%), Canada (121 | 2.5%), Asia (110 | 2.3%), Northern Europe (92 | 1.9%), and South Eastern Asia (79 | 1.6%), together accounting for 11.0% of all Indian Wells residents.
| Immigration Origin | # Population | % Population |
| Africa | 5 | 0.1% |
| Asia | 110 | 2.3% |
| Australia | 6 | 0.1% |
| Canada | 121 | 2.5% |
| Central America | 19 | 0.4% |
| China | 11 | 0.2% |
| Costa Rica | 8 | 0.2% |
| Eastern Asia | 17 | 0.4% |
| Eastern Europe | 14 | 0.3% |
| Egypt | 5 | 0.1% |
| England | 53 | 1.1% |
| Europe | 128 | 2.6% |
| France | 7 | 0.1% |
| Germany | 7 | 0.1% |
| Indonesia | 11 | 0.2% |
| Iran | 14 | 0.3% |
| Ireland | 11 | 0.2% |
| Italy | 8 | 0.2% |
| Japan | 6 | 0.1% |
| Latin America | 19 | 0.4% |
| Mexico | 11 | 0.2% |
| Northern Africa | 5 | 0.1% |
| Northern Europe | 92 | 1.9% |
| Oceania | 6 | 0.1% |
| Philippines | 68 | 1.4% |
| Poland | 14 | 0.3% |
| South Central Asia | 14 | 0.3% |
| South Eastern Asia | 79 | 1.6% |
| Southern Europe | 8 | 0.2% |
| Western Europe | 14 | 0.3% | View All 30 Rows |
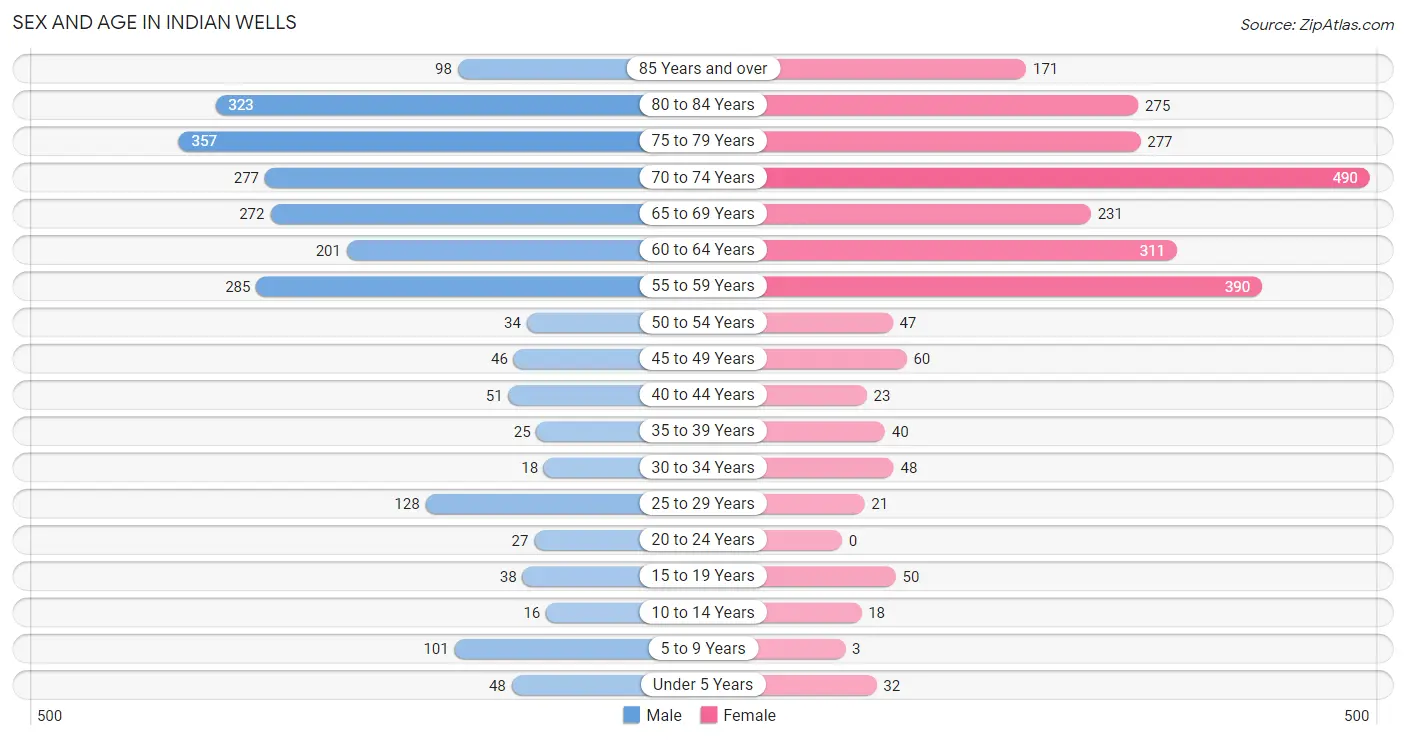
Sex and Age in Indian Wells
Sex and Age in Indian Wells
The most populous age groups in Indian Wells are 75 to 79 Years (357 | 15.2%) for men and 70 to 74 Years (490 | 19.7%) for women.
| Age Bracket | Male | Female |
| Under 5 Years | 48 (2.1%) | 32 (1.3%) |
| 5 to 9 Years | 101 (4.3%) | 3 (0.1%) |
| 10 to 14 Years | 16 (0.7%) | 18 (0.7%) |
| 15 to 19 Years | 38 (1.6%) | 50 (2.0%) |
| 20 to 24 Years | 27 (1.1%) | 0 (0.0%) |
| 25 to 29 Years | 128 (5.5%) | 21 (0.8%) |
| 30 to 34 Years | 18 (0.8%) | 48 (1.9%) |
| 35 to 39 Years | 25 (1.1%) | 40 (1.6%) |
| 40 to 44 Years | 51 (2.2%) | 23 (0.9%) |
| 45 to 49 Years | 46 (2.0%) | 60 (2.4%) |
| 50 to 54 Years | 34 (1.5%) | 47 (1.9%) |
| 55 to 59 Years | 285 (12.1%) | 390 (15.7%) |
| 60 to 64 Years | 201 (8.6%) | 311 (12.5%) |
| 65 to 69 Years | 272 (11.6%) | 231 (9.3%) |
| 70 to 74 Years | 277 (11.8%) | 490 (19.7%) |
| 75 to 79 Years | 357 (15.2%) | 277 (11.1%) |
| 80 to 84 Years | 323 (13.8%) | 275 (11.1%) |
| 85 Years and over | 98 (4.2%) | 171 (6.9%) |
| Total | 2,345 (100.0%) | 2,487 (100.0%) |
Families and Households in Indian Wells
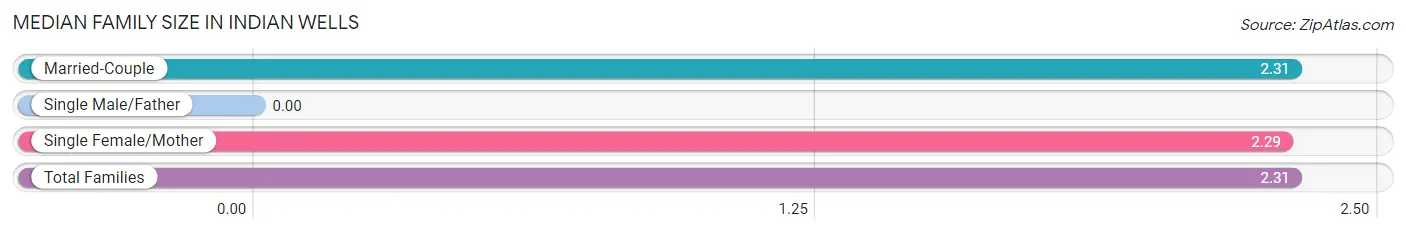
Median Family Size in Indian Wells
| Family Type | # Families | Family Size |
| Married-Couple | 1,340 (89.4%) | 2.31 |
| Single Male/Father | 0 (0.0%) | - |
| Single Female/Mother | 158 (10.5%) | 2.29 |
| Total Families | 1,498 (100.0%) | 2.31 |
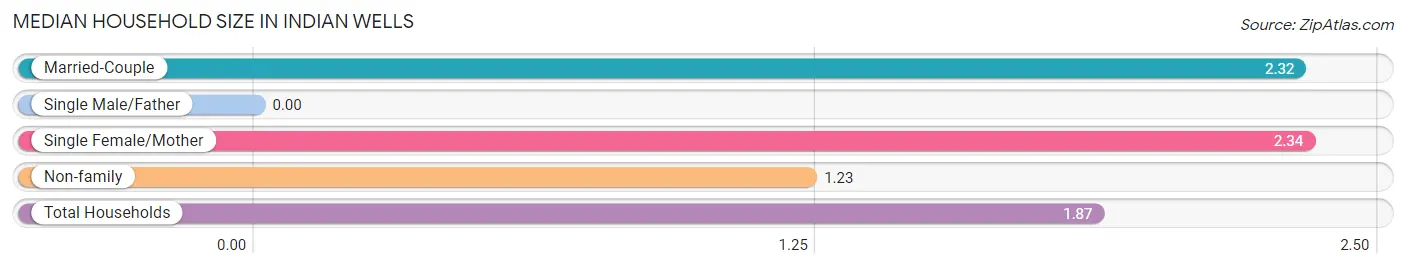
Median Household Size in Indian Wells
| Household Type | # Households | Household Size |
| Married-Couple | 1,340 (51.9%) | 2.32 |
| Single Male/Father | 0 (0.0%) | - |
| Single Female/Mother | 158 (6.1%) | 2.34 |
| Non-family | 1,083 (42.0%) | 1.23 |
| Total Households | 2,581 (100.0%) | 1.87 |
Household Size by Marriage Status in Indian Wells
Out of a total of 2,581 households in Indian Wells, 1,498 (58.0%) are family households, while 1,083 (42.0%) are nonfamily households. The most numerous type of family households are 2-person households, comprising 1,330, and the most common type of nonfamily households are 1-person households, comprising 825.
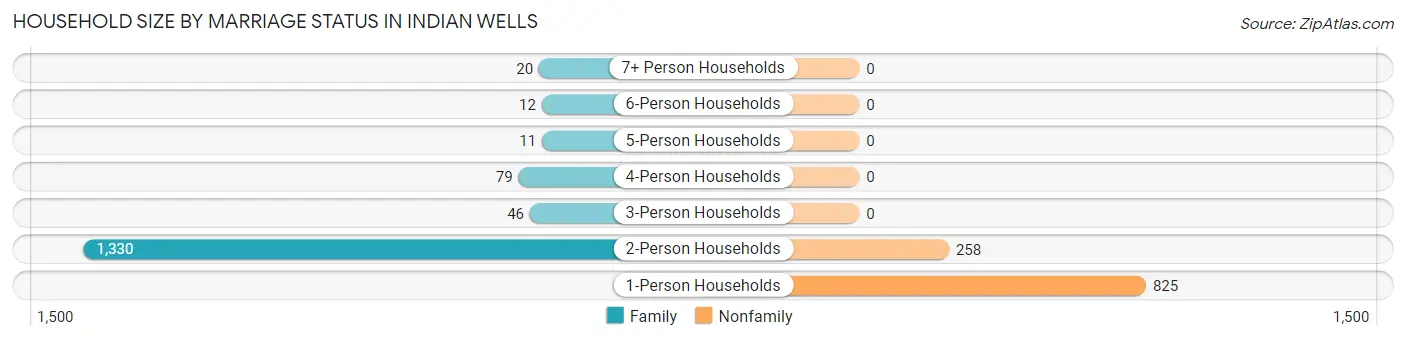
| Household Size | Family Households | Nonfamily Households |
| 1-Person Households | - | 825 (32.0%) |
| 2-Person Households | 1,330 (51.5%) | 258 (10.0%) |
| 3-Person Households | 46 (1.8%) | 0 (0.0%) |
| 4-Person Households | 79 (3.1%) | 0 (0.0%) |
| 5-Person Households | 11 (0.4%) | 0 (0.0%) |
| 6-Person Households | 12 (0.5%) | 0 (0.0%) |
| 7+ Person Households | 20 (0.8%) | 0 (0.0%) |
| Total | 1,498 (58.0%) | 1,083 (42.0%) |
Female Fertility in Indian Wells
Fertility by Age in Indian Wells
Average fertility rate in Indian Wells is 62.0 births per 1,000 women. Women in the age bracket of 35 to 50 years have the highest fertility rate with 122.0 births per 1,000 women. Women in the age bracket of 35 to 50 years acount for 100.0% of all women with births.
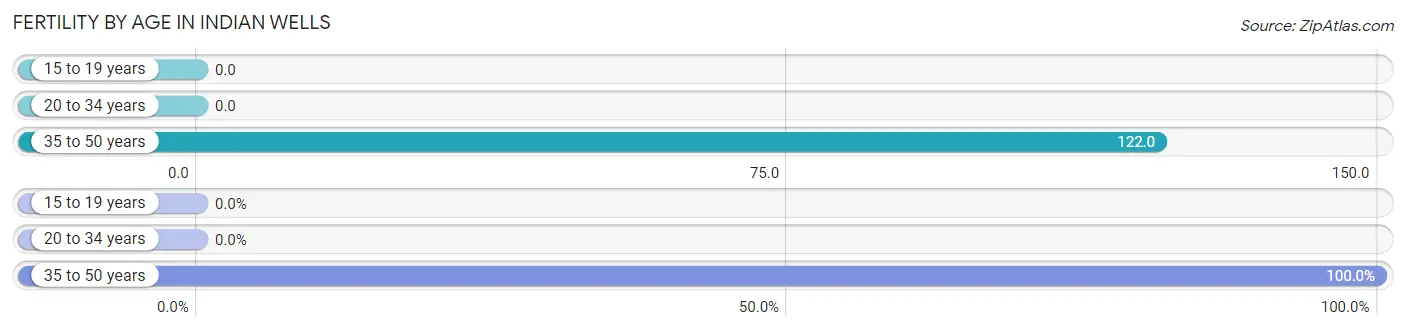
| Age Bracket | Women with Births | Births / 1,000 Women |
| 15 to 19 years | 0 (0.0%) | 0.0 |
| 20 to 34 years | 0 (0.0%) | 0.0 |
| 35 to 50 years | 15 (100.0%) | 122.0 |
| Total | 15 (100.0%) | 62.0 |
Fertility by Age by Marriage Status in Indian Wells
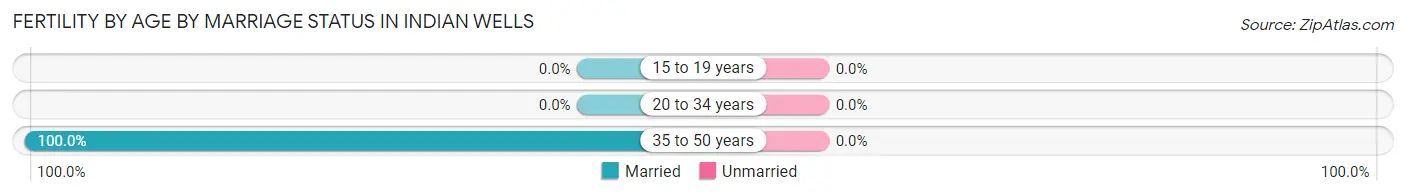
| Age Bracket | Married | Unmarried |
| 15 to 19 years | 0 (0.0%) | 0 (0.0%) |
| 20 to 34 years | 0 (0.0%) | 0 (0.0%) |
| 35 to 50 years | 15 (100.0%) | 0 (0.0%) |
| Total | 15 (100.0%) | 0 (0.0%) |
Fertility by Education in Indian Wells
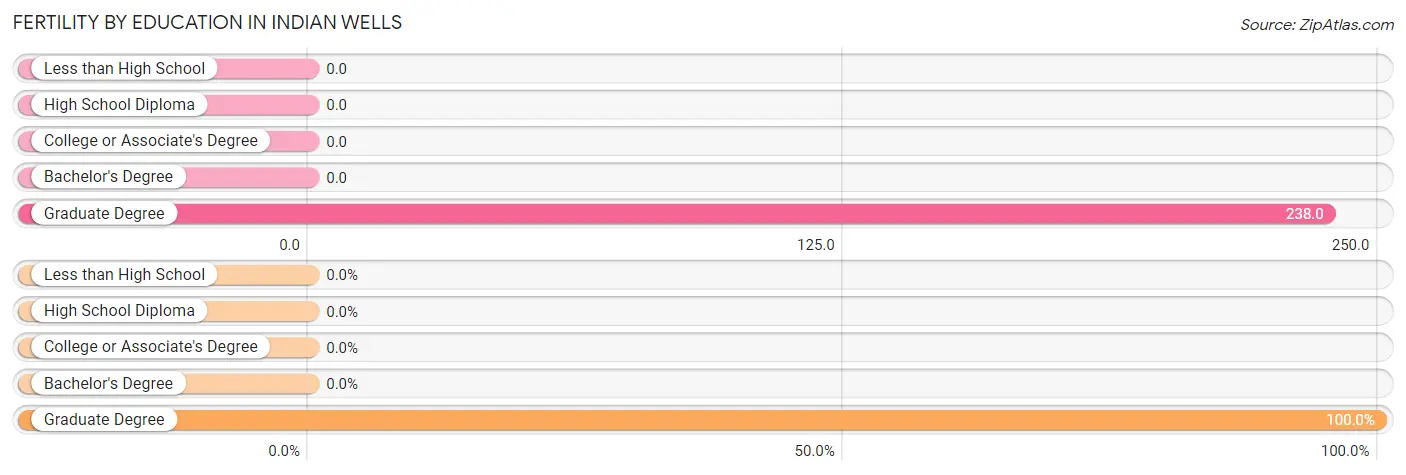
| Educational Attainment | Women with Births | Births / 1,000 Women |
| Less than High School | 0 (0.0%) | 0.0 |
| High School Diploma | 0 (0.0%) | 0.0 |
| College or Associate's Degree | 0 (0.0%) | 0.0 |
| Bachelor's Degree | 0 (0.0%) | 0.0 |
| Graduate Degree | 15 (100.0%) | 238.0 |
| Total | 15 (100.0%) | 62.0 |
Fertility by Education by Marriage Status in Indian Wells
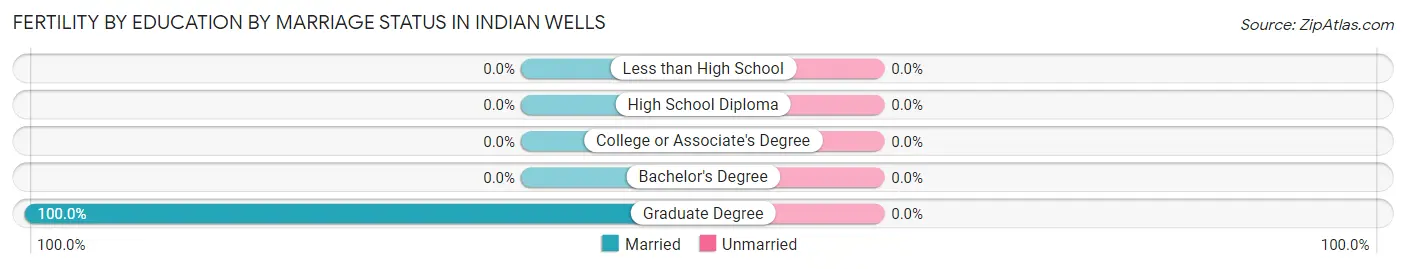
| Educational Attainment | Married | Unmarried |
| Less than High School | 0 (0.0%) | 0 (0.0%) |
| High School Diploma | 0 (0.0%) | 0 (0.0%) |
| College or Associate's Degree | 0 (0.0%) | 0 (0.0%) |
| Bachelor's Degree | 0 (0.0%) | 0 (0.0%) |
| Graduate Degree | 15 (100.0%) | 0 (0.0%) |
| Total | 15 (100.0%) | 0 (0.0%) |
Employment Characteristics in Indian Wells
Employment by Class of Employer in Indian Wells
Among the 1,627 employed individuals in Indian Wells, private company employees (981 | 60.3%), self-employed (not incorporated) (278 | 17.1%), and self-employed (incorporated) (197 | 12.1%) make up the most common classes of employment.
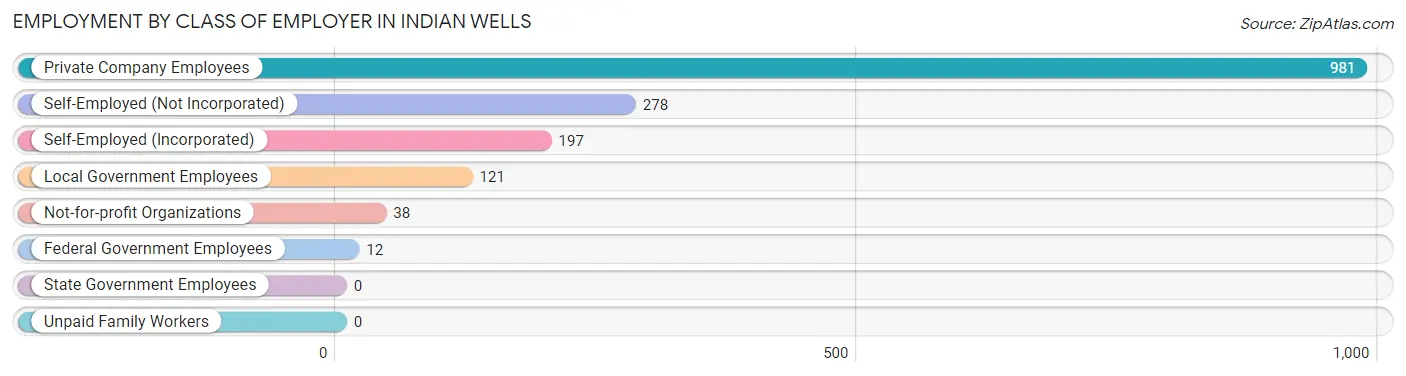
| Employer Class | # Employees | % Employees |
| Private Company Employees | 981 | 60.3% |
| Self-Employed (Incorporated) | 197 | 12.1% |
| Self-Employed (Not Incorporated) | 278 | 17.1% |
| Not-for-profit Organizations | 38 | 2.3% |
| Local Government Employees | 121 | 7.4% |
| State Government Employees | 0 | 0.0% |
| Federal Government Employees | 12 | 0.7% |
| Unpaid Family Workers | 0 | 0.0% |
| Total | 1,627 | 100.0% |
Employment Status by Age in Indian Wells
According to the labor force statistics for Indian Wells, out of the total population over 16 years of age (4,565), 38.3% or 1,748 individuals are in the labor force, with 6.4% or 112 of them unemployed. The age group with the highest labor force participation rate is 16 to 19 years, with 100.0% or 39 individuals in the labor force. Within the labor force, the 20 to 24 years age range has the highest percentage of unemployed individuals, with 100.0% or 27 of them being unemployed.
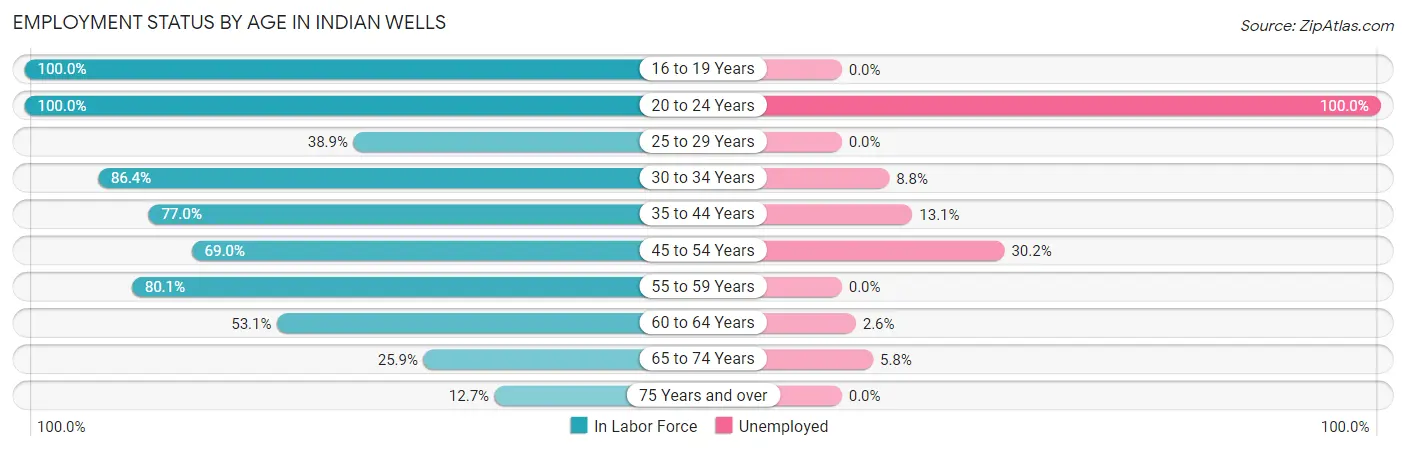
| Age Bracket | In Labor Force | Unemployed |
| 16 to 19 Years | 39 (100.0%) | 0 (0.0%) |
| 20 to 24 Years | 27 (100.0%) | 27 (100.0%) |
| 25 to 29 Years | 58 (38.9%) | 0 (0.0%) |
| 30 to 34 Years | 57 (86.4%) | 5 (8.8%) |
| 35 to 44 Years | 107 (77.0%) | 14 (13.1%) |
| 45 to 54 Years | 129 (69.0%) | 39 (30.2%) |
| 55 to 59 Years | 541 (80.1%) | 0 (0.0%) |
| 60 to 64 Years | 272 (53.1%) | 7 (2.6%) |
| 65 to 74 Years | 329 (25.9%) | 19 (5.8%) |
| 75 Years and over | 191 (12.7%) | 0 (0.0%) |
| Total | 1,748 (38.3%) | 112 (6.4%) |
Employment Status by Educational Attainment in Indian Wells
According to labor force statistics for Indian Wells, 67.4% of individuals (1,165) out of the total population between 25 and 64 years of age (1,728) are in the labor force, with 5.6% or 65 of them being unemployed. The group with the highest labor force participation rate are those with the educational attainment of less than high school, with 81.4% or 35 individuals in the labor force. Within the labor force, individuals with less than high school education have the highest percentage of unemployment, with 40.0% or 14 of them being unemployed.
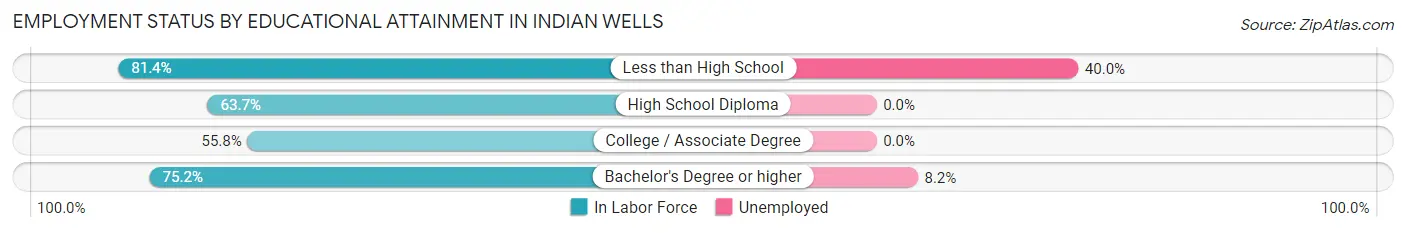
| Educational Attainment | In Labor Force | Unemployed |
| Less than High School | 35 (81.4%) | 17 (40.0%) |
| High School Diploma | 223 (63.7%) | 0 (0.0%) |
| College / Associate Degree | 283 (55.8%) | 0 (0.0%) |
| Bachelor's Degree or higher | 623 (75.2%) | 68 (8.2%) |
| Total | 1,165 (67.4%) | 97 (5.6%) |
Employment Occupations by Sex in Indian Wells
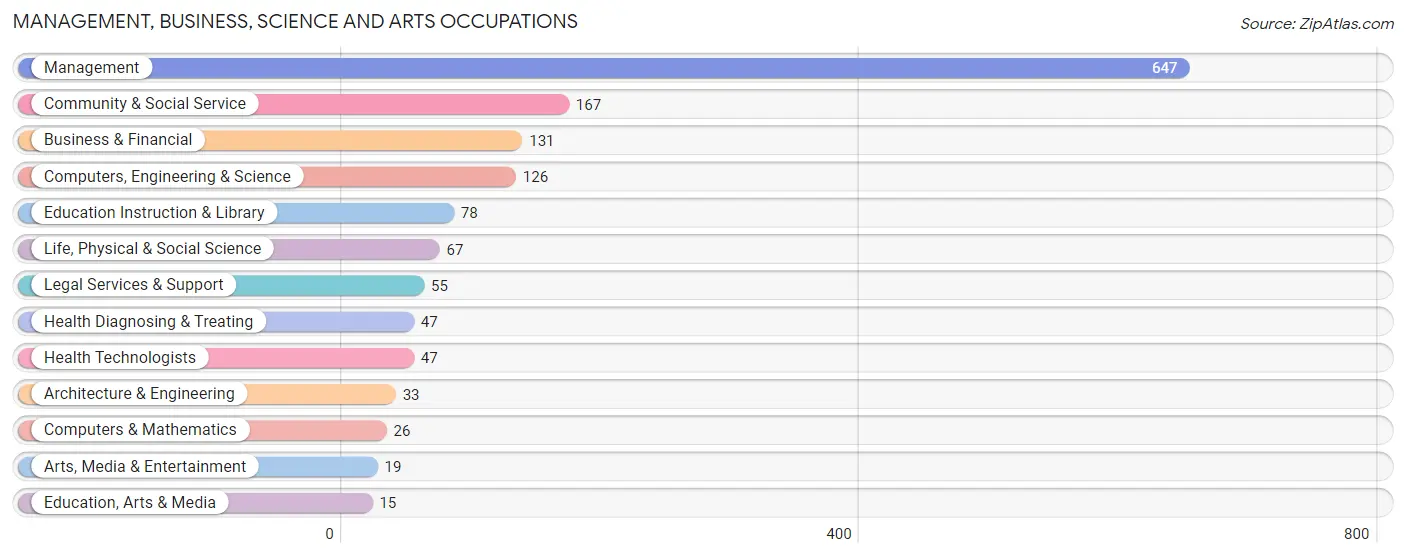
Management, Business, Science and Arts Occupations
The most common Management, Business, Science and Arts occupations in Indian Wells are Management (647 | 39.5%), Community & Social Service (167 | 10.2%), Business & Financial (131 | 8.0%), Computers, Engineering & Science (126 | 7.7%), and Education Instruction & Library (78 | 4.8%).
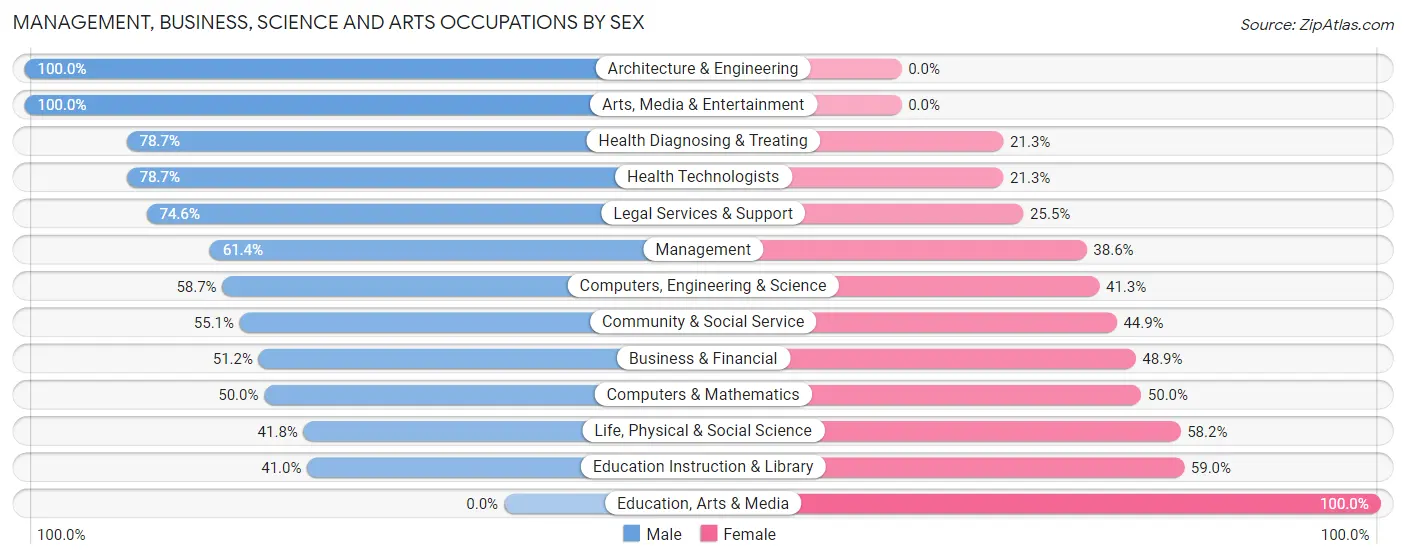
Management, Business, Science and Arts Occupations by Sex
Within the Management, Business, Science and Arts occupations in Indian Wells, the most male-oriented occupations are Architecture & Engineering (100.0%), Arts, Media & Entertainment (100.0%), and Health Diagnosing & Treating (78.7%), while the most female-oriented occupations are Education, Arts & Media (100.0%), Education Instruction & Library (59.0%), and Life, Physical & Social Science (58.2%).
| Occupation | Male | Female |
| Management | 397 (61.4%) | 250 (38.6%) |
| Business & Financial | 67 (51.1%) | 64 (48.8%) |
| Computers, Engineering & Science | 74 (58.7%) | 52 (41.3%) |
| Computers & Mathematics | 13 (50.0%) | 13 (50.0%) |
| Architecture & Engineering | 33 (100.0%) | 0 (0.0%) |
| Life, Physical & Social Science | 28 (41.8%) | 39 (58.2%) |
| Community & Social Service | 92 (55.1%) | 75 (44.9%) |
| Education, Arts & Media | 0 (0.0%) | 15 (100.0%) |
| Legal Services & Support | 41 (74.6%) | 14 (25.5%) |
| Education Instruction & Library | 32 (41.0%) | 46 (59.0%) |
| Arts, Media & Entertainment | 19 (100.0%) | 0 (0.0%) |
| Health Diagnosing & Treating | 37 (78.7%) | 10 (21.3%) |
| Health Technologists | 37 (78.7%) | 10 (21.3%) |
| Total (Category) | 667 (59.7%) | 451 (40.3%) |
| Total (Overall) | 968 (59.1%) | 669 (40.9%) |
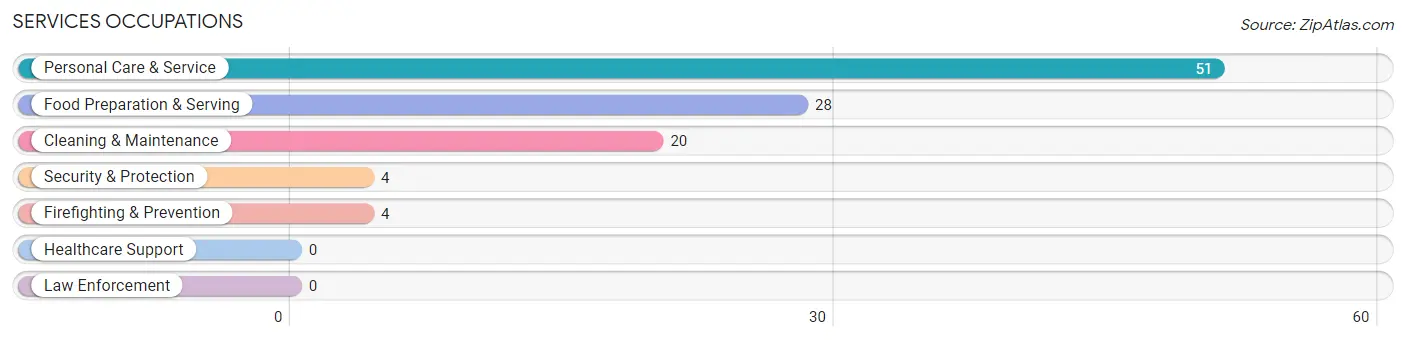
Services Occupations
The most common Services occupations in Indian Wells are Personal Care & Service (51 | 3.1%), Food Preparation & Serving (28 | 1.7%), Cleaning & Maintenance (20 | 1.2%), Security & Protection (4 | 0.2%), and Firefighting & Prevention (4 | 0.2%).
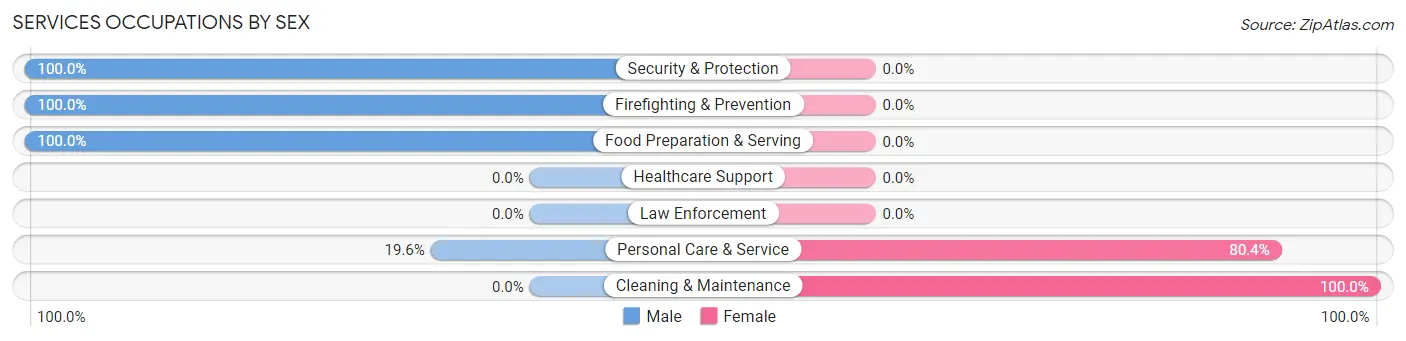
Services Occupations by Sex
Within the Services occupations in Indian Wells, the most male-oriented occupations are Security & Protection (100.0%), Firefighting & Prevention (100.0%), and Food Preparation & Serving (100.0%), while the most female-oriented occupations are Cleaning & Maintenance (100.0%), and Personal Care & Service (80.4%).
| Occupation | Male | Female |
| Healthcare Support | 0 (0.0%) | 0 (0.0%) |
| Security & Protection | 4 (100.0%) | 0 (0.0%) |
| Firefighting & Prevention | 4 (100.0%) | 0 (0.0%) |
| Law Enforcement | 0 (0.0%) | 0 (0.0%) |
| Food Preparation & Serving | 28 (100.0%) | 0 (0.0%) |
| Cleaning & Maintenance | 0 (0.0%) | 20 (100.0%) |
| Personal Care & Service | 10 (19.6%) | 41 (80.4%) |
| Total (Category) | 42 (40.8%) | 61 (59.2%) |
| Total (Overall) | 968 (59.1%) | 669 (40.9%) |
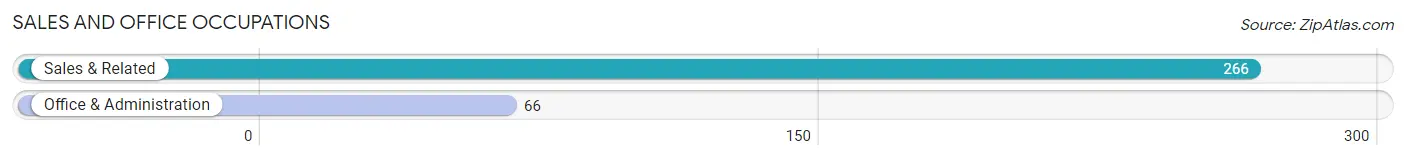
Sales and Office Occupations
The most common Sales and Office occupations in Indian Wells are Sales & Related (266 | 16.3%), and Office & Administration (66 | 4.0%).
Sales and Office Occupations by Sex
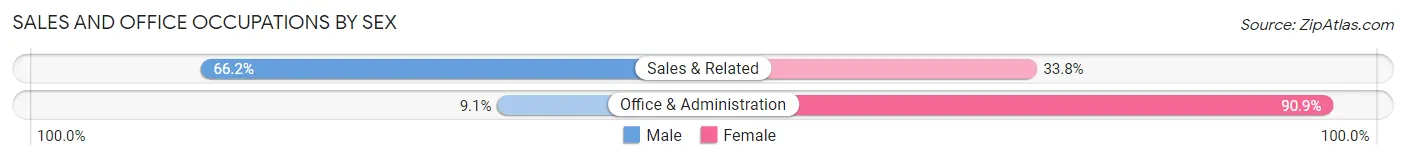
| Occupation | Male | Female |
| Sales & Related | 176 (66.2%) | 90 (33.8%) |
| Office & Administration | 6 (9.1%) | 60 (90.9%) |
| Total (Category) | 182 (54.8%) | 150 (45.2%) |
| Total (Overall) | 968 (59.1%) | 669 (40.9%) |
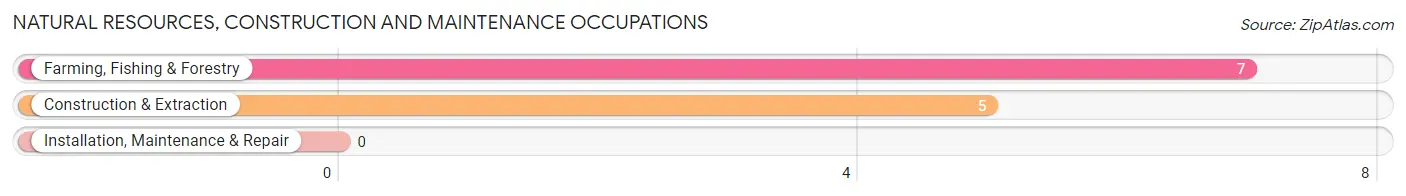
Natural Resources, Construction and Maintenance Occupations
The most common Natural Resources, Construction and Maintenance occupations in Indian Wells are Farming, Fishing & Forestry (7 | 0.4%), and Construction & Extraction (5 | 0.3%).
Natural Resources, Construction and Maintenance Occupations by Sex
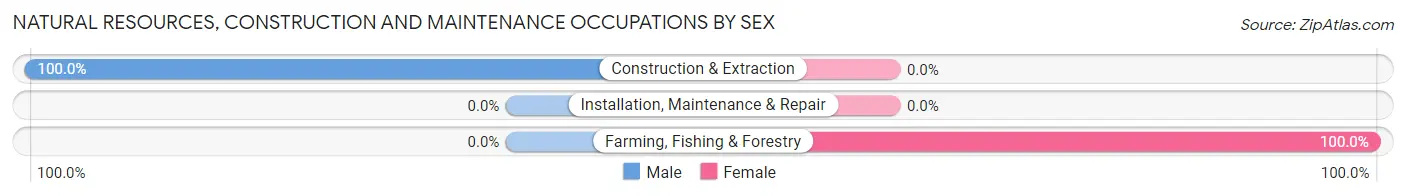
| Occupation | Male | Female |
| Farming, Fishing & Forestry | 0 (0.0%) | 7 (100.0%) |
| Construction & Extraction | 5 (100.0%) | 0 (0.0%) |
| Installation, Maintenance & Repair | 0 (0.0%) | 0 (0.0%) |
| Total (Category) | 5 (41.7%) | 7 (58.3%) |
| Total (Overall) | 968 (59.1%) | 669 (40.9%) |
Production, Transportation and Moving Occupations
The most common Production, Transportation and Moving occupations in Indian Wells are Transportation (55 | 3.4%), and Material Moving (17 | 1.0%).
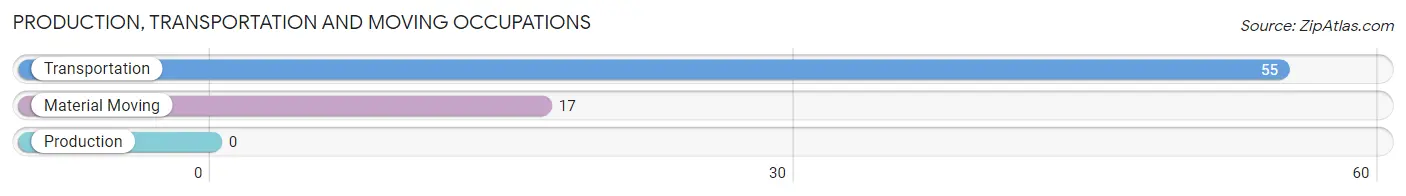
Production, Transportation and Moving Occupations by Sex
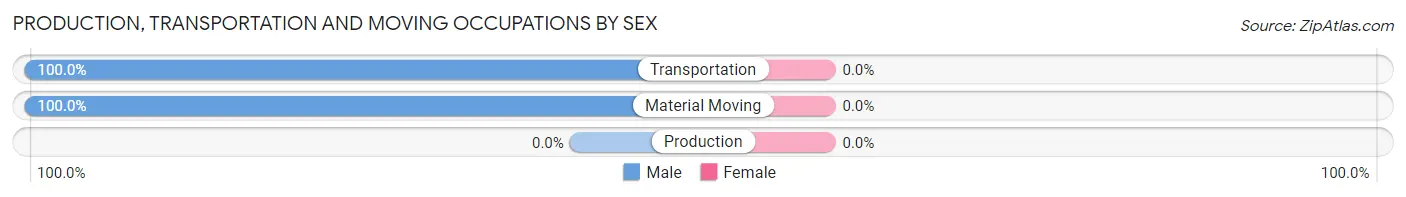
| Occupation | Male | Female |
| Production | 0 (0.0%) | 0 (0.0%) |
| Transportation | 55 (100.0%) | 0 (0.0%) |
| Material Moving | 17 (100.0%) | 0 (0.0%) |
| Total (Category) | 72 (100.0%) | 0 (0.0%) |
| Total (Overall) | 968 (59.1%) | 669 (40.9%) |
Employment Industries by Sex in Indian Wells
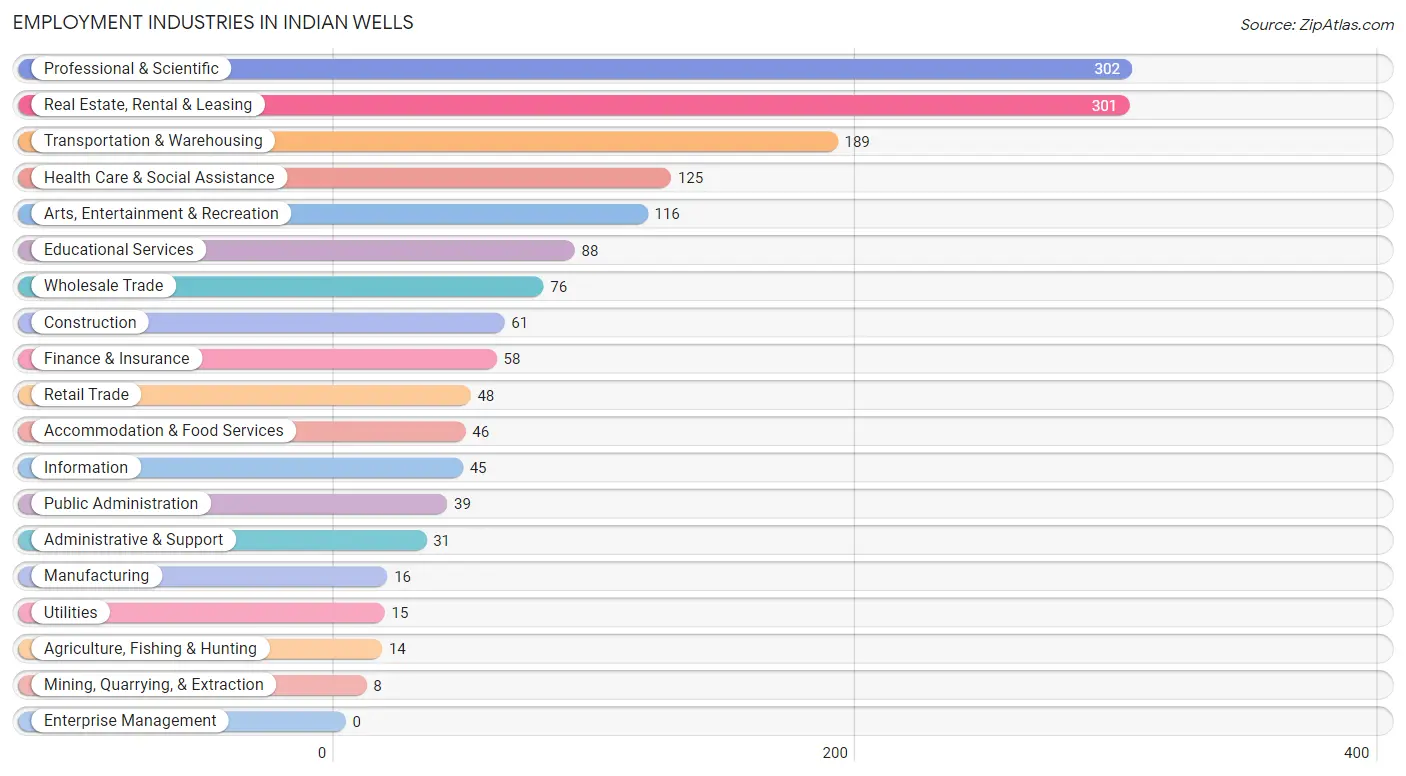
Employment Industries in Indian Wells
The major employment industries in Indian Wells include Professional & Scientific (302 | 18.4%), Real Estate, Rental & Leasing (301 | 18.4%), Transportation & Warehousing (189 | 11.6%), Health Care & Social Assistance (125 | 7.6%), and Arts, Entertainment & Recreation (116 | 7.1%).
Employment Industries by Sex in Indian Wells
The Indian Wells industries that see more men than women are Mining, Quarrying, & Extraction (100.0%), Transportation & Warehousing (100.0%), and Retail Trade (83.3%), whereas the industries that tend to have a higher number of women are Utilities (100.0%), Public Administration (89.7%), and Real Estate, Rental & Leasing (76.7%).
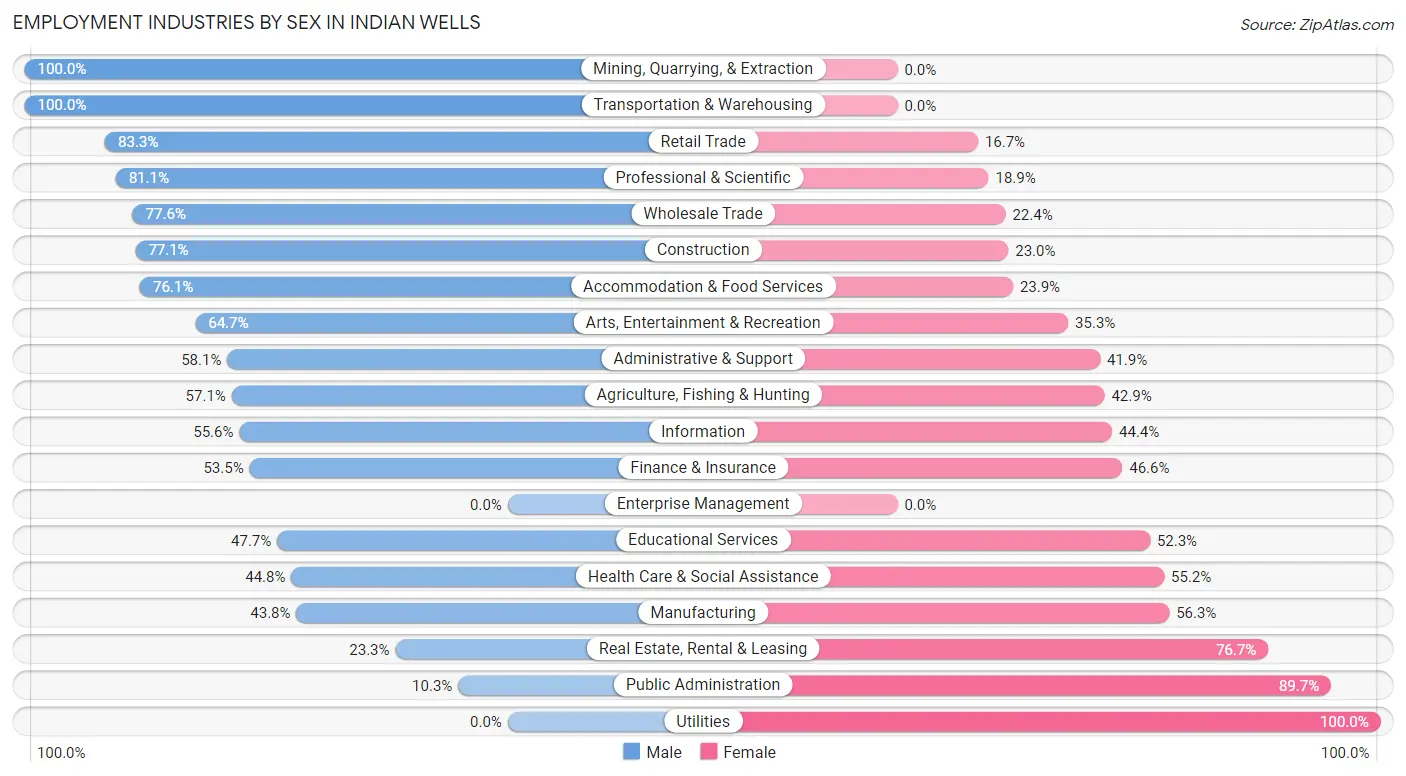
| Industry | Male | Female |
| Agriculture, Fishing & Hunting | 8 (57.1%) | 6 (42.9%) |
| Mining, Quarrying, & Extraction | 8 (100.0%) | 0 (0.0%) |
| Construction | 47 (77.0%) | 14 (23.0%) |
| Manufacturing | 7 (43.8%) | 9 (56.2%) |
| Wholesale Trade | 59 (77.6%) | 17 (22.4%) |
| Retail Trade | 40 (83.3%) | 8 (16.7%) |
| Transportation & Warehousing | 189 (100.0%) | 0 (0.0%) |
| Utilities | 0 (0.0%) | 15 (100.0%) |
| Information | 25 (55.6%) | 20 (44.4%) |
| Finance & Insurance | 31 (53.4%) | 27 (46.6%) |
| Real Estate, Rental & Leasing | 70 (23.3%) | 231 (76.7%) |
| Professional & Scientific | 245 (81.1%) | 57 (18.9%) |
| Enterprise Management | 0 (0.0%) | 0 (0.0%) |
| Administrative & Support | 18 (58.1%) | 13 (41.9%) |
| Educational Services | 42 (47.7%) | 46 (52.3%) |
| Health Care & Social Assistance | 56 (44.8%) | 69 (55.2%) |
| Arts, Entertainment & Recreation | 75 (64.7%) | 41 (35.3%) |
| Accommodation & Food Services | 35 (76.1%) | 11 (23.9%) |
| Public Administration | 4 (10.3%) | 35 (89.7%) |
| Total | 968 (59.1%) | 669 (40.9%) |
Education in Indian Wells
School Enrollment in Indian Wells
The most common levels of schooling among the 341 students in Indian Wells are elementary school (97 | 28.4%), high school (88 | 25.8%), and graduate / professional (50 | 14.7%).
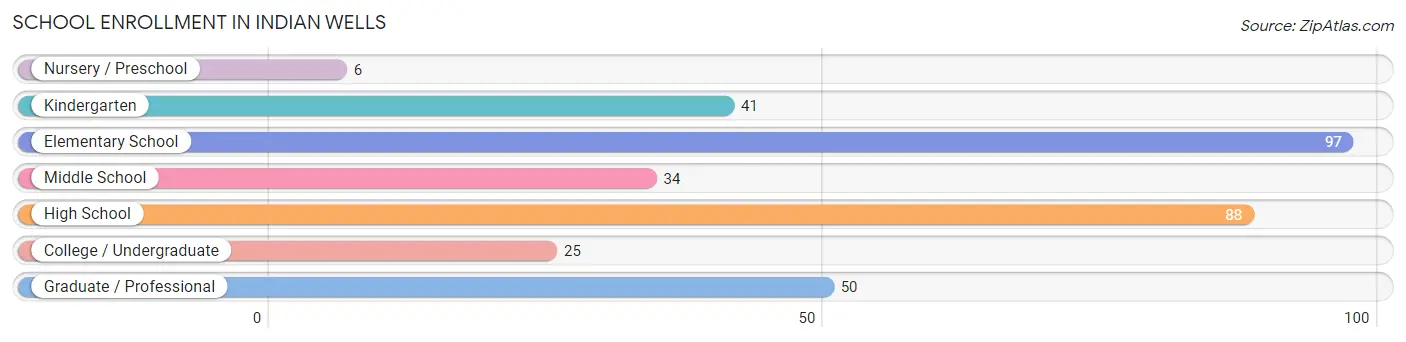
| School Level | # Students | % Students |
| Nursery / Preschool | 6 | 1.8% |
| Kindergarten | 41 | 12.0% |
| Elementary School | 97 | 28.4% |
| Middle School | 34 | 10.0% |
| High School | 88 | 25.8% |
| College / Undergraduate | 25 | 7.3% |
| Graduate / Professional | 50 | 14.7% |
| Total | 341 | 100.0% |
School Enrollment by Age by Funding Source in Indian Wells
Out of a total of 341 students who are enrolled in schools in Indian Wells, 48 (14.1%) attend a private institution, while the remaining 293 (85.9%) are enrolled in public schools. The age group of 10 to 14 year olds has the highest likelihood of being enrolled in private schools, with 18 (52.9% in the age bracket) enrolled. Conversely, the age group of 18 to 19 year olds has the lowest likelihood of being enrolled in a private school, with 20 (100.0% in the age bracket) attending a public institution.
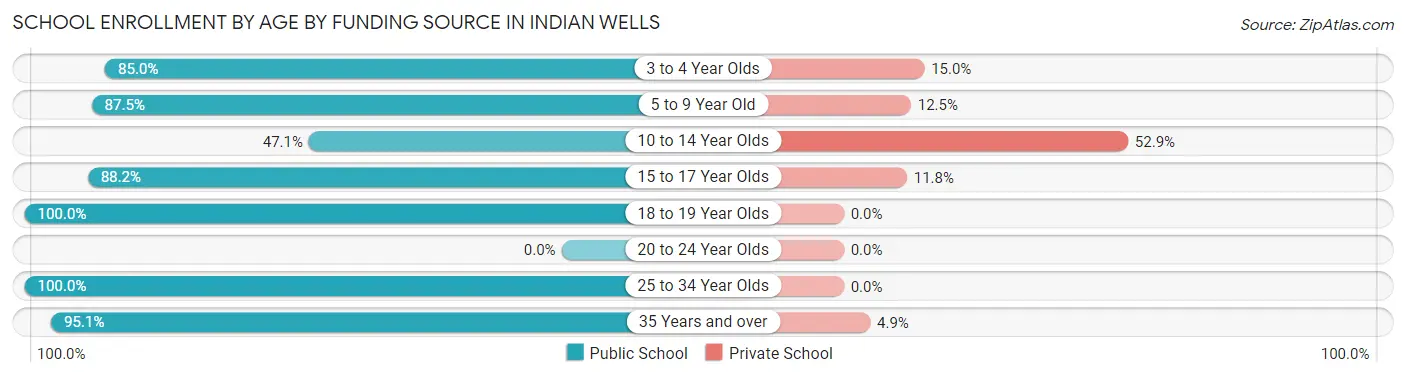
| Age Bracket | Public School | Private School |
| 3 to 4 Year Olds | 34 (85.0%) | 6 (15.0%) |
| 5 to 9 Year Old | 91 (87.5%) | 13 (12.5%) |
| 10 to 14 Year Olds | 16 (47.1%) | 18 (52.9%) |
| 15 to 17 Year Olds | 60 (88.2%) | 8 (11.8%) |
| 18 to 19 Year Olds | 20 (100.0%) | 0 (0.0%) |
| 20 to 24 Year Olds | 0 (0.0%) | 0 (0.0%) |
| 25 to 34 Year Olds | 14 (100.0%) | 0 (0.0%) |
| 35 Years and over | 58 (95.1%) | 3 (4.9%) |
| Total | 293 (85.9%) | 48 (14.1%) |
Educational Attainment by Field of Study in Indian Wells
Business (624 | 22.0%), social sciences (422 | 14.9%), education (387 | 13.7%), science & technology (244 | 8.6%), and literature & languages (241 | 8.5%) are the most common fields of study among 2,831 individuals in Indian Wells who have obtained a bachelor's degree or higher.
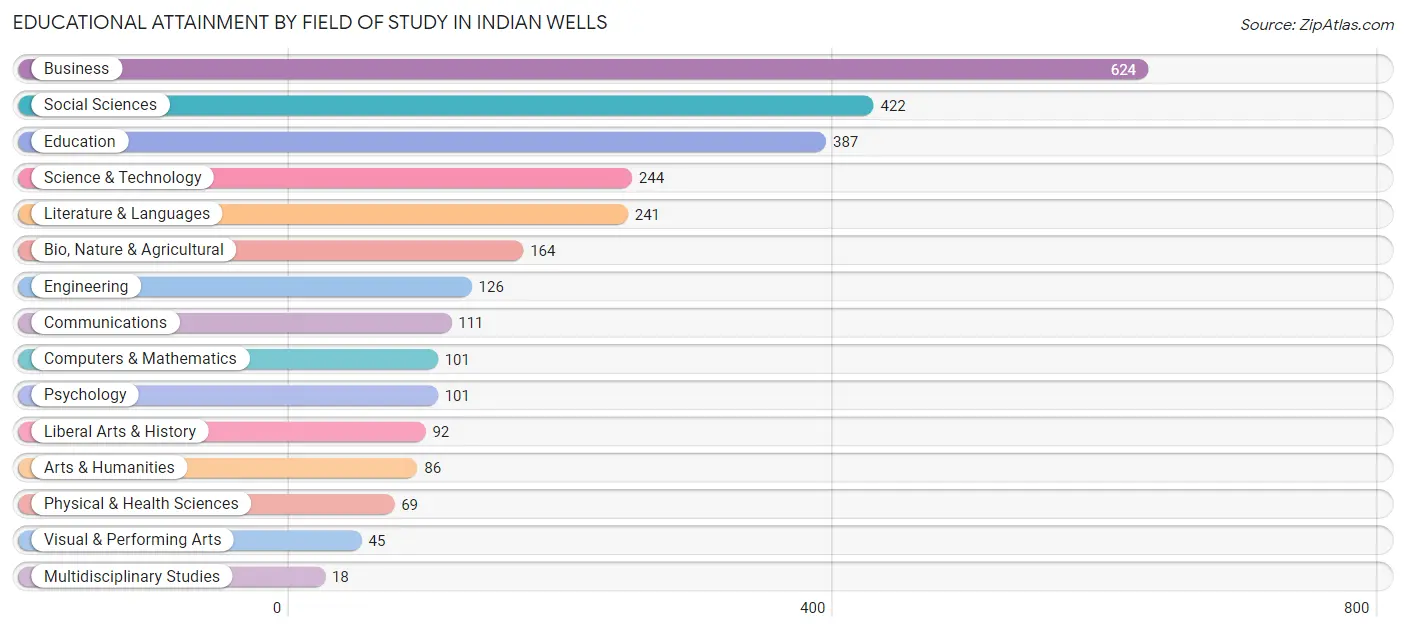
| Field of Study | # Graduates | % Graduates |
| Computers & Mathematics | 101 | 3.6% |
| Bio, Nature & Agricultural | 164 | 5.8% |
| Physical & Health Sciences | 69 | 2.4% |
| Psychology | 101 | 3.6% |
| Social Sciences | 422 | 14.9% |
| Engineering | 126 | 4.4% |
| Multidisciplinary Studies | 18 | 0.6% |
| Science & Technology | 244 | 8.6% |
| Business | 624 | 22.0% |
| Education | 387 | 13.7% |
| Literature & Languages | 241 | 8.5% |
| Liberal Arts & History | 92 | 3.3% |
| Visual & Performing Arts | 45 | 1.6% |
| Communications | 111 | 3.9% |
| Arts & Humanities | 86 | 3.0% |
| Total | 2,831 | 100.0% |
Transportation & Commute in Indian Wells
Vehicle Availability by Sex in Indian Wells
The most prevalent vehicle ownership categories in Indian Wells are males with 2 vehicles (555, accounting for 57.8%) and females with 2 vehicles (408, making up 83.6%).
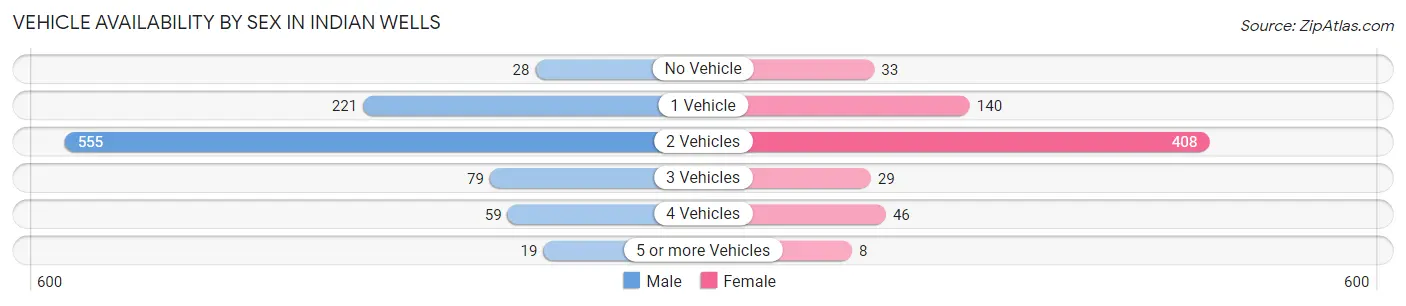
| Vehicles Available | Male | Female |
| No Vehicle | 28 (2.9%) | 33 (5.0%) |
| 1 Vehicle | 221 (23.0%) | 140 (21.1%) |
| 2 Vehicles | 555 (57.8%) | 408 (61.5%) |
| 3 Vehicles | 79 (8.2%) | 29 (4.4%) |
| 4 Vehicles | 59 (6.1%) | 46 (6.9%) |
| 5 or more Vehicles | 19 (2.0%) | 8 (1.2%) |
| Total | 961 (100.0%) | 664 (100.0%) |
Commute Time in Indian Wells
The most frequently occuring commute durations in Indian Wells are 15 to 19 minutes (243 commuters, 20.6%), less than 5 minutes (204 commuters, 17.3%), and 25 to 29 minutes (162 commuters, 13.7%).
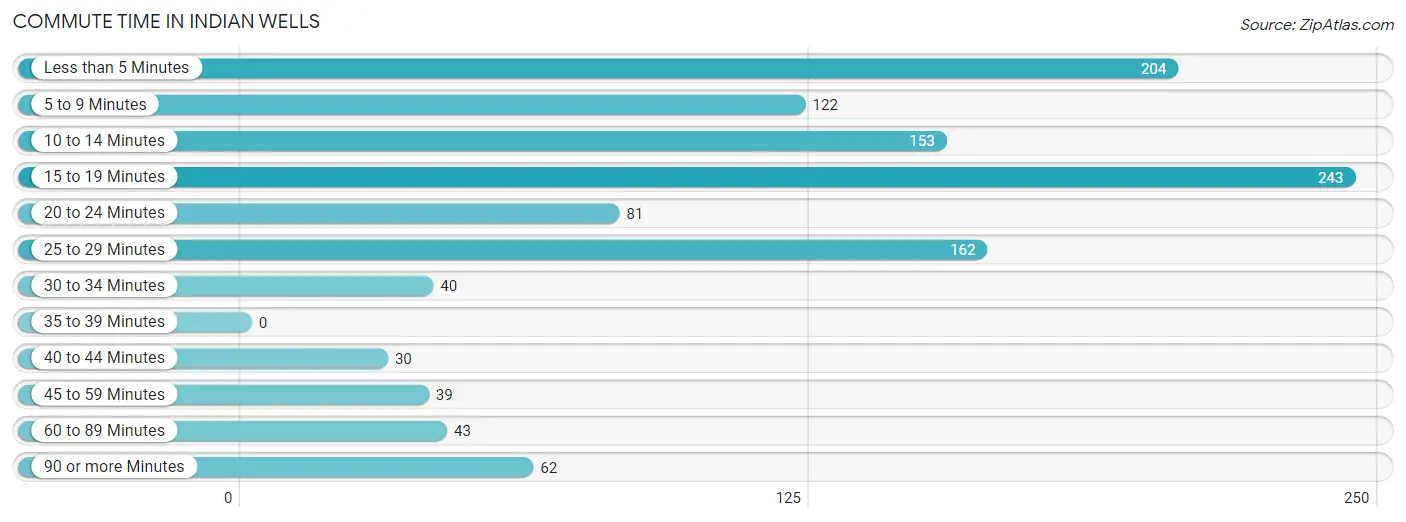
| Commute Time | # Commuters | % Commuters |
| Less than 5 Minutes | 204 | 17.3% |
| 5 to 9 Minutes | 122 | 10.3% |
| 10 to 14 Minutes | 153 | 13.0% |
| 15 to 19 Minutes | 243 | 20.6% |
| 20 to 24 Minutes | 81 | 6.9% |
| 25 to 29 Minutes | 162 | 13.7% |
| 30 to 34 Minutes | 40 | 3.4% |
| 35 to 39 Minutes | 0 | 0.0% |
| 40 to 44 Minutes | 30 | 2.5% |
| 45 to 59 Minutes | 39 | 3.3% |
| 60 to 89 Minutes | 43 | 3.6% |
| 90 or more Minutes | 62 | 5.3% |
Commute Time by Sex in Indian Wells
The most common commute times in Indian Wells are 25 to 29 minutes (162 commuters, 23.1%) for males and less than 5 minutes (186 commuters, 39.0%) for females.
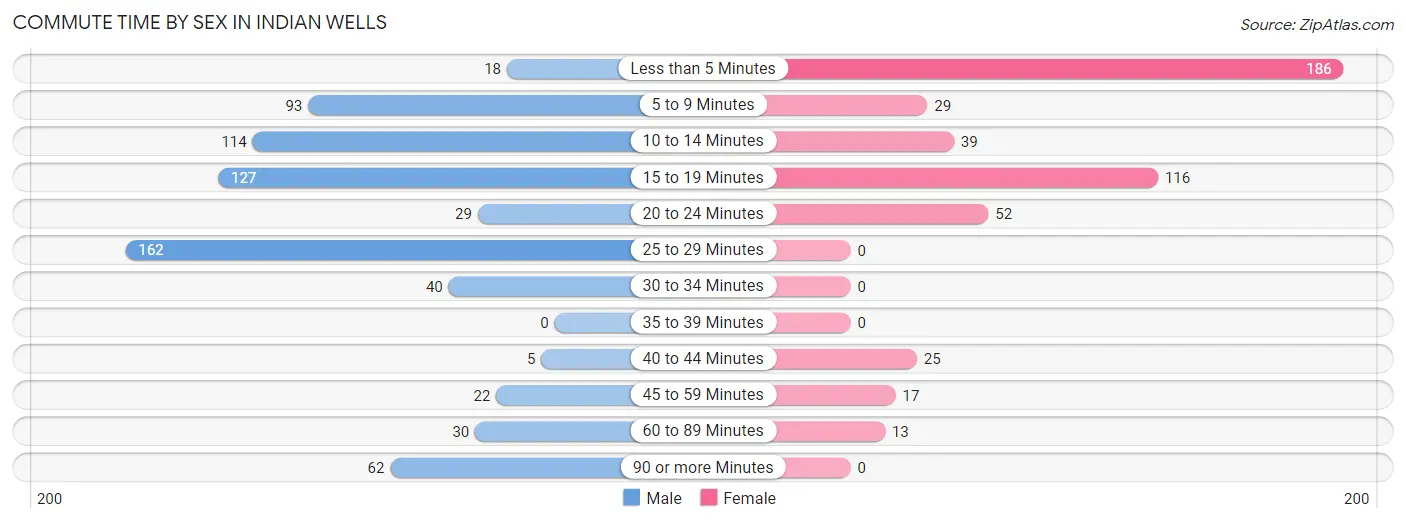
| Commute Time | Male | Female |
| Less than 5 Minutes | 18 (2.6%) | 186 (39.0%) |
| 5 to 9 Minutes | 93 (13.3%) | 29 (6.1%) |
| 10 to 14 Minutes | 114 (16.2%) | 39 (8.2%) |
| 15 to 19 Minutes | 127 (18.1%) | 116 (24.3%) |
| 20 to 24 Minutes | 29 (4.1%) | 52 (10.9%) |
| 25 to 29 Minutes | 162 (23.1%) | 0 (0.0%) |
| 30 to 34 Minutes | 40 (5.7%) | 0 (0.0%) |
| 35 to 39 Minutes | 0 (0.0%) | 0 (0.0%) |
| 40 to 44 Minutes | 5 (0.7%) | 25 (5.2%) |
| 45 to 59 Minutes | 22 (3.1%) | 17 (3.6%) |
| 60 to 89 Minutes | 30 (4.3%) | 13 (2.7%) |
| 90 or more Minutes | 62 (8.8%) | 0 (0.0%) |
Time of Departure to Work by Sex in Indian Wells
The most frequent times of departure to work in Indian Wells are 5:00 AM to 5:29 AM (168, 23.9%) for males and 8:00 AM to 8:29 AM (214, 44.9%) for females.
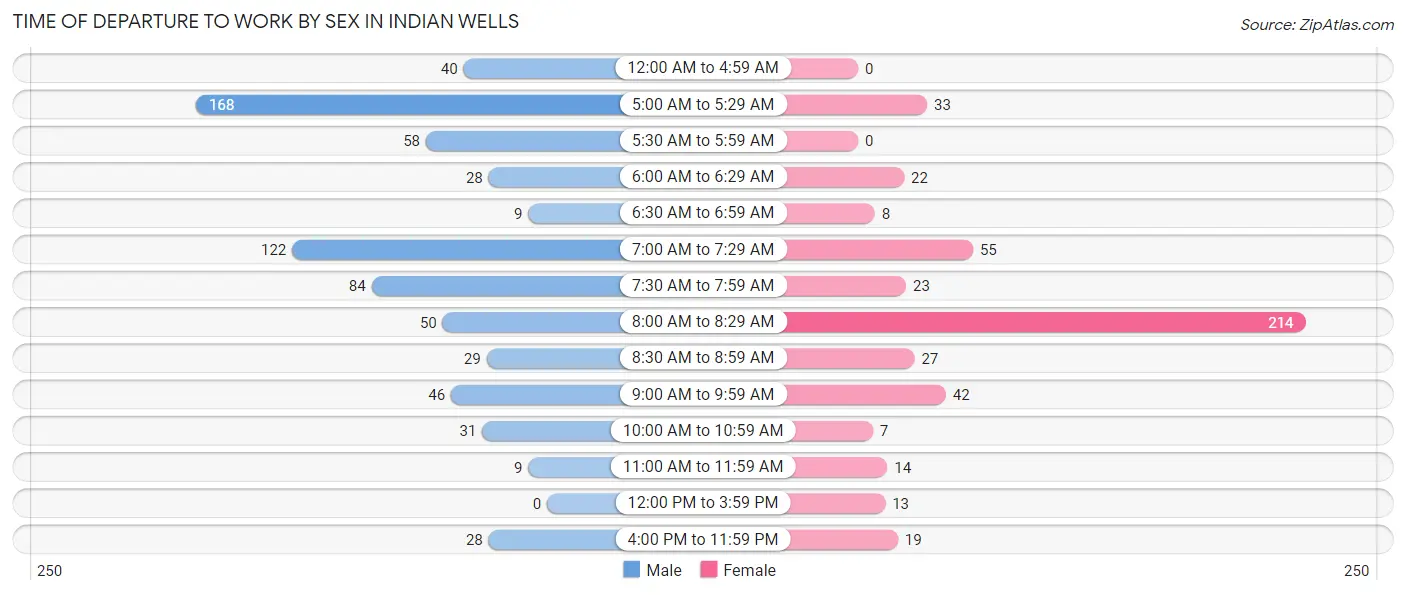
| Time of Departure | Male | Female |
| 12:00 AM to 4:59 AM | 40 (5.7%) | 0 (0.0%) |
| 5:00 AM to 5:29 AM | 168 (23.9%) | 33 (6.9%) |
| 5:30 AM to 5:59 AM | 58 (8.3%) | 0 (0.0%) |
| 6:00 AM to 6:29 AM | 28 (4.0%) | 22 (4.6%) |
| 6:30 AM to 6:59 AM | 9 (1.3%) | 8 (1.7%) |
| 7:00 AM to 7:29 AM | 122 (17.4%) | 55 (11.5%) |
| 7:30 AM to 7:59 AM | 84 (12.0%) | 23 (4.8%) |
| 8:00 AM to 8:29 AM | 50 (7.1%) | 214 (44.9%) |
| 8:30 AM to 8:59 AM | 29 (4.1%) | 27 (5.7%) |
| 9:00 AM to 9:59 AM | 46 (6.6%) | 42 (8.8%) |
| 10:00 AM to 10:59 AM | 31 (4.4%) | 7 (1.5%) |
| 11:00 AM to 11:59 AM | 9 (1.3%) | 14 (2.9%) |
| 12:00 PM to 3:59 PM | 0 (0.0%) | 13 (2.7%) |
| 4:00 PM to 11:59 PM | 28 (4.0%) | 19 (4.0%) |
| Total | 702 (100.0%) | 477 (100.0%) |
Housing Occupancy in Indian Wells
Occupancy by Ownership in Indian Wells
Of the total 2,581 dwellings in Indian Wells, owner-occupied units account for 2,010 (77.9%), while renter-occupied units make up 571 (22.1%).
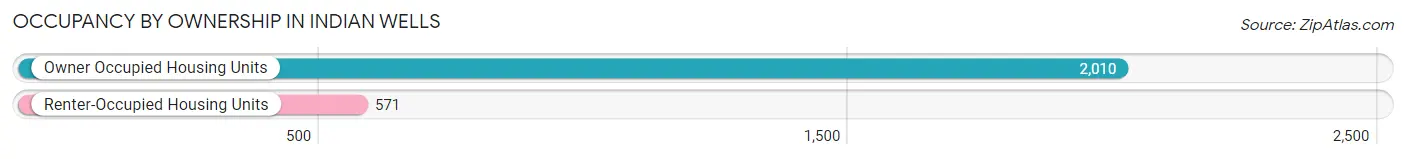
| Occupancy | # Housing Units | % Housing Units |
| Owner Occupied Housing Units | 2,010 | 77.9% |
| Renter-Occupied Housing Units | 571 | 22.1% |
| Total Occupied Housing Units | 2,581 | 100.0% |
Occupancy by Household Size in Indian Wells
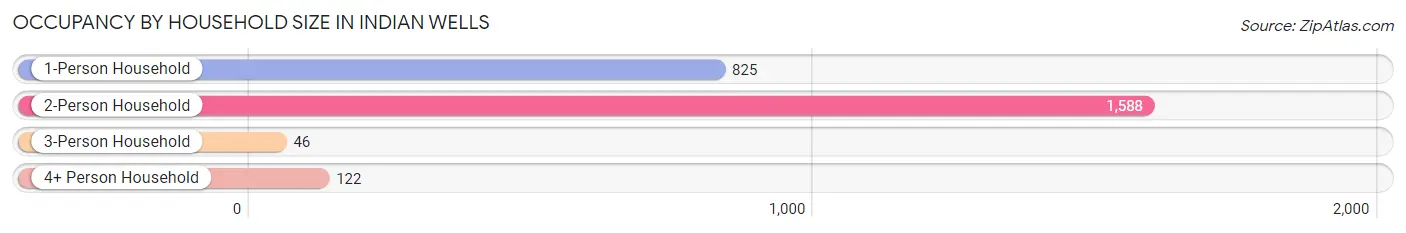
| Household Size | # Housing Units | % Housing Units |
| 1-Person Household | 825 | 32.0% |
| 2-Person Household | 1,588 | 61.5% |
| 3-Person Household | 46 | 1.8% |
| 4+ Person Household | 122 | 4.7% |
| Total Housing Units | 2,581 | 100.0% |
Occupancy by Ownership by Household Size in Indian Wells
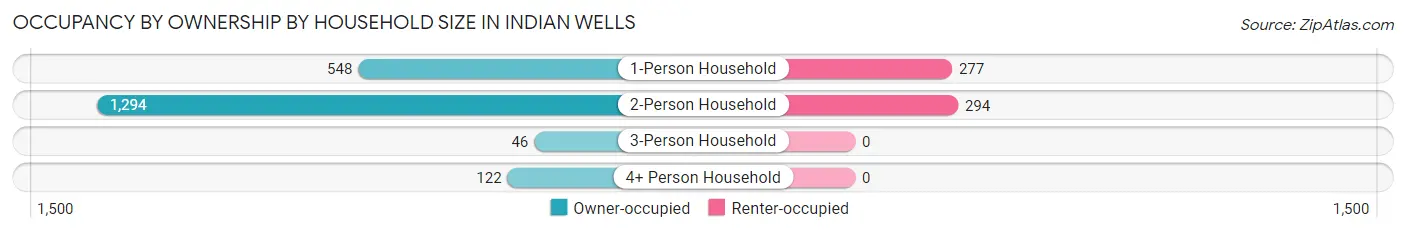
| Household Size | Owner-occupied | Renter-occupied |
| 1-Person Household | 548 (66.4%) | 277 (33.6%) |
| 2-Person Household | 1,294 (81.5%) | 294 (18.5%) |
| 3-Person Household | 46 (100.0%) | 0 (0.0%) |
| 4+ Person Household | 122 (100.0%) | 0 (0.0%) |
| Total Housing Units | 2,010 (77.9%) | 571 (22.1%) |
Occupancy by Educational Attainment in Indian Wells
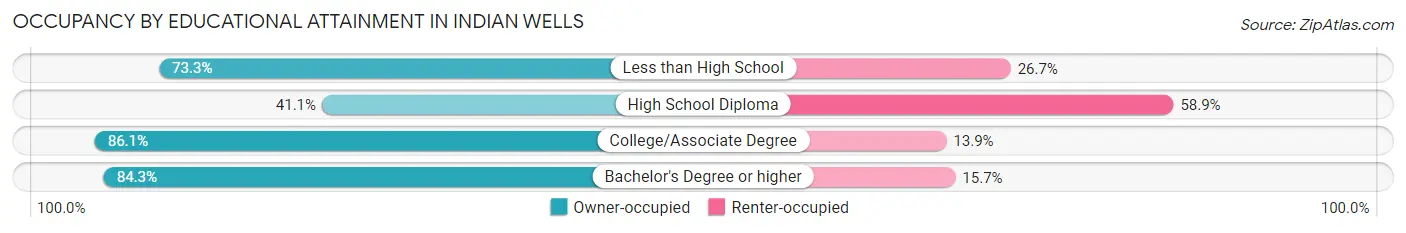
| Household Size | Owner-occupied | Renter-occupied |
| Less than High School | 22 (73.3%) | 8 (26.7%) |
| High School Diploma | 163 (41.1%) | 234 (58.9%) |
| College/Associate Degree | 451 (86.1%) | 73 (13.9%) |
| Bachelor's Degree or higher | 1,374 (84.3%) | 256 (15.7%) |
Occupancy by Age of Householder in Indian Wells
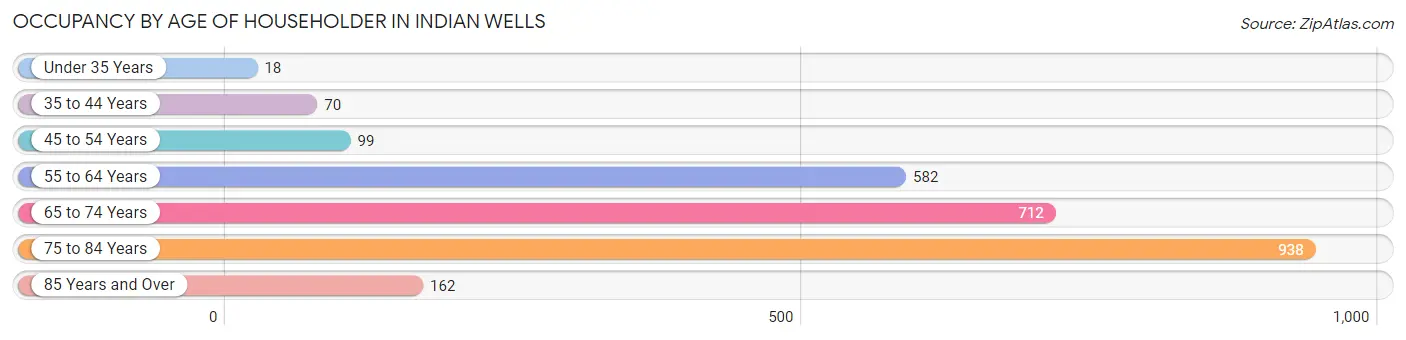
| Age Bracket | # Households | % Households |
| Under 35 Years | 18 | 0.7% |
| 35 to 44 Years | 70 | 2.7% |
| 45 to 54 Years | 99 | 3.8% |
| 55 to 64 Years | 582 | 22.6% |
| 65 to 74 Years | 712 | 27.6% |
| 75 to 84 Years | 938 | 36.3% |
| 85 Years and Over | 162 | 6.3% |
| Total | 2,581 | 100.0% |
Housing Finances in Indian Wells
Median Income by Occupancy in Indian Wells
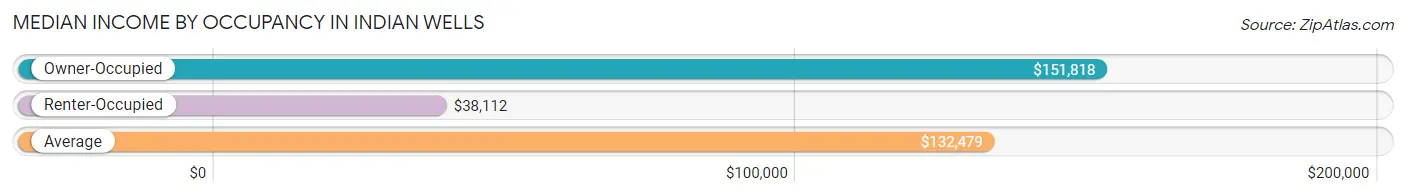
| Occupancy Type | # Households | Median Income |
| Owner-Occupied | 2,010 (77.9%) | $151,818 |
| Renter-Occupied | 571 (22.1%) | $38,112 |
| Average | 2,581 (100.0%) | $132,479 |
Occupancy by Householder Income Bracket in Indian Wells
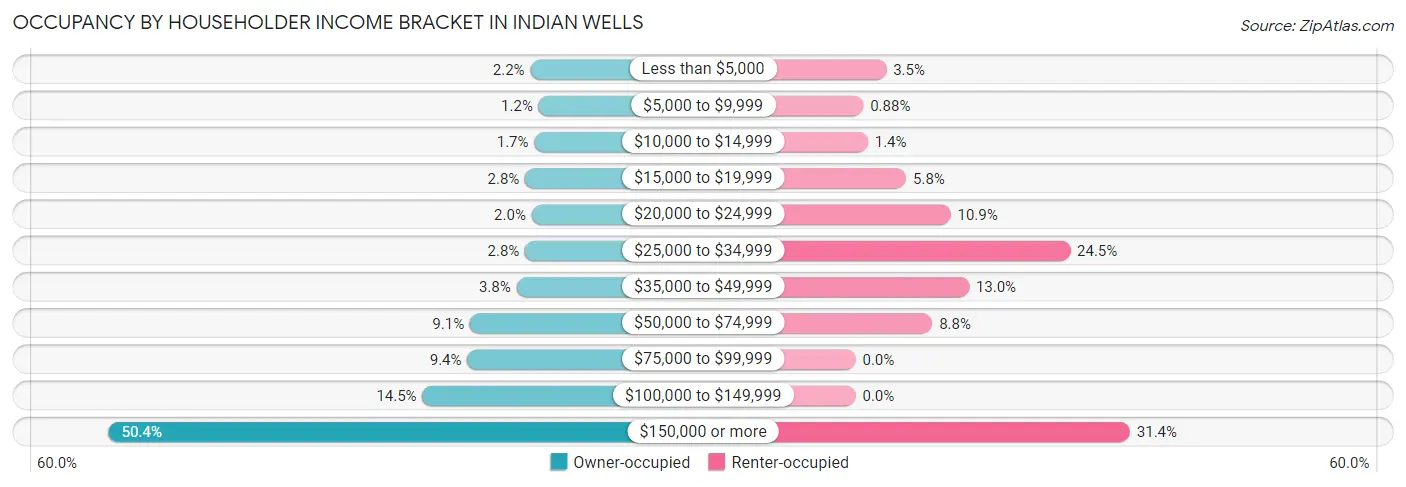
| Income Bracket | Owner-occupied | Renter-occupied |
| Less than $5,000 | 44 (2.2%) | 20 (3.5%) |
| $5,000 to $9,999 | 25 (1.2%) | 5 (0.9%) |
| $10,000 to $14,999 | 35 (1.7%) | 8 (1.4%) |
| $15,000 to $19,999 | 56 (2.8%) | 33 (5.8%) |
| $20,000 to $24,999 | 41 (2.0%) | 62 (10.9%) |
| $25,000 to $34,999 | 56 (2.8%) | 140 (24.5%) |
| $35,000 to $49,999 | 76 (3.8%) | 74 (13.0%) |
| $50,000 to $74,999 | 183 (9.1%) | 50 (8.8%) |
| $75,000 to $99,999 | 189 (9.4%) | 0 (0.0%) |
| $100,000 to $149,999 | 292 (14.5%) | 0 (0.0%) |
| $150,000 or more | 1,013 (50.4%) | 179 (31.4%) |
| Total | 2,010 (100.0%) | 571 (100.0%) |
Monthly Housing Cost Tiers in Indian Wells
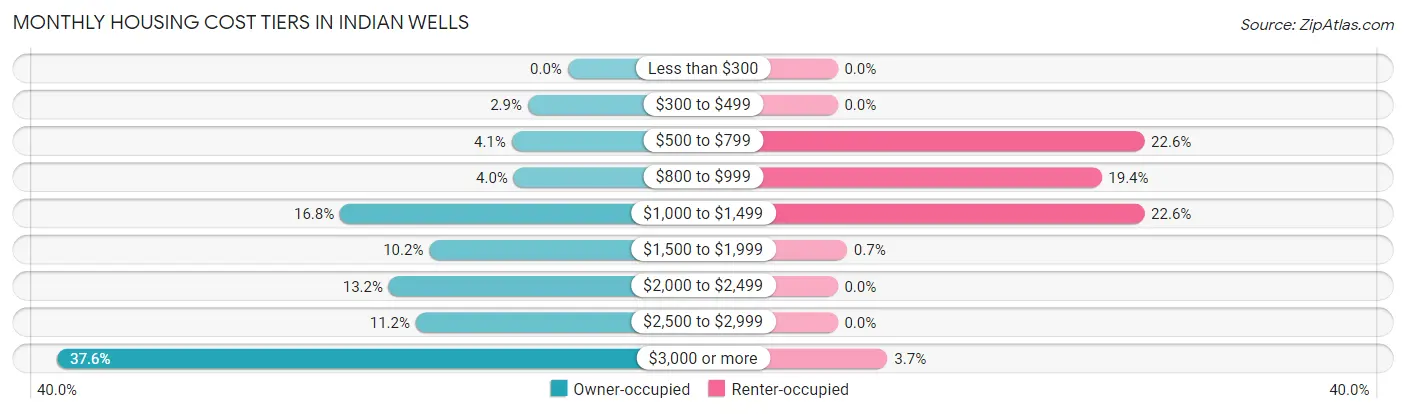
| Monthly Cost | Owner-occupied | Renter-occupied |
| Less than $300 | 0 (0.0%) | 0 (0.0%) |
| $300 to $499 | 59 (2.9%) | 0 (0.0%) |
| $500 to $799 | 83 (4.1%) | 129 (22.6%) |
| $800 to $999 | 80 (4.0%) | 111 (19.4%) |
| $1,000 to $1,499 | 337 (16.8%) | 129 (22.6%) |
| $1,500 to $1,999 | 205 (10.2%) | 4 (0.7%) |
| $2,000 to $2,499 | 265 (13.2%) | 0 (0.0%) |
| $2,500 to $2,999 | 225 (11.2%) | 0 (0.0%) |
| $3,000 or more | 756 (37.6%) | 21 (3.7%) |
| Total | 2,010 (100.0%) | 571 (100.0%) |
Physical Housing Characteristics in Indian Wells
Housing Structures in Indian Wells
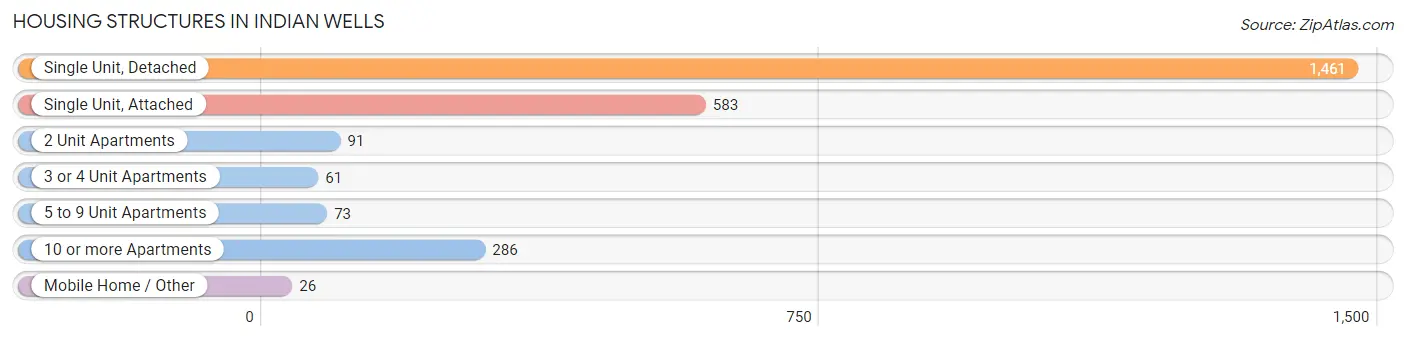
| Structure Type | # Housing Units | % Housing Units |
| Single Unit, Detached | 1,461 | 56.6% |
| Single Unit, Attached | 583 | 22.6% |
| 2 Unit Apartments | 91 | 3.5% |
| 3 or 4 Unit Apartments | 61 | 2.4% |
| 5 to 9 Unit Apartments | 73 | 2.8% |
| 10 or more Apartments | 286 | 11.1% |
| Mobile Home / Other | 26 | 1.0% |
| Total | 2,581 | 100.0% |
Housing Structures by Occupancy in Indian Wells
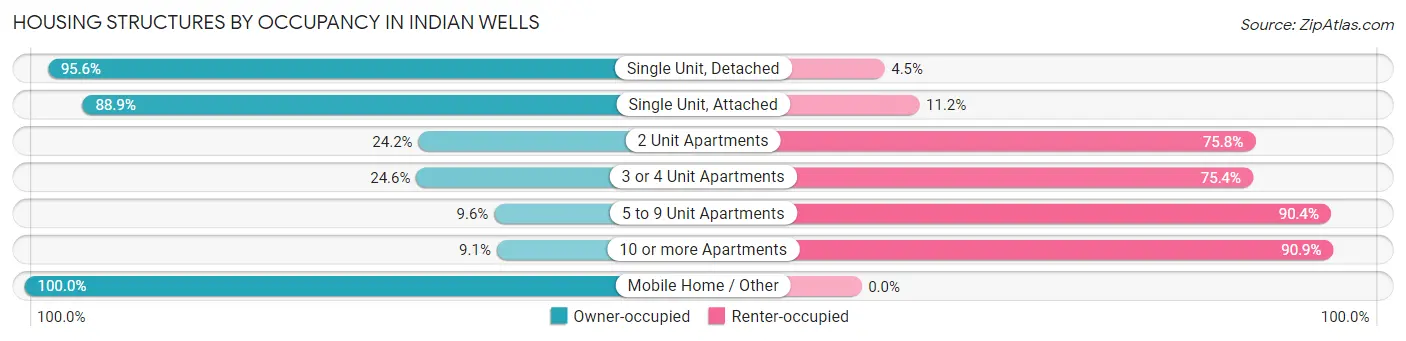
| Structure Type | Owner-occupied | Renter-occupied |
| Single Unit, Detached | 1,396 (95.6%) | 65 (4.4%) |
| Single Unit, Attached | 518 (88.8%) | 65 (11.2%) |
| 2 Unit Apartments | 22 (24.2%) | 69 (75.8%) |
| 3 or 4 Unit Apartments | 15 (24.6%) | 46 (75.4%) |
| 5 to 9 Unit Apartments | 7 (9.6%) | 66 (90.4%) |
| 10 or more Apartments | 26 (9.1%) | 260 (90.9%) |
| Mobile Home / Other | 26 (100.0%) | 0 (0.0%) |
| Total | 2,010 (77.9%) | 571 (22.1%) |
Housing Structures by Number of Rooms in Indian Wells
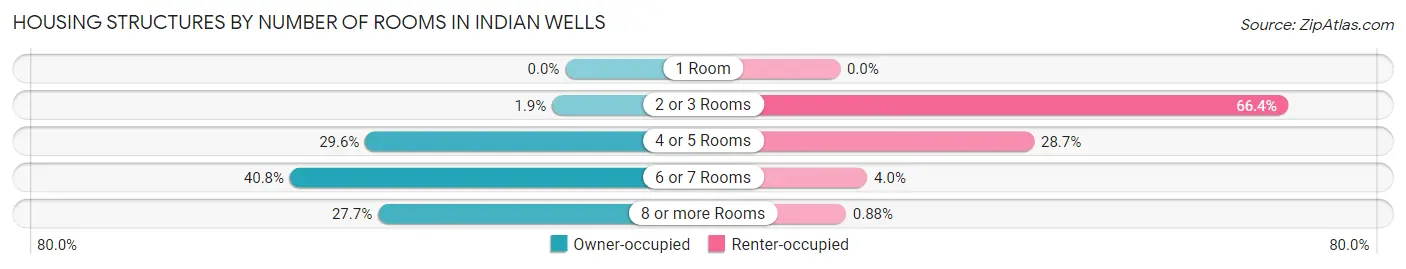
| Number of Rooms | Owner-occupied | Renter-occupied |
| 1 Room | 0 (0.0%) | 0 (0.0%) |
| 2 or 3 Rooms | 39 (1.9%) | 379 (66.4%) |
| 4 or 5 Rooms | 595 (29.6%) | 164 (28.7%) |
| 6 or 7 Rooms | 819 (40.7%) | 23 (4.0%) |
| 8 or more Rooms | 557 (27.7%) | 5 (0.9%) |
| Total | 2,010 (100.0%) | 571 (100.0%) |
Housing Structure by Heating Type in Indian Wells
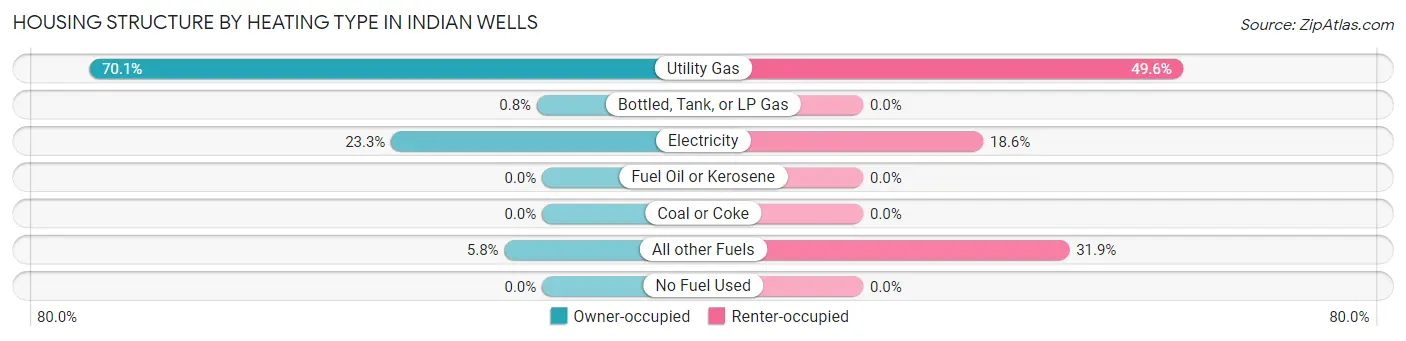
| Heating Type | Owner-occupied | Renter-occupied |
| Utility Gas | 1,408 (70.1%) | 283 (49.6%) |
| Bottled, Tank, or LP Gas | 16 (0.8%) | 0 (0.0%) |
| Electricity | 469 (23.3%) | 106 (18.6%) |
| Fuel Oil or Kerosene | 0 (0.0%) | 0 (0.0%) |
| Coal or Coke | 0 (0.0%) | 0 (0.0%) |
| All other Fuels | 117 (5.8%) | 182 (31.9%) |
| No Fuel Used | 0 (0.0%) | 0 (0.0%) |
| Total | 2,010 (100.0%) | 571 (100.0%) |
Household Vehicle Usage in Indian Wells
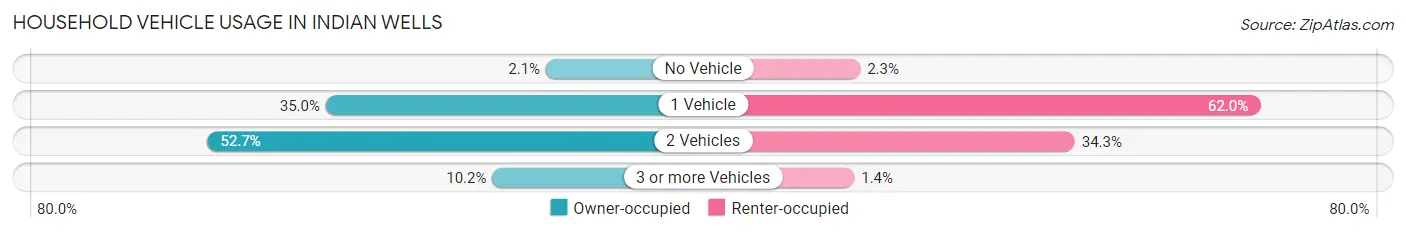
| Vehicles per Household | Owner-occupied | Renter-occupied |
| No Vehicle | 43 (2.1%) | 13 (2.3%) |
| 1 Vehicle | 704 (35.0%) | 354 (62.0%) |
| 2 Vehicles | 1,059 (52.7%) | 196 (34.3%) |
| 3 or more Vehicles | 204 (10.2%) | 8 (1.4%) |
| Total | 2,010 (100.0%) | 571 (100.0%) |
Real Estate & Mortgages in Indian Wells
Real Estate and Mortgage Overview in Indian Wells
| Characteristic | Without Mortgage | With Mortgage |
| Housing Units | 1,182 | 828 |
| Median Property Value | $996,500 | $892,600 |
| Median Household Income | $166,875 | $391 |
| Monthly Housing Costs | $1,501 | $577 |
| Real Estate Taxes | $9,748 | $0 |
Property Value by Mortgage Status in Indian Wells
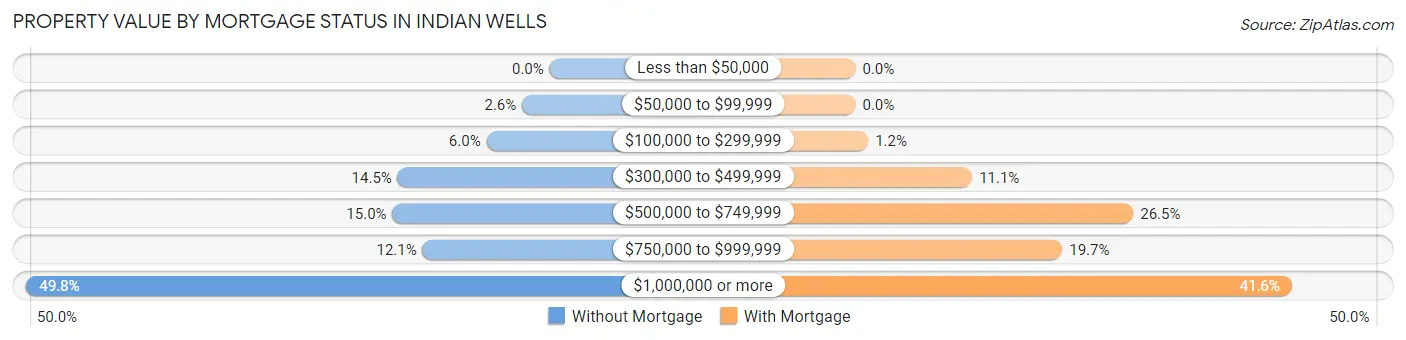
| Property Value | Without Mortgage | With Mortgage |
| Less than $50,000 | 0 (0.0%) | 0 (0.0%) |
| $50,000 to $99,999 | 31 (2.6%) | 0 (0.0%) |
| $100,000 to $299,999 | 71 (6.0%) | 10 (1.2%) |
| $300,000 to $499,999 | 171 (14.5%) | 92 (11.1%) |
| $500,000 to $749,999 | 177 (15.0%) | 219 (26.5%) |
| $750,000 to $999,999 | 143 (12.1%) | 163 (19.7%) |
| $1,000,000 or more | 589 (49.8%) | 344 (41.5%) |
| Total | 1,182 (100.0%) | 828 (100.0%) |
Household Income by Mortgage Status in Indian Wells
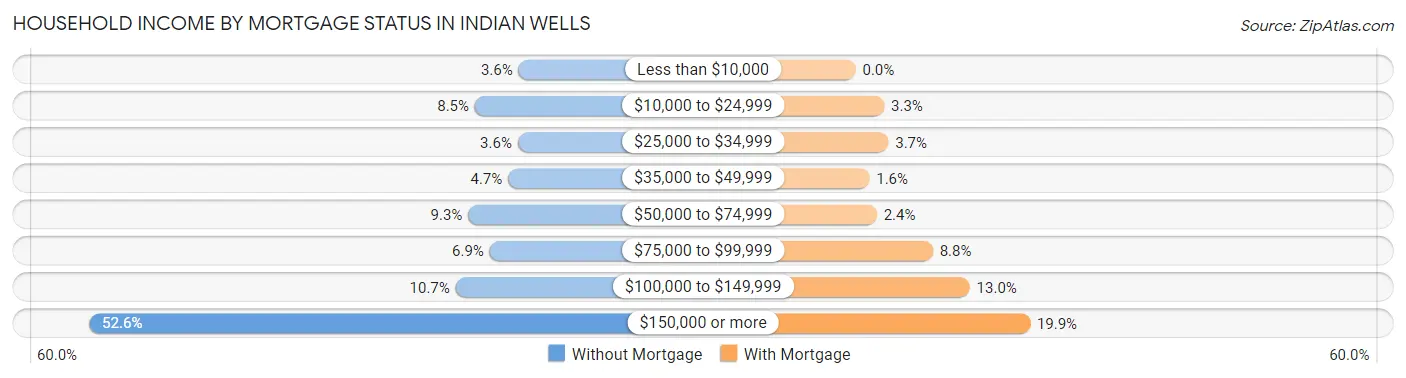
| Household Income | Without Mortgage | With Mortgage |
| Less than $10,000 | 42 (3.5%) | 0 (0.0%) |
| $10,000 to $24,999 | 101 (8.5%) | 27 (3.3%) |
| $25,000 to $34,999 | 43 (3.6%) | 31 (3.7%) |
| $35,000 to $49,999 | 56 (4.7%) | 13 (1.6%) |
| $50,000 to $74,999 | 110 (9.3%) | 20 (2.4%) |
| $75,000 to $99,999 | 81 (6.9%) | 73 (8.8%) |
| $100,000 to $149,999 | 127 (10.7%) | 108 (13.0%) |
| $150,000 or more | 622 (52.6%) | 165 (19.9%) |
| Total | 1,182 (100.0%) | 828 (100.0%) |
Property Value to Household Income Ratio in Indian Wells
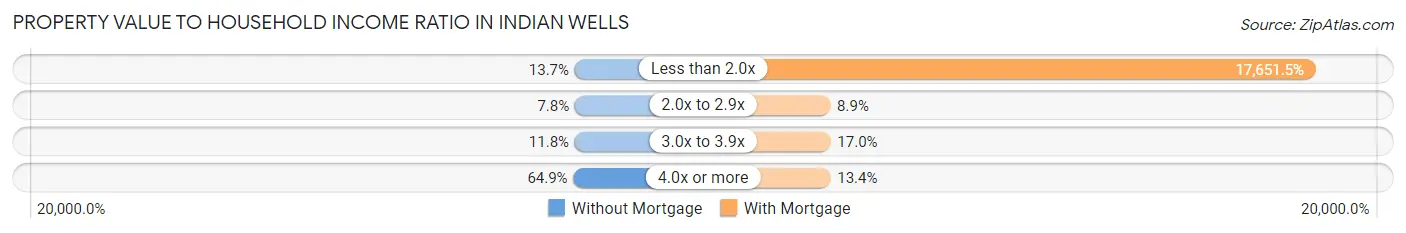
| Value-to-Income Ratio | Without Mortgage | With Mortgage |
| Less than 2.0x | 162 (13.7%) | 146,154 (17,651.4%) |
| 2.0x to 2.9x | 92 (7.8%) | 74 (8.9%) |
| 3.0x to 3.9x | 140 (11.8%) | 141 (17.0%) |
| 4.0x or more | 767 (64.9%) | 111 (13.4%) |
| Total | 1,182 (100.0%) | 828 (100.0%) |
Real Estate Taxes by Mortgage Status in Indian Wells
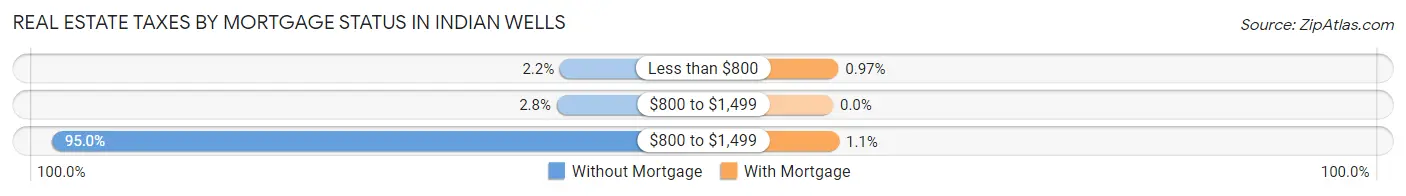
| Property Taxes | Without Mortgage | With Mortgage |
| Less than $800 | 26 (2.2%) | 8 (1.0%) |
| $800 to $1,499 | 33 (2.8%) | 0 (0.0%) |
| $800 to $1,499 | 1,123 (95.0%) | 9 (1.1%) |
| Total | 1,182 (100.0%) | 828 (100.0%) |
Health & Disability in Indian Wells
Health Insurance Coverage by Age in Indian Wells
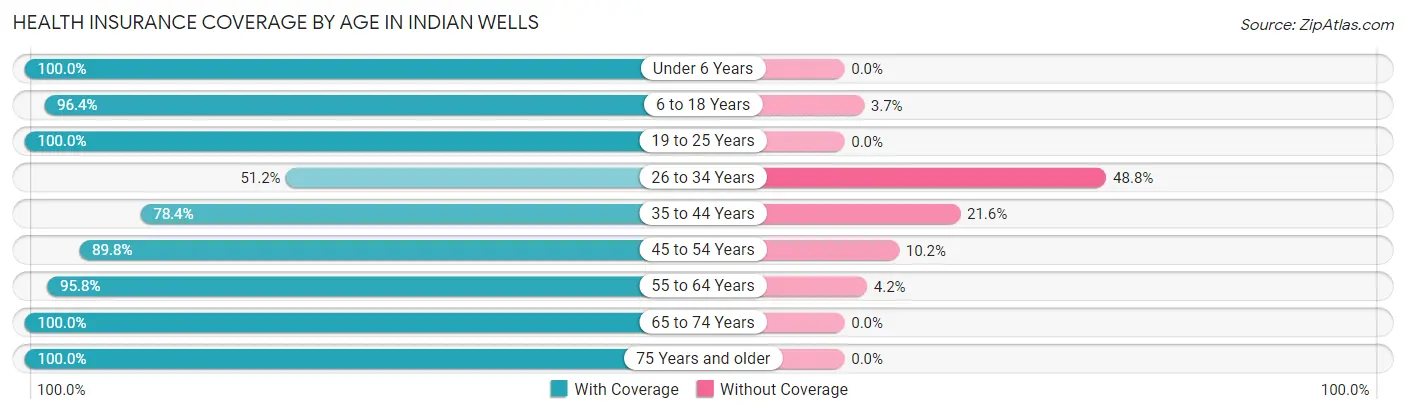
| Age Bracket | With Coverage | Without Coverage |
| Under 6 Years | 87 (100.0%) | 0 (0.0%) |
| 6 to 18 Years | 211 (96.4%) | 8 (3.6%) |
| 19 to 25 Years | 27 (100.0%) | 0 (0.0%) |
| 26 to 34 Years | 109 (51.2%) | 104 (48.8%) |
| 35 to 44 Years | 109 (78.4%) | 30 (21.6%) |
| 45 to 54 Years | 168 (89.8%) | 19 (10.2%) |
| 55 to 64 Years | 1,137 (95.8%) | 50 (4.2%) |
| 65 to 74 Years | 1,270 (100.0%) | 0 (0.0%) |
| 75 Years and older | 1,501 (100.0%) | 0 (0.0%) |
| Total | 4,619 (95.6%) | 211 (4.4%) |
Health Insurance Coverage by Citizenship Status in Indian Wells
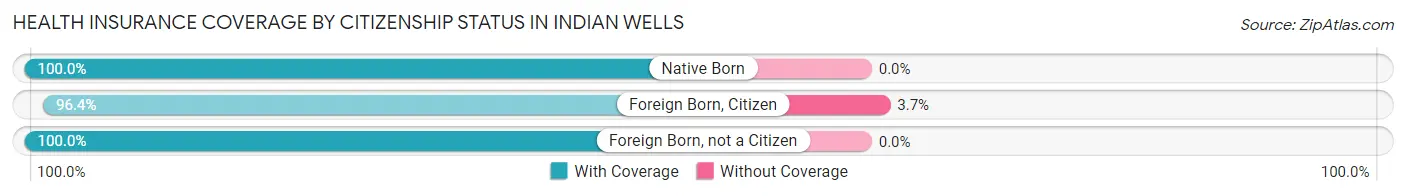
| Citizenship Status | With Coverage | Without Coverage |
| Native Born | 87 (100.0%) | 0 (0.0%) |
| Foreign Born, Citizen | 211 (96.4%) | 8 (3.6%) |
| Foreign Born, not a Citizen | 27 (100.0%) | 0 (0.0%) |
Health Insurance Coverage by Household Income in Indian Wells
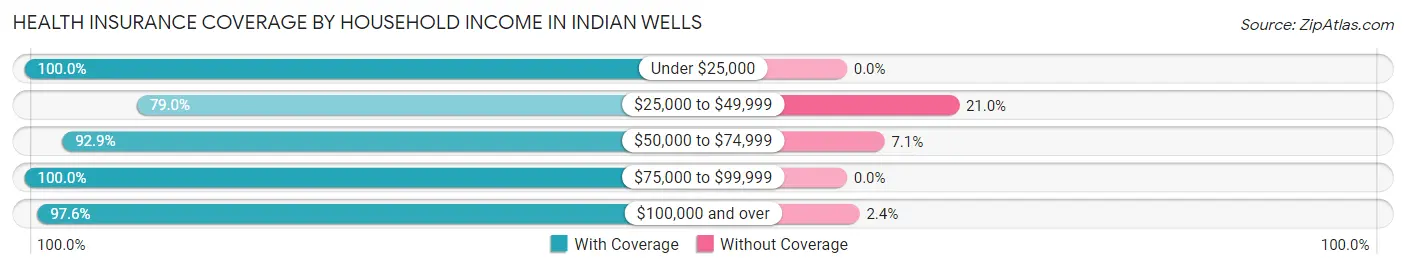
| Household Income | With Coverage | Without Coverage |
| Under $25,000 | 397 (100.0%) | 0 (0.0%) |
| $25,000 to $49,999 | 421 (79.0%) | 112 (21.0%) |
| $50,000 to $74,999 | 316 (92.9%) | 24 (7.1%) |
| $75,000 to $99,999 | 387 (100.0%) | 0 (0.0%) |
| $100,000 and over | 3,090 (97.6%) | 75 (2.4%) |
Public vs Private Health Insurance Coverage by Age in Indian Wells
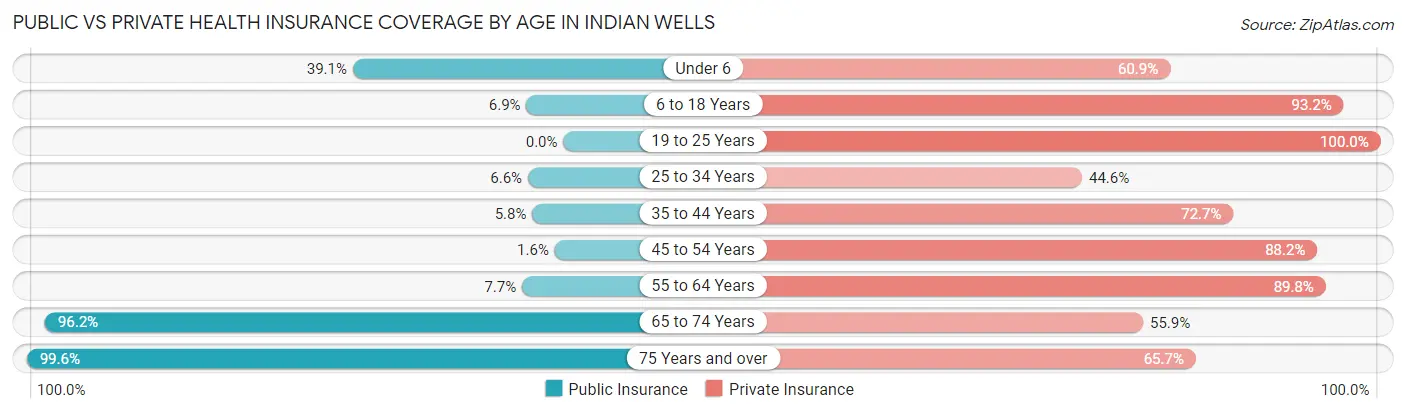
| Age Bracket | Public Insurance | Private Insurance |
| Under 6 | 34 (39.1%) | 53 (60.9%) |
| 6 to 18 Years | 15 (6.9%) | 204 (93.1%) |
| 19 to 25 Years | 0 (0.0%) | 27 (100.0%) |
| 25 to 34 Years | 14 (6.6%) | 95 (44.6%) |
| 35 to 44 Years | 8 (5.8%) | 101 (72.7%) |
| 45 to 54 Years | 3 (1.6%) | 165 (88.2%) |
| 55 to 64 Years | 91 (7.7%) | 1,066 (89.8%) |
| 65 to 74 Years | 1,222 (96.2%) | 710 (55.9%) |
| 75 Years and over | 1,495 (99.6%) | 986 (65.7%) |
| Total | 2,882 (59.7%) | 3,407 (70.5%) |
Disability Status by Sex by Age in Indian Wells
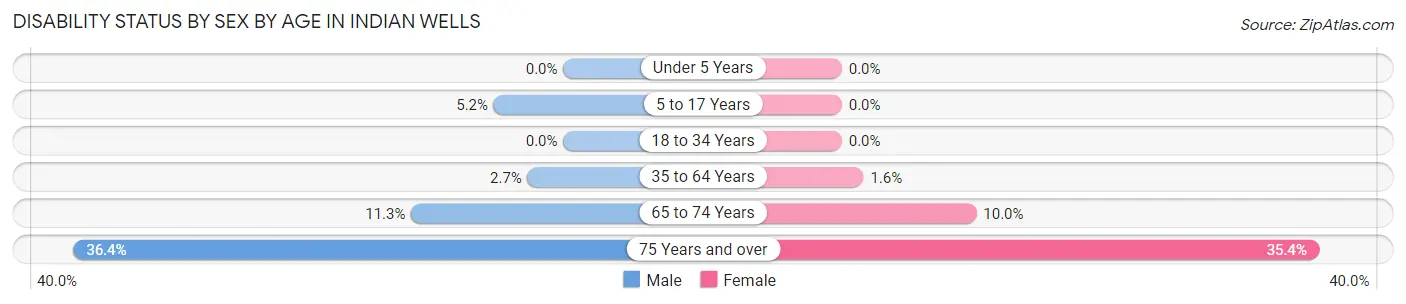
| Age Bracket | Male | Female |
| Under 5 Years | 0 (0.0%) | 0 (0.0%) |
| 5 to 17 Years | 8 (5.2%) | 0 (0.0%) |
| 18 to 34 Years | 0 (0.0%) | 0 (0.0%) |
| 35 to 64 Years | 17 (2.6%) | 14 (1.6%) |
| 65 to 74 Years | 62 (11.3%) | 72 (10.0%) |
| 75 Years and over | 283 (36.4%) | 256 (35.4%) |
Disability Class by Sex by Age in Indian Wells
Disability Class: Hearing Difficulty
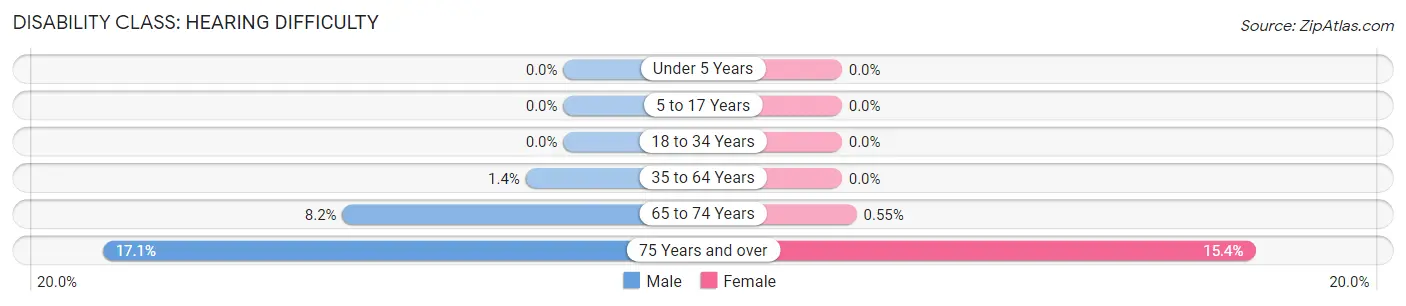
| Age Bracket | Male | Female |
| Under 5 Years | 0 (0.0%) | 0 (0.0%) |
| 5 to 17 Years | 0 (0.0%) | 0 (0.0%) |
| 18 to 34 Years | 0 (0.0%) | 0 (0.0%) |
| 35 to 64 Years | 9 (1.4%) | 0 (0.0%) |
| 65 to 74 Years | 45 (8.2%) | 4 (0.5%) |
| 75 Years and over | 133 (17.1%) | 111 (15.3%) |
Disability Class: Vision Difficulty
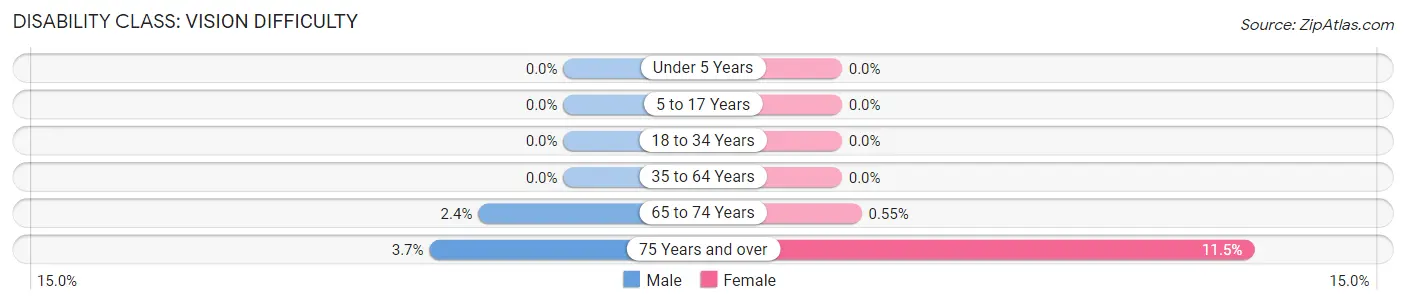
| Age Bracket | Male | Female |
| Under 5 Years | 0 (0.0%) | 0 (0.0%) |
| 5 to 17 Years | 0 (0.0%) | 0 (0.0%) |
| 18 to 34 Years | 0 (0.0%) | 0 (0.0%) |
| 35 to 64 Years | 0 (0.0%) | 0 (0.0%) |
| 65 to 74 Years | 13 (2.4%) | 4 (0.5%) |
| 75 Years and over | 29 (3.7%) | 83 (11.5%) |
Disability Class: Cognitive Difficulty
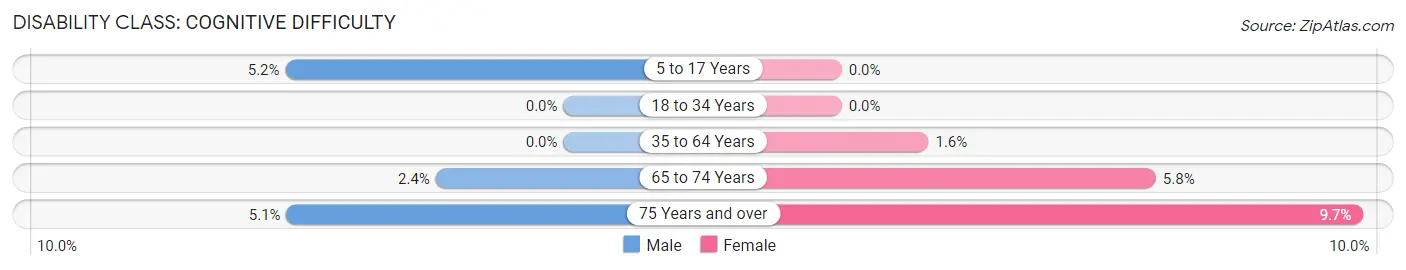
| Age Bracket | Male | Female |
| 5 to 17 Years | 8 (5.2%) | 0 (0.0%) |
| 18 to 34 Years | 0 (0.0%) | 0 (0.0%) |
| 35 to 64 Years | 0 (0.0%) | 14 (1.6%) |
| 65 to 74 Years | 13 (2.4%) | 42 (5.8%) |
| 75 Years and over | 40 (5.1%) | 70 (9.7%) |
Disability Class: Ambulatory Difficulty
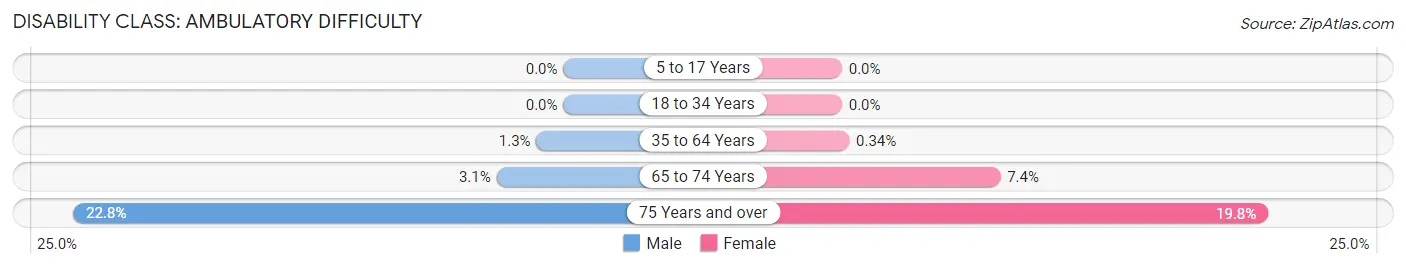
| Age Bracket | Male | Female |
| 5 to 17 Years | 0 (0.0%) | 0 (0.0%) |
| 18 to 34 Years | 0 (0.0%) | 0 (0.0%) |
| 35 to 64 Years | 8 (1.3%) | 3 (0.3%) |
| 65 to 74 Years | 17 (3.1%) | 53 (7.3%) |
| 75 Years and over | 177 (22.8%) | 143 (19.8%) |
Disability Class: Self-Care Difficulty
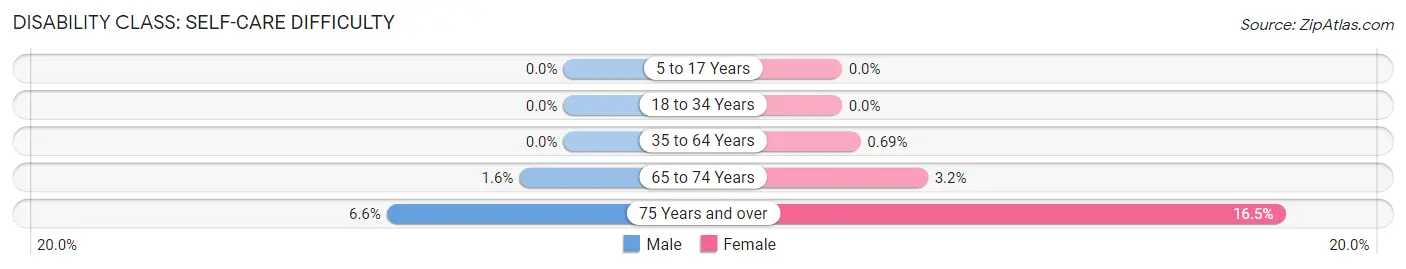
| Age Bracket | Male | Female |
| 5 to 17 Years | 0 (0.0%) | 0 (0.0%) |
| 18 to 34 Years | 0 (0.0%) | 0 (0.0%) |
| 35 to 64 Years | 0 (0.0%) | 6 (0.7%) |
| 65 to 74 Years | 9 (1.6%) | 23 (3.2%) |
| 75 Years and over | 51 (6.6%) | 119 (16.5%) |
Technology Access in Indian Wells
Computing Device Access in Indian Wells
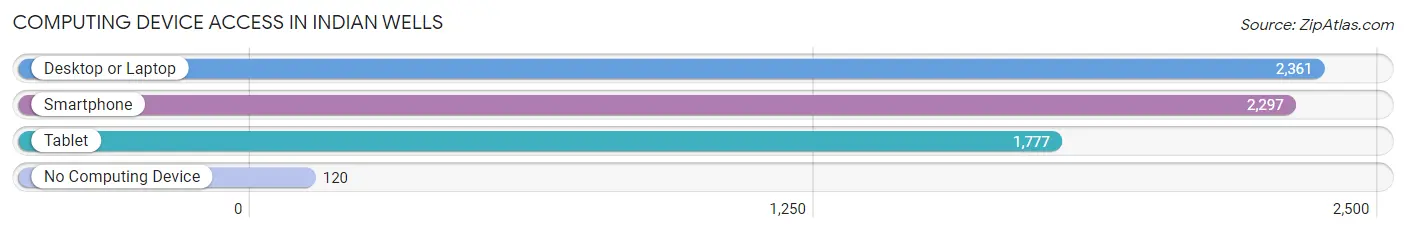
| Device Type | # Households | % Households |
| Desktop or Laptop | 2,361 | 91.5% |
| Smartphone | 2,297 | 89.0% |
| Tablet | 1,777 | 68.9% |
| No Computing Device | 120 | 4.6% |
| Total | 2,581 | 100.0% |
Internet Access in Indian Wells
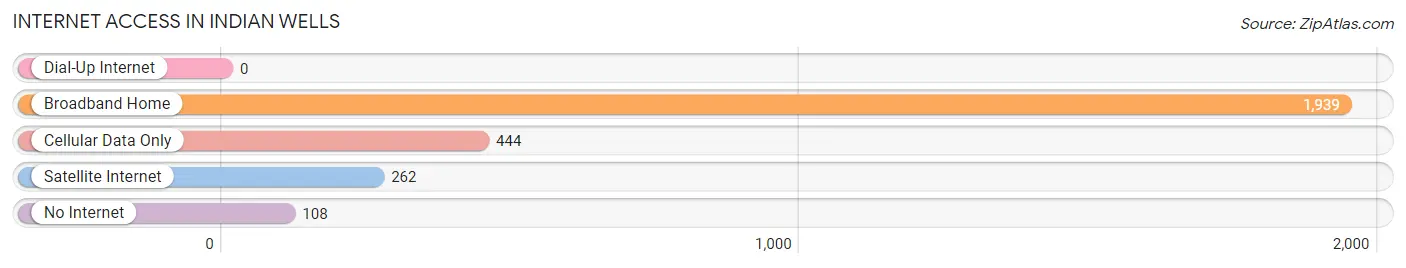
| Internet Type | # Households | % Households |
| Dial-Up Internet | 0 | 0.0% |
| Broadband Home | 1,939 | 75.1% |
| Cellular Data Only | 444 | 17.2% |
| Satellite Internet | 262 | 10.2% |
| No Internet | 108 | 4.2% |
| Total | 2,581 | 100.0% |
Indian Wells Summary
History
Indian Wells is a city located in Riverside County, California, United States. It is located in the Coachella Valley, in the lower Colorado Desert. The city was incorporated in 1967 and is known for its luxury resorts, golf courses, and tennis tournaments.
The area that is now Indian Wells was originally inhabited by the Cahuilla Indians, who were the original inhabitants of the Coachella Valley. The Cahuilla Indians were hunter-gatherers who lived in small villages and subsisted on the local plants and animals. The Cahuilla Indians were known for their basket weaving and pottery making.
In the late 19th century, the area was settled by homesteaders and ranchers. The first homesteader in the area was John McCallum, who settled in the area in 1876. The area was known as McCallum's Wells until the early 20th century, when it was renamed Indian Wells.
In the early 20th century, the area began to attract tourists and vacationers. The first hotel in the area was the Indian Wells Hotel, which opened in 1921. The hotel was a popular destination for Hollywood celebrities and other wealthy visitors.
In the 1950s, the area began to attract golfers and tennis players. The first golf course in the area was the Indian Wells Country Club, which opened in 1954. The Indian Wells Tennis Garden opened in 1981 and has since become one of the most prestigious tennis tournaments in the world.
Geography
Indian Wells is located in the Coachella Valley, in the lower Colorado Desert. The city is bordered by the cities of Palm Desert to the west, La Quinta to the north, and Indio to the east. The city is located at an elevation of approximately 250 feet (76 m) above sea level.
The city has a total area of 8.3 square miles (21.5 km2), of which 8.2 square miles (21.3 km2) is land and 0.1 square miles (0.2 km2) is water. The city is located in the Sonoran Desert, and the climate is hot and dry. The average high temperature in the summer is over 100°F (38°C), and the average low temperature in the winter is around 50°F (10°C).
Economy
Indian Wells is a popular destination for tourists and vacationers, and the city’s economy is largely based on tourism. The city is home to several luxury resorts, golf courses, and tennis tournaments. The Indian Wells Tennis Garden is one of the most prestigious tennis tournaments in the world, and it attracts thousands of visitors each year.
The city is also home to several corporate headquarters, including the headquarters of the Professional Golfers’ Association of America. The city is also home to several technology companies, including the software company Oracle.
Demographics
As of the 2010 census, the population of Indian Wells was 5,165. The racial makeup of the city was 87.2% White, 0.7% African American, 0.3% Native American, 4.2% Asian, 0.1% Pacific Islander, 4.2% from other races, and 3.3% from two or more races. Hispanic or Latino of any race were 11.2% of the population.
The median income for a household in the city was $87,917, and the median income for a family was $103,917. The per capita income for the city was $50,917. About 4.2% of families and 5.7% of the population were below the poverty line, including 6.2% of those under age 18 and 3.3% of those age 65 or over.
Common Questions
What is Per Capita Income in Indian Wells?
Per Capita income in Indian Wells is $127,143.
What is the Median Family Income in Indian Wells?
Median Family Income in Indian Wells is $197,976.
What is the Median Household income in Indian Wells?
Median Household Income in Indian Wells is $132,479.
What is Income or Wage Gap in Indian Wells?
Income or Wage Gap in Indian Wells is 32.0%.
Women in Indian Wells earn 68.0 cents for every dollar earned by a man.
What is Inequality or Gini Index in Indian Wells?
Inequality or Gini Index in Indian Wells is 0.59.
What is the Total Population of Indian Wells?
Total Population of Indian Wells is 4,832.
What is the Total Male Population of Indian Wells?
Total Male Population of Indian Wells is 2,345.
What is the Total Female Population of Indian Wells?
Total Female Population of Indian Wells is 2,487.
What is the Ratio of Males per 100 Females in Indian Wells?
There are 94.29 Males per 100 Females in Indian Wells.
What is the Ratio of Females per 100 Males in Indian Wells?
There are 106.06 Females per 100 Males in Indian Wells.
What is the Median Population Age in Indian Wells?
Median Population Age in Indian Wells is 68.3 Years.
What is the Average Family Size in Indian Wells
Average Family Size in Indian Wells is 2.3 People.
What is the Average Household Size in Indian Wells
Average Household Size in Indian Wells is 1.9 People.
How Large is the Labor Force in Indian Wells?
There are 1,748 People in the Labor Forcein in Indian Wells.
What is the Percentage of People in the Labor Force in Indian Wells?
38.3% of People are in the Labor Force in Indian Wells.
What is the Unemployment Rate in Indian Wells?
Unemployment Rate in Indian Wells is 6.4%.