Cities with the Lowest Poverty Level Among Seniors Over the Age of 75 in South Carolina
RELATED REPORTS & OPTIONS
Lowest Poverty | Seniors 75+
South Carolina
Compare Cities
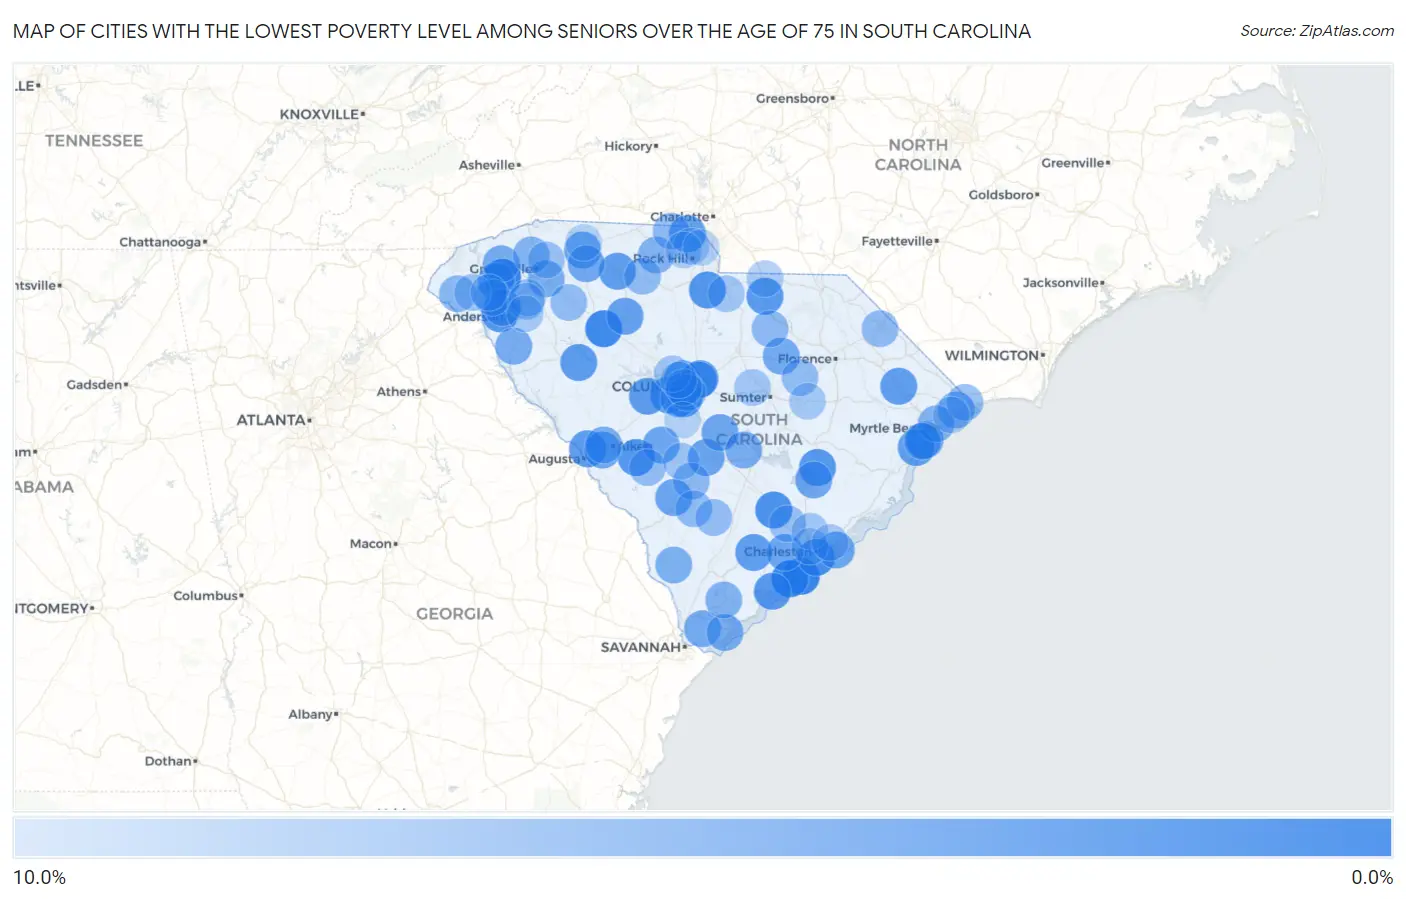
Map of Cities with the Lowest Poverty Level Among Seniors Over the Age of 75 in South Carolina
10.0%
0.0%
Cities with the Lowest Poverty Level Among Seniors Over the Age of 75 in South Carolina
| City | Senior Poverty | vs State | vs National | |
| 1. | Liberty | 0.48% | 11.1%(-10.6)#1 | 11.1%(-10.6)#53 |
| 2. | Kiawah Island | 0.66% | 11.1%(-10.4)#2 | 11.1%(-10.4)#78 |
| 3. | Seabrook Island | 0.84% | 11.1%(-10.3)#3 | 11.1%(-10.2)#115 |
| 4. | Joanna | 0.96% | 11.1%(-10.1)#4 | 11.1%(-10.1)#134 |
| 5. | Carolina Forest | 1.1% | 11.1%(-10.0)#5 | 11.1%(-10.0)#152 |
| 6. | Fripp Island | 1.6% | 11.1%(-9.49)#6 | 11.1%(-9.45)#345 |
| 7. | Ridgeville | 1.8% | 11.1%(-9.32)#7 | 11.1%(-9.28)#416 |
| 8. | James Island | 2.0% | 11.1%(-9.13)#8 | 11.1%(-9.09)#505 |
| 9. | Arcadia Lakes | 2.1% | 11.1%(-8.96)#9 | 11.1%(-8.92)#613 |
| 10. | Pine Ridge | 2.2% | 11.1%(-8.93)#10 | 11.1%(-8.89)#634 |
| 11. | Fort Lawn | 2.2% | 11.1%(-8.93)#11 | 11.1%(-8.89)#637 |
| 12. | Windsor | 2.2% | 11.1%(-8.93)#12 | 11.1%(-8.89)#644 |
| 13. | Centerville | 2.4% | 11.1%(-8.69)#13 | 11.1%(-8.65)#787 |
| 14. | Red Bank | 2.5% | 11.1%(-8.61)#14 | 11.1%(-8.57)#853 |
| 15. | Edisto Beach | 2.5% | 11.1%(-8.61)#15 | 11.1%(-8.57)#861 |
| 16. | St Stephen | 2.6% | 11.1%(-8.54)#16 | 11.1%(-8.50)#898 |
| 17. | Jefferson | 2.6% | 11.1%(-8.51)#17 | 11.1%(-8.47)#928 |
| 18. | Surfside Beach | 2.7% | 11.1%(-8.42)#18 | 11.1%(-8.38)#987 |
| 19. | Belvedere | 2.7% | 11.1%(-8.37)#19 | 11.1%(-8.33)#1,036 |
| 20. | Ninety Six | 2.9% | 11.1%(-8.25)#20 | 11.1%(-8.21)#1,123 |
| 21. | Summit | 2.9% | 11.1%(-8.17)#21 | 11.1%(-8.13)#1,194 |
| 22. | Jonesville | 3.0% | 11.1%(-8.08)#22 | 11.1%(-8.04)#1,265 |
| 23. | Jacksonboro | 3.0% | 11.1%(-8.08)#23 | 11.1%(-8.04)#1,274 |
| 24. | Aynor | 3.1% | 11.1%(-8.03)#24 | 11.1%(-7.99)#1,304 |
| 25. | Murrells Inlet | 3.2% | 11.1%(-7.96)#25 | 11.1%(-7.92)#1,368 |
| 26. | Lake Wylie | 3.2% | 11.1%(-7.88)#26 | 11.1%(-7.84)#1,418 |
| 27. | St Andrews | 3.2% | 11.1%(-7.87)#27 | 11.1%(-7.83)#1,450 |
| 28. | Whitmire | 3.4% | 11.1%(-7.72)#28 | 11.1%(-7.68)#1,586 |
| 29. | Springdale | 3.5% | 11.1%(-7.56)#29 | 11.1%(-7.52)#1,713 |
| 30. | Keowee Key | 3.7% | 11.1%(-7.45)#30 | 11.1%(-7.41)#1,829 |
| 31. | Olar | 3.7% | 11.1%(-7.40)#31 | 11.1%(-7.36)#1,881 |
| 32. | Edisto | 3.7% | 11.1%(-7.37)#32 | 11.1%(-7.33)#1,905 |
| 33. | Southern Shops | 3.8% | 11.1%(-7.29)#33 | 11.1%(-7.25)#1,986 |
| 34. | Isle Of Palms | 3.8% | 11.1%(-7.26)#34 | 11.1%(-7.22)#2,004 |
| 35. | Norris | 3.8% | 11.1%(-7.26)#35 | 11.1%(-7.22)#2,011 |
| 36. | Salley | 3.8% | 11.1%(-7.26)#36 | 11.1%(-7.22)#2,024 |
| 37. | Ravenel | 3.9% | 11.1%(-7.24)#37 | 11.1%(-7.20)#2,045 |
| 38. | Gloverville | 4.0% | 11.1%(-7.11)#38 | 11.1%(-7.07)#2,169 |
| 39. | Northlake | 4.0% | 11.1%(-7.08)#39 | 11.1%(-7.03)#2,202 |
| 40. | St Matthews | 4.0% | 11.1%(-7.08)#40 | 11.1%(-7.03)#2,203 |
| 41. | Bonneau | 4.1% | 11.1%(-7.03)#41 | 11.1%(-6.99)#2,266 |
| 42. | Roebuck | 4.2% | 11.1%(-6.94)#42 | 11.1%(-6.90)#2,330 |
| 43. | Bishopville | 4.2% | 11.1%(-6.87)#43 | 11.1%(-6.83)#2,414 |
| 44. | Bluffton | 4.4% | 11.1%(-6.67)#44 | 11.1%(-6.63)#2,624 |
| 45. | Ben Avon | 4.5% | 11.1%(-6.65)#45 | 11.1%(-6.61)#2,644 |
| 46. | Pickens | 4.5% | 11.1%(-6.63)#46 | 11.1%(-6.59)#2,655 |
| 47. | Forest Acres | 4.6% | 11.1%(-6.49)#47 | 11.1%(-6.45)#2,813 |
| 48. | Elloree | 4.6% | 11.1%(-6.49)#48 | 11.1%(-6.45)#2,819 |
| 49. | Hilton Head Island | 4.6% | 11.1%(-6.48)#49 | 11.1%(-6.44)#2,830 |
| 50. | Mauldin | 4.7% | 11.1%(-6.44)#50 | 11.1%(-6.40)#2,873 |
| 51. | Lake Secession | 4.7% | 11.1%(-6.43)#51 | 11.1%(-6.39)#2,878 |
| 52. | Graniteville | 4.8% | 11.1%(-6.27)#52 | 11.1%(-6.23)#3,033 |
| 53. | Furman | 4.9% | 11.1%(-6.23)#53 | 11.1%(-6.19)#3,070 |
| 54. | North Myrtle Beach | 5.1% | 11.1%(-5.98)#54 | 11.1%(-5.94)#3,347 |
| 55. | Burton | 5.2% | 11.1%(-5.90)#55 | 11.1%(-5.86)#3,407 |
| 56. | Pendleton | 5.2% | 11.1%(-5.89)#56 | 11.1%(-5.85)#3,418 |
| 57. | South Congaree | 5.3% | 11.1%(-5.84)#57 | 11.1%(-5.80)#3,452 |
| 58. | Sharon | 5.3% | 11.1%(-5.84)#58 | 11.1%(-5.80)#3,486 |
| 59. | Myrtle Beach | 5.3% | 11.1%(-5.82)#59 | 11.1%(-5.78)#3,516 |
| 60. | Travelers Rest | 5.4% | 11.1%(-5.70)#60 | 11.1%(-5.66)#3,619 |
| 61. | Cayce | 5.5% | 11.1%(-5.62)#61 | 11.1%(-5.58)#3,686 |
| 62. | Westminster | 5.7% | 11.1%(-5.38)#62 | 11.1%(-5.34)#3,958 |
| 63. | Litchfield Beach | 5.9% | 11.1%(-5.20)#63 | 11.1%(-5.16)#4,160 |
| 64. | Garden City | 5.9% | 11.1%(-5.16)#64 | 11.1%(-5.12)#4,198 |
| 65. | Clover | 6.0% | 11.1%(-5.09)#65 | 11.1%(-5.05)#4,275 |
| 66. | Bamberg | 6.0% | 11.1%(-5.07)#66 | 11.1%(-5.03)#4,296 |
| 67. | Bethune | 6.1% | 11.1%(-5.05)#67 | 11.1%(-5.01)#4,331 |
| 68. | Ehrhardt | 6.1% | 11.1%(-5.01)#68 | 11.1%(-4.97)#4,367 |
| 69. | Dillon | 6.1% | 11.1%(-4.98)#69 | 11.1%(-4.94)#4,382 |
| 70. | Little River | 6.2% | 11.1%(-4.86)#70 | 11.1%(-4.82)#4,496 |
| 71. | Gray Court | 6.2% | 11.1%(-4.86)#71 | 11.1%(-4.82)#4,533 |
| 72. | Lockhart | 6.2% | 11.1%(-4.86)#72 | 11.1%(-4.82)#4,548 |
| 73. | Lynchburg | 6.2% | 11.1%(-4.86)#73 | 11.1%(-4.82)#4,565 |
| 74. | East Camden | 6.3% | 11.1%(-4.80)#74 | 11.1%(-4.76)#4,604 |
| 75. | Williston | 6.5% | 11.1%(-4.66)#75 | 11.1%(-4.62)#4,744 |
| 76. | Williams | 6.5% | 11.1%(-4.66)#76 | 11.1%(-4.62)#4,775 |
| 77. | West Pelzer | 6.5% | 11.1%(-4.59)#77 | 11.1%(-4.55)#4,839 |
| 78. | Summerville | 6.7% | 11.1%(-4.42)#78 | 11.1%(-4.38)#5,033 |
| 79. | Taylors | 6.8% | 11.1%(-4.32)#79 | 11.1%(-4.28)#5,106 |
| 80. | Williamston | 6.8% | 11.1%(-4.26)#80 | 11.1%(-4.22)#5,157 |
| 81. | Seneca | 7.1% | 11.1%(-4.01)#81 | 11.1%(-3.96)#5,415 |
| 82. | Norway | 7.1% | 11.1%(-3.96)#82 | 11.1%(-3.92)#5,474 |
| 83. | Elgin | 7.2% | 11.1%(-3.93)#83 | 11.1%(-3.89)#5,513 |
| 84. | Hanahan | 7.2% | 11.1%(-3.91)#84 | 11.1%(-3.87)#5,523 |
| 85. | Oakland | 7.2% | 11.1%(-3.91)#85 | 11.1%(-3.87)#5,533 |
| 86. | Irmo | 7.2% | 11.1%(-3.89)#86 | 11.1%(-3.85)#5,553 |
| 87. | Charleston | 7.4% | 11.1%(-3.69)#87 | 11.1%(-3.65)#5,752 |
| 88. | West Columbia | 7.4% | 11.1%(-3.68)#88 | 11.1%(-3.64)#5,760 |
| 89. | India Hook | 7.5% | 11.1%(-3.62)#89 | 11.1%(-3.58)#5,800 |
| 90. | Turbeville | 7.5% | 11.1%(-3.61)#90 | 11.1%(-3.57)#5,821 |
| 91. | Belton | 7.7% | 11.1%(-3.42)#91 | 11.1%(-3.37)#5,956 |
| 92. | Pageland | 7.7% | 11.1%(-3.36)#92 | 11.1%(-3.32)#6,061 |
| 93. | Mount Pleasant | 7.8% | 11.1%(-3.34)#93 | 11.1%(-3.30)#6,080 |
| 94. | Clemson | 8.0% | 11.1%(-3.15)#94 | 11.1%(-3.11)#6,227 |
| 95. | Newport | 8.0% | 11.1%(-3.12)#95 | 11.1%(-3.08)#6,255 |
| 96. | Briarcliffe Acres | 8.0% | 11.1%(-3.11)#96 | 11.1%(-3.07)#6,279 |
| 97. | Fort Mill | 8.4% | 11.1%(-2.69)#97 | 11.1%(-2.65)#6,714 |
| 98. | Swansea | 8.5% | 11.1%(-2.60)#98 | 11.1%(-2.56)#6,800 |
| 99. | Boiling Springs | 8.6% | 11.1%(-2.55)#99 | 11.1%(-2.51)#6,833 |
| 100. | Seven Oaks | 8.6% | 11.1%(-2.53)#100 | 11.1%(-2.48)#6,866 |
Common Questions
What are the Top 10 Cities with the Lowest Poverty Level Among Seniors Over the Age of 75 in South Carolina?
Top 10 Cities with the Lowest Poverty Level Among Seniors Over the Age of 75 in South Carolina are:
#1
0.48%
#2
0.66%
#3
0.84%
#4
0.96%
#5
1.8%
#6
2.0%
#7
2.1%
#8
2.2%
#9
2.2%
#10
2.2%
What city has the Lowest Poverty Level Among Seniors Over the Age of 75 in South Carolina?
Liberty has the Lowest Poverty Level Among Seniors Over the Age of 75 in South Carolina with 0.48%.
What is the Poverty Level Among Seniors Over the Age of 75 in the State of South Carolina?
Poverty Level Among Seniors Over the Age of 75 in South Carolina is 11.1%.
What is the Poverty Level Among Seniors Over the Age of 75 in the United States?
Poverty Level Among Seniors Over the Age of 75 in the United States is 11.1%.