Cities with the Lowest Poverty Level Among Seniors Over the Age of 75 in the United States
RELATED REPORTS & OPTIONS
Lowest Poverty | Seniors 75+
United States
Compare Cities
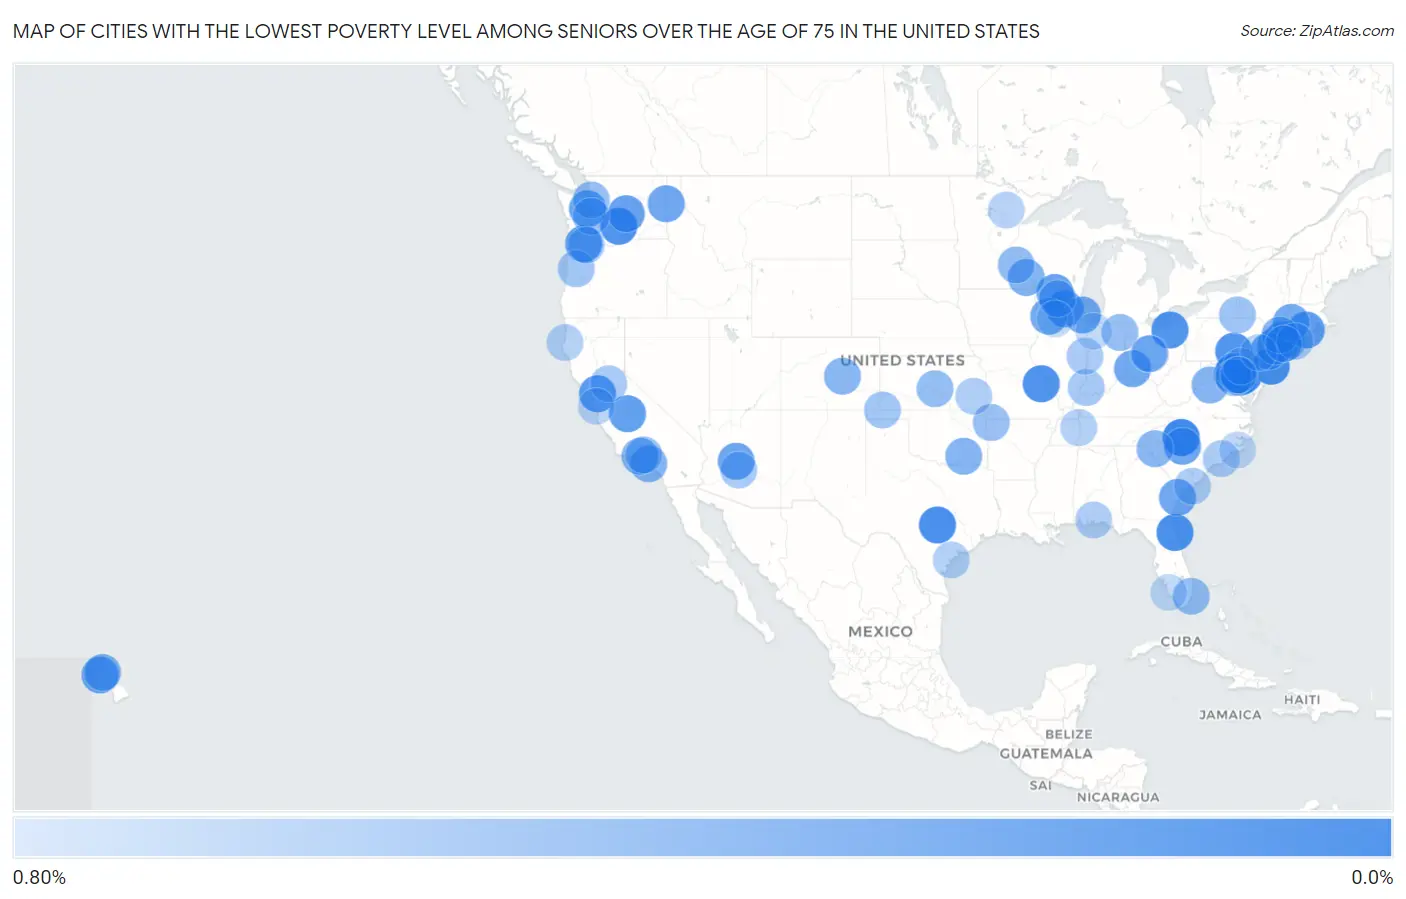
Map of Cities with the Lowest Poverty Level Among Seniors Over the Age of 75 in the United States
0.80%
0.0%
Cities with the Lowest Poverty Level Among Seniors Over the Age of 75 in the United States
| City | Senior Poverty | vs State | vs National | |
| 1. | Annapolis Neck | 0.078% | 9.8%(-9.73)#1 | 11.1%(-11.0)#1 |
| 2. | Travilah | 0.097% | 9.8%(-9.71)#2 | 11.1%(-11.0)#2 |
| 3. | Davidson | 0.10% | 11.2%(-11.1)#1 | 11.1%(-11.0)#3 |
| 4. | Lanham | 0.14% | 9.8%(-9.67)#3 | 11.1%(-10.9)#4 |
| 5. | Pomona | 0.14% | 10.7%(-10.5)#1 | 11.1%(-10.9)#5 |
| 6. | Bee Cave | 0.15% | 12.7%(-12.5)#1 | 11.1%(-10.9)#6 |
| 7. | St Augustine Beach | 0.16% | 11.8%(-11.6)#1 | 11.1%(-10.9)#7 |
| 8. | Terrace Heights | 0.17% | 8.9%(-8.76)#1 | 11.1%(-10.9)#8 |
| 9. | Pacific | 0.17% | 10.5%(-10.4)#1 | 11.1%(-10.9)#9 |
| 10. | Hopelawn | 0.17% | 10.7%(-10.5)#2 | 11.1%(-10.9)#10 |
| 11. | Schlusser | 0.19% | 10.1%(-9.92)#1 | 11.1%(-10.9)#11 |
| 12. | Independence | 0.19% | 9.7%(-9.55)#1 | 11.1%(-10.9)#12 |
| 13. | Glenolden Borough | 0.20% | 10.1%(-9.91)#2 | 11.1%(-10.9)#13 |
| 14. | Manorhaven | 0.22% | 13.6%(-13.4)#1 | 11.1%(-10.8)#14 |
| 15. | Bloomingdale Borough | 0.23% | 10.7%(-10.4)#3 | 11.1%(-10.8)#15 |
| 16. | Scappoose | 0.25% | 9.6%(-9.34)#1 | 11.1%(-10.8)#16 |
| 17. | Clayton | 0.25% | 12.3%(-12.1)#1 | 11.1%(-10.8)#17 |
| 18. | Plainedge | 0.26% | 13.6%(-13.3)#2 | 11.1%(-10.8)#18 |
| 19. | Braddock | 0.26% | 9.2%(-8.93)#1 | 11.1%(-10.8)#19 |
| 20. | Conning Towers Nautilus Park | 0.27% | 8.8%(-8.55)#1 | 11.1%(-10.8)#20 |
| 21. | South Beloit | 0.27% | 10.4%(-10.1)#1 | 11.1%(-10.8)#21 |
| 22. | Old Fig Garden | 0.28% | 12.3%(-12.0)#2 | 11.1%(-10.8)#22 |
| 23. | Upper Saddle River Borough | 0.28% | 10.7%(-10.4)#4 | 11.1%(-10.8)#23 |
| 24. | Quincy | 0.30% | 8.9%(-8.62)#2 | 11.1%(-10.8)#24 |
| 25. | Prairie Du Sac | 0.31% | 9.4%(-9.11)#1 | 11.1%(-10.8)#25 |
| 26. | Bethel | 0.32% | 8.9%(-8.61)#3 | 11.1%(-10.8)#26 |
| 27. | Lanai City | 0.32% | 8.1%(-7.81)#1 | 11.1%(-10.7)#27 |
| 28. | Mercerville | 0.32% | 10.7%(-10.3)#5 | 11.1%(-10.7)#28 |
| 29. | Black Canyon City | 0.33% | 10.1%(-9.74)#1 | 11.1%(-10.7)#29 |
| 30. | Montgomery | 0.34% | 11.0%(-10.6)#1 | 11.1%(-10.7)#30 |
| 31. | Waxhaw | 0.34% | 11.2%(-10.9)#2 | 11.1%(-10.7)#31 |
| 32. | Otis Orchards East Farms | 0.35% | 8.9%(-8.57)#4 | 11.1%(-10.7)#32 |
| 33. | Glencoe | 0.35% | 10.4%(-10.1)#2 | 11.1%(-10.7)#33 |
| 34. | Landen | 0.35% | 9.7%(-9.39)#2 | 11.1%(-10.7)#34 |
| 35. | Pines Lake | 0.36% | 10.7%(-10.3)#6 | 11.1%(-10.7)#35 |
| 36. | South Amboy | 0.37% | 10.7%(-10.3)#7 | 11.1%(-10.7)#36 |
| 37. | Savanna | 0.37% | 10.4%(-10.0)#3 | 11.1%(-10.7)#37 |
| 38. | Northwest Harwinton | 0.37% | 8.8%(-8.45)#2 | 11.1%(-10.7)#38 |
| 39. | Morris Plains Borough | 0.42% | 10.7%(-10.2)#8 | 11.1%(-10.7)#39 |
| 40. | Goodview | 0.42% | 9.5%(-9.07)#1 | 11.1%(-10.6)#40 |
| 41. | West Athens | 0.42% | 12.3%(-11.9)#3 | 11.1%(-10.6)#41 |
| 42. | Napili Honokowai | 0.43% | 8.1%(-7.70)#2 | 11.1%(-10.6)#42 |
| 43. | Demarest Borough | 0.44% | 10.7%(-10.2)#9 | 11.1%(-10.6)#43 |
| 44. | Fillmore | 0.44% | 12.3%(-11.9)#4 | 11.1%(-10.6)#44 |
| 45. | Verona | 0.45% | 9.4%(-8.96)#2 | 11.1%(-10.6)#45 |
| 46. | Atoka | 0.45% | 9.7%(-9.26)#1 | 11.1%(-10.6)#46 |
| 47. | Massanetta Springs | 0.46% | 9.2%(-8.74)#2 | 11.1%(-10.6)#47 |
| 48. | Mayo | 0.46% | 9.8%(-9.35)#4 | 11.1%(-10.6)#48 |
| 49. | Valley Cottage | 0.46% | 13.6%(-13.1)#3 | 11.1%(-10.6)#49 |
| 50. | Cimarron Hills | 0.47% | 8.9%(-8.41)#1 | 11.1%(-10.6)#50 |
| 51. | Woodcliff Lake Borough | 0.48% | 10.7%(-10.2)#10 | 11.1%(-10.6)#51 |
| 52. | Marlboro Village | 0.48% | 9.8%(-9.32)#5 | 11.1%(-10.6)#52 |
| 53. | Liberty | 0.48% | 11.1%(-10.6)#1 | 11.1%(-10.6)#53 |
| 54. | Worthington | 0.48% | 9.7%(-9.26)#3 | 11.1%(-10.6)#54 |
| 55. | Happy Valley | 0.51% | 12.3%(-11.8)#5 | 11.1%(-10.6)#55 |
| 56. | Ellsworth | 0.52% | 9.4%(-8.89)#3 | 11.1%(-10.5)#56 |
| 57. | Sterling | 0.53% | 9.7%(-9.17)#1 | 11.1%(-10.5)#57 |
| 58. | Bal Harbour | 0.54% | 11.8%(-11.3)#2 | 11.1%(-10.5)#58 |
| 59. | Huntertown | 0.54% | 9.0%(-8.46)#1 | 11.1%(-10.5)#59 |
| 60. | Picnic Point | 0.54% | 8.9%(-8.38)#5 | 11.1%(-10.5)#60 |
| 61. | Frederickson | 0.55% | 8.9%(-8.37)#6 | 11.1%(-10.5)#61 |
| 62. | Cave Springs | 0.56% | 11.1%(-10.5)#1 | 11.1%(-10.5)#62 |
| 63. | Tashua | 0.56% | 8.8%(-8.26)#3 | 11.1%(-10.5)#63 |
| 64. | Big Flats | 0.58% | 13.6%(-13.0)#4 | 11.1%(-10.5)#64 |
| 65. | Castaic | 0.58% | 12.3%(-11.7)#6 | 11.1%(-10.5)#65 |
| 66. | Elkhart | 0.60% | 9.7%(-9.10)#2 | 11.1%(-10.5)#66 |
| 67. | Redland | 0.60% | 9.8%(-9.21)#6 | 11.1%(-10.5)#67 |
| 68. | Cheverly | 0.60% | 9.8%(-9.21)#7 | 11.1%(-10.5)#68 |
| 69. | Philomath | 0.60% | 9.6%(-8.98)#2 | 11.1%(-10.5)#69 |
| 70. | Park Center | 0.60% | 8.9%(-8.29)#2 | 11.1%(-10.5)#70 |
| 71. | Fort Branch | 0.63% | 9.0%(-8.38)#2 | 11.1%(-10.4)#71 |
| 72. | Lake Barcroft | 0.63% | 9.2%(-8.56)#3 | 11.1%(-10.4)#72 |
| 73. | Georgetown | 0.64% | 10.4%(-9.77)#4 | 11.1%(-10.4)#73 |
| 74. | Felida | 0.64% | 8.9%(-8.28)#7 | 11.1%(-10.4)#74 |
| 75. | Rancho Murieta | 0.64% | 12.3%(-11.7)#7 | 11.1%(-10.4)#75 |
| 76. | Paradise Valley | 0.64% | 10.1%(-9.42)#2 | 11.1%(-10.4)#76 |
| 77. | Belville | 0.65% | 11.2%(-10.6)#3 | 11.1%(-10.4)#77 |
| 78. | Kiawah Island | 0.66% | 11.1%(-10.4)#2 | 11.1%(-10.4)#78 |
| 79. | Bridgeport Borough | 0.66% | 10.1%(-9.45)#3 | 11.1%(-10.4)#79 |
| 80. | Bagdad | 0.67% | 11.8%(-11.1)#3 | 11.1%(-10.4)#80 |
| 81. | Humboldt | 0.67% | 9.7%(-9.03)#3 | 11.1%(-10.4)#81 |
| 82. | Mays Chapel | 0.67% | 9.8%(-9.13)#8 | 11.1%(-10.4)#82 |
| 83. | Moriches | 0.68% | 13.6%(-12.9)#5 | 11.1%(-10.4)#83 |
| 84. | Camden | 0.68% | 11.1%(-10.5)#1 | 11.1%(-10.4)#84 |
| 85. | Lamar | 0.69% | 12.7%(-12.0)#2 | 11.1%(-10.4)#85 |
| 86. | Humboldt Hill | 0.70% | 12.3%(-11.6)#8 | 11.1%(-10.4)#86 |
| 87. | Nashwauk | 0.70% | 9.5%(-8.79)#2 | 11.1%(-10.4)#87 |
| 88. | Trooper | 0.72% | 10.1%(-9.39)#4 | 11.1%(-10.4)#88 |
| 89. | Villanova | 0.72% | 10.1%(-9.39)#5 | 11.1%(-10.3)#89 |
| 90. | Monte Sereno | 0.73% | 12.3%(-11.6)#9 | 11.1%(-10.3)#90 |
| 91. | Dublin | 0.73% | 9.7%(-9.01)#4 | 11.1%(-10.3)#91 |
| 92. | Lyons | 0.74% | 10.7%(-9.93)#11 | 11.1%(-10.3)#92 |
| 93. | Lynbrook | 0.74% | 13.6%(-12.9)#6 | 11.1%(-10.3)#93 |
| 94. | Newport | 0.75% | 11.2%(-10.5)#4 | 11.1%(-10.3)#94 |
| 95. | Sugarcreek Borough | 0.76% | 10.1%(-9.35)#6 | 11.1%(-10.3)#95 |
| 96. | Lely Resort | 0.76% | 11.8%(-11.0)#4 | 11.1%(-10.3)#96 |
| 97. | Kouts | 0.76% | 9.0%(-8.24)#3 | 11.1%(-10.3)#97 |
| 98. | Seaville | 0.77% | 10.7%(-9.89)#12 | 11.1%(-10.3)#98 |
| 99. | Springdale | 0.77% | 9.8%(-9.03)#9 | 11.1%(-10.3)#99 |
| 100. | Milledgeville | 0.78% | 10.4%(-9.63)#5 | 11.1%(-10.3)#100 |
Common Questions
What are the Top 10 Cities with the Lowest Poverty Level Among Seniors Over the Age of 75 in the United States?
Top 10 Cities with the Lowest Poverty Level Among Seniors Over the Age of 75 in the United States are:
What city has the Lowest Poverty Level Among Seniors Over the Age of 75 in the United States?
Annapolis Neck has the Lowest Poverty Level Among Seniors Over the Age of 75 in the United States with 0.078%.
What is the Poverty Level Among Seniors Over the Age of 75 in the United States?
Poverty Level Among Seniors Over the Age of 75 in the United States is 11.1%.