Cities with the Highest Percentage of Population Employed in Health Diagnosing & Treating in Massachusetts
RELATED REPORTS & OPTIONS
Health Diagnosing & Treating
Massachusetts
Compare Cities
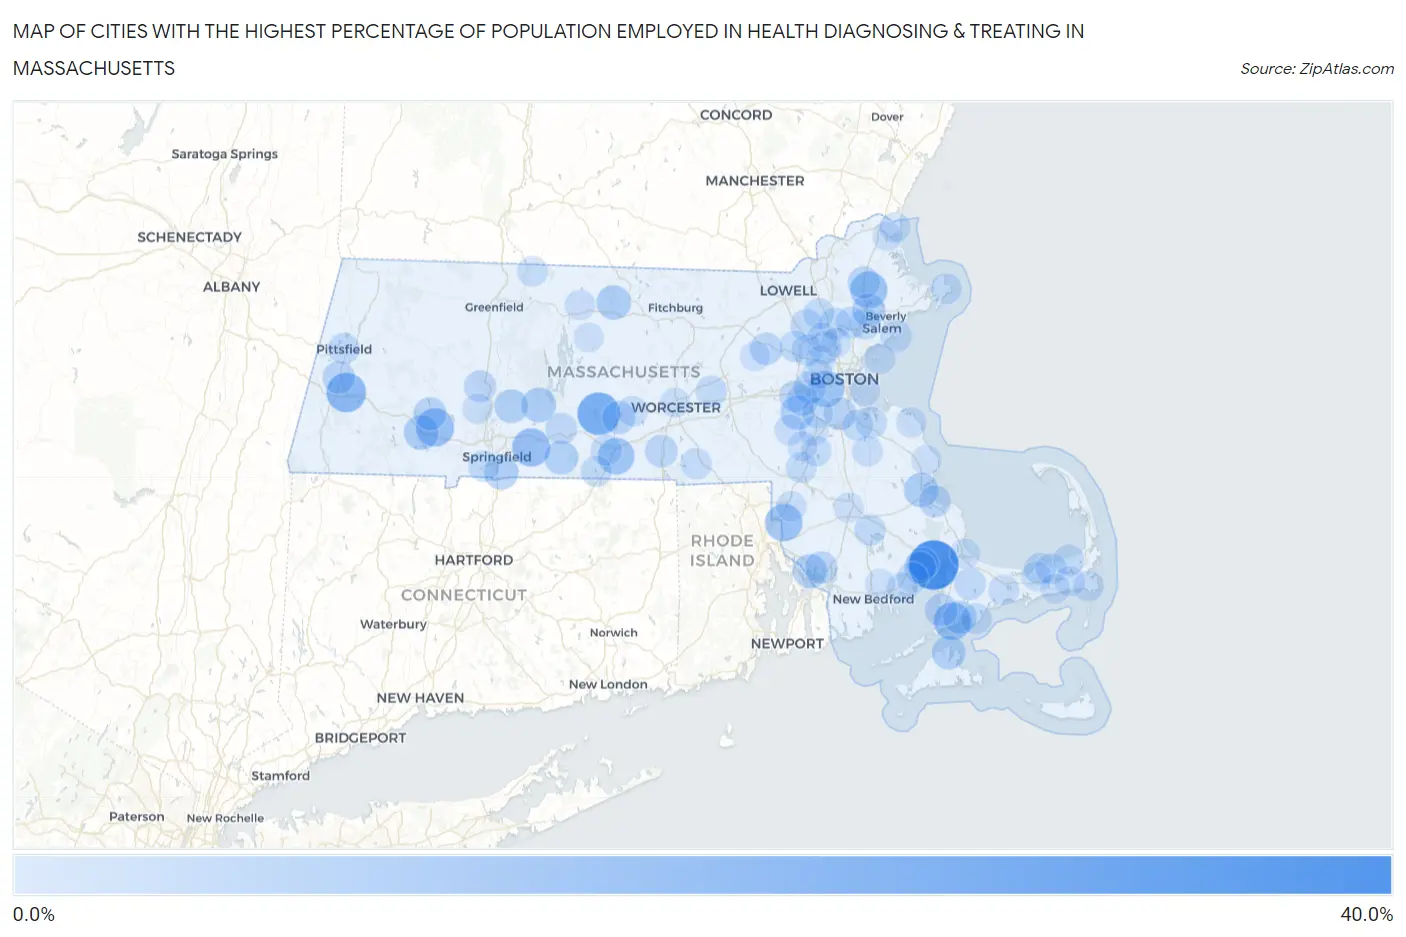
Map of Cities with the Highest Percentage of Population Employed in Health Diagnosing & Treating in Massachusetts
0.0%
40.0%
Cities with the Highest Percentage of Population Employed in Health Diagnosing & Treating in Massachusetts
| City | % Employed | vs State | vs National | |
| 1. | Onset | 31.9% | 6.9%(+25.0)#1 | 6.2%(+25.7)#272 |
| 2. | West Brookfield | 22.8% | 6.9%(+15.9)#2 | 6.2%(+16.6)#561 |
| 3. | Oak Bluffs | 22.3% | 6.9%(+15.4)#3 | 6.2%(+16.1)#586 |
| 4. | Cedar Crest | 20.1% | 6.9%(+13.2)#4 | 6.2%(+13.9)#729 |
| 5. | Lee | 18.8% | 6.9%(+11.9)#5 | 6.2%(+12.5)#859 |
| 6. | Russell | 17.0% | 6.9%(+10.1)#6 | 6.2%(+10.7)#1,091 |
| 7. | Wilbraham | 16.9% | 6.9%(+10.0)#7 | 6.2%(+10.7)#1,093 |
| 8. | Teaticket | 16.3% | 6.9%(+9.41)#8 | 6.2%(+10.1)#1,214 |
| 9. | North Seekonk | 16.1% | 6.9%(+9.19)#9 | 6.2%(+9.85)#1,268 |
| 10. | Topsfield | 15.8% | 6.9%(+8.87)#10 | 6.2%(+9.53)#1,335 |
| 11. | Sturbridge | 15.1% | 6.9%(+8.23)#11 | 6.2%(+8.89)#1,476 |
| 12. | Brookline | 14.7% | 6.9%(+7.79)#12 | 6.2%(+8.45)#1,579 |
| 13. | Blandford | 12.9% | 6.9%(+6.02)#13 | 6.2%(+6.68)#2,231 |
| 14. | Belchertown | 12.7% | 6.9%(+5.75)#14 | 6.2%(+6.41)#2,354 |
| 15. | Baldwinville | 12.4% | 6.9%(+5.54)#15 | 6.2%(+6.20)#2,460 |
| 16. | Kingston | 12.4% | 6.9%(+5.50)#16 | 6.2%(+6.16)#2,475 |
| 17. | Ocean Grove | 12.1% | 6.9%(+5.19)#17 | 6.2%(+5.84)#2,634 |
| 18. | Longmeadow | 12.1% | 6.9%(+5.17)#18 | 6.2%(+5.83)#2,645 |
| 19. | Dover | 12.0% | 6.9%(+5.07)#19 | 6.2%(+5.73)#2,686 |
| 20. | Monson Center | 11.6% | 6.9%(+4.72)#20 | 6.2%(+5.38)#2,881 |
| 21. | Granby | 11.5% | 6.9%(+4.56)#21 | 6.2%(+5.21)#3,014 |
| 22. | Vineyard Haven | 11.4% | 6.9%(+4.52)#22 | 6.2%(+5.18)#3,045 |
| 23. | Danvers | 10.8% | 6.9%(+3.91)#23 | 6.2%(+4.57)#3,462 |
| 24. | East Falmouth | 10.8% | 6.9%(+3.89)#24 | 6.2%(+4.55)#3,475 |
| 25. | East Brookfield | 10.7% | 6.9%(+3.77)#25 | 6.2%(+4.43)#3,572 |
| 26. | Huntington | 10.6% | 6.9%(+3.73)#26 | 6.2%(+4.39)#3,607 |
| 27. | Milton | 10.4% | 6.9%(+3.47)#27 | 6.2%(+4.13)#3,843 |
| 28. | West Falmouth | 10.3% | 6.9%(+3.36)#28 | 6.2%(+4.02)#3,953 |
| 29. | Lenox | 10.2% | 6.9%(+3.26)#29 | 6.2%(+3.91)#4,062 |
| 30. | Newton | 10.1% | 6.9%(+3.18)#30 | 6.2%(+3.84)#4,122 |
| 31. | Winchester | 10.0% | 6.9%(+3.07)#31 | 6.2%(+3.73)#4,251 |
| 32. | Oxford | 9.9% | 6.9%(+3.02)#32 | 6.2%(+3.67)#4,292 |
| 33. | West Concord | 9.7% | 6.9%(+2.84)#33 | 6.2%(+3.49)#4,500 |
| 34. | Somerset | 9.7% | 6.9%(+2.78)#34 | 6.2%(+3.44)#4,554 |
| 35. | Boxford | 9.6% | 6.9%(+2.69)#35 | 6.2%(+3.34)#4,661 |
| 36. | Wareham Center | 9.6% | 6.9%(+2.67)#36 | 6.2%(+3.33)#4,682 |
| 37. | Northampton | 9.3% | 6.9%(+2.39)#37 | 6.2%(+3.05)#5,045 |
| 38. | Plymouth | 9.2% | 6.9%(+2.34)#38 | 6.2%(+2.99)#5,087 |
| 39. | Weweantic | 9.2% | 6.9%(+2.33)#39 | 6.2%(+2.99)#5,093 |
| 40. | Needham | 9.2% | 6.9%(+2.25)#40 | 6.2%(+2.91)#5,198 |
| 41. | Dennis | 9.1% | 6.9%(+2.23)#41 | 6.2%(+2.89)#5,211 |
| 42. | Palmer Town | 9.1% | 6.9%(+2.22)#42 | 6.2%(+2.88)#5,228 |
| 43. | Reading | 9.1% | 6.9%(+2.16)#43 | 6.2%(+2.82)#5,332 |
| 44. | Forestdale | 9.0% | 6.9%(+2.11)#44 | 6.2%(+2.77)#5,406 |
| 45. | Wellesley | 8.9% | 6.9%(+2.03)#45 | 6.2%(+2.69)#5,519 |
| 46. | Pinehurst | 8.9% | 6.9%(+1.97)#46 | 6.2%(+2.63)#5,596 |
| 47. | Pittsfield | 8.8% | 6.9%(+1.87)#47 | 6.2%(+2.53)#5,734 |
| 48. | Marblehead | 8.7% | 6.9%(+1.79)#48 | 6.2%(+2.45)#5,846 |
| 49. | Lexington | 8.7% | 6.9%(+1.79)#49 | 6.2%(+2.45)#5,872 |
| 50. | North Lakeville | 8.6% | 6.9%(+1.74)#50 | 6.2%(+2.40)#5,937 |
| 51. | Weymouth Town | 8.6% | 6.9%(+1.69)#51 | 6.2%(+2.35)#6,024 |
| 52. | Northborough | 8.5% | 6.9%(+1.61)#52 | 6.2%(+2.27)#6,143 |
| 53. | Agawam Town | 8.5% | 6.9%(+1.58)#53 | 6.2%(+2.24)#6,192 |
| 54. | Peabody | 8.5% | 6.9%(+1.58)#54 | 6.2%(+2.23)#6,204 |
| 55. | Lynnfield | 8.5% | 6.9%(+1.57)#55 | 6.2%(+2.22)#6,223 |
| 56. | Hanscom Afb | 8.4% | 6.9%(+1.52)#56 | 6.2%(+2.18)#6,293 |
| 57. | East Dennis | 8.3% | 6.9%(+1.42)#57 | 6.2%(+2.07)#6,457 |
| 58. | Fiskdale | 8.3% | 6.9%(+1.36)#58 | 6.2%(+2.02)#6,541 |
| 59. | Rockport | 8.2% | 6.9%(+1.31)#59 | 6.2%(+1.97)#6,628 |
| 60. | Brewster | 8.2% | 6.9%(+1.30)#60 | 6.2%(+1.96)#6,634 |
| 61. | Braintree Town | 8.2% | 6.9%(+1.28)#61 | 6.2%(+1.94)#6,679 |
| 62. | Foxborough | 8.2% | 6.9%(+1.26)#62 | 6.2%(+1.92)#6,711 |
| 63. | New Seabury | 8.2% | 6.9%(+1.25)#63 | 6.2%(+1.91)#6,726 |
| 64. | East Douglas | 8.2% | 6.9%(+1.25)#64 | 6.2%(+1.91)#6,727 |
| 65. | Wilmington | 8.1% | 6.9%(+1.22)#65 | 6.2%(+1.88)#6,770 |
| 66. | Dedham | 8.1% | 6.9%(+1.20)#66 | 6.2%(+1.85)#6,816 |
| 67. | Holland | 8.1% | 6.9%(+1.19)#67 | 6.2%(+1.85)#6,818 |
| 68. | Marion Center | 8.0% | 6.9%(+1.09)#68 | 6.2%(+1.74)#7,018 |
| 69. | Nahant | 7.9% | 6.9%(+0.993)#69 | 6.2%(+1.65)#7,173 |
| 70. | Salisbury | 7.9% | 6.9%(+0.963)#70 | 6.2%(+1.62)#7,249 |
| 71. | Barnstable Town | 7.8% | 6.9%(+0.930)#71 | 6.2%(+1.59)#7,313 |
| 72. | Mattapoisett Center | 7.8% | 6.9%(+0.923)#72 | 6.2%(+1.58)#7,329 |
| 73. | Medfield | 7.8% | 6.9%(+0.859)#73 | 6.2%(+1.52)#7,448 |
| 74. | West Chatham | 7.8% | 6.9%(+0.856)#74 | 6.2%(+1.52)#7,457 |
| 75. | Abington | 7.7% | 6.9%(+0.799)#75 | 6.2%(+1.46)#7,544 |
| 76. | Spencer | 7.6% | 6.9%(+0.708)#76 | 6.2%(+1.37)#7,769 |
| 77. | Northfield | 7.6% | 6.9%(+0.661)#77 | 6.2%(+1.32)#7,865 |
| 78. | Sharon | 7.6% | 6.9%(+0.653)#78 | 6.2%(+1.31)#7,882 |
| 79. | Athol | 7.5% | 6.9%(+0.588)#79 | 6.2%(+1.25)#8,026 |
| 80. | Harwich Center | 7.5% | 6.9%(+0.580)#80 | 6.2%(+1.24)#8,045 |
| 81. | Attleboro | 7.4% | 6.9%(+0.541)#81 | 6.2%(+1.20)#8,117 |
| 82. | Easthampton Town | 7.3% | 6.9%(+0.440)#82 | 6.2%(+1.10)#8,375 |
| 83. | Boston | 7.3% | 6.9%(+0.440)#83 | 6.2%(+1.10)#8,376 |
| 84. | North Scituate | 7.3% | 6.9%(+0.428)#84 | 6.2%(+1.09)#8,405 |
| 85. | Sagamore | 7.2% | 6.9%(+0.275)#85 | 6.2%(+0.934)#8,736 |
| 86. | Woburn | 7.1% | 6.9%(+0.201)#86 | 6.2%(+0.860)#8,915 |
| 87. | Acushnet Center | 7.1% | 6.9%(+0.189)#87 | 6.2%(+0.848)#8,941 |
| 88. | Marshfield | 7.1% | 6.9%(+0.178)#88 | 6.2%(+0.837)#8,965 |
| 89. | Yarmouth Port | 7.1% | 6.9%(+0.178)#89 | 6.2%(+0.836)#8,966 |
| 90. | Worcester | 7.1% | 6.9%(+0.148)#90 | 6.2%(+0.807)#9,035 |
| 91. | Raynham Center | 7.0% | 6.9%(+0.141)#91 | 6.2%(+0.800)#9,047 |
| 92. | Maynard | 7.0% | 6.9%(+0.118)#92 | 6.2%(+0.776)#9,110 |
| 93. | Newburyport | 7.0% | 6.9%(+0.109)#93 | 6.2%(+0.768)#9,129 |
| 94. | Dennis Port | 7.0% | 6.9%(+0.089)#94 | 6.2%(+0.747)#9,183 |
| 95. | Norwood | 7.0% | 6.9%(+0.076)#95 | 6.2%(+0.734)#9,213 |
| 96. | Watertown Town | 7.0% | 6.9%(+0.062)#96 | 6.2%(+0.720)#9,262 |
| 97. | Walpole | 7.0% | 6.9%(+0.057)#97 | 6.2%(+0.716)#9,278 |
| 98. | Arlington | 6.9% | 6.9%(+0.029)#98 | 6.2%(+0.688)#9,341 |
| 99. | Petersham | 6.9% | 6.9%(-0.007)#99 | 6.2%(+0.652)#9,436 |
| 100. | Stoneham | 6.9% | 6.9%(-0.008)#100 | 6.2%(+0.650)#9,450 |
Common Questions
What are the Top 10 Cities with the Highest Percentage of Population Employed in Health Diagnosing & Treating in Massachusetts?
Top 10 Cities with the Highest Percentage of Population Employed in Health Diagnosing & Treating in Massachusetts are:
#1
31.9%
#2
22.8%
#3
18.8%
#4
17.0%
#5
16.9%
#6
16.3%
#7
16.1%
#8
15.8%
#9
15.1%
#10
14.7%
What city has the Highest Percentage of Population Employed in Health Diagnosing & Treating in Massachusetts?
Onset has the Highest Percentage of Population Employed in Health Diagnosing & Treating in Massachusetts with 31.9%.
What is the Percentage of Population Employed in Health Diagnosing & Treating in the State of Massachusetts?
Percentage of Population Employed in Health Diagnosing & Treating in Massachusetts is 6.9%.
What is the Percentage of Population Employed in Health Diagnosing & Treating in the United States?
Percentage of Population Employed in Health Diagnosing & Treating in the United States is 6.2%.