Cities with the Highest Percentage of Population Employed in Health Diagnosing & Treating in Arkansas
RELATED REPORTS & OPTIONS
Health Diagnosing & Treating
Arkansas
Compare Cities
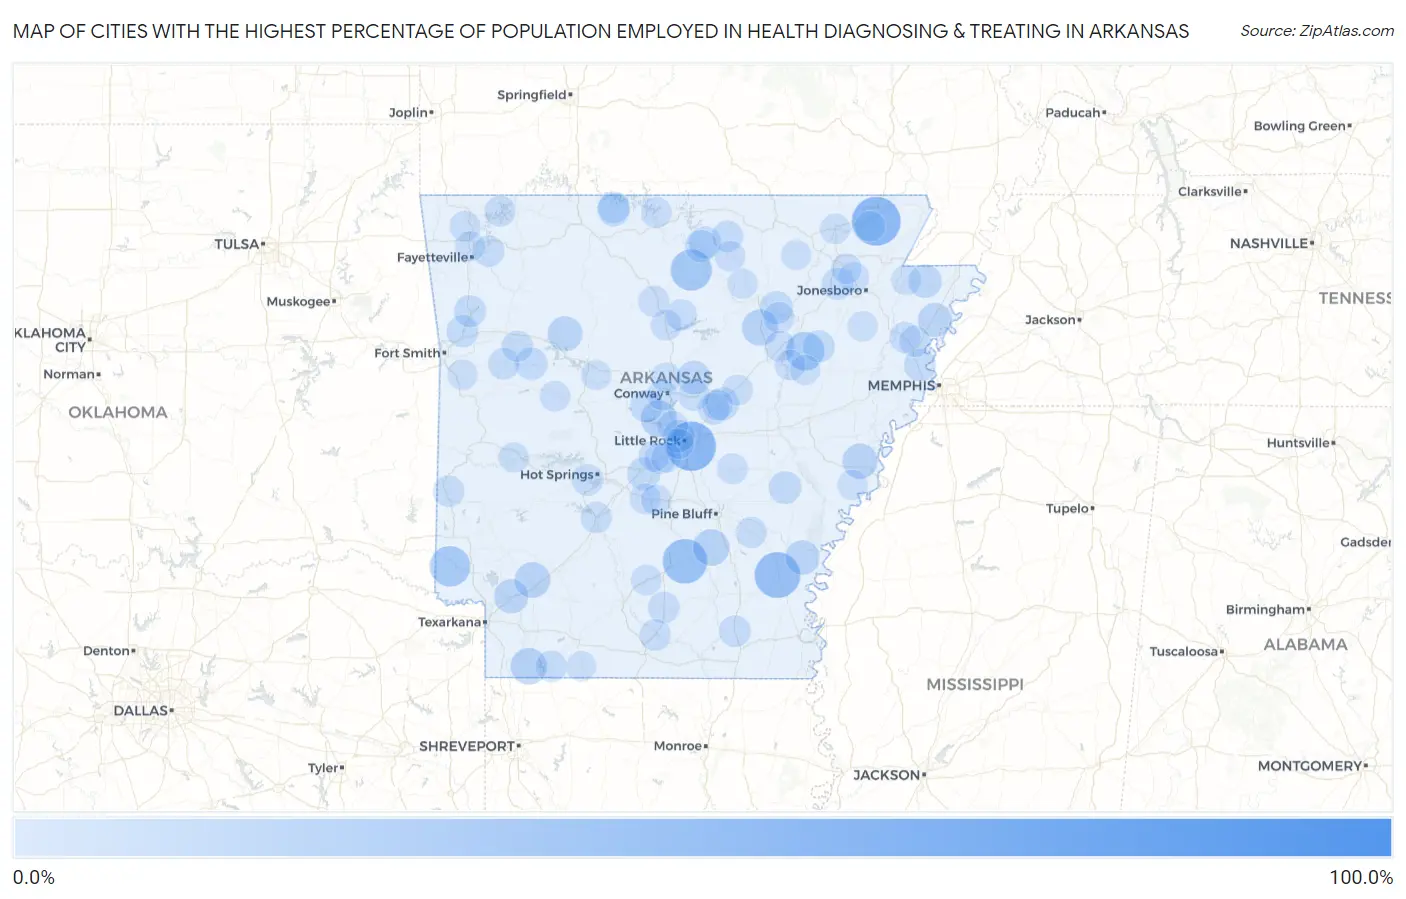
Map of Cities with the Highest Percentage of Population Employed in Health Diagnosing & Treating in Arkansas
0.0%
100.0%
Cities with the Highest Percentage of Population Employed in Health Diagnosing & Treating in Arkansas
| City | % Employed | vs State | vs National | |
| 1. | Edgemont | 100.0% | 7.2%(+92.8)#1 | 6.2%(+93.8)#13 |
| 2. | College Station | 54.2% | 7.2%(+47.0)#2 | 6.2%(+47.9)#61 |
| 3. | Knobel | 52.5% | 7.2%(+45.3)#3 | 6.2%(+46.2)#69 |
| 4. | Acorn | 51.7% | 7.2%(+44.5)#4 | 6.2%(+45.4)#71 |
| 5. | Winchester | 45.5% | 7.2%(+38.3)#5 | 6.2%(+39.2)#104 |
| 6. | Kingsland | 42.8% | 7.2%(+35.6)#6 | 6.2%(+36.6)#123 |
| 7. | Urbana | 41.3% | 7.2%(+34.1)#7 | 6.2%(+35.1)#135 |
| 8. | Alleene | 39.1% | 7.2%(+32.0)#8 | 6.2%(+32.9)#152 |
| 9. | Fifty Six | 35.0% | 7.2%(+27.8)#9 | 6.2%(+28.8)#201 |
| 10. | Crystal Springs | 34.6% | 7.2%(+27.4)#10 | 6.2%(+28.4)#210 |
| 11. | Winthrop | 33.3% | 7.2%(+26.2)#11 | 6.2%(+27.1)#229 |
| 12. | Wesley | 31.6% | 7.2%(+24.5)#12 | 6.2%(+25.4)#279 |
| 13. | Tupelo | 28.9% | 7.2%(+21.8)#13 | 6.2%(+22.7)#320 |
| 14. | Wilburn | 27.6% | 7.2%(+20.5)#14 | 6.2%(+21.4)#359 |
| 15. | Bowman | 27.1% | 7.2%(+19.9)#15 | 6.2%(+20.9)#372 |
| 16. | Bradley | 24.3% | 7.2%(+17.1)#16 | 6.2%(+18.1)#475 |
| 17. | Center Point | 24.2% | 7.2%(+17.1)#17 | 6.2%(+18.0)#480 |
| 18. | Woodlawn | 24.1% | 7.2%(+17.0)#18 | 6.2%(+17.9)#486 |
| 19. | Roland | 23.9% | 7.2%(+16.7)#19 | 6.2%(+17.7)#500 |
| 20. | Pleasant Plains | 23.4% | 7.2%(+16.2)#20 | 6.2%(+17.1)#527 |
| 21. | Oakhaven | 22.6% | 7.2%(+15.4)#21 | 6.2%(+16.3)#574 |
| 22. | Lexa | 21.6% | 7.2%(+14.4)#22 | 6.2%(+15.3)#628 |
| 23. | Lawson | 21.2% | 7.2%(+14.1)#23 | 6.2%(+15.0)#643 |
| 24. | Hagarville | 20.8% | 7.2%(+13.6)#24 | 6.2%(+14.5)#688 |
| 25. | Fulton | 19.7% | 7.2%(+12.6)#25 | 6.2%(+13.5)#777 |
| 26. | Watson | 19.3% | 7.2%(+12.1)#26 | 6.2%(+13.1)#812 |
| 27. | Marie | 18.8% | 7.2%(+11.6)#27 | 6.2%(+12.5)#867 |
| 28. | Enola | 17.7% | 7.2%(+10.5)#28 | 6.2%(+11.5)#985 |
| 29. | Manila | 17.3% | 7.2%(+10.2)#29 | 6.2%(+11.1)#1,031 |
| 30. | Haskell | 16.8% | 7.2%(+9.61)#30 | 6.2%(+10.5)#1,124 |
| 31. | Ward | 16.7% | 7.2%(+9.57)#31 | 6.2%(+10.5)#1,133 |
| 32. | Magness | 16.7% | 7.2%(+9.49)#32 | 6.2%(+10.4)#1,152 |
| 33. | South Lead Hill | 15.8% | 7.2%(+8.61)#33 | 6.2%(+9.54)#1,330 |
| 34. | Almyra | 15.6% | 7.2%(+8.38)#34 | 6.2%(+9.31)#1,384 |
| 35. | Subiaco | 15.4% | 7.2%(+8.21)#35 | 6.2%(+9.14)#1,417 |
| 36. | Bigelow | 15.4% | 7.2%(+8.21)#36 | 6.2%(+9.14)#1,418 |
| 37. | Pineville | 15.0% | 7.2%(+7.82)#37 | 6.2%(+8.76)#1,511 |
| 38. | Cammack Village | 14.9% | 7.2%(+7.71)#38 | 6.2%(+8.64)#1,533 |
| 39. | Calico Rock | 14.9% | 7.2%(+7.70)#39 | 6.2%(+8.63)#1,537 |
| 40. | Clarkedale | 14.8% | 7.2%(+7.58)#40 | 6.2%(+8.51)#1,563 |
| 41. | Rudy | 14.3% | 7.2%(+7.11)#41 | 6.2%(+8.04)#1,714 |
| 42. | Chester | 14.3% | 7.2%(+7.11)#42 | 6.2%(+8.04)#1,720 |
| 43. | Egypt | 14.3% | 7.2%(+7.11)#43 | 6.2%(+8.04)#1,722 |
| 44. | Beedeville | 14.0% | 7.2%(+6.78)#44 | 6.2%(+7.71)#1,818 |
| 45. | Hampton | 13.8% | 7.2%(+6.59)#45 | 6.2%(+7.52)#1,881 |
| 46. | Lead Hill | 13.7% | 7.2%(+6.56)#46 | 6.2%(+7.50)#1,889 |
| 47. | Fountain Hill | 13.7% | 7.2%(+6.52)#47 | 6.2%(+7.45)#1,916 |
| 48. | Caulksville | 13.5% | 7.2%(+6.28)#48 | 6.2%(+7.22)#1,997 |
| 49. | Cabot | 13.3% | 7.2%(+6.11)#49 | 6.2%(+7.05)#2,068 |
| 50. | Rockwell | 13.2% | 7.2%(+6.07)#50 | 6.2%(+7.00)#2,082 |
| 51. | Vilonia | 13.2% | 7.2%(+6.06)#51 | 6.2%(+6.99)#2,084 |
| 52. | Calion | 13.1% | 7.2%(+5.96)#52 | 6.2%(+6.90)#2,124 |
| 53. | Oxford | 13.1% | 7.2%(+5.91)#53 | 6.2%(+6.84)#2,141 |
| 54. | Vandervoort | 13.0% | 7.2%(+5.87)#54 | 6.2%(+6.80)#2,162 |
| 55. | Taylor | 12.9% | 7.2%(+5.67)#55 | 6.2%(+6.61)#2,263 |
| 56. | Shirley | 12.7% | 7.2%(+5.53)#56 | 6.2%(+6.47)#2,327 |
| 57. | Denning | 12.6% | 7.2%(+5.45)#57 | 6.2%(+6.39)#2,362 |
| 58. | Goshen | 12.6% | 7.2%(+5.44)#58 | 6.2%(+6.37)#2,371 |
| 59. | Caddo Valley | 12.5% | 7.2%(+5.32)#59 | 6.2%(+6.26)#2,417 |
| 60. | Grady | 12.5% | 7.2%(+5.32)#60 | 6.2%(+6.26)#2,427 |
| 61. | Birdsong | 12.5% | 7.2%(+5.32)#61 | 6.2%(+6.26)#2,448 |
| 62. | Bryant | 12.4% | 7.2%(+5.19)#62 | 6.2%(+6.12)#2,499 |
| 63. | Tyronza | 12.3% | 7.2%(+5.16)#63 | 6.2%(+6.09)#2,513 |
| 64. | Dennard | 12.3% | 7.2%(+5.12)#64 | 6.2%(+6.05)#2,529 |
| 65. | Cave Springs | 12.3% | 7.2%(+5.11)#65 | 6.2%(+6.05)#2,533 |
| 66. | Austin | 12.2% | 7.2%(+5.00)#66 | 6.2%(+5.93)#2,593 |
| 67. | Coy | 12.1% | 7.2%(+4.94)#67 | 6.2%(+5.88)#2,622 |
| 68. | Maumelle | 12.0% | 7.2%(+4.87)#68 | 6.2%(+5.80)#2,654 |
| 69. | Lakeview | 11.9% | 7.2%(+4.77)#69 | 6.2%(+5.70)#2,704 |
| 70. | Oil Trough | 11.9% | 7.2%(+4.73)#70 | 6.2%(+5.66)#2,726 |
| 71. | Clinton | 11.9% | 7.2%(+4.71)#71 | 6.2%(+5.64)#2,732 |
| 72. | Salem | 11.8% | 7.2%(+4.65)#72 | 6.2%(+5.58)#2,759 |
| 73. | Lost Bridge Village | 11.8% | 7.2%(+4.59)#73 | 6.2%(+5.52)#2,794 |
| 74. | Mcrae | 11.7% | 7.2%(+4.51)#74 | 6.2%(+5.44)#2,847 |
| 75. | Bradford | 11.5% | 7.2%(+4.36)#75 | 6.2%(+5.29)#2,948 |
| 76. | Bearden | 11.4% | 7.2%(+4.23)#76 | 6.2%(+5.16)#3,058 |
| 77. | Poyen | 11.4% | 7.2%(+4.19)#77 | 6.2%(+5.12)#3,082 |
| 78. | Melbourne | 11.4% | 7.2%(+4.18)#78 | 6.2%(+5.11)#3,088 |
| 79. | Prattsville | 11.3% | 7.2%(+4.16)#79 | 6.2%(+5.09)#3,101 |
| 80. | Bono | 11.1% | 7.2%(+3.94)#80 | 6.2%(+4.88)#3,238 |
| 81. | Sedgwick | 11.1% | 7.2%(+3.93)#81 | 6.2%(+4.87)#3,257 |
| 82. | Corinth | 11.1% | 7.2%(+3.93)#82 | 6.2%(+4.87)#3,271 |
| 83. | Conway | 11.0% | 7.2%(+3.82)#83 | 6.2%(+4.75)#3,333 |
| 84. | Augusta | 10.9% | 7.2%(+3.74)#84 | 6.2%(+4.67)#3,379 |
| 85. | Wooster | 10.9% | 7.2%(+3.73)#85 | 6.2%(+4.66)#3,386 |
| 86. | Peach Orchard | 10.8% | 7.2%(+3.63)#86 | 6.2%(+4.57)#3,469 |
| 87. | Little Rock | 10.7% | 7.2%(+3.57)#87 | 6.2%(+4.50)#3,519 |
| 88. | Monette | 10.7% | 7.2%(+3.52)#88 | 6.2%(+4.45)#3,562 |
| 89. | Patterson | 10.7% | 7.2%(+3.48)#89 | 6.2%(+4.41)#3,590 |
| 90. | Lake View | 10.6% | 7.2%(+3.46)#90 | 6.2%(+4.39)#3,603 |
| 91. | Johnson | 10.6% | 7.2%(+3.40)#91 | 6.2%(+4.33)#3,663 |
| 92. | Pocahontas | 10.5% | 7.2%(+3.36)#92 | 6.2%(+4.29)#3,696 |
| 93. | Oden | 10.5% | 7.2%(+3.30)#93 | 6.2%(+4.23)#3,755 |
| 94. | Cushman | 10.4% | 7.2%(+3.25)#94 | 6.2%(+4.18)#3,792 |
| 95. | Harrisburg | 10.4% | 7.2%(+3.21)#95 | 6.2%(+4.15)#3,826 |
| 96. | Greenwood | 10.3% | 7.2%(+3.14)#96 | 6.2%(+4.08)#3,891 |
| 97. | Smithville | 10.3% | 7.2%(+3.08)#97 | 6.2%(+4.01)#3,964 |
| 98. | Alexander | 10.2% | 7.2%(+3.01)#98 | 6.2%(+3.94)#4,034 |
| 99. | Pottsville | 10.2% | 7.2%(+3.00)#99 | 6.2%(+3.94)#4,037 |
| 100. | Emerson | 10.2% | 7.2%(+2.98)#100 | 6.2%(+3.91)#4,065 |
Common Questions
What are the Top 10 Cities with the Highest Percentage of Population Employed in Health Diagnosing & Treating in Arkansas?
Top 10 Cities with the Highest Percentage of Population Employed in Health Diagnosing & Treating in Arkansas are:
#1
54.2%
#2
52.5%
#3
45.5%
#4
42.8%
#5
35.0%
#6
33.3%
#7
28.9%
#8
24.3%
#9
24.1%
#10
23.9%
What city has the Highest Percentage of Population Employed in Health Diagnosing & Treating in Arkansas?
College Station has the Highest Percentage of Population Employed in Health Diagnosing & Treating in Arkansas with 54.2%.
What is the Percentage of Population Employed in Health Diagnosing & Treating in the State of Arkansas?
Percentage of Population Employed in Health Diagnosing & Treating in Arkansas is 7.2%.
What is the Percentage of Population Employed in Health Diagnosing & Treating in the United States?
Percentage of Population Employed in Health Diagnosing & Treating in the United States is 6.2%.