Cities with the Highest Percentage of Population Employed in Health Diagnosing & Treating in Oregon
RELATED REPORTS & OPTIONS
Health Diagnosing & Treating
Oregon
Compare Cities
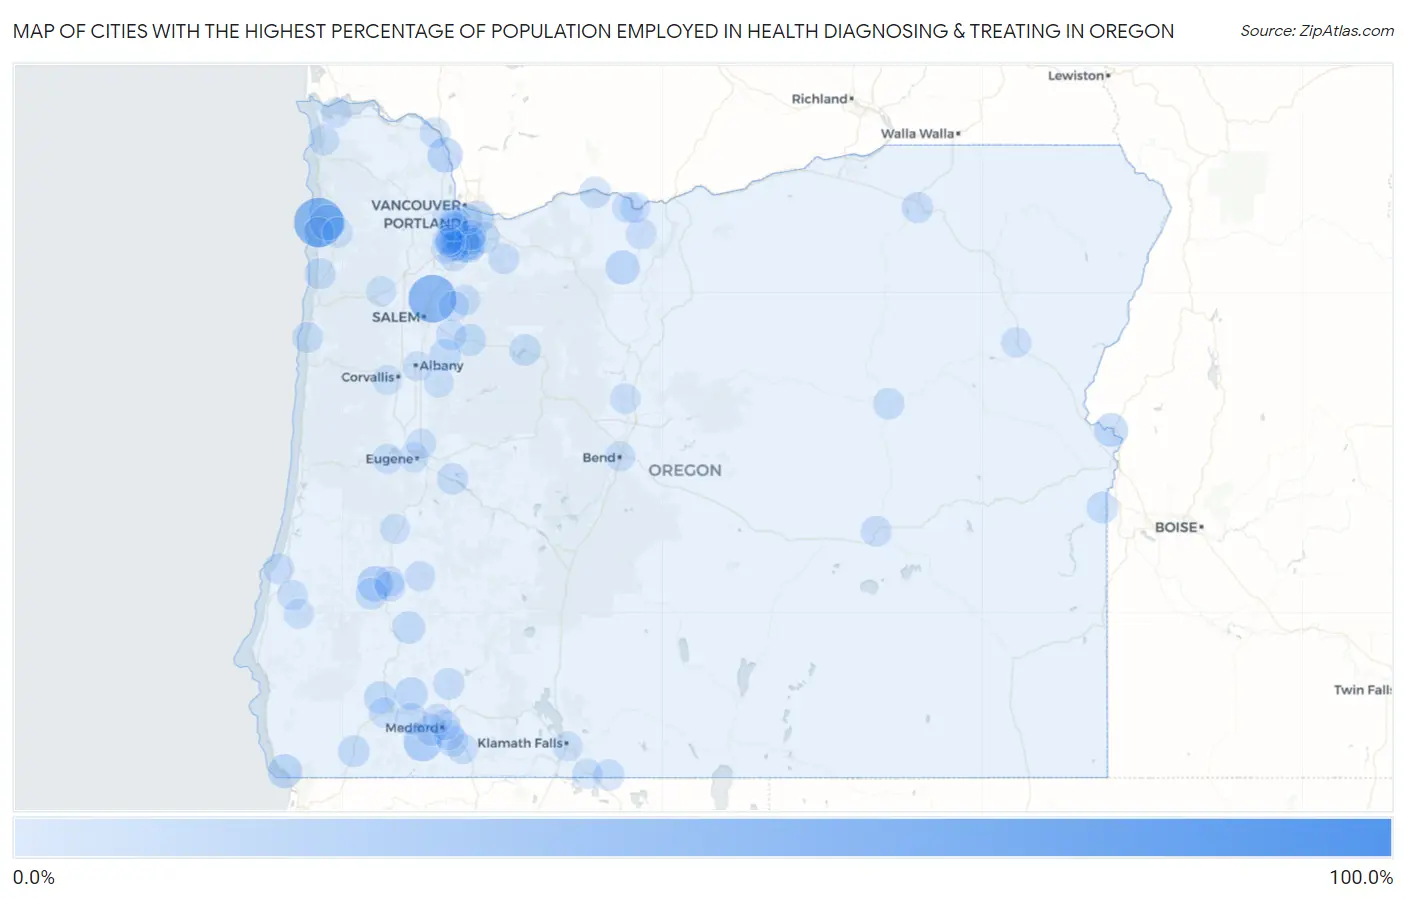
Map of Cities with the Highest Percentage of Population Employed in Health Diagnosing & Treating in Oregon
0.0%
100.0%
Cities with the Highest Percentage of Population Employed in Health Diagnosing & Treating in Oregon
| City | % Employed | vs State | vs National | |
| 1. | Meacham | 100.0% | 6.1%(+93.9)#1 | 6.2%(+93.8)#5 |
| 2. | Trent | 57.4% | 6.1%(+51.4)#2 | 6.2%(+51.2)#49 |
| 3. | Cape Meares | 55.6% | 6.1%(+49.5)#3 | 6.2%(+49.3)#52 |
| 4. | Brooks | 51.1% | 6.1%(+45.0)#4 | 6.2%(+44.8)#75 |
| 5. | Running Y Ranch | 35.6% | 6.1%(+29.5)#5 | 6.2%(+29.4)#192 |
| 6. | Bayshore | 26.2% | 6.1%(+20.2)#6 | 6.2%(+20.0)#401 |
| 7. | Ruch | 25.9% | 6.1%(+19.9)#7 | 6.2%(+19.7)#412 |
| 8. | Falcon Heights | 23.9% | 6.1%(+17.8)#8 | 6.2%(+17.6)#501 |
| 9. | Bay City | 19.9% | 6.1%(+13.8)#9 | 6.2%(+13.7)#760 |
| 10. | Melrose | 19.6% | 6.1%(+13.6)#10 | 6.2%(+13.4)#785 |
| 11. | Deer Island | 18.8% | 6.1%(+12.7)#11 | 6.2%(+12.5)#864 |
| 12. | Mckay | 16.9% | 6.1%(+10.9)#12 | 6.2%(+10.7)#1,100 |
| 13. | Pine Hollow | 16.5% | 6.1%(+10.4)#13 | 6.2%(+10.2)#1,186 |
| 14. | Stafford | 16.4% | 6.1%(+10.4)#14 | 6.2%(+10.2)#1,193 |
| 15. | Harbor | 16.2% | 6.1%(+10.1)#15 | 6.2%(+9.92)#1,248 |
| 16. | Annex | 15.4% | 6.1%(+9.32)#16 | 6.2%(+9.14)#1,421 |
| 17. | River Point | 15.1% | 6.1%(+9.00)#17 | 6.2%(+8.82)#1,490 |
| 18. | Dunthorpe | 14.2% | 6.1%(+8.15)#18 | 6.2%(+7.97)#1,740 |
| 19. | Maywood Park | 14.2% | 6.1%(+8.14)#19 | 6.2%(+7.96)#1,744 |
| 20. | Wimer | 13.6% | 6.1%(+7.54)#20 | 6.2%(+7.36)#1,942 |
| 21. | West Haven Sylvan | 13.6% | 6.1%(+7.49)#21 | 6.2%(+7.31)#1,957 |
| 22. | Days Creek | 13.1% | 6.1%(+7.05)#22 | 6.2%(+6.87)#2,133 |
| 23. | Lake Oswego | 12.6% | 6.1%(+6.52)#23 | 6.2%(+6.35)#2,385 |
| 24. | Merlin | 12.2% | 6.1%(+6.12)#24 | 6.2%(+5.94)#2,586 |
| 25. | Foots Creek | 11.5% | 6.1%(+5.46)#25 | 6.2%(+5.28)#2,972 |
| 26. | Happy Valley | 11.2% | 6.1%(+5.14)#26 | 6.2%(+4.96)#3,180 |
| 27. | Mehama | 11.1% | 6.1%(+5.08)#27 | 6.2%(+4.90)#3,223 |
| 28. | Jennings Lodge | 11.0% | 6.1%(+4.93)#28 | 6.2%(+4.75)#3,331 |
| 29. | Lookingglass | 10.8% | 6.1%(+4.69)#29 | 6.2%(+4.52)#3,503 |
| 30. | Adrian | 10.8% | 6.1%(+4.68)#30 | 6.2%(+4.51)#3,517 |
| 31. | Cave Junction | 10.7% | 6.1%(+4.60)#31 | 6.2%(+4.42)#3,580 |
| 32. | Scio | 10.5% | 6.1%(+4.43)#32 | 6.2%(+4.25)#3,740 |
| 33. | Jacksonville | 10.2% | 6.1%(+4.12)#33 | 6.2%(+3.95)#4,027 |
| 34. | Shady Cove | 10.1% | 6.1%(+4.03)#34 | 6.2%(+3.85)#4,108 |
| 35. | Detroit | 10.0% | 6.1%(+3.93)#35 | 6.2%(+3.76)#4,213 |
| 36. | Green Meadows | 9.9% | 6.1%(+3.86)#36 | 6.2%(+3.69)#4,274 |
| 37. | Hood River | 9.9% | 6.1%(+3.83)#37 | 6.2%(+3.65)#4,318 |
| 38. | Lowell | 9.5% | 6.1%(+3.43)#38 | 6.2%(+3.25)#4,772 |
| 39. | Canyon City | 9.4% | 6.1%(+3.30)#39 | 6.2%(+3.12)#4,933 |
| 40. | Raleigh Hills | 9.3% | 6.1%(+3.27)#40 | 6.2%(+3.09)#4,985 |
| 41. | Pacific City | 9.3% | 6.1%(+3.26)#41 | 6.2%(+3.08)#5,004 |
| 42. | Tutuilla | 9.1% | 6.1%(+3.07)#42 | 6.2%(+2.89)#5,214 |
| 43. | Rivergrove | 9.1% | 6.1%(+3.06)#43 | 6.2%(+2.88)#5,225 |
| 44. | Malin | 9.0% | 6.1%(+2.91)#44 | 6.2%(+2.73)#5,463 |
| 45. | Burns | 8.8% | 6.1%(+2.74)#45 | 6.2%(+2.56)#5,688 |
| 46. | Gearhart | 8.8% | 6.1%(+2.68)#46 | 6.2%(+2.51)#5,771 |
| 47. | Rainier | 8.6% | 6.1%(+2.50)#47 | 6.2%(+2.33)#6,051 |
| 48. | Keno | 8.6% | 6.1%(+2.49)#48 | 6.2%(+2.31)#6,078 |
| 49. | Chenoweth | 8.5% | 6.1%(+2.45)#49 | 6.2%(+2.28)#6,130 |
| 50. | Ashland | 8.4% | 6.1%(+2.33)#50 | 6.2%(+2.15)#6,328 |
| 51. | Barview | 8.4% | 6.1%(+2.30)#51 | 6.2%(+2.12)#6,366 |
| 52. | Dufur | 8.3% | 6.1%(+2.24)#52 | 6.2%(+2.06)#6,471 |
| 53. | Oceanside | 8.2% | 6.1%(+2.16)#53 | 6.2%(+1.98)#6,604 |
| 54. | Estacada | 8.1% | 6.1%(+2.04)#54 | 6.2%(+1.87)#6,797 |
| 55. | Metzger | 8.1% | 6.1%(+2.03)#55 | 6.2%(+1.85)#6,821 |
| 56. | Oak Grove | 8.0% | 6.1%(+1.95)#56 | 6.2%(+1.78)#6,961 |
| 57. | The Dalles | 8.0% | 6.1%(+1.94)#57 | 6.2%(+1.77)#6,974 |
| 58. | Sublimity | 8.0% | 6.1%(+1.89)#58 | 6.2%(+1.71)#7,070 |
| 59. | Talent | 7.9% | 6.1%(+1.85)#59 | 6.2%(+1.68)#7,135 |
| 60. | Scotts Mills | 7.9% | 6.1%(+1.80)#60 | 6.2%(+1.62)#7,252 |
| 61. | Depoe Bay | 7.8% | 6.1%(+1.76)#61 | 6.2%(+1.58)#7,326 |
| 62. | Roseburg North | 7.8% | 6.1%(+1.70)#62 | 6.2%(+1.53)#7,436 |
| 63. | West Linn | 7.7% | 6.1%(+1.64)#63 | 6.2%(+1.46)#7,538 |
| 64. | Glide | 7.6% | 6.1%(+1.53)#64 | 6.2%(+1.36)#7,792 |
| 65. | Roseburg | 7.6% | 6.1%(+1.49)#65 | 6.2%(+1.32)#7,871 |
| 66. | Silverton | 7.5% | 6.1%(+1.46)#66 | 6.2%(+1.28)#7,949 |
| 67. | Tualatin | 7.5% | 6.1%(+1.42)#67 | 6.2%(+1.24)#8,039 |
| 68. | Phoenix | 7.5% | 6.1%(+1.38)#68 | 6.2%(+1.21)#8,098 |
| 69. | Coquille | 7.4% | 6.1%(+1.36)#69 | 6.2%(+1.19)#8,153 |
| 70. | Medford | 7.4% | 6.1%(+1.34)#70 | 6.2%(+1.17)#8,197 |
| 71. | Portland | 7.3% | 6.1%(+1.25)#71 | 6.2%(+1.07)#8,432 |
| 72. | Crooked River Ranch | 7.3% | 6.1%(+1.25)#72 | 6.2%(+1.07)#8,433 |
| 73. | Fairview | 7.3% | 6.1%(+1.24)#73 | 6.2%(+1.06)#8,462 |
| 74. | Sheridan | 7.3% | 6.1%(+1.23)#74 | 6.2%(+1.06)#8,474 |
| 75. | Astoria | 7.3% | 6.1%(+1.23)#75 | 6.2%(+1.05)#8,483 |
| 76. | Boring | 7.2% | 6.1%(+1.14)#76 | 6.2%(+0.961)#8,673 |
| 77. | Cheshire | 7.1% | 6.1%(+1.07)#77 | 6.2%(+0.898)#8,827 |
| 78. | Sherwood | 7.1% | 6.1%(+1.06)#78 | 6.2%(+0.880)#8,878 |
| 79. | Merrill | 7.1% | 6.1%(+1.05)#79 | 6.2%(+0.876)#8,885 |
| 80. | Eugene | 7.1% | 6.1%(+1.02)#80 | 6.2%(+0.849)#8,938 |
| 81. | Veneta | 7.1% | 6.1%(+1.00)#81 | 6.2%(+0.827)#8,990 |
| 82. | Bend | 7.1% | 6.1%(+0.983)#82 | 6.2%(+0.807)#9,032 |
| 83. | Wilsonville | 7.0% | 6.1%(+0.941)#83 | 6.2%(+0.765)#9,134 |
| 84. | Neotsu | 7.0% | 6.1%(+0.940)#84 | 6.2%(+0.764)#9,136 |
| 85. | Milwaukie | 7.0% | 6.1%(+0.921)#85 | 6.2%(+0.745)#9,188 |
| 86. | Baker City | 6.9% | 6.1%(+0.859)#86 | 6.2%(+0.683)#9,353 |
| 87. | Redwood | 6.8% | 6.1%(+0.776)#87 | 6.2%(+0.600)#9,559 |
| 88. | Coburg | 6.8% | 6.1%(+0.769)#88 | 6.2%(+0.593)#9,574 |
| 89. | Philomath | 6.8% | 6.1%(+0.732)#89 | 6.2%(+0.556)#9,674 |
| 90. | Tigard | 6.8% | 6.1%(+0.725)#90 | 6.2%(+0.549)#9,689 |
| 91. | West Slope | 6.8% | 6.1%(+0.712)#91 | 6.2%(+0.537)#9,719 |
| 92. | Central Point | 6.7% | 6.1%(+0.679)#92 | 6.2%(+0.503)#9,812 |
| 93. | Bull Mountain | 6.7% | 6.1%(+0.659)#93 | 6.2%(+0.483)#9,861 |
| 94. | Bethany | 6.7% | 6.1%(+0.652)#94 | 6.2%(+0.476)#9,877 |
| 95. | Myrtle Point | 6.7% | 6.1%(+0.644)#95 | 6.2%(+0.468)#9,897 |
| 96. | King City | 6.7% | 6.1%(+0.620)#96 | 6.2%(+0.445)#9,948 |
| 97. | Yoncalla | 6.6% | 6.1%(+0.580)#97 | 6.2%(+0.404)#10,065 |
| 98. | Klamath Falls | 6.6% | 6.1%(+0.547)#98 | 6.2%(+0.372)#10,146 |
| 99. | Albany | 6.6% | 6.1%(+0.537)#99 | 6.2%(+0.361)#10,168 |
| 100. | Lebanon | 6.6% | 6.1%(+0.486)#100 | 6.2%(+0.310)#10,310 |
Common Questions
What are the Top 10 Cities with the Highest Percentage of Population Employed in Health Diagnosing & Treating in Oregon?
Top 10 Cities with the Highest Percentage of Population Employed in Health Diagnosing & Treating in Oregon are:
#1
55.6%
#2
51.1%
#3
25.9%
#4
19.9%
#5
19.6%
#6
18.8%
#7
16.5%
#8
16.4%
#9
16.2%
#10
15.4%
What city has the Highest Percentage of Population Employed in Health Diagnosing & Treating in Oregon?
Cape Meares has the Highest Percentage of Population Employed in Health Diagnosing & Treating in Oregon with 55.6%.
What is the Percentage of Population Employed in Health Diagnosing & Treating in the State of Oregon?
Percentage of Population Employed in Health Diagnosing & Treating in Oregon is 6.1%.
What is the Percentage of Population Employed in Health Diagnosing & Treating in the United States?
Percentage of Population Employed in Health Diagnosing & Treating in the United States is 6.2%.