Cities with the Highest Percentage of Population Employed in Health Diagnosing & Treating in North Carolina
RELATED REPORTS & OPTIONS
Health Diagnosing & Treating
North Carolina
Compare Cities
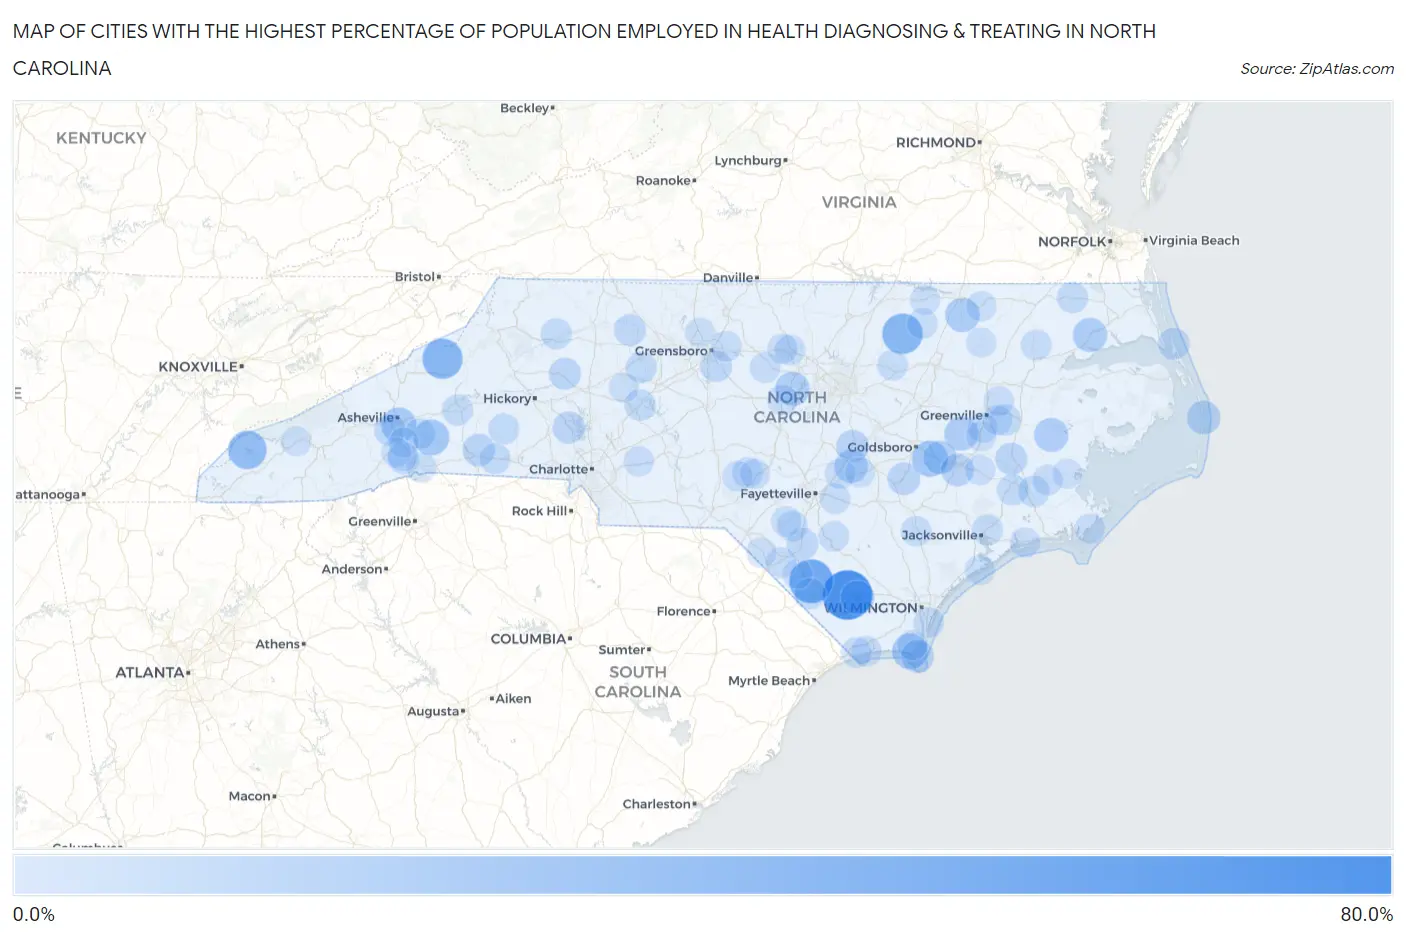
Map of Cities with the Highest Percentage of Population Employed in Health Diagnosing & Treating in North Carolina
0.0%
80.0%
Cities with the Highest Percentage of Population Employed in Health Diagnosing & Treating in North Carolina
| City | % Employed | vs State | vs National | |
| 1. | Hallsboro | 71.4% | 6.4%(+65.0)#1 | 6.2%(+65.2)#29 |
| 2. | Evergreen | 53.6% | 6.4%(+47.2)#2 | 6.2%(+47.3)#62 |
| 3. | Centerville | 42.7% | 6.4%(+36.3)#3 | 6.2%(+36.5)#124 |
| 4. | Bakersville | 42.0% | 6.4%(+35.6)#4 | 6.2%(+35.8)#128 |
| 5. | Lake Santeetlah | 36.0% | 6.4%(+29.6)#5 | 6.2%(+29.8)#184 |
| 6. | Linville | 31.6% | 6.4%(+25.2)#6 | 6.2%(+25.3)#280 |
| 7. | Walnut Creek | 29.1% | 6.4%(+22.6)#7 | 6.2%(+22.8)#318 |
| 8. | Gold Hill | 28.7% | 6.4%(+22.3)#8 | 6.2%(+22.5)#327 |
| 9. | Chimney Rock Village | 28.4% | 6.4%(+22.0)#9 | 6.2%(+22.2)#343 |
| 10. | Jackson Springs | 28.4% | 6.4%(+22.0)#10 | 6.2%(+22.2)#344 |
| 11. | Caswell Beach | 28.1% | 6.4%(+21.7)#11 | 6.2%(+21.9)#350 |
| 12. | Biltmore Forest | 26.4% | 6.4%(+20.0)#12 | 6.2%(+20.2)#390 |
| 13. | Halifax | 24.0% | 6.4%(+17.6)#13 | 6.2%(+17.8)#492 |
| 14. | Hertford | 23.9% | 6.4%(+17.4)#14 | 6.2%(+17.6)#502 |
| 15. | Fearrington Village | 23.6% | 6.4%(+17.2)#15 | 6.2%(+17.4)#512 |
| 16. | Barnardsville | 23.5% | 6.4%(+17.1)#16 | 6.2%(+17.2)#524 |
| 17. | Crouse | 23.3% | 6.4%(+16.9)#17 | 6.2%(+17.1)#528 |
| 18. | Bath | 23.1% | 6.4%(+16.7)#18 | 6.2%(+16.8)#542 |
| 19. | Maury | 22.9% | 6.4%(+16.5)#19 | 6.2%(+16.7)#554 |
| 20. | Lake Waccamaw | 22.3% | 6.4%(+15.9)#20 | 6.2%(+16.1)#582 |
| 21. | Rodanthe | 21.7% | 6.4%(+15.3)#21 | 6.2%(+15.5)#616 |
| 22. | La Grange | 21.1% | 6.4%(+14.7)#22 | 6.2%(+14.8)#655 |
| 23. | Plain View | 20.8% | 6.4%(+14.4)#23 | 6.2%(+14.6)#682 |
| 24. | Smithtown | 20.5% | 6.4%(+14.0)#24 | 6.2%(+14.2)#707 |
| 25. | Bald Head Island | 19.2% | 6.4%(+12.8)#25 | 6.2%(+13.0)#816 |
| 26. | Benson | 19.2% | 6.4%(+12.7)#26 | 6.2%(+12.9)#825 |
| 27. | Jackson Heights | 18.9% | 6.4%(+12.5)#27 | 6.2%(+12.7)#849 |
| 28. | Calypso | 18.7% | 6.4%(+12.2)#28 | 6.2%(+12.4)#879 |
| 29. | Bostic | 18.3% | 6.4%(+11.9)#29 | 6.2%(+12.1)#915 |
| 30. | Denver | 17.8% | 6.4%(+11.4)#30 | 6.2%(+11.6)#976 |
| 31. | Vanceboro | 17.4% | 6.4%(+11.0)#31 | 6.2%(+11.2)#1,019 |
| 32. | Glenwood | 17.2% | 6.4%(+10.8)#32 | 6.2%(+11.0)#1,042 |
| 33. | Hiddenite | 16.9% | 6.4%(+10.5)#33 | 6.2%(+10.7)#1,104 |
| 34. | Southern Shores | 16.8% | 6.4%(+10.4)#34 | 6.2%(+10.5)#1,128 |
| 35. | Barker Ten Mile | 16.4% | 6.4%(+10.00)#35 | 6.2%(+10.2)#1,196 |
| 36. | Bent Creek | 16.2% | 6.4%(+9.77)#36 | 6.2%(+9.95)#1,243 |
| 37. | Governors Club | 16.1% | 6.4%(+9.68)#37 | 6.2%(+9.85)#1,267 |
| 38. | Pleasant Garden | 15.9% | 6.4%(+9.48)#38 | 6.2%(+9.66)#1,302 |
| 39. | East Bend | 15.9% | 6.4%(+9.47)#39 | 6.2%(+9.65)#1,304 |
| 40. | Grimesland | 15.5% | 6.4%(+9.07)#40 | 6.2%(+9.25)#1,397 |
| 41. | Cerro Gordo | 15.4% | 6.4%(+8.96)#41 | 6.2%(+9.14)#1,419 |
| 42. | East Spencer | 15.2% | 6.4%(+8.79)#42 | 6.2%(+8.97)#1,462 |
| 43. | Advance | 15.2% | 6.4%(+8.73)#43 | 6.2%(+8.91)#1,471 |
| 44. | River Bend | 15.1% | 6.4%(+8.69)#44 | 6.2%(+8.87)#1,481 |
| 45. | Sunbury | 15.1% | 6.4%(+8.63)#45 | 6.2%(+8.81)#1,492 |
| 46. | Fairfield Harbour | 14.8% | 6.4%(+8.35)#46 | 6.2%(+8.53)#1,559 |
| 47. | West Marion | 14.7% | 6.4%(+8.23)#47 | 6.2%(+8.41)#1,591 |
| 48. | Nebo | 14.5% | 6.4%(+8.07)#48 | 6.2%(+8.25)#1,647 |
| 49. | Gerton | 14.3% | 6.4%(+7.86)#49 | 6.2%(+8.04)#1,707 |
| 50. | Casar | 14.1% | 6.4%(+7.71)#50 | 6.2%(+7.89)#1,765 |
| 51. | Fairplains | 14.1% | 6.4%(+7.70)#51 | 6.2%(+7.88)#1,768 |
| 52. | Mooresboro | 14.0% | 6.4%(+7.53)#52 | 6.2%(+7.71)#1,816 |
| 53. | Valley Hill | 13.9% | 6.4%(+7.46)#53 | 6.2%(+7.63)#1,836 |
| 54. | Pumpkin Center | 13.7% | 6.4%(+7.31)#54 | 6.2%(+7.49)#1,892 |
| 55. | Askewville | 13.5% | 6.4%(+7.09)#55 | 6.2%(+7.27)#1,974 |
| 56. | Stedman | 13.5% | 6.4%(+7.06)#56 | 6.2%(+7.23)#1,990 |
| 57. | Myrtle Grove | 13.5% | 6.4%(+7.04)#57 | 6.2%(+7.22)#2,002 |
| 58. | Rennert | 13.4% | 6.4%(+7.02)#58 | 6.2%(+7.20)#2,006 |
| 59. | Lake Royale | 13.4% | 6.4%(+6.95)#59 | 6.2%(+7.13)#2,031 |
| 60. | Saxapahaw | 13.3% | 6.4%(+6.92)#60 | 6.2%(+7.10)#2,040 |
| 61. | Mcleansville | 13.3% | 6.4%(+6.91)#61 | 6.2%(+7.09)#2,044 |
| 62. | Mcdonald | 13.3% | 6.4%(+6.91)#62 | 6.2%(+7.09)#2,050 |
| 63. | Pinehurst | 13.2% | 6.4%(+6.79)#63 | 6.2%(+6.96)#2,098 |
| 64. | Pittsboro | 13.2% | 6.4%(+6.74)#64 | 6.2%(+6.91)#2,116 |
| 65. | Sunset Beach | 13.1% | 6.4%(+6.67)#65 | 6.2%(+6.84)#2,142 |
| 66. | White Oak | 13.1% | 6.4%(+6.66)#66 | 6.2%(+6.83)#2,146 |
| 67. | Hollister | 13.0% | 6.4%(+6.55)#67 | 6.2%(+6.72)#2,207 |
| 68. | Ocean Isle Beach | 12.9% | 6.4%(+6.48)#68 | 6.2%(+6.66)#2,233 |
| 69. | Teachey | 12.8% | 6.4%(+6.41)#69 | 6.2%(+6.59)#2,272 |
| 70. | Hillsborough | 12.8% | 6.4%(+6.41)#70 | 6.2%(+6.59)#2,273 |
| 71. | Grantsboro | 12.8% | 6.4%(+6.40)#71 | 6.2%(+6.58)#2,276 |
| 72. | Locust | 12.6% | 6.4%(+6.14)#72 | 6.2%(+6.32)#2,390 |
| 73. | Falcon | 12.5% | 6.4%(+6.08)#73 | 6.2%(+6.26)#2,429 |
| 74. | Dover | 12.4% | 6.4%(+6.01)#74 | 6.2%(+6.19)#2,466 |
| 75. | Winterville | 12.4% | 6.4%(+5.97)#75 | 6.2%(+6.15)#2,486 |
| 76. | Efland | 12.4% | 6.4%(+5.96)#76 | 6.2%(+6.14)#2,489 |
| 77. | Stokes | 12.4% | 6.4%(+5.95)#77 | 6.2%(+6.13)#2,495 |
| 78. | Foxfire | 12.3% | 6.4%(+5.84)#78 | 6.2%(+6.02)#2,550 |
| 79. | Davis | 12.2% | 6.4%(+5.74)#79 | 6.2%(+5.92)#2,598 |
| 80. | Jackson | 12.1% | 6.4%(+5.66)#80 | 6.2%(+5.84)#2,642 |
| 81. | Bogue | 12.1% | 6.4%(+5.66)#81 | 6.2%(+5.83)#2,644 |
| 82. | Southern Pines | 12.0% | 6.4%(+5.58)#82 | 6.2%(+5.76)#2,669 |
| 83. | Southport | 11.9% | 6.4%(+5.52)#83 | 6.2%(+5.70)#2,705 |
| 84. | Shannon | 11.9% | 6.4%(+5.48)#84 | 6.2%(+5.66)#2,725 |
| 85. | Ayden | 11.8% | 6.4%(+5.41)#85 | 6.2%(+5.58)#2,760 |
| 86. | Fletcher | 11.8% | 6.4%(+5.37)#86 | 6.2%(+5.54)#2,781 |
| 87. | North Topsail Beach | 11.7% | 6.4%(+5.31)#87 | 6.2%(+5.49)#2,812 |
| 88. | Saluda | 11.7% | 6.4%(+5.29)#88 | 6.2%(+5.47)#2,824 |
| 89. | Laurel Park | 11.7% | 6.4%(+5.29)#89 | 6.2%(+5.47)#2,826 |
| 90. | Vandemere | 11.7% | 6.4%(+5.25)#90 | 6.2%(+5.42)#2,857 |
| 91. | Raemon | 11.7% | 6.4%(+5.23)#91 | 6.2%(+5.41)#2,871 |
| 92. | Scotland Neck | 11.6% | 6.4%(+5.21)#92 | 6.2%(+5.39)#2,879 |
| 93. | Horse Shoe | 11.6% | 6.4%(+5.20)#93 | 6.2%(+5.38)#2,888 |
| 94. | Summerfield | 11.6% | 6.4%(+5.19)#94 | 6.2%(+5.37)#2,894 |
| 95. | Spivey S Corner | 11.6% | 6.4%(+5.15)#95 | 6.2%(+5.33)#2,933 |
| 96. | Proctorville | 11.5% | 6.4%(+5.12)#96 | 6.2%(+5.29)#2,956 |
| 97. | Bryson City | 11.5% | 6.4%(+5.11)#97 | 6.2%(+5.29)#2,965 |
| 98. | Simpson | 11.5% | 6.4%(+5.04)#98 | 6.2%(+5.22)#3,012 |
| 99. | Cooleemee | 11.4% | 6.4%(+5.03)#99 | 6.2%(+5.20)#3,025 |
| 100. | Littleton | 11.3% | 6.4%(+4.87)#100 | 6.2%(+5.05)#3,124 |
Common Questions
What are the Top 10 Cities with the Highest Percentage of Population Employed in Health Diagnosing & Treating in North Carolina?
Top 10 Cities with the Highest Percentage of Population Employed in Health Diagnosing & Treating in North Carolina are:
#1
71.4%
#2
53.6%
#3
42.7%
#4
42.0%
#5
36.0%
#6
29.1%
#7
28.4%
#8
28.1%
#9
26.4%
#10
24.0%
What city has the Highest Percentage of Population Employed in Health Diagnosing & Treating in North Carolina?
Hallsboro has the Highest Percentage of Population Employed in Health Diagnosing & Treating in North Carolina with 71.4%.
What is the Percentage of Population Employed in Health Diagnosing & Treating in the State of North Carolina?
Percentage of Population Employed in Health Diagnosing & Treating in North Carolina is 6.4%.
What is the Percentage of Population Employed in Health Diagnosing & Treating in the United States?
Percentage of Population Employed in Health Diagnosing & Treating in the United States is 6.2%.