Zip Codes with the Highest Percentage of Population Employed in Health Diagnosing & Treating in San Bernardino, CA
RELATED REPORTS & OPTIONS
Health Diagnosing & Treating
San Bernardino
Compare Zip Codes
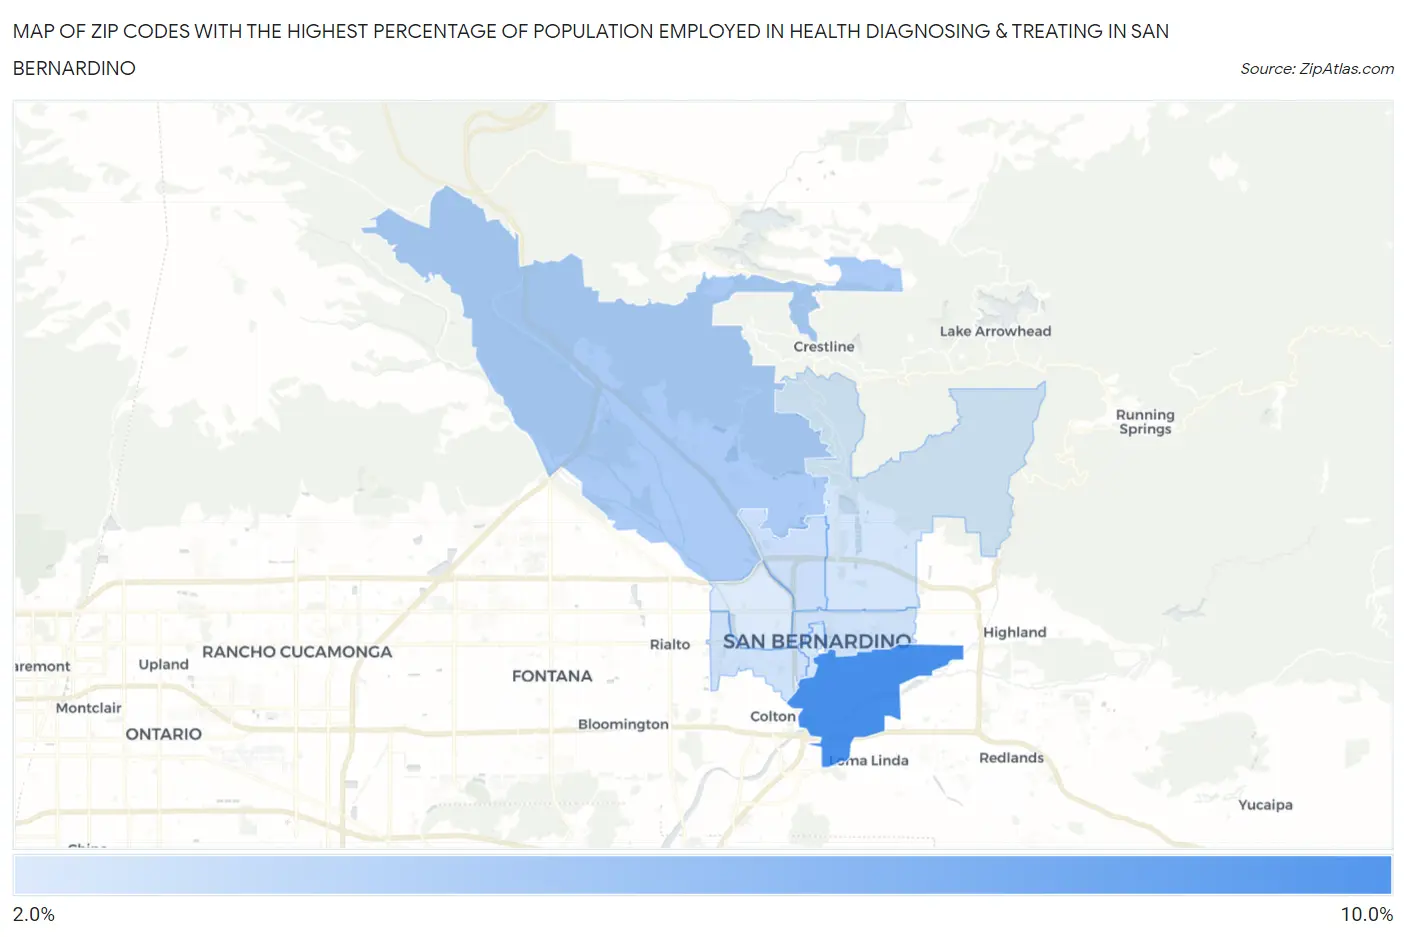
Map of Zip Codes with the Highest Percentage of Population Employed in Health Diagnosing & Treating in San Bernardino
2.1%
8.3%
Zip Codes with the Highest Percentage of Population Employed in Health Diagnosing & Treating in San Bernardino, CA
| Zip Code | % Employed | vs State | vs National | |
| 1. | 92408 | 8.3% | 5.3%(+2.95)#226 | 6.2%(+2.01)#6,866 |
| 2. | 92407 | 4.1% | 5.3%(-1.18)#985 | 6.2%(-2.11)#20,941 |
| 3. | 92405 | 2.8% | 5.3%(-2.49)#1,230 | 6.2%(-3.42)#24,758 |
| 4. | 92410 | 2.6% | 5.3%(-2.71)#1,254 | 6.2%(-3.64)#25,247 |
| 5. | 92404 | 2.4% | 5.3%(-2.89)#1,290 | 6.2%(-3.82)#25,688 |
| 6. | 92401 | 2.4% | 5.3%(-2.95)#1,296 | 6.2%(-3.89)#25,807 |
| 7. | 92411 | 2.1% | 5.3%(-3.24)#1,338 | 6.2%(-4.17)#26,334 |
1
Common Questions
What are the Top 5 Zip Codes with the Highest Percentage of Population Employed in Health Diagnosing & Treating in San Bernardino, CA?
Top 5 Zip Codes with the Highest Percentage of Population Employed in Health Diagnosing & Treating in San Bernardino, CA are:
What zip code has the Highest Percentage of Population Employed in Health Diagnosing & Treating in San Bernardino, CA?
92408 has the Highest Percentage of Population Employed in Health Diagnosing & Treating in San Bernardino, CA with 8.3%.
What is the Percentage of Population Employed in Health Diagnosing & Treating in San Bernardino, CA?
Percentage of Population Employed in Health Diagnosing & Treating in San Bernardino is 3.5%.
What is the Percentage of Population Employed in Health Diagnosing & Treating in California?
Percentage of Population Employed in Health Diagnosing & Treating in California is 5.3%.
What is the Percentage of Population Employed in Health Diagnosing & Treating in the United States?
Percentage of Population Employed in Health Diagnosing & Treating in the United States is 6.2%.