American Canyon, CA Map & Demographics
American Canyon Map
American Canyon Overview
$41,813
PER CAPITA INCOME
$134,676
AVG FAMILY INCOME
$122,694
AVG HOUSEHOLD INCOME
21.8%
WAGE / INCOME GAP [ % ]
78.2¢/ $1
WAGE / INCOME GAP [ $ ]
$9,853
FAMILY INCOME DEFICIT
0.42
INEQUALITY / GINI INDEX
21,669
TOTAL POPULATION
10,518
MALE POPULATION
11,151
FEMALE POPULATION
94.32
MALES / 100 FEMALES
106.02
FEMALES / 100 MALES
36.2
MEDIAN AGE
4.0
AVG FAMILY SIZE
3.8
AVG HOUSEHOLD SIZE
11,396
LABOR FORCE [ PEOPLE ]
67.1%
PERCENT IN LABOR FORCE
5.0%
UNEMPLOYMENT RATE
American Canyon Zip Codes
American Canyon Area Codes
Income in American Canyon
Income Overview in American Canyon
Per Capita Income in American Canyon is $41,813, while median incomes of families and households are $134,676 and $122,694 respectively.
| Characteristic | Number | Measure |
| Per Capita Income | 21,669 | $41,813 |
| Median Family Income | 4,899 | $134,676 |
| Mean Family Income | 4,899 | $158,209 |
| Median Household Income | 5,725 | $122,694 |
| Mean Household Income | 5,725 | $150,847 |
| Income Deficit | 4,899 | $9,853 |
| Wage / Income Gap (%) | 21,669 | 21.81% |
| Wage / Income Gap ($) | 21,669 | 78.19¢ per $1 |
| Gini / Inequality Index | 21,669 | 0.42 |
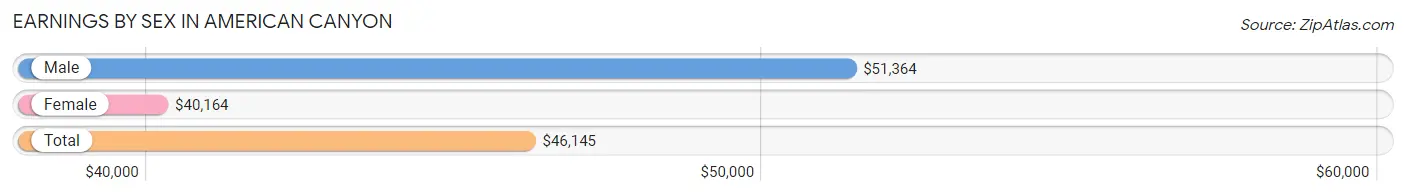
Earnings by Sex in American Canyon
Average Earnings in American Canyon are $46,145, $51,364 for men and $40,164 for women, a difference of 21.8%.
| Sex | Number | Average Earnings |
| Male | 5,882 (50.6%) | $51,364 |
| Female | 5,750 (49.4%) | $40,164 |
| Total | 11,632 (100.0%) | $46,145 |
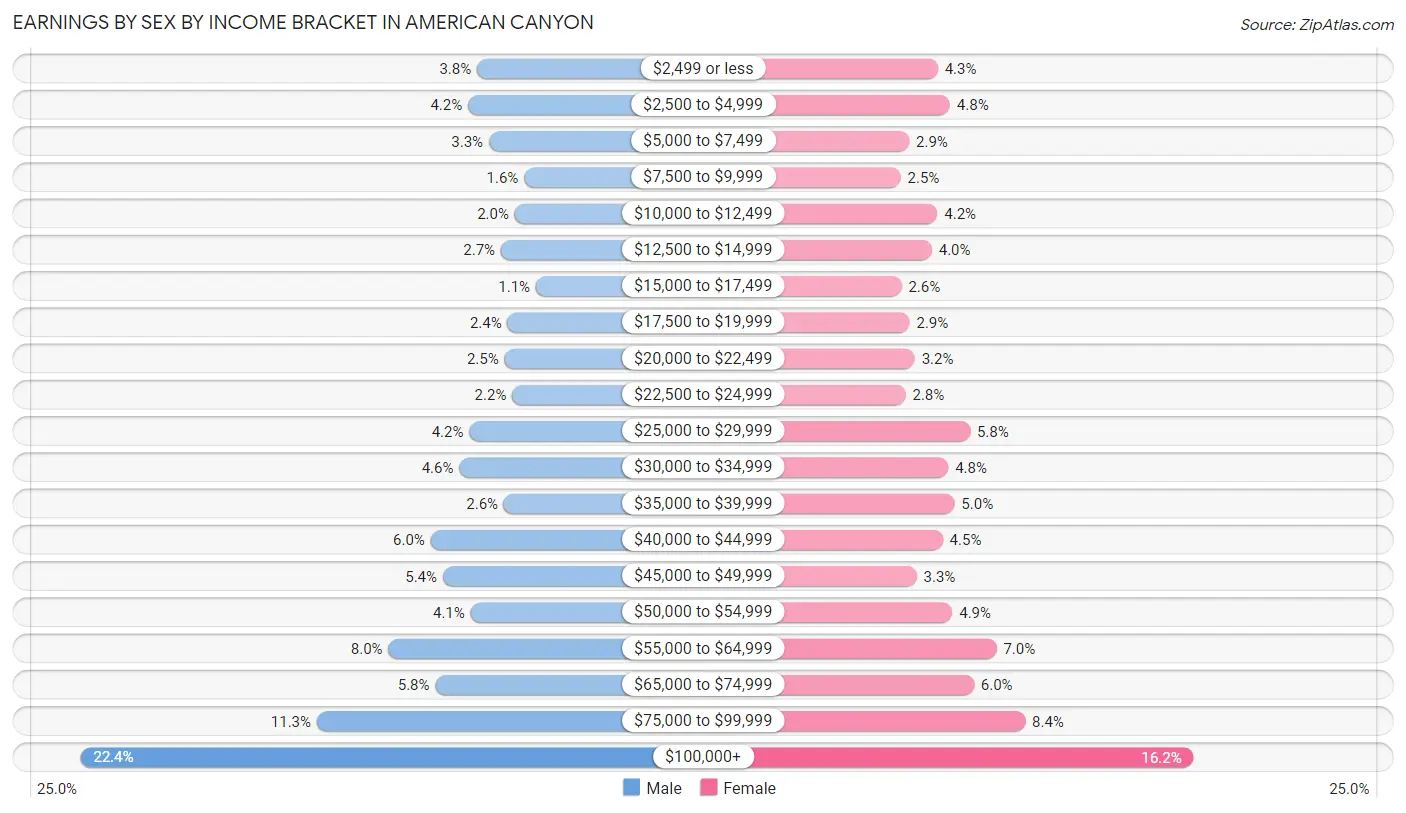
Earnings by Sex by Income Bracket in American Canyon
The most common earnings brackets in American Canyon are $100,000+ for men (1,317 | 22.4%) and $100,000+ for women (934 | 16.2%).
| Income | Male | Female |
| $2,499 or less | 224 (3.8%) | 245 (4.3%) |
| $2,500 to $4,999 | 249 (4.2%) | 278 (4.8%) |
| $5,000 to $7,499 | 191 (3.3%) | 168 (2.9%) |
| $7,500 to $9,999 | 94 (1.6%) | 145 (2.5%) |
| $10,000 to $12,499 | 120 (2.0%) | 244 (4.2%) |
| $12,500 to $14,999 | 158 (2.7%) | 229 (4.0%) |
| $15,000 to $17,499 | 62 (1.1%) | 147 (2.6%) |
| $17,500 to $19,999 | 140 (2.4%) | 169 (2.9%) |
| $20,000 to $22,499 | 148 (2.5%) | 183 (3.2%) |
| $22,500 to $24,999 | 127 (2.2%) | 158 (2.8%) |
| $25,000 to $29,999 | 245 (4.2%) | 332 (5.8%) |
| $30,000 to $34,999 | 273 (4.6%) | 273 (4.8%) |
| $35,000 to $39,999 | 150 (2.5%) | 290 (5.0%) |
| $40,000 to $44,999 | 352 (6.0%) | 258 (4.5%) |
| $45,000 to $49,999 | 318 (5.4%) | 188 (3.3%) |
| $50,000 to $54,999 | 242 (4.1%) | 284 (4.9%) |
| $55,000 to $64,999 | 468 (8.0%) | 403 (7.0%) |
| $65,000 to $74,999 | 339 (5.8%) | 342 (5.9%) |
| $75,000 to $99,999 | 665 (11.3%) | 480 (8.4%) |
| $100,000+ | 1,317 (22.4%) | 934 (16.2%) |
| Total | 5,882 (100.0%) | 5,750 (100.0%) |
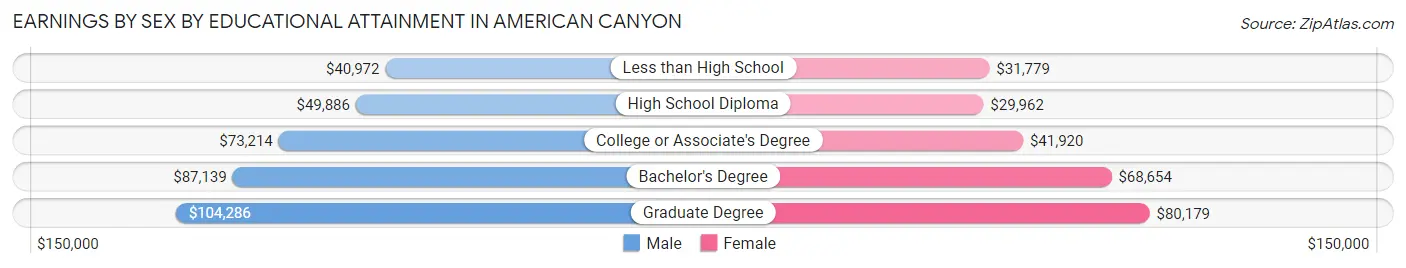
Earnings by Sex by Educational Attainment in American Canyon
Average earnings in American Canyon are $60,576 for men and $49,428 for women, a difference of 18.4%. Men with an educational attainment of graduate degree enjoy the highest average annual earnings of $104,286, while those with less than high school education earn the least with $40,972. Women with an educational attainment of graduate degree earn the most with the average annual earnings of $80,179, while those with high school diploma education have the smallest earnings of $29,962.
| Educational Attainment | Male Income | Female Income |
| Less than High School | $40,972 | $31,779 |
| High School Diploma | $49,886 | $29,962 |
| College or Associate's Degree | $73,214 | $41,920 |
| Bachelor's Degree | $87,139 | $68,654 |
| Graduate Degree | $104,286 | $80,179 |
| Total | $60,576 | $49,428 |
Family Income in American Canyon
Family Income Brackets in American Canyon
According to the American Canyon family income data, there are 1,239 families falling into the $200,000+ income range, which is the most common income bracket and makes up 25.3% of all families. Conversely, the $10,000 to $14,999 income bracket is the least frequent group with only 98 families (2.0%) belonging to this category.
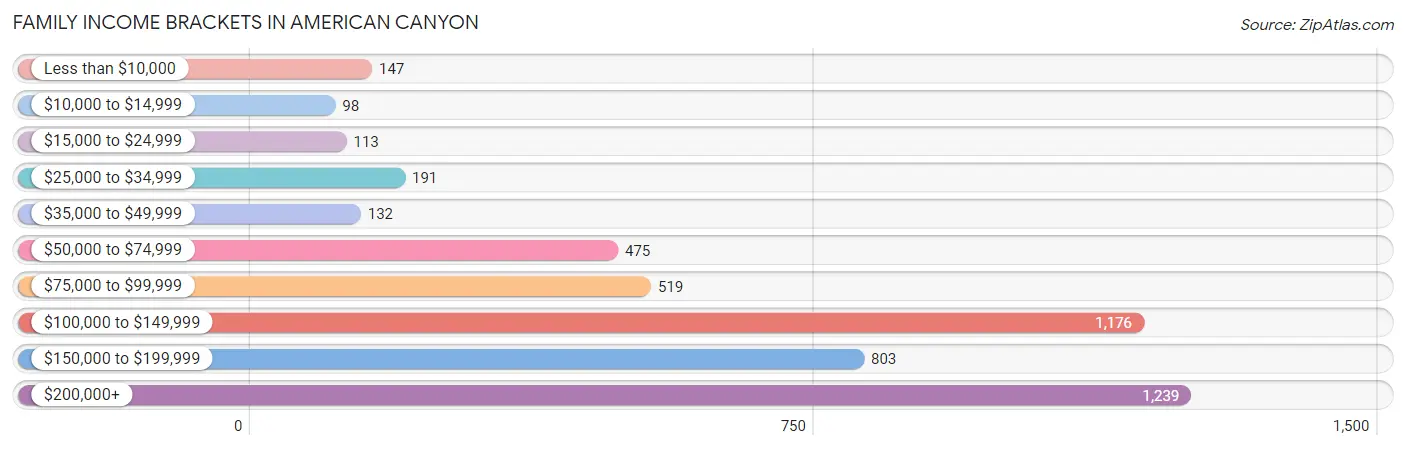
| Income Bracket | # Families | % Families |
| Less than $10,000 | 147 | 3.0% |
| $10,000 to $14,999 | 98 | 2.0% |
| $15,000 to $24,999 | 113 | 2.3% |
| $25,000 to $34,999 | 191 | 3.9% |
| $35,000 to $49,999 | 132 | 2.7% |
| $50,000 to $74,999 | 475 | 9.7% |
| $75,000 to $99,999 | 519 | 10.6% |
| $100,000 to $149,999 | 1,176 | 24.0% |
| $150,000 to $199,999 | 803 | 16.4% |
| $200,000+ | 1,239 | 25.3% |
Family Income by Famaliy Size in American Canyon
7+ person families (299 | 6.1%) account for the highest median family income in American Canyon with $185,972 per family, while 2-person families (1,276 | 26.1%) have the highest median income of $50,938 per family member.
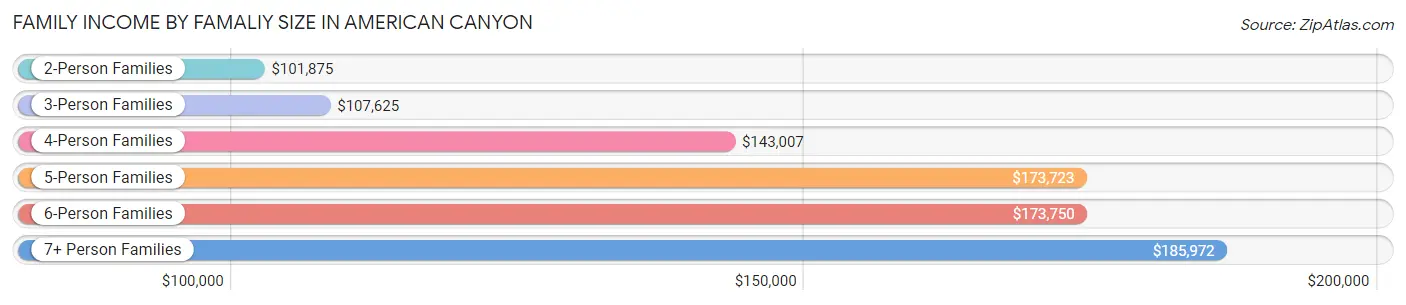
| Income Bracket | # Families | Median Income |
| 2-Person Families | 1,276 (26.1%) | $101,875 |
| 3-Person Families | 962 (19.6%) | $107,625 |
| 4-Person Families | 1,329 (27.1%) | $143,007 |
| 5-Person Families | 742 (15.1%) | $173,723 |
| 6-Person Families | 291 (5.9%) | $173,750 |
| 7+ Person Families | 299 (6.1%) | $185,972 |
| Total | 4,899 (100.0%) | $134,676 |
Family Income by Number of Earners in American Canyon
The median family income in American Canyon is $134,676, with families comprising 3+ earners (1,364) having the highest median family income of $187,270, while families with no earners (424) have the lowest median family income of $46,042, accounting for 27.8% and 8.6% of families, respectively.
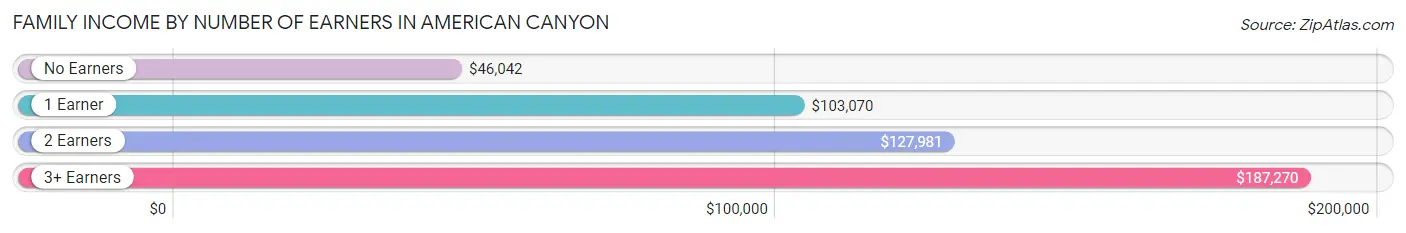
| Number of Earners | # Families | Median Income |
| No Earners | 424 (8.6%) | $46,042 |
| 1 Earner | 1,172 (23.9%) | $103,070 |
| 2 Earners | 1,939 (39.6%) | $127,981 |
| 3+ Earners | 1,364 (27.8%) | $187,270 |
| Total | 4,899 (100.0%) | $134,676 |
Household Income in American Canyon
Household Income Brackets in American Canyon
With 1,328 households falling in the category, the $200,000+ income range is the most frequent in American Canyon, accounting for 23.2% of all households. In contrast, only 114 households (2.0%) fall into the $10,000 to $14,999 income bracket, making it the least populous group.
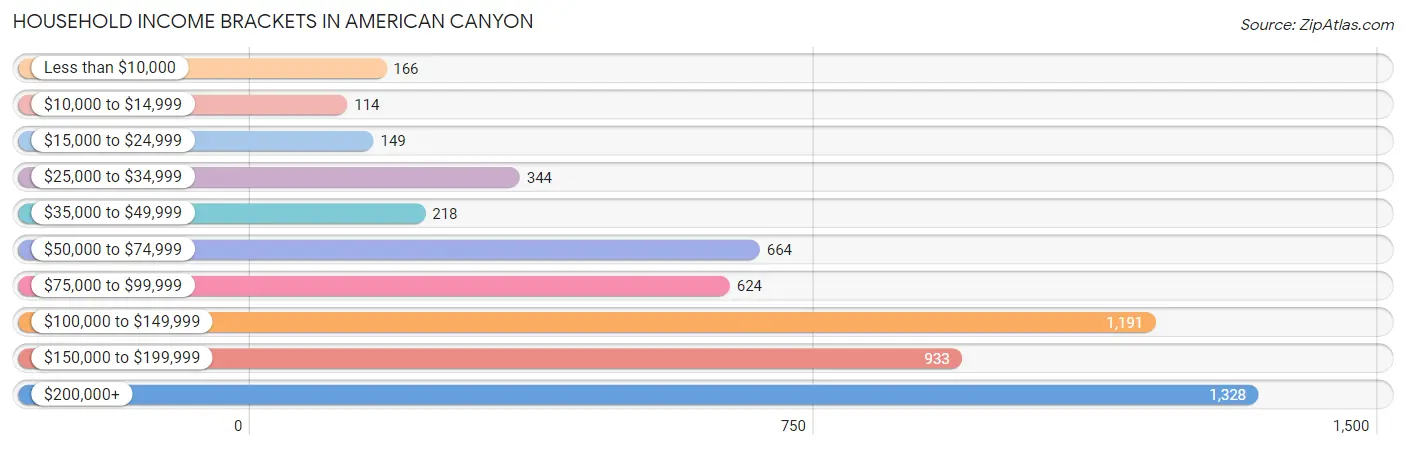
| Income Bracket | # Households | % Households |
| Less than $10,000 | 166 | 2.9% |
| $10,000 to $14,999 | 114 | 2.0% |
| $15,000 to $24,999 | 149 | 2.6% |
| $25,000 to $34,999 | 344 | 6.0% |
| $35,000 to $49,999 | 218 | 3.8% |
| $50,000 to $74,999 | 664 | 11.6% |
| $75,000 to $99,999 | 624 | 10.9% |
| $100,000 to $149,999 | 1,191 | 20.8% |
| $150,000 to $199,999 | 933 | 16.3% |
| $200,000+ | 1,328 | 23.2% |
Household Income by Householder Age in American Canyon
The median household income in American Canyon is $122,694, with the highest median household income of $146,615 found in the 45 to 64 years age bracket for the primary householder. A total of 2,653 households (46.3%) fall into this category. Meanwhile, the 15 to 24 years age bracket for the primary householder has the lowest median household income of $61,635, with 99 households (1.7%) in this group.
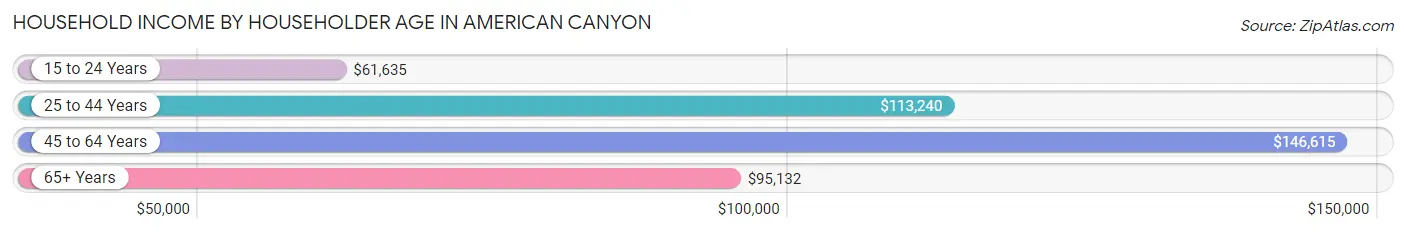
| Income Bracket | # Households | Median Income |
| 15 to 24 Years | 99 (1.7%) | $61,635 |
| 25 to 44 Years | 1,791 (31.3%) | $113,240 |
| 45 to 64 Years | 2,653 (46.3%) | $146,615 |
| 65+ Years | 1,182 (20.6%) | $95,132 |
| Total | 5,725 (100.0%) | $122,694 |
Poverty in American Canyon
Income Below Poverty by Sex and Age in American Canyon
With 8.2% poverty level for males and 6.7% for females among the residents of American Canyon, 16 and 17 year old males and 15 year old females are the most vulnerable to poverty, with 69 males (16.8%) and 33 females (33.0%) in their respective age groups living below the poverty level.
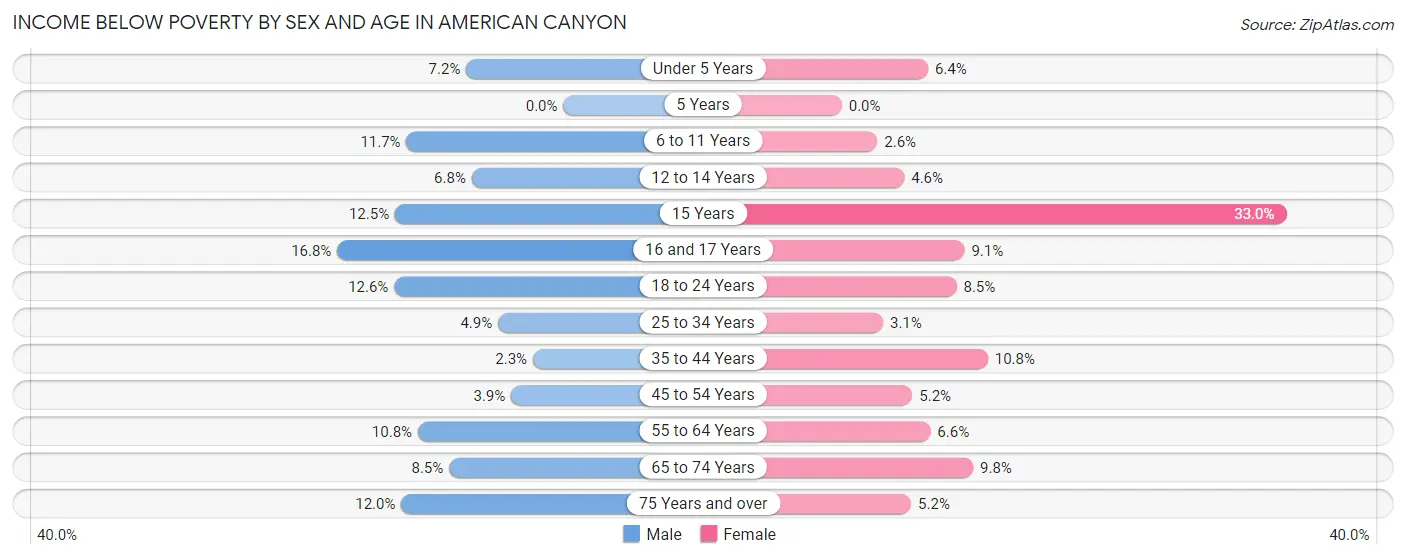
| Age Bracket | Male | Female |
| Under 5 Years | 38 (7.2%) | 38 (6.4%) |
| 5 Years | 0 (0.0%) | 0 (0.0%) |
| 6 to 11 Years | 108 (11.7%) | 24 (2.6%) |
| 12 to 14 Years | 34 (6.8%) | 28 (4.6%) |
| 15 Years | 24 (12.5%) | 33 (33.0%) |
| 16 and 17 Years | 69 (16.8%) | 38 (9.1%) |
| 18 to 24 Years | 149 (12.6%) | 104 (8.5%) |
| 25 to 34 Years | 64 (4.9%) | 41 (3.1%) |
| 35 to 44 Years | 25 (2.3%) | 164 (10.8%) |
| 45 to 54 Years | 56 (3.9%) | 79 (5.2%) |
| 55 to 64 Years | 164 (10.8%) | 82 (6.6%) |
| 65 to 74 Years | 66 (8.5%) | 82 (9.8%) |
| 75 Years and over | 57 (12.0%) | 34 (5.1%) |
| Total | 854 (8.2%) | 747 (6.7%) |
Income Above Poverty by Sex and Age in American Canyon
According to the poverty statistics in American Canyon, males aged 5 years and females aged 5 years are the age groups that are most secure financially, with 100.0% of males and 100.0% of females in these age groups living above the poverty line.
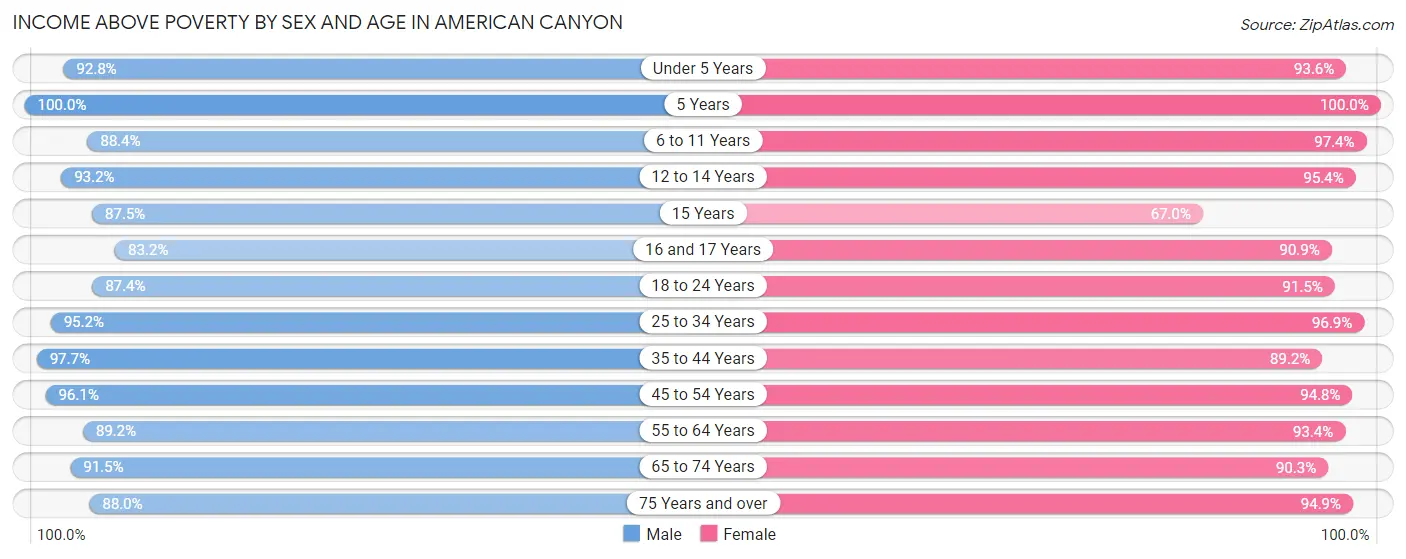
| Age Bracket | Male | Female |
| Under 5 Years | 489 (92.8%) | 556 (93.6%) |
| 5 Years | 66 (100.0%) | 133 (100.0%) |
| 6 to 11 Years | 819 (88.3%) | 886 (97.4%) |
| 12 to 14 Years | 466 (93.2%) | 576 (95.4%) |
| 15 Years | 168 (87.5%) | 67 (67.0%) |
| 16 and 17 Years | 342 (83.2%) | 379 (90.9%) |
| 18 to 24 Years | 1,037 (87.4%) | 1,117 (91.5%) |
| 25 to 34 Years | 1,256 (95.2%) | 1,297 (96.9%) |
| 35 to 44 Years | 1,081 (97.7%) | 1,349 (89.2%) |
| 45 to 54 Years | 1,386 (96.1%) | 1,428 (94.8%) |
| 55 to 64 Years | 1,355 (89.2%) | 1,165 (93.4%) |
| 65 to 74 Years | 712 (91.5%) | 759 (90.2%) |
| 75 Years and over | 417 (88.0%) | 626 (94.9%) |
| Total | 9,594 (91.8%) | 10,338 (93.3%) |
Income Below Poverty Among Married-Couple Families in American Canyon
The poverty statistics for married-couple families in American Canyon show that 4.3% or 161 of the total 3,721 families live below the poverty line. Families with 3 or 4 children have the highest poverty rate of 13.1%, comprising of 46 families. On the other hand, families with 5 or more children have the lowest poverty rate of 0.0%, which includes 0 families.
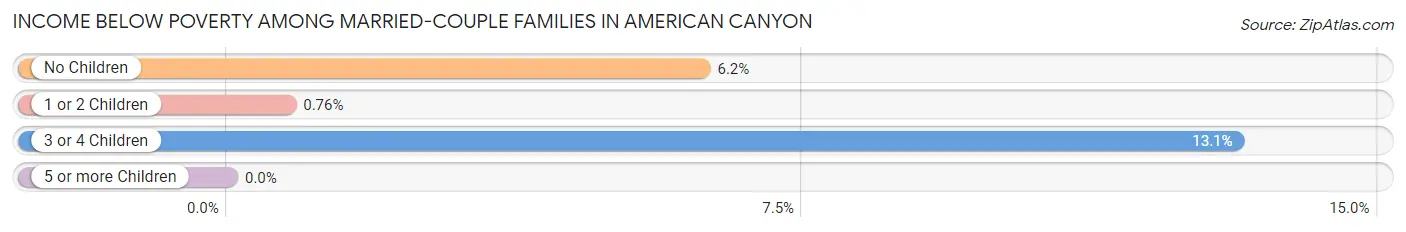
| Children | Above Poverty | Below Poverty |
| No Children | 1,551 (93.8%) | 102 (6.2%) |
| 1 or 2 Children | 1,690 (99.2%) | 13 (0.8%) |
| 3 or 4 Children | 304 (86.9%) | 46 (13.1%) |
| 5 or more Children | 15 (100.0%) | 0 (0.0%) |
| Total | 3,560 (95.7%) | 161 (4.3%) |
Income Below Poverty Among Single-Parent Households in American Canyon
According to the poverty data in American Canyon, 10.6% or 35 single-father households and 23.4% or 198 single-mother households are living below the poverty line. Among single-father households, those with 1 or 2 children have the highest poverty rate, with 35 households (20.8%) experiencing poverty. Likewise, among single-mother households, those with 3 or 4 children have the highest poverty rate, with 30 households (31.6%) falling below the poverty line.
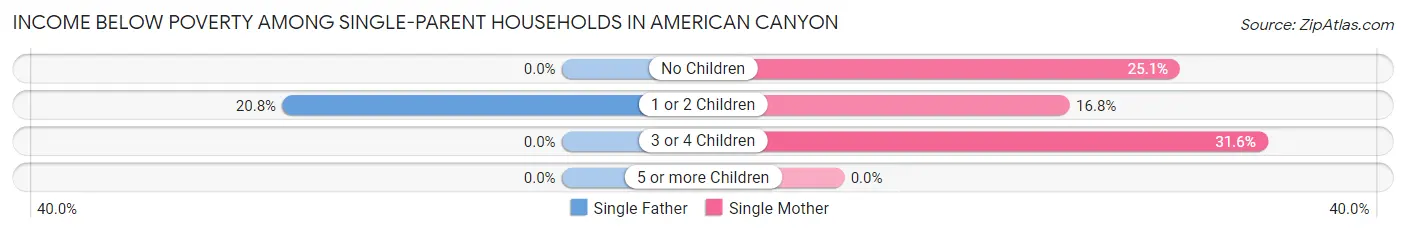
| Children | Single Father | Single Mother |
| No Children | 0 (0.0%) | 126 (25.1%) |
| 1 or 2 Children | 35 (20.8%) | 42 (16.8%) |
| 3 or 4 Children | 0 (0.0%) | 30 (31.6%) |
| 5 or more Children | 0 (0.0%) | 0 (0.0%) |
| Total | 35 (10.6%) | 198 (23.4%) |
Income Below Poverty Among Married-Couple vs Single-Parent Households in American Canyon
The poverty data for American Canyon shows that 161 of the married-couple family households (4.3%) and 233 of the single-parent households (19.8%) are living below the poverty level. Within the married-couple family households, those with 3 or 4 children have the highest poverty rate, with 46 households (13.1%) falling below the poverty line. Among the single-parent households, those with 3 or 4 children have the highest poverty rate, with 30 household (27.3%) living below poverty.
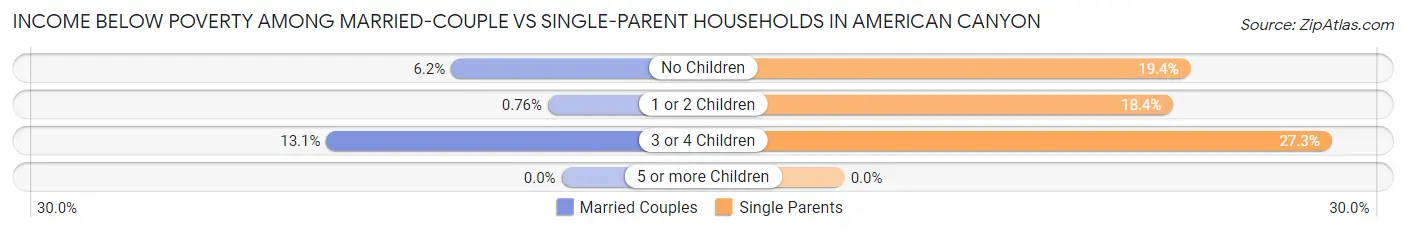
| Children | Married-Couple Families | Single-Parent Households |
| No Children | 102 (6.2%) | 126 (19.4%) |
| 1 or 2 Children | 13 (0.8%) | 77 (18.4%) |
| 3 or 4 Children | 46 (13.1%) | 30 (27.3%) |
| 5 or more Children | 0 (0.0%) | 0 (0.0%) |
| Total | 161 (4.3%) | 233 (19.8%) |
Race in American Canyon
The most populous races in American Canyon are Asian (7,558 | 34.9%), White / Caucasian (7,038 | 32.5%), and Hispanic or Latino (6,162 | 28.4%).
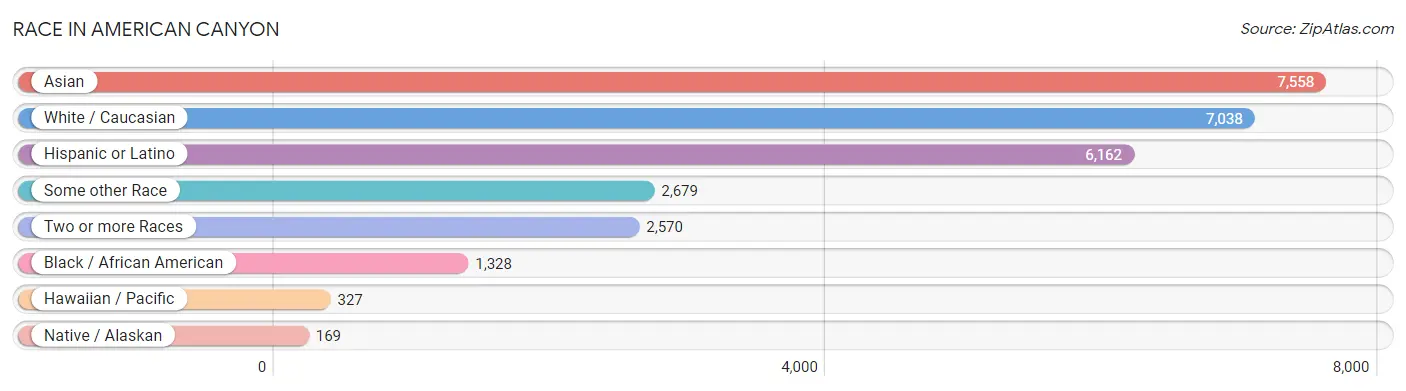
| Race | # Population | % Population |
| Asian | 7,558 | 34.9% |
| Black / African American | 1,328 | 6.1% |
| Hawaiian / Pacific | 327 | 1.5% |
| Hispanic or Latino | 6,162 | 28.4% |
| Native / Alaskan | 169 | 0.8% |
| White / Caucasian | 7,038 | 32.5% |
| Two or more Races | 2,570 | 11.9% |
| Some other Race | 2,679 | 12.4% |
| Total | 21,669 | 100.0% |
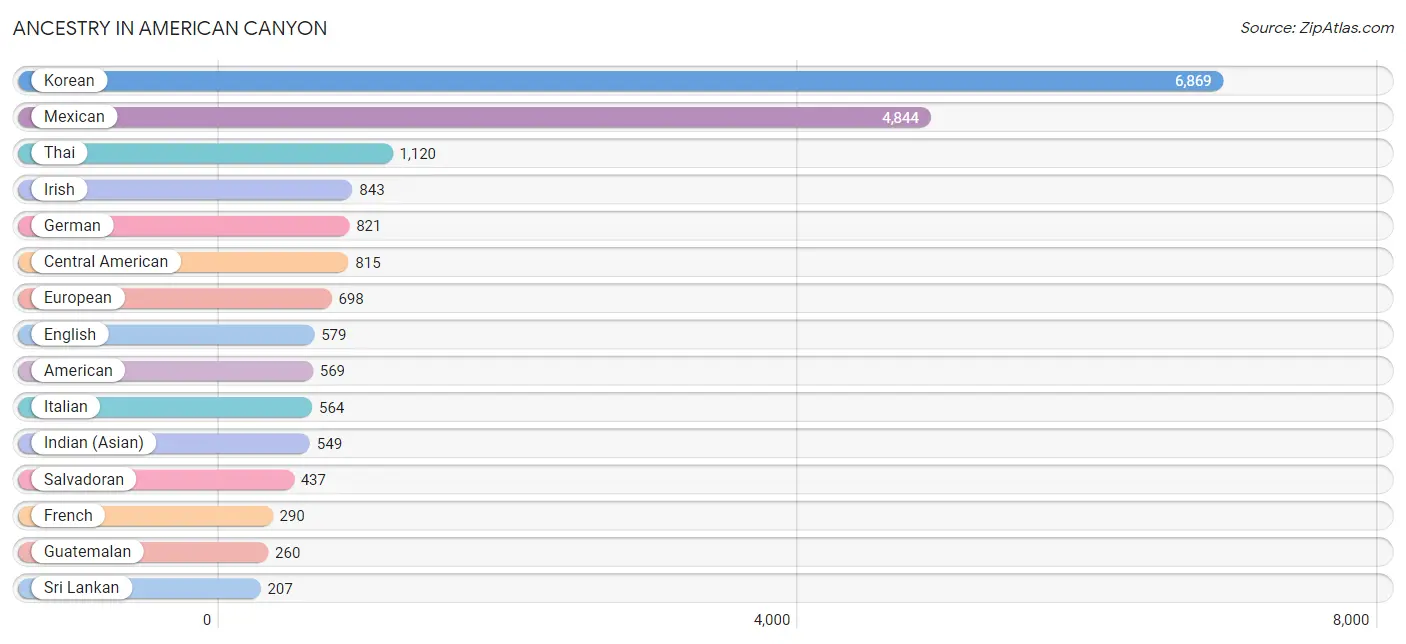
Ancestry in American Canyon
The most populous ancestries reported in American Canyon are Korean (6,869 | 31.7%), Mexican (4,844 | 22.4%), Thai (1,120 | 5.2%), Irish (843 | 3.9%), and German (821 | 3.8%), together accounting for 66.9% of all American Canyon residents.
| Ancestry | # Population | % Population |
| African | 83 | 0.4% |
| Alaskan Athabascan | 6 | 0.0% |
| American | 569 | 2.6% |
| Apache | 56 | 0.3% |
| Arab | 136 | 0.6% |
| Armenian | 9 | 0.0% |
| Austrian | 21 | 0.1% |
| Bhutanese | 150 | 0.7% |
| Blackfeet | 13 | 0.1% |
| British | 37 | 0.2% |
| Burmese | 94 | 0.4% |
| Cape Verdean | 39 | 0.2% |
| Central American | 815 | 3.8% |
| Central American Indian | 21 | 0.1% |
| Cherokee | 7 | 0.0% |
| Chickasaw | 6 | 0.0% |
| Choctaw | 111 | 0.5% |
| Cuban | 45 | 0.2% |
| Czech | 17 | 0.1% |
| Danish | 4 | 0.0% |
| Dutch | 136 | 0.6% |
| Eastern European | 20 | 0.1% |
| Egyptian | 2 | 0.0% |
| English | 579 | 2.7% |
| European | 698 | 3.2% |
| Filipino | 21 | 0.1% |
| Finnish | 7 | 0.0% |
| French | 290 | 1.3% |
| French Canadian | 23 | 0.1% |
| German | 821 | 3.8% |
| Ghanaian | 12 | 0.1% |
| Greek | 31 | 0.1% |
| Guamanian / Chamorro | 57 | 0.3% |
| Guatemalan | 260 | 1.2% |
| Hungarian | 32 | 0.2% |
| Indian (Asian) | 549 | 2.5% |
| Iranian | 16 | 0.1% |
| Iraqi | 5 | 0.0% |
| Irish | 843 | 3.9% |
| Iroquois | 2 | 0.0% |
| Italian | 564 | 2.6% |
| Jamaican | 34 | 0.2% |
| Jordanian | 24 | 0.1% |
| Korean | 6,869 | 31.7% |
| Lebanese | 23 | 0.1% |
| Maltese | 32 | 0.2% |
| Mexican | 4,844 | 22.4% |
| Mexican American Indian | 111 | 0.5% |
| Native Hawaiian | 149 | 0.7% |
| Nicaraguan | 16 | 0.1% |
| Nigerian | 30 | 0.1% |
| Northern European | 16 | 0.1% |
| Norwegian | 53 | 0.2% |
| Pakistani | 14 | 0.1% |
| Palestinian | 13 | 0.1% |
| Panamanian | 102 | 0.5% |
| Peruvian | 76 | 0.4% |
| Polish | 202 | 0.9% |
| Portuguese | 141 | 0.6% |
| Puerto Rican | 55 | 0.3% |
| Romanian | 6 | 0.0% |
| Russian | 45 | 0.2% |
| Salvadoran | 437 | 2.0% |
| Samoan | 77 | 0.4% |
| Scandinavian | 19 | 0.1% |
| Scotch-Irish | 37 | 0.2% |
| Scottish | 91 | 0.4% |
| Slovak | 2 | 0.0% |
| South American | 83 | 0.4% |
| Spaniard | 107 | 0.5% |
| Spanish | 44 | 0.2% |
| Sri Lankan | 207 | 1.0% |
| Subsaharan African | 164 | 0.8% |
| Swedish | 89 | 0.4% |
| Swiss | 16 | 0.1% |
| Thai | 1,120 | 5.2% |
| Tlingit-Haida | 3 | 0.0% |
| Tongan | 23 | 0.1% |
| Turkish | 2 | 0.0% |
| Ukrainian | 11 | 0.1% |
| Uruguayan | 7 | 0.0% |
| Welsh | 53 | 0.2% |
| Yaqui | 52 | 0.2% | View All 83 Rows |
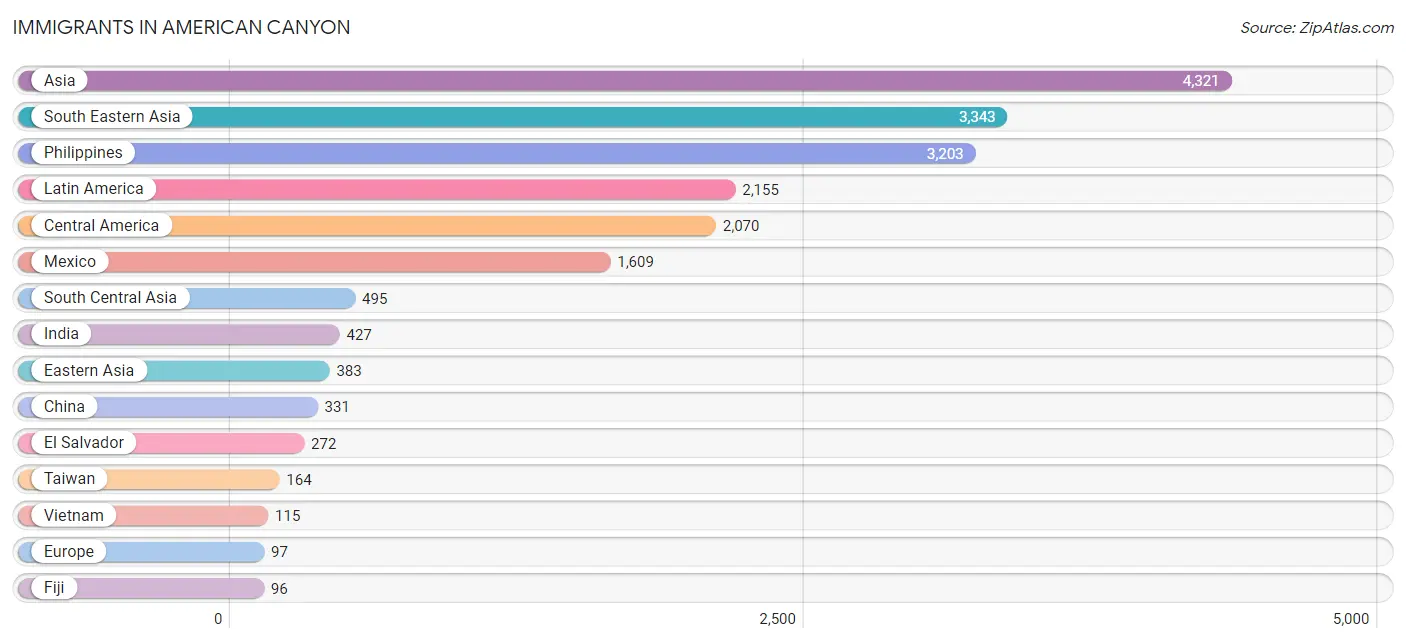
Immigrants in American Canyon
The most numerous immigrant groups reported in American Canyon came from Asia (4,321 | 19.9%), South Eastern Asia (3,343 | 15.4%), Philippines (3,203 | 14.8%), Latin America (2,155 | 10.0%), and Central America (2,070 | 9.6%), together accounting for 69.7% of all American Canyon residents.
| Immigration Origin | # Population | % Population |
| Africa | 68 | 0.3% |
| Asia | 4,321 | 19.9% |
| Brazil | 5 | 0.0% |
| Cameroon | 15 | 0.1% |
| Canada | 6 | 0.0% |
| Caribbean | 39 | 0.2% |
| Central America | 2,070 | 9.6% |
| China | 331 | 1.5% |
| Cuba | 12 | 0.1% |
| Czechoslovakia | 6 | 0.0% |
| Eastern Africa | 7 | 0.0% |
| Eastern Asia | 383 | 1.8% |
| Eastern Europe | 40 | 0.2% |
| El Salvador | 272 | 1.3% |
| England | 12 | 0.1% |
| Eritrea | 7 | 0.0% |
| Europe | 97 | 0.4% |
| Fiji | 96 | 0.4% |
| France | 3 | 0.0% |
| Ghana | 17 | 0.1% |
| Greece | 5 | 0.0% |
| Guatemala | 96 | 0.4% |
| Honduras | 13 | 0.1% |
| Hong Kong | 38 | 0.2% |
| Hungary | 4 | 0.0% |
| India | 427 | 2.0% |
| Indonesia | 17 | 0.1% |
| Iran | 25 | 0.1% |
| Iraq | 55 | 0.3% |
| Ireland | 9 | 0.0% |
| Jamaica | 27 | 0.1% |
| Japan | 23 | 0.1% |
| Jordan | 24 | 0.1% |
| Korea | 29 | 0.1% |
| Latin America | 2,155 | 10.0% |
| Malaysia | 4 | 0.0% |
| Mexico | 1,609 | 7.4% |
| Middle Africa | 15 | 0.1% |
| Nicaragua | 16 | 0.1% |
| Northern Europe | 28 | 0.1% |
| Oceania | 96 | 0.4% |
| Pakistan | 43 | 0.2% |
| Panama | 64 | 0.3% |
| Peru | 36 | 0.2% |
| Philippines | 3,203 | 14.8% |
| Portugal | 6 | 0.0% |
| Sierra Leone | 17 | 0.1% |
| South Africa | 12 | 0.1% |
| South America | 46 | 0.2% |
| South Central Asia | 495 | 2.3% |
| South Eastern Asia | 3,343 | 15.4% |
| Southern Europe | 26 | 0.1% |
| Spain | 15 | 0.1% |
| Taiwan | 164 | 0.8% |
| Thailand | 4 | 0.0% |
| Turkey | 2 | 0.0% |
| Ukraine | 30 | 0.1% |
| Vietnam | 115 | 0.5% |
| Western Africa | 34 | 0.2% |
| Western Asia | 81 | 0.4% |
| Western Europe | 3 | 0.0% | View All 61 Rows |
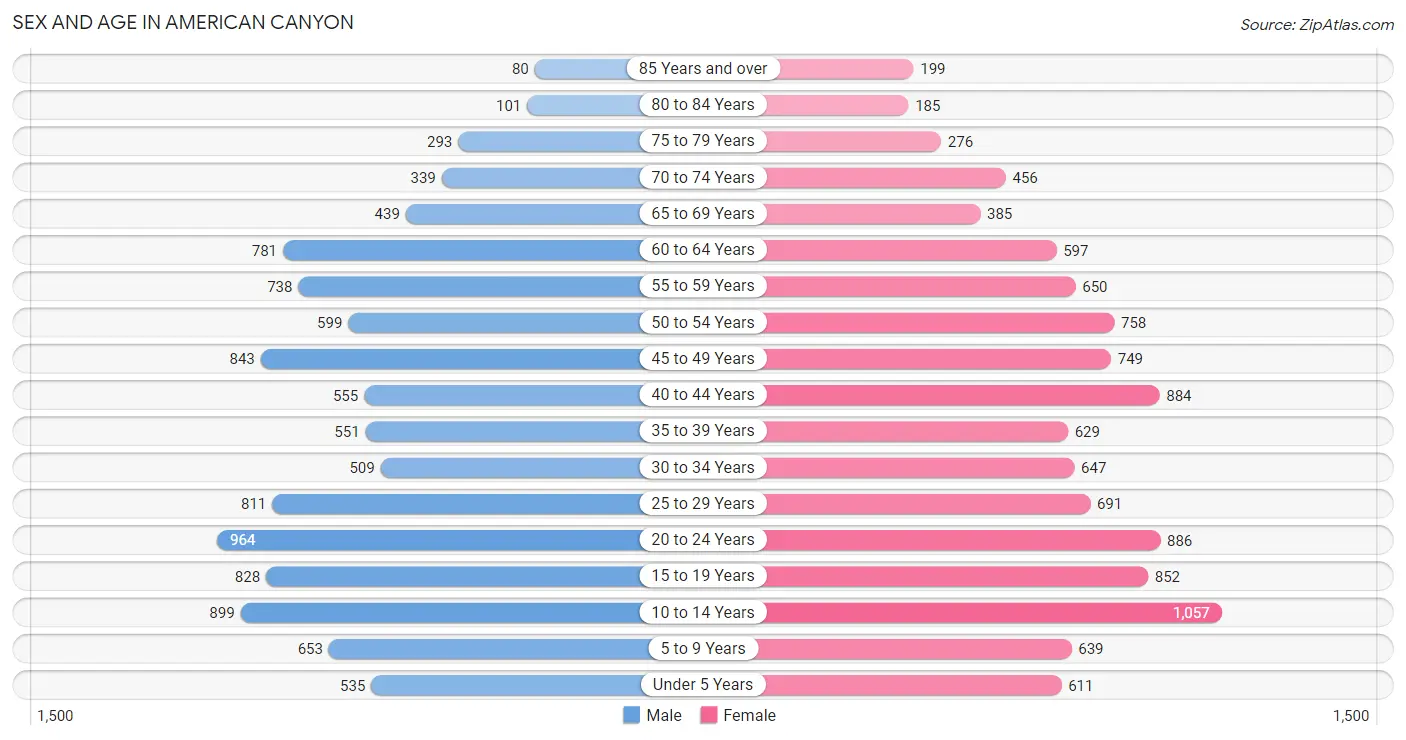
Sex and Age in American Canyon
Sex and Age in American Canyon
The most populous age groups in American Canyon are 20 to 24 Years (964 | 9.2%) for men and 10 to 14 Years (1,057 | 9.5%) for women.
| Age Bracket | Male | Female |
| Under 5 Years | 535 (5.1%) | 611 (5.5%) |
| 5 to 9 Years | 653 (6.2%) | 639 (5.7%) |
| 10 to 14 Years | 899 (8.6%) | 1,057 (9.5%) |
| 15 to 19 Years | 828 (7.9%) | 852 (7.6%) |
| 20 to 24 Years | 964 (9.2%) | 886 (8.0%) |
| 25 to 29 Years | 811 (7.7%) | 691 (6.2%) |
| 30 to 34 Years | 509 (4.8%) | 647 (5.8%) |
| 35 to 39 Years | 551 (5.2%) | 629 (5.6%) |
| 40 to 44 Years | 555 (5.3%) | 884 (7.9%) |
| 45 to 49 Years | 843 (8.0%) | 749 (6.7%) |
| 50 to 54 Years | 599 (5.7%) | 758 (6.8%) |
| 55 to 59 Years | 738 (7.0%) | 650 (5.8%) |
| 60 to 64 Years | 781 (7.4%) | 597 (5.3%) |
| 65 to 69 Years | 439 (4.2%) | 385 (3.5%) |
| 70 to 74 Years | 339 (3.2%) | 456 (4.1%) |
| 75 to 79 Years | 293 (2.8%) | 276 (2.5%) |
| 80 to 84 Years | 101 (1.0%) | 185 (1.7%) |
| 85 Years and over | 80 (0.8%) | 199 (1.8%) |
| Total | 10,518 (100.0%) | 11,151 (100.0%) |
Families and Households in American Canyon
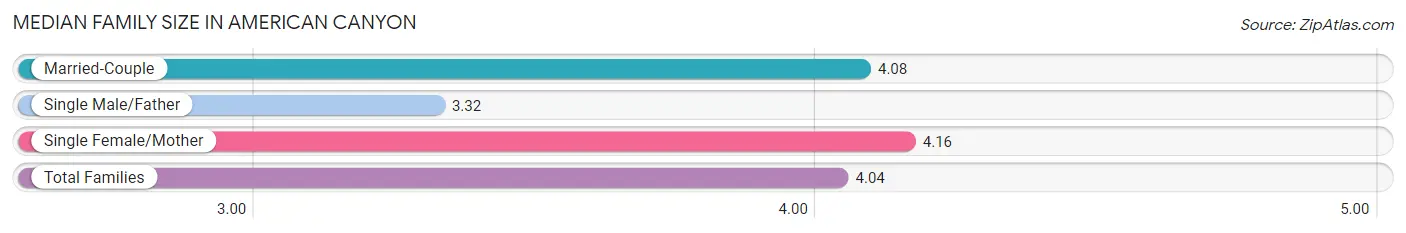
Median Family Size in American Canyon
The median family size in American Canyon is 4.04 persons per family, with single female/mother families (848 | 17.3%) accounting for the largest median family size of 4.16 persons per family. On the other hand, single male/father families (330 | 6.7%) represent the smallest median family size with 3.32 persons per family.
| Family Type | # Families | Family Size |
| Married-Couple | 3,721 (75.9%) | 4.08 |
| Single Male/Father | 330 (6.7%) | 3.32 |
| Single Female/Mother | 848 (17.3%) | 4.16 |
| Total Families | 4,899 (100.0%) | 4.04 |
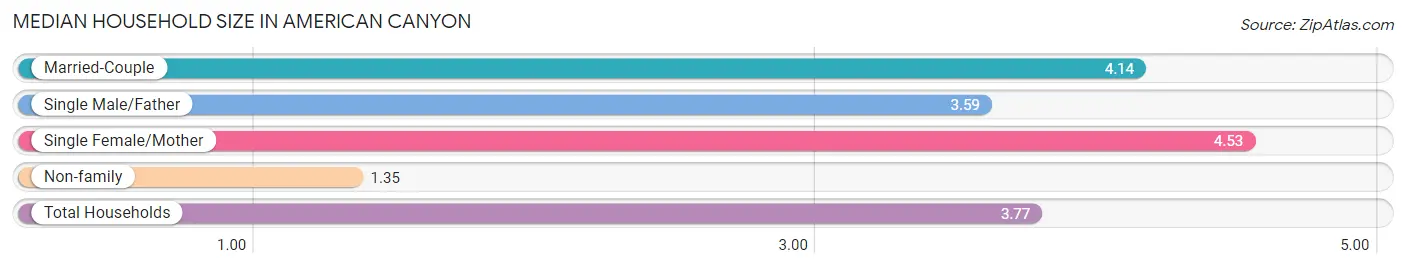
Median Household Size in American Canyon
The median household size in American Canyon is 3.77 persons per household, with single female/mother households (848 | 14.8%) accounting for the largest median household size of 4.53 persons per household. non-family households (826 | 14.4%) represent the smallest median household size with 1.35 persons per household.
| Household Type | # Households | Household Size |
| Married-Couple | 3,721 (65.0%) | 4.14 |
| Single Male/Father | 330 (5.8%) | 3.59 |
| Single Female/Mother | 848 (14.8%) | 4.53 |
| Non-family | 826 (14.4%) | 1.35 |
| Total Households | 5,725 (100.0%) | 3.77 |
Household Size by Marriage Status in American Canyon
Out of a total of 5,725 households in American Canyon, 4,899 (85.6%) are family households, while 826 (14.4%) are nonfamily households. The most numerous type of family households are 4-person households, comprising 1,356, and the most common type of nonfamily households are 1-person households, comprising 611.
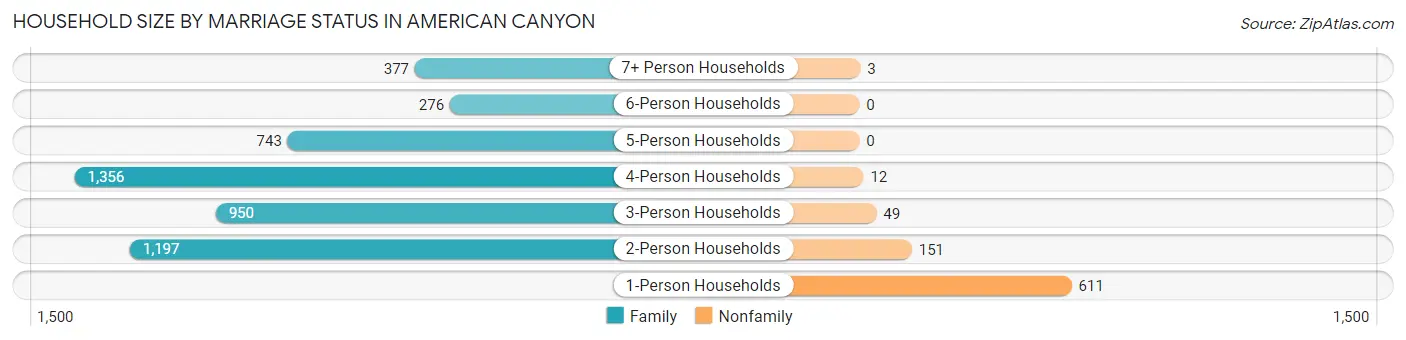
| Household Size | Family Households | Nonfamily Households |
| 1-Person Households | - | 611 (10.7%) |
| 2-Person Households | 1,197 (20.9%) | 151 (2.6%) |
| 3-Person Households | 950 (16.6%) | 49 (0.9%) |
| 4-Person Households | 1,356 (23.7%) | 12 (0.2%) |
| 5-Person Households | 743 (13.0%) | 0 (0.0%) |
| 6-Person Households | 276 (4.8%) | 0 (0.0%) |
| 7+ Person Households | 377 (6.6%) | 3 (0.1%) |
| Total | 4,899 (85.6%) | 826 (14.4%) |
Female Fertility in American Canyon
Fertility by Age in American Canyon
Average fertility rate in American Canyon is 34.0 births per 1,000 women. Women in the age bracket of 20 to 34 years have the highest fertility rate with 54.0 births per 1,000 women. Women in the age bracket of 20 to 34 years acount for 64.7% of all women with births.
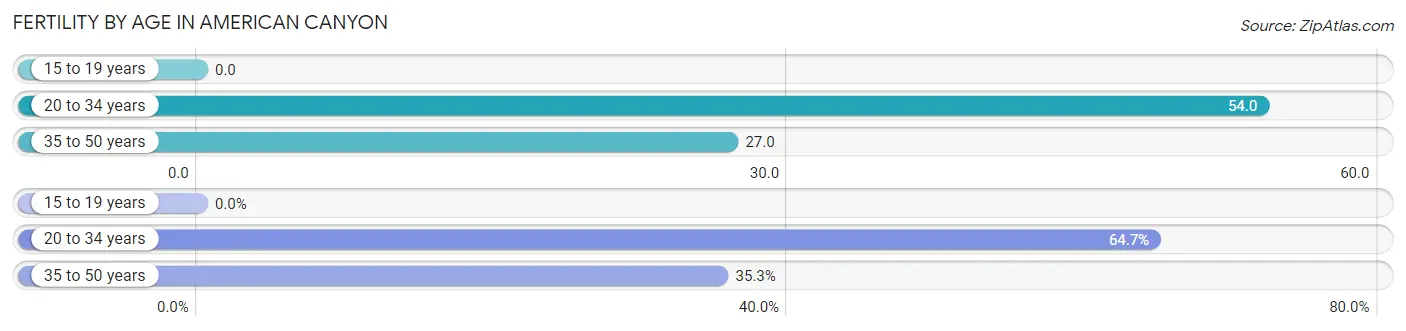
| Age Bracket | Women with Births | Births / 1,000 Women |
| 15 to 19 years | 0 (0.0%) | 0.0 |
| 20 to 34 years | 119 (64.7%) | 54.0 |
| 35 to 50 years | 65 (35.3%) | 27.0 |
| Total | 184 (100.0%) | 34.0 |
Fertility by Age by Marriage Status in American Canyon
62.5% of women with births (184) in American Canyon are married. The highest percentage of unmarried women with births falls into 35 to 50 years age bracket with 56.9% of them unmarried at the time of birth, while the lowest percentage of unmarried women with births belong to 20 to 34 years age bracket with 26.9% of them unmarried.
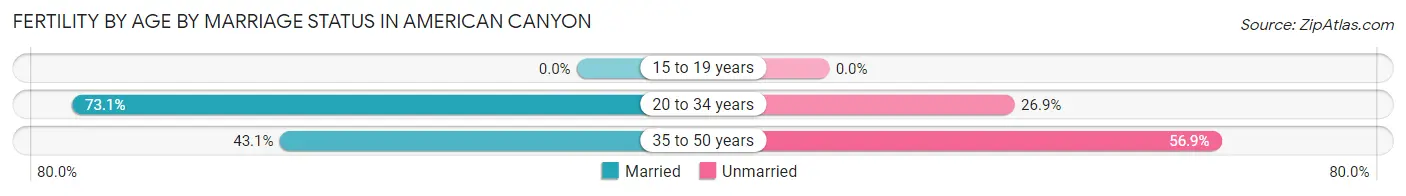
| Age Bracket | Married | Unmarried |
| 15 to 19 years | 0 (0.0%) | 0 (0.0%) |
| 20 to 34 years | 87 (73.1%) | 32 (26.9%) |
| 35 to 50 years | 28 (43.1%) | 37 (56.9%) |
| Total | 115 (62.5%) | 69 (37.5%) |
Fertility by Education in American Canyon
Average fertility rate in American Canyon is 34.0 births per 1,000 women. Women with the education attainment of bachelor's degree have the highest fertility rate of 68.0 births per 1,000 women, while women with the education attainment of less than high school have the lowest fertility at 10.0 births per 1,000 women. Women with the education attainment of bachelor's degree represent 53.8% of all women with births.
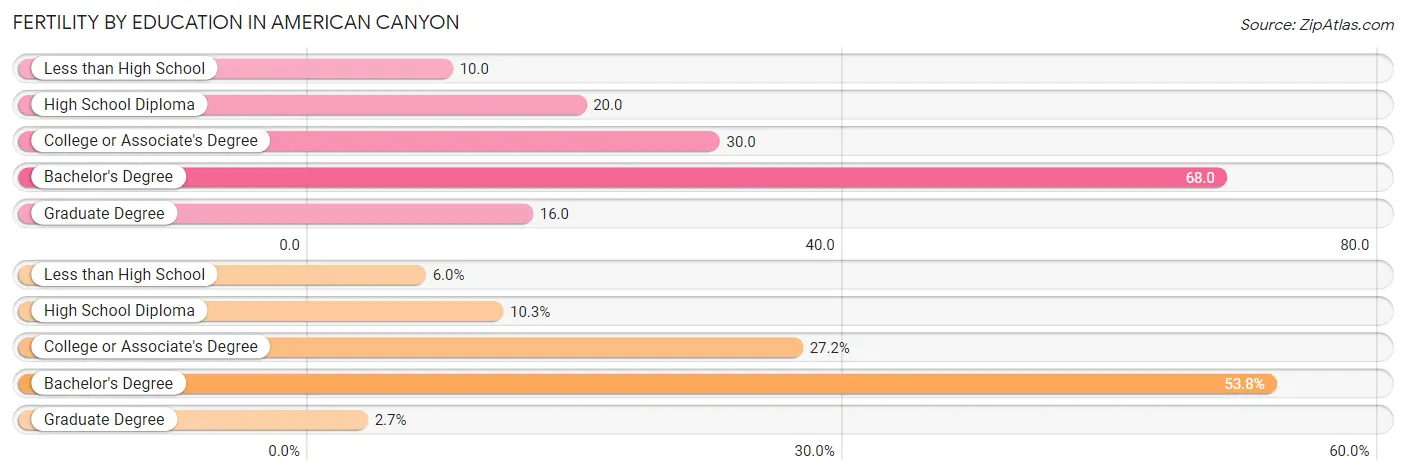
| Educational Attainment | Women with Births | Births / 1,000 Women |
| Less than High School | 11 (6.0%) | 10.0 |
| High School Diploma | 19 (10.3%) | 20.0 |
| College or Associate's Degree | 50 (27.2%) | 30.0 |
| Bachelor's Degree | 99 (53.8%) | 68.0 |
| Graduate Degree | 5 (2.7%) | 16.0 |
| Total | 184 (100.0%) | 34.0 |
Fertility by Education by Marriage Status in American Canyon
37.5% of women with births in American Canyon are unmarried. Women with the educational attainment of college or associate's degree are most likely to be married with 100.0% of them married at childbirth, while women with the educational attainment of less than high school are least likely to be married with 100.0% of them unmarried at childbirth.
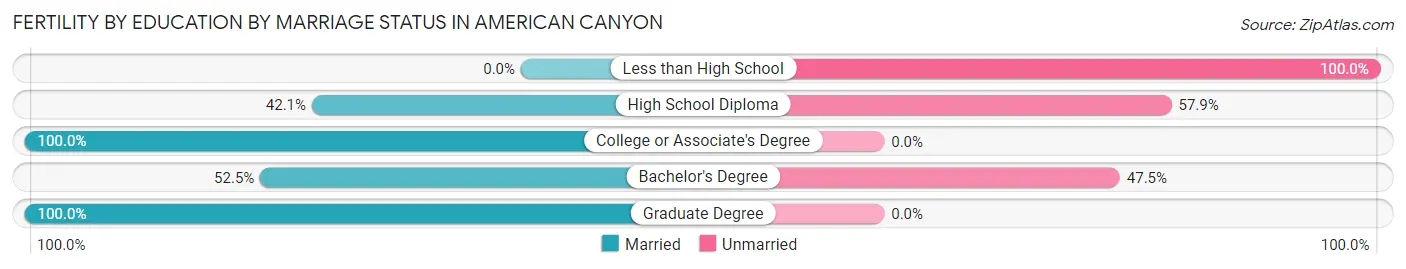
| Educational Attainment | Married | Unmarried |
| Less than High School | 0 (0.0%) | 11 (100.0%) |
| High School Diploma | 8 (42.1%) | 11 (57.9%) |
| College or Associate's Degree | 50 (100.0%) | 0 (0.0%) |
| Bachelor's Degree | 52 (52.5%) | 47 (47.5%) |
| Graduate Degree | 5 (100.0%) | 0 (0.0%) |
| Total | 115 (62.5%) | 69 (37.5%) |
Employment Characteristics in American Canyon
Employment by Class of Employer in American Canyon
Among the 10,507 employed individuals in American Canyon, private company employees (6,696 | 63.7%), state government employees (1,048 | 10.0%), and local government employees (894 | 8.5%) make up the most common classes of employment.
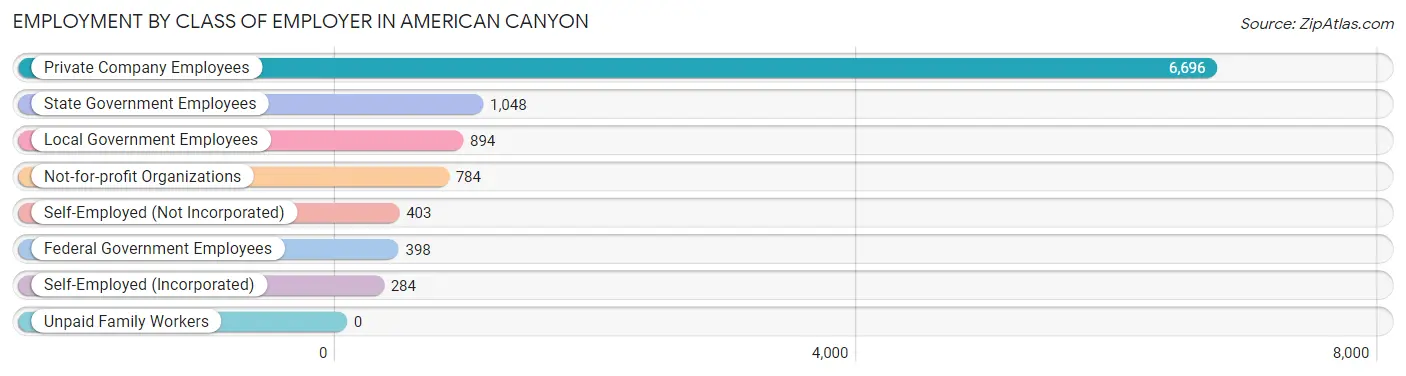
| Employer Class | # Employees | % Employees |
| Private Company Employees | 6,696 | 63.7% |
| Self-Employed (Incorporated) | 284 | 2.7% |
| Self-Employed (Not Incorporated) | 403 | 3.8% |
| Not-for-profit Organizations | 784 | 7.5% |
| Local Government Employees | 894 | 8.5% |
| State Government Employees | 1,048 | 10.0% |
| Federal Government Employees | 398 | 3.8% |
| Unpaid Family Workers | 0 | 0.0% |
| Total | 10,507 | 100.0% |
Employment Status by Age in American Canyon
According to the labor force statistics for American Canyon, out of the total population over 16 years of age (16,983), 67.1% or 11,396 individuals are in the labor force, with 5.0% or 570 of them unemployed. The age group with the highest labor force participation rate is 30 to 34 years, with 90.7% or 1,048 individuals in the labor force. Within the labor force, the 16 to 19 years age range has the highest percentage of unemployed individuals, with 18.4% or 76 of them being unemployed.
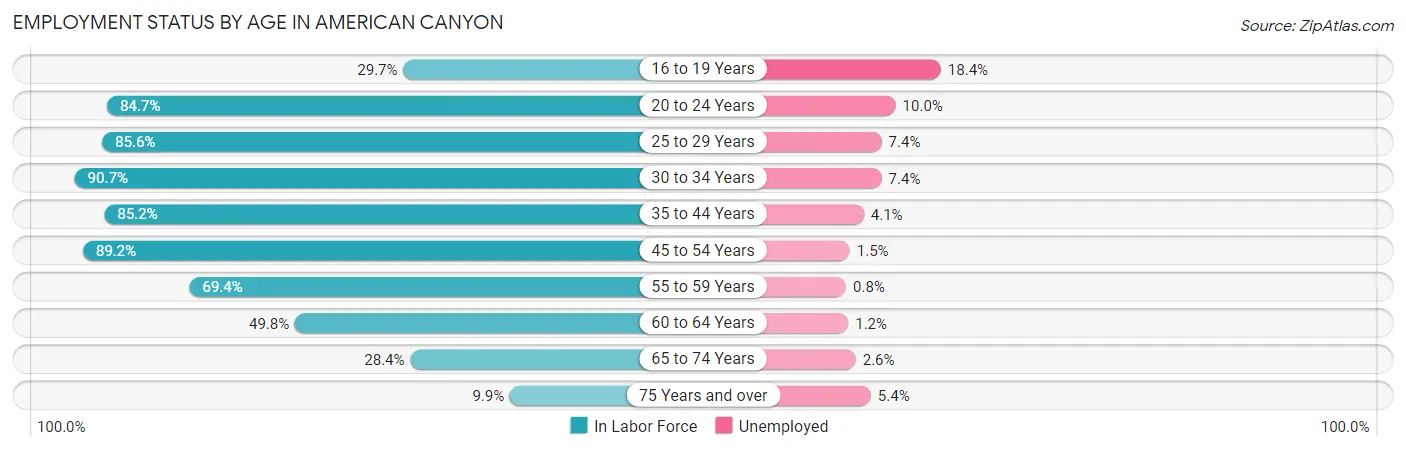
| Age Bracket | In Labor Force | Unemployed |
| 16 to 19 Years | 412 (29.7%) | 76 (18.4%) |
| 20 to 24 Years | 1,567 (84.7%) | 157 (10.0%) |
| 25 to 29 Years | 1,286 (85.6%) | 95 (7.4%) |
| 30 to 34 Years | 1,048 (90.7%) | 78 (7.4%) |
| 35 to 44 Years | 2,231 (85.2%) | 91 (4.1%) |
| 45 to 54 Years | 2,631 (89.2%) | 39 (1.5%) |
| 55 to 59 Years | 963 (69.4%) | 8 (0.8%) |
| 60 to 64 Years | 686 (49.8%) | 8 (1.2%) |
| 65 to 74 Years | 460 (28.4%) | 12 (2.6%) |
| 75 Years and over | 112 (9.9%) | 6 (5.4%) |
| Total | 11,396 (67.1%) | 570 (5.0%) |
Employment Status by Educational Attainment in American Canyon
According to labor force statistics for American Canyon, 80.5% of individuals (8,849) out of the total population between 25 and 64 years of age (10,992) are in the labor force, with 3.6% or 319 of them being unemployed. The group with the highest labor force participation rate are those with the educational attainment of bachelor's degree or higher, with 84.5% or 3,293 individuals in the labor force. Within the labor force, individuals with high school diploma education have the highest percentage of unemployment, with 5.8% or 86 of them being unemployed.
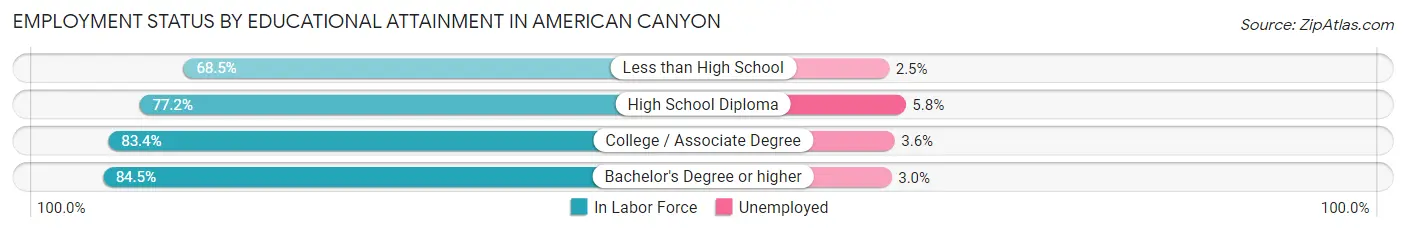
| Educational Attainment | In Labor Force | Unemployed |
| Less than High School | 1,124 (68.5%) | 41 (2.5%) |
| High School Diploma | 1,482 (77.2%) | 111 (5.8%) |
| College / Associate Degree | 2,947 (83.4%) | 127 (3.6%) |
| Bachelor's Degree or higher | 3,293 (84.5%) | 117 (3.0%) |
| Total | 8,849 (80.5%) | 396 (3.6%) |
Employment Occupations by Sex in American Canyon
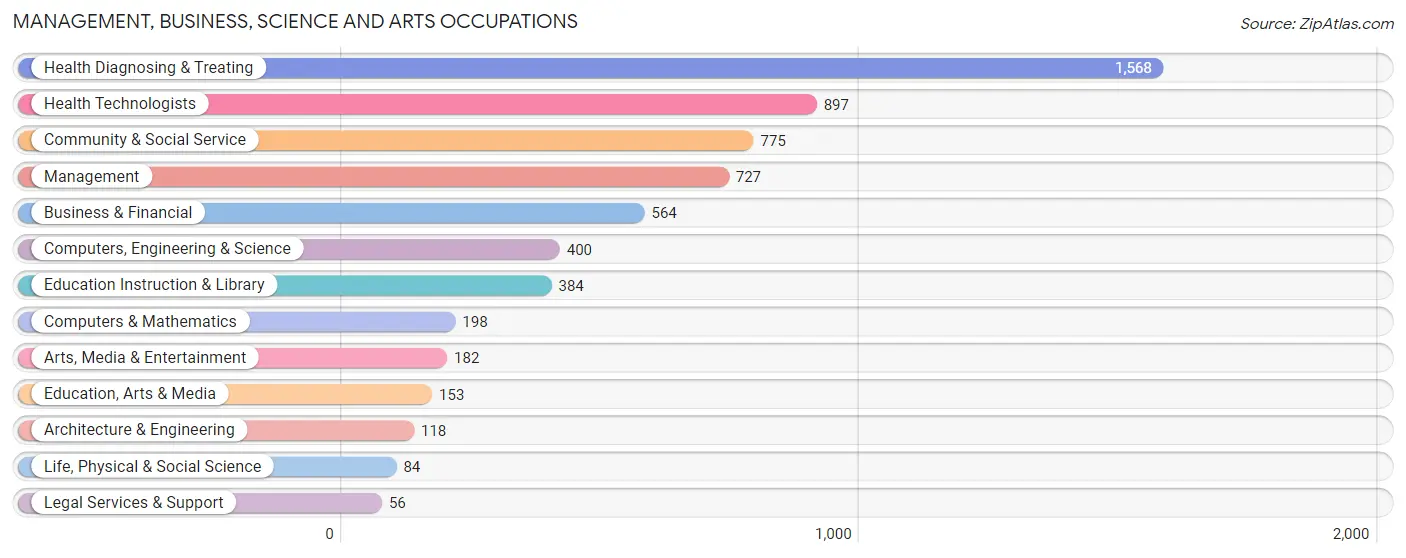
Management, Business, Science and Arts Occupations
The most common Management, Business, Science and Arts occupations in American Canyon are Health Diagnosing & Treating (1,568 | 14.5%), Health Technologists (897 | 8.3%), Community & Social Service (775 | 7.2%), Management (727 | 6.7%), and Business & Financial (564 | 5.2%).
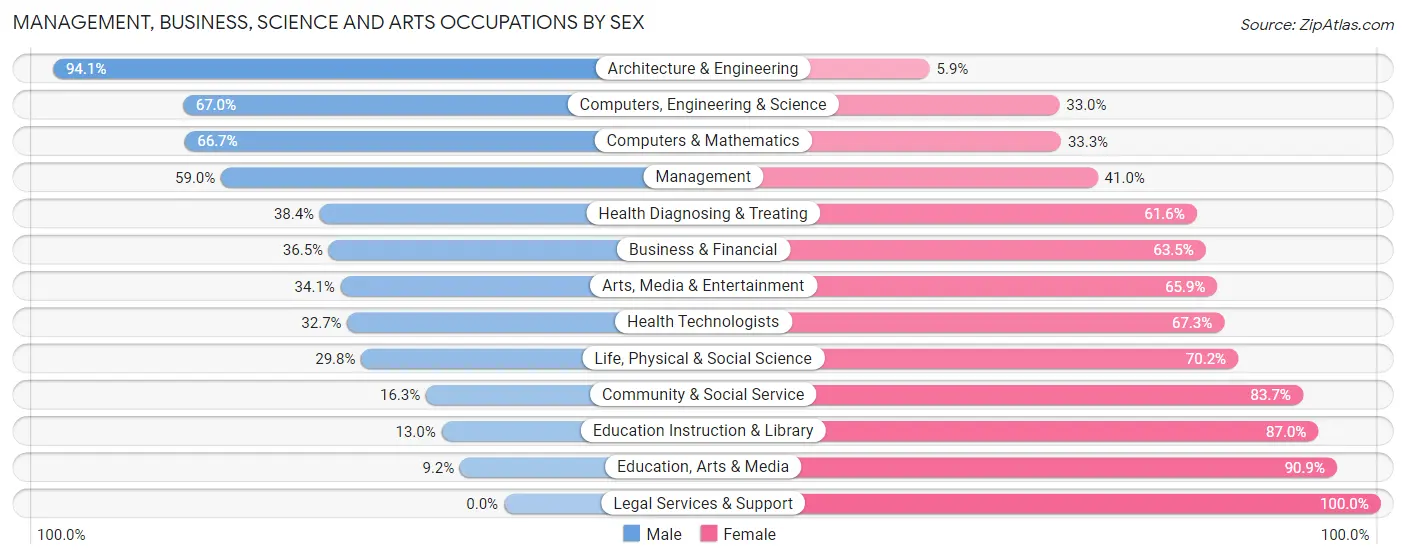
Management, Business, Science and Arts Occupations by Sex
Within the Management, Business, Science and Arts occupations in American Canyon, the most male-oriented occupations are Architecture & Engineering (94.1%), Computers, Engineering & Science (67.0%), and Computers & Mathematics (66.7%), while the most female-oriented occupations are Legal Services & Support (100.0%), Education, Arts & Media (90.8%), and Education Instruction & Library (87.0%).
| Occupation | Male | Female |
| Management | 429 (59.0%) | 298 (41.0%) |
| Business & Financial | 206 (36.5%) | 358 (63.5%) |
| Computers, Engineering & Science | 268 (67.0%) | 132 (33.0%) |
| Computers & Mathematics | 132 (66.7%) | 66 (33.3%) |
| Architecture & Engineering | 111 (94.1%) | 7 (5.9%) |
| Life, Physical & Social Science | 25 (29.8%) | 59 (70.2%) |
| Community & Social Service | 126 (16.3%) | 649 (83.7%) |
| Education, Arts & Media | 14 (9.1%) | 139 (90.8%) |
| Legal Services & Support | 0 (0.0%) | 56 (100.0%) |
| Education Instruction & Library | 50 (13.0%) | 334 (87.0%) |
| Arts, Media & Entertainment | 62 (34.1%) | 120 (65.9%) |
| Health Diagnosing & Treating | 602 (38.4%) | 966 (61.6%) |
| Health Technologists | 293 (32.7%) | 604 (67.3%) |
| Total (Category) | 1,631 (40.4%) | 2,403 (59.6%) |
| Total (Overall) | 5,438 (50.2%) | 5,384 (49.7%) |
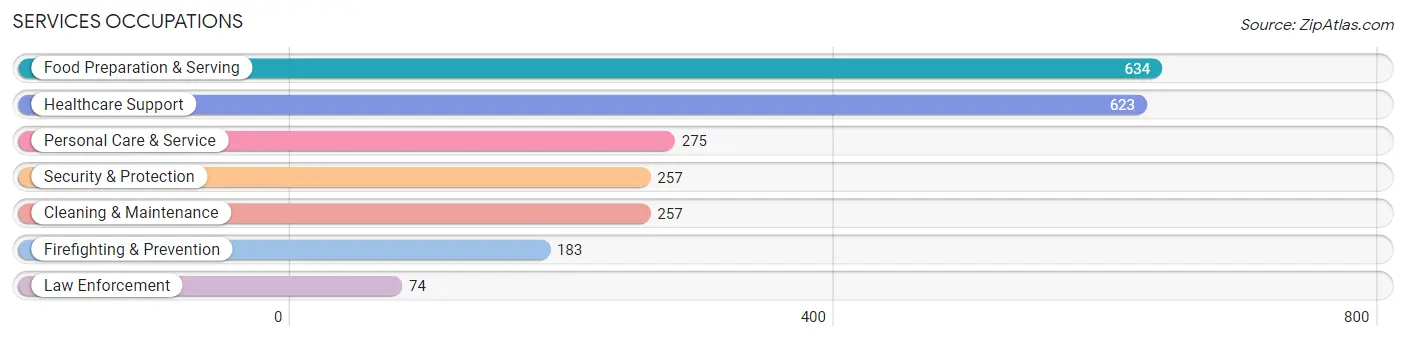
Services Occupations
The most common Services occupations in American Canyon are Food Preparation & Serving (634 | 5.9%), Healthcare Support (623 | 5.8%), Personal Care & Service (275 | 2.5%), Security & Protection (257 | 2.4%), and Cleaning & Maintenance (257 | 2.4%).
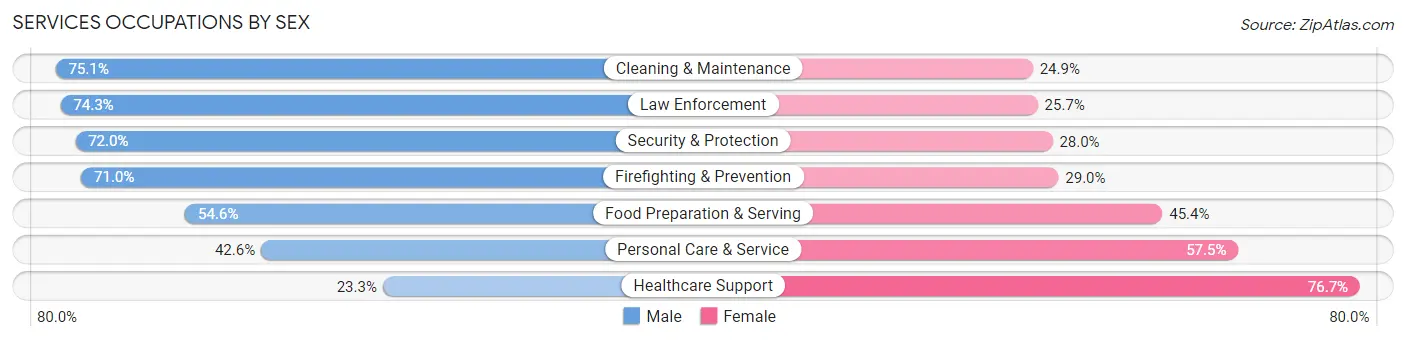
Services Occupations by Sex
Within the Services occupations in American Canyon, the most male-oriented occupations are Cleaning & Maintenance (75.1%), Law Enforcement (74.3%), and Security & Protection (72.0%), while the most female-oriented occupations are Healthcare Support (76.7%), Personal Care & Service (57.5%), and Food Preparation & Serving (45.4%).
| Occupation | Male | Female |
| Healthcare Support | 145 (23.3%) | 478 (76.7%) |
| Security & Protection | 185 (72.0%) | 72 (28.0%) |
| Firefighting & Prevention | 130 (71.0%) | 53 (29.0%) |
| Law Enforcement | 55 (74.3%) | 19 (25.7%) |
| Food Preparation & Serving | 346 (54.6%) | 288 (45.4%) |
| Cleaning & Maintenance | 193 (75.1%) | 64 (24.9%) |
| Personal Care & Service | 117 (42.5%) | 158 (57.5%) |
| Total (Category) | 986 (48.2%) | 1,060 (51.8%) |
| Total (Overall) | 5,438 (50.2%) | 5,384 (49.7%) |
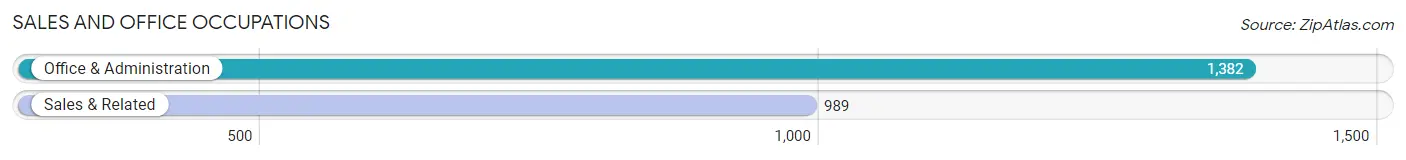
Sales and Office Occupations
The most common Sales and Office occupations in American Canyon are Office & Administration (1,382 | 12.8%), and Sales & Related (989 | 9.1%).
Sales and Office Occupations by Sex
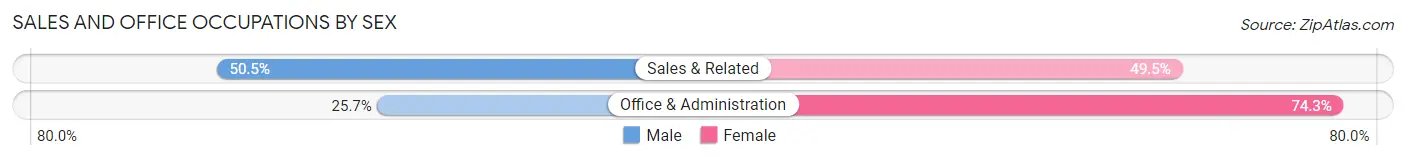
| Occupation | Male | Female |
| Sales & Related | 499 (50.5%) | 490 (49.5%) |
| Office & Administration | 355 (25.7%) | 1,027 (74.3%) |
| Total (Category) | 854 (36.0%) | 1,517 (64.0%) |
| Total (Overall) | 5,438 (50.2%) | 5,384 (49.7%) |
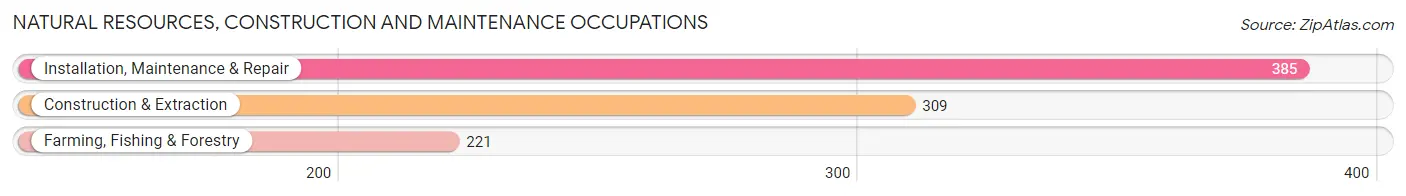
Natural Resources, Construction and Maintenance Occupations
The most common Natural Resources, Construction and Maintenance occupations in American Canyon are Installation, Maintenance & Repair (385 | 3.6%), Construction & Extraction (309 | 2.9%), and Farming, Fishing & Forestry (221 | 2.0%).
Natural Resources, Construction and Maintenance Occupations by Sex
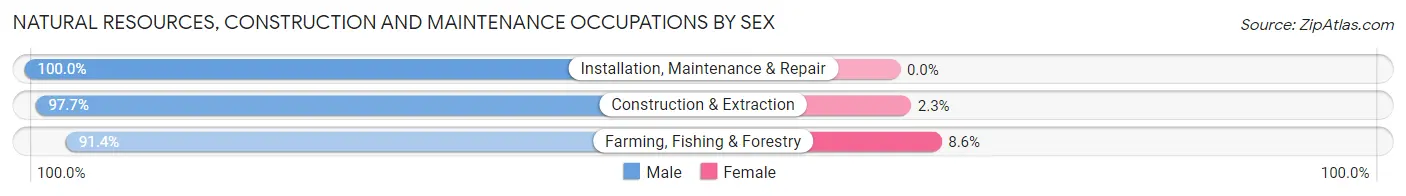
| Occupation | Male | Female |
| Farming, Fishing & Forestry | 202 (91.4%) | 19 (8.6%) |
| Construction & Extraction | 302 (97.7%) | 7 (2.3%) |
| Installation, Maintenance & Repair | 385 (100.0%) | 0 (0.0%) |
| Total (Category) | 889 (97.2%) | 26 (2.8%) |
| Total (Overall) | 5,438 (50.2%) | 5,384 (49.7%) |
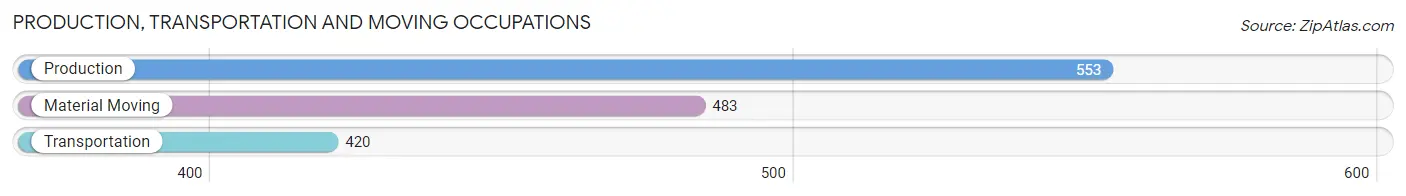
Production, Transportation and Moving Occupations
The most common Production, Transportation and Moving occupations in American Canyon are Production (553 | 5.1%), Material Moving (483 | 4.5%), and Transportation (420 | 3.9%).
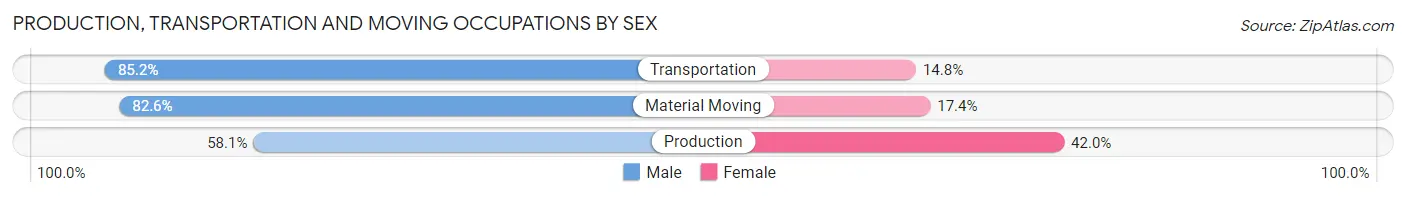
Production, Transportation and Moving Occupations by Sex
| Occupation | Male | Female |
| Production | 321 (58.1%) | 232 (41.9%) |
| Transportation | 358 (85.2%) | 62 (14.8%) |
| Material Moving | 399 (82.6%) | 84 (17.4%) |
| Total (Category) | 1,078 (74.0%) | 378 (26.0%) |
| Total (Overall) | 5,438 (50.2%) | 5,384 (49.7%) |
Employment Industries by Sex in American Canyon
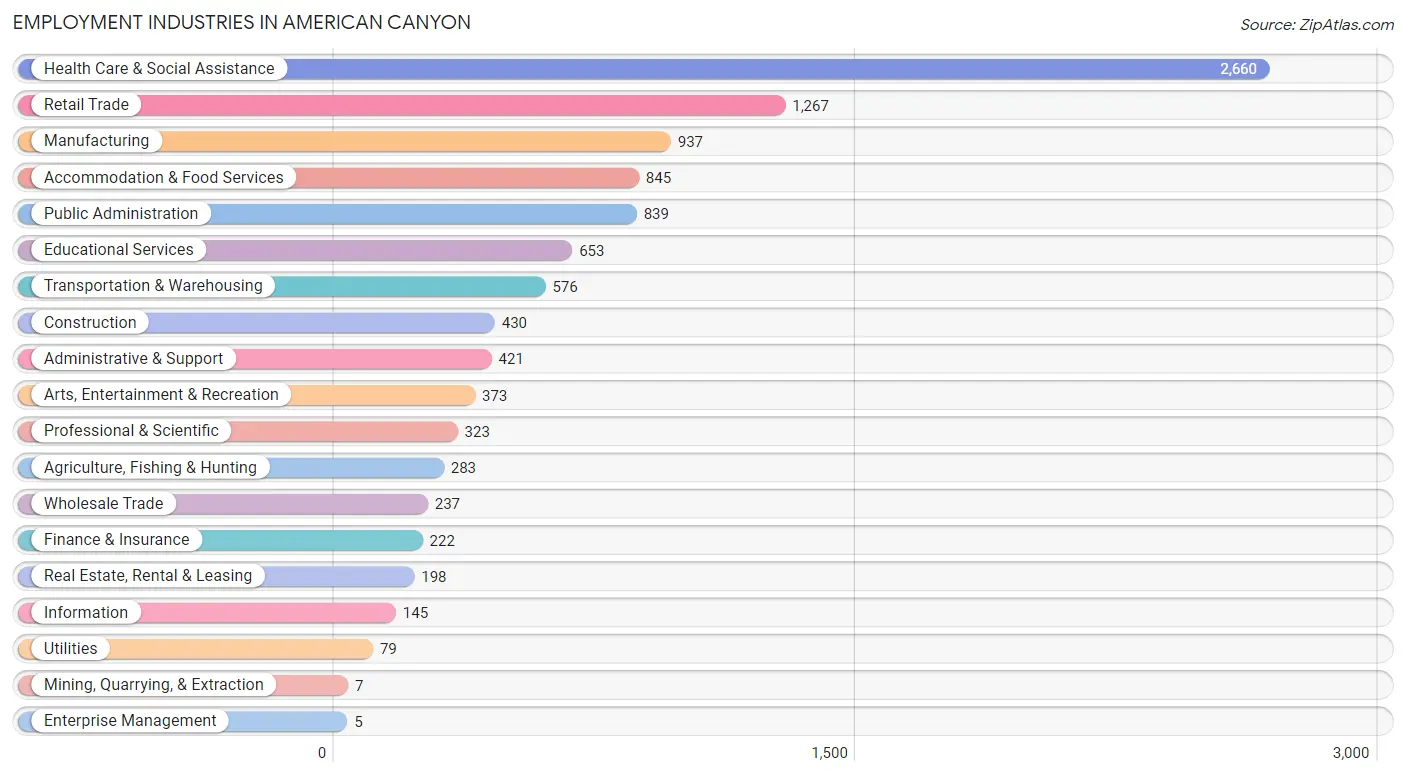
Employment Industries in American Canyon
The major employment industries in American Canyon include Health Care & Social Assistance (2,660 | 24.6%), Retail Trade (1,267 | 11.7%), Manufacturing (937 | 8.7%), Accommodation & Food Services (845 | 7.8%), and Public Administration (839 | 7.7%).
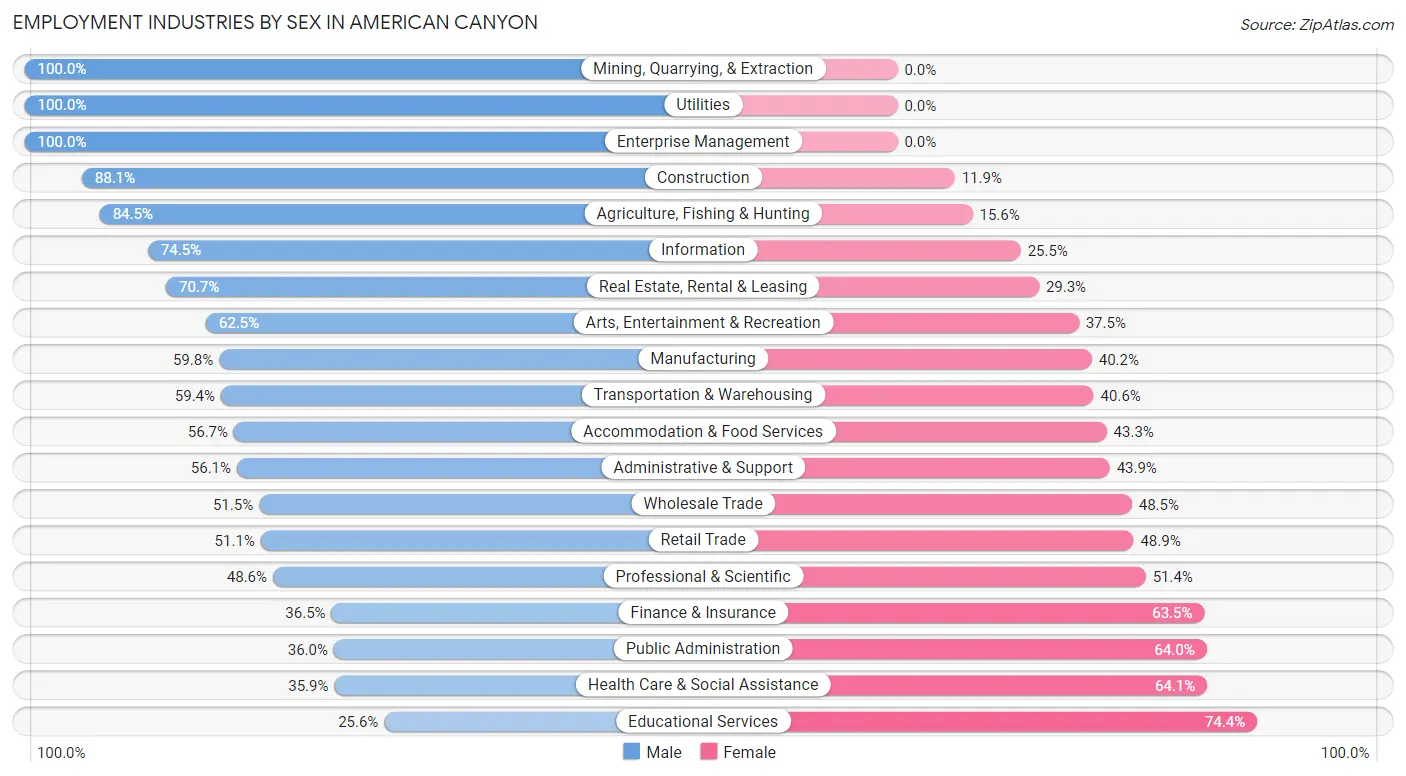
Employment Industries by Sex in American Canyon
The American Canyon industries that see more men than women are Mining, Quarrying, & Extraction (100.0%), Utilities (100.0%), and Enterprise Management (100.0%), whereas the industries that tend to have a higher number of women are Educational Services (74.4%), Health Care & Social Assistance (64.1%), and Public Administration (64.0%).
| Industry | Male | Female |
| Agriculture, Fishing & Hunting | 239 (84.5%) | 44 (15.5%) |
| Mining, Quarrying, & Extraction | 7 (100.0%) | 0 (0.0%) |
| Construction | 379 (88.1%) | 51 (11.9%) |
| Manufacturing | 560 (59.8%) | 377 (40.2%) |
| Wholesale Trade | 122 (51.5%) | 115 (48.5%) |
| Retail Trade | 648 (51.1%) | 619 (48.9%) |
| Transportation & Warehousing | 342 (59.4%) | 234 (40.6%) |
| Utilities | 79 (100.0%) | 0 (0.0%) |
| Information | 108 (74.5%) | 37 (25.5%) |
| Finance & Insurance | 81 (36.5%) | 141 (63.5%) |
| Real Estate, Rental & Leasing | 140 (70.7%) | 58 (29.3%) |
| Professional & Scientific | 157 (48.6%) | 166 (51.4%) |
| Enterprise Management | 5 (100.0%) | 0 (0.0%) |
| Administrative & Support | 236 (56.1%) | 185 (43.9%) |
| Educational Services | 167 (25.6%) | 486 (74.4%) |
| Health Care & Social Assistance | 955 (35.9%) | 1,705 (64.1%) |
| Arts, Entertainment & Recreation | 233 (62.5%) | 140 (37.5%) |
| Accommodation & Food Services | 479 (56.7%) | 366 (43.3%) |
| Public Administration | 302 (36.0%) | 537 (64.0%) |
| Total | 5,438 (50.2%) | 5,384 (49.7%) |
Education in American Canyon
School Enrollment in American Canyon
The most common levels of schooling among the 6,696 students in American Canyon are college / undergraduate (1,587 | 23.7%), high school (1,534 | 22.9%), and middle school (1,521 | 22.7%).
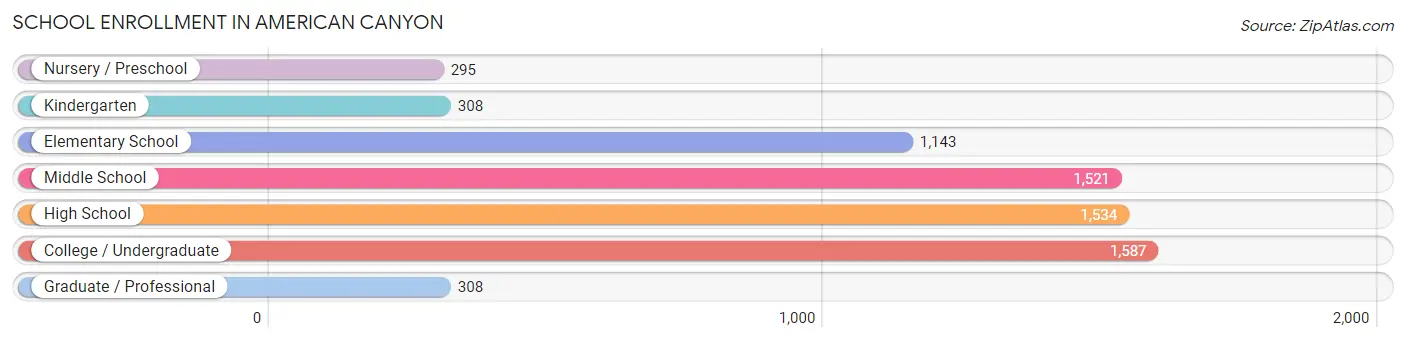
| School Level | # Students | % Students |
| Nursery / Preschool | 295 | 4.4% |
| Kindergarten | 308 | 4.6% |
| Elementary School | 1,143 | 17.1% |
| Middle School | 1,521 | 22.7% |
| High School | 1,534 | 22.9% |
| College / Undergraduate | 1,587 | 23.7% |
| Graduate / Professional | 308 | 4.6% |
| Total | 6,696 | 100.0% |
School Enrollment by Age by Funding Source in American Canyon
Out of a total of 6,696 students who are enrolled in schools in American Canyon, 870 (13.0%) attend a private institution, while the remaining 5,826 (87.0%) are enrolled in public schools. The age group of 3 to 4 year olds has the highest likelihood of being enrolled in private schools, with 187 (59.9% in the age bracket) enrolled. Conversely, the age group of 18 to 19 year olds has the lowest likelihood of being enrolled in a private school, with 432 (96.2% in the age bracket) attending a public institution.
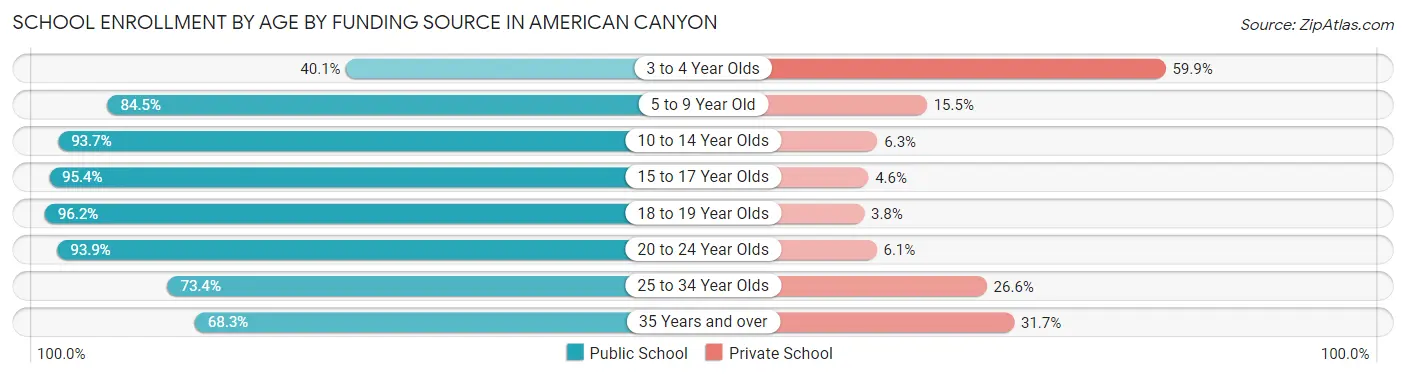
| Age Bracket | Public School | Private School |
| 3 to 4 Year Olds | 125 (40.1%) | 187 (59.9%) |
| 5 to 9 Year Old | 1,087 (84.5%) | 199 (15.5%) |
| 10 to 14 Year Olds | 1,763 (93.7%) | 118 (6.3%) |
| 15 to 17 Year Olds | 1,021 (95.4%) | 49 (4.6%) |
| 18 to 19 Year Olds | 432 (96.2%) | 17 (3.8%) |
| 20 to 24 Year Olds | 813 (93.9%) | 53 (6.1%) |
| 25 to 34 Year Olds | 259 (73.4%) | 94 (26.6%) |
| 35 Years and over | 327 (68.3%) | 152 (31.7%) |
| Total | 5,826 (87.0%) | 870 (13.0%) |
Educational Attainment by Field of Study in American Canyon
Business (933 | 18.9%), science & technology (907 | 18.4%), engineering (483 | 9.8%), social sciences (380 | 7.7%), and education (366 | 7.4%) are the most common fields of study among 4,928 individuals in American Canyon who have obtained a bachelor's degree or higher.
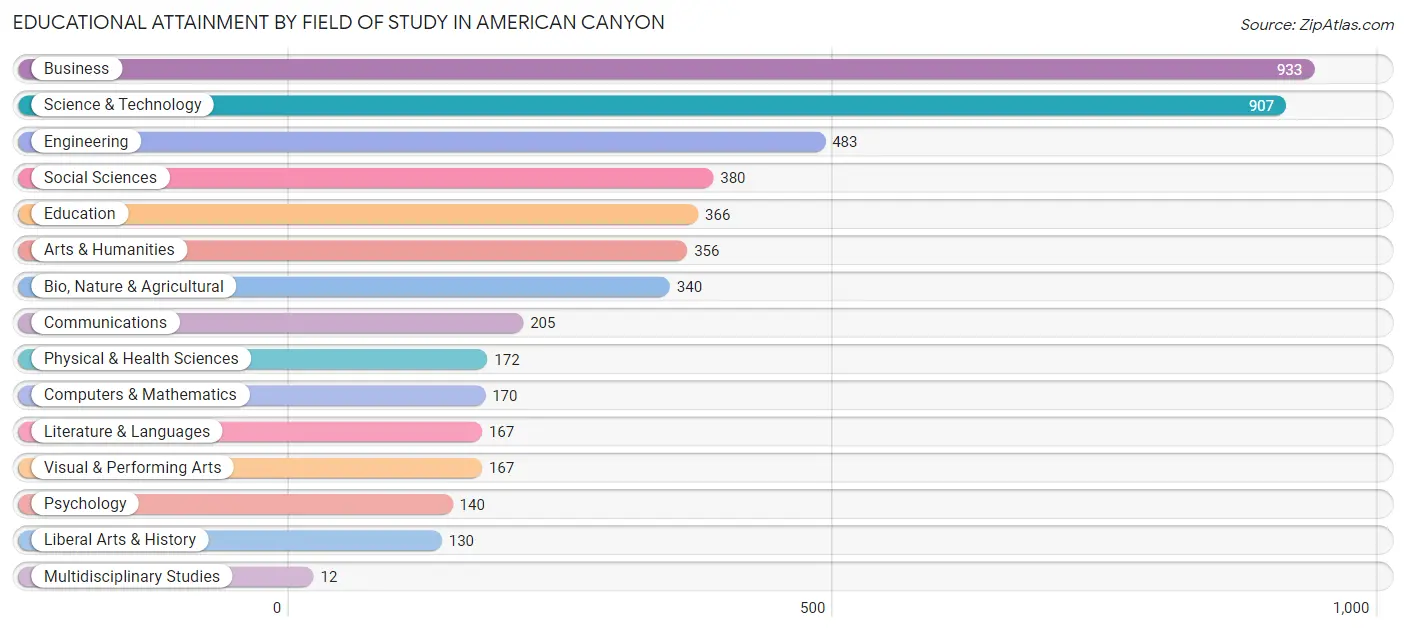
| Field of Study | # Graduates | % Graduates |
| Computers & Mathematics | 170 | 3.5% |
| Bio, Nature & Agricultural | 340 | 6.9% |
| Physical & Health Sciences | 172 | 3.5% |
| Psychology | 140 | 2.8% |
| Social Sciences | 380 | 7.7% |
| Engineering | 483 | 9.8% |
| Multidisciplinary Studies | 12 | 0.2% |
| Science & Technology | 907 | 18.4% |
| Business | 933 | 18.9% |
| Education | 366 | 7.4% |
| Literature & Languages | 167 | 3.4% |
| Liberal Arts & History | 130 | 2.6% |
| Visual & Performing Arts | 167 | 3.4% |
| Communications | 205 | 4.2% |
| Arts & Humanities | 356 | 7.2% |
| Total | 4,928 | 100.0% |
Transportation & Commute in American Canyon
Vehicle Availability by Sex in American Canyon
The most prevalent vehicle ownership categories in American Canyon are males with 2 vehicles (1,516, accounting for 28.7%) and females with 2 vehicles (1,323, making up 29.1%).
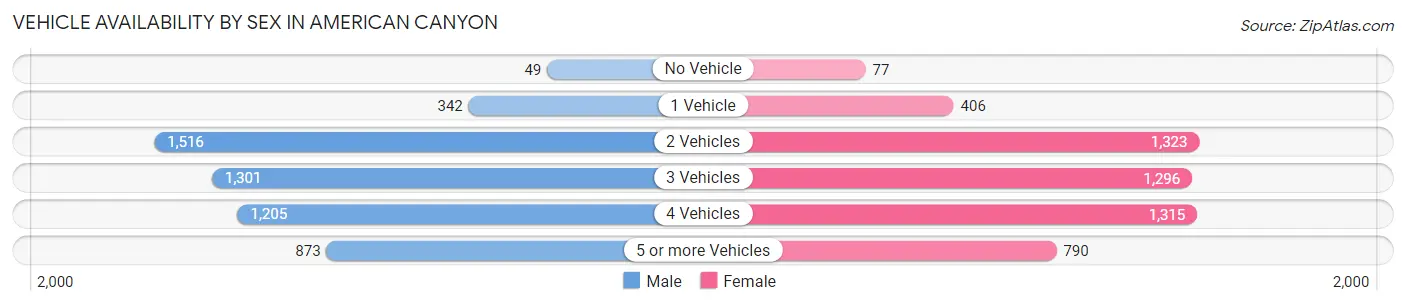
| Vehicles Available | Male | Female |
| No Vehicle | 49 (0.9%) | 77 (1.5%) |
| 1 Vehicle | 342 (6.5%) | 406 (7.8%) |
| 2 Vehicles | 1,516 (28.7%) | 1,323 (25.4%) |
| 3 Vehicles | 1,301 (24.6%) | 1,296 (24.9%) |
| 4 Vehicles | 1,205 (22.8%) | 1,315 (25.3%) |
| 5 or more Vehicles | 873 (16.5%) | 790 (15.2%) |
| Total | 5,286 (100.0%) | 5,207 (100.0%) |
Commute Time in American Canyon
The most frequently occuring commute durations in American Canyon are 30 to 34 minutes (1,591 commuters, 16.5%), 20 to 24 minutes (1,379 commuters, 14.3%), and 45 to 59 minutes (1,200 commuters, 12.4%).
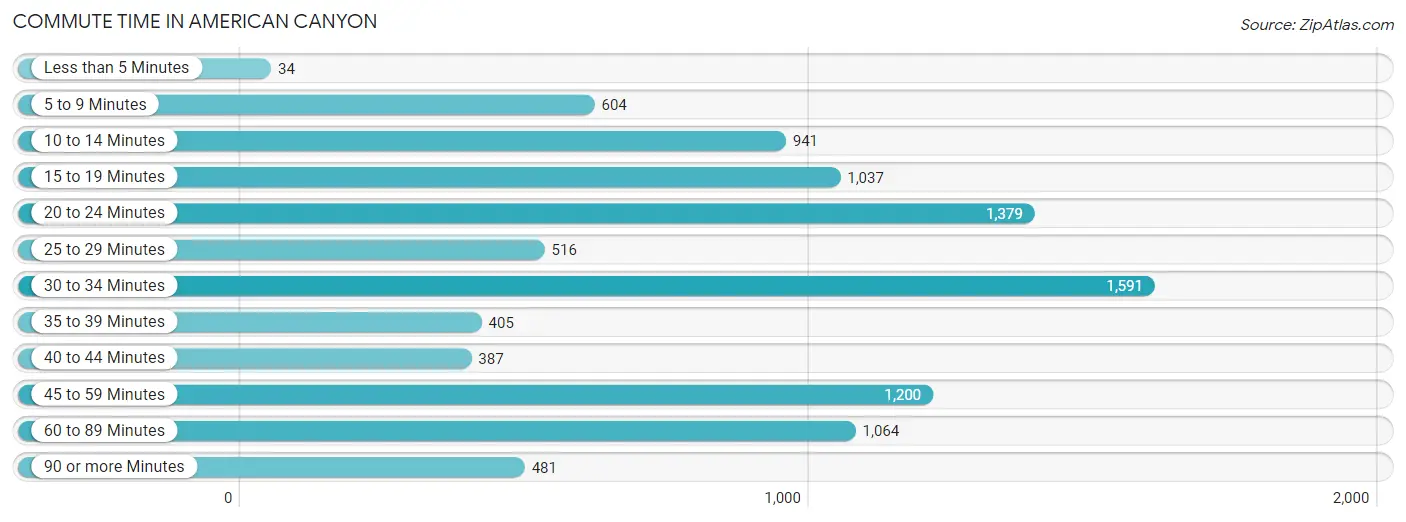
| Commute Time | # Commuters | % Commuters |
| Less than 5 Minutes | 34 | 0.4% |
| 5 to 9 Minutes | 604 | 6.3% |
| 10 to 14 Minutes | 941 | 9.8% |
| 15 to 19 Minutes | 1,037 | 10.8% |
| 20 to 24 Minutes | 1,379 | 14.3% |
| 25 to 29 Minutes | 516 | 5.3% |
| 30 to 34 Minutes | 1,591 | 16.5% |
| 35 to 39 Minutes | 405 | 4.2% |
| 40 to 44 Minutes | 387 | 4.0% |
| 45 to 59 Minutes | 1,200 | 12.4% |
| 60 to 89 Minutes | 1,064 | 11.0% |
| 90 or more Minutes | 481 | 5.0% |
Commute Time by Sex in American Canyon
The most common commute times in American Canyon are 30 to 34 minutes (893 commuters, 18.2%) for males and 30 to 34 minutes (698 commuters, 14.8%) for females.
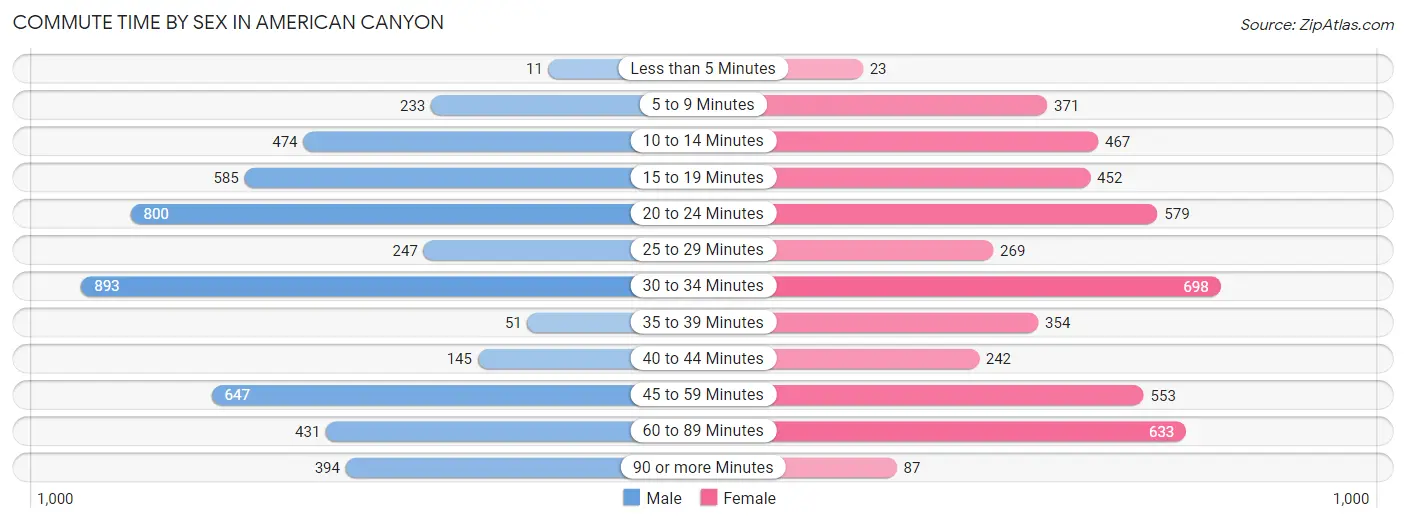
| Commute Time | Male | Female |
| Less than 5 Minutes | 11 (0.2%) | 23 (0.5%) |
| 5 to 9 Minutes | 233 (4.7%) | 371 (7.9%) |
| 10 to 14 Minutes | 474 (9.7%) | 467 (9.9%) |
| 15 to 19 Minutes | 585 (11.9%) | 452 (9.6%) |
| 20 to 24 Minutes | 800 (16.3%) | 579 (12.2%) |
| 25 to 29 Minutes | 247 (5.0%) | 269 (5.7%) |
| 30 to 34 Minutes | 893 (18.2%) | 698 (14.8%) |
| 35 to 39 Minutes | 51 (1.0%) | 354 (7.5%) |
| 40 to 44 Minutes | 145 (2.9%) | 242 (5.1%) |
| 45 to 59 Minutes | 647 (13.2%) | 553 (11.7%) |
| 60 to 89 Minutes | 431 (8.8%) | 633 (13.4%) |
| 90 or more Minutes | 394 (8.0%) | 87 (1.8%) |
Time of Departure to Work by Sex in American Canyon
The most frequent times of departure to work in American Canyon are 8:00 AM to 8:29 AM (591, 12.0%) for males and 7:00 AM to 7:29 AM (814, 17.2%) for females.
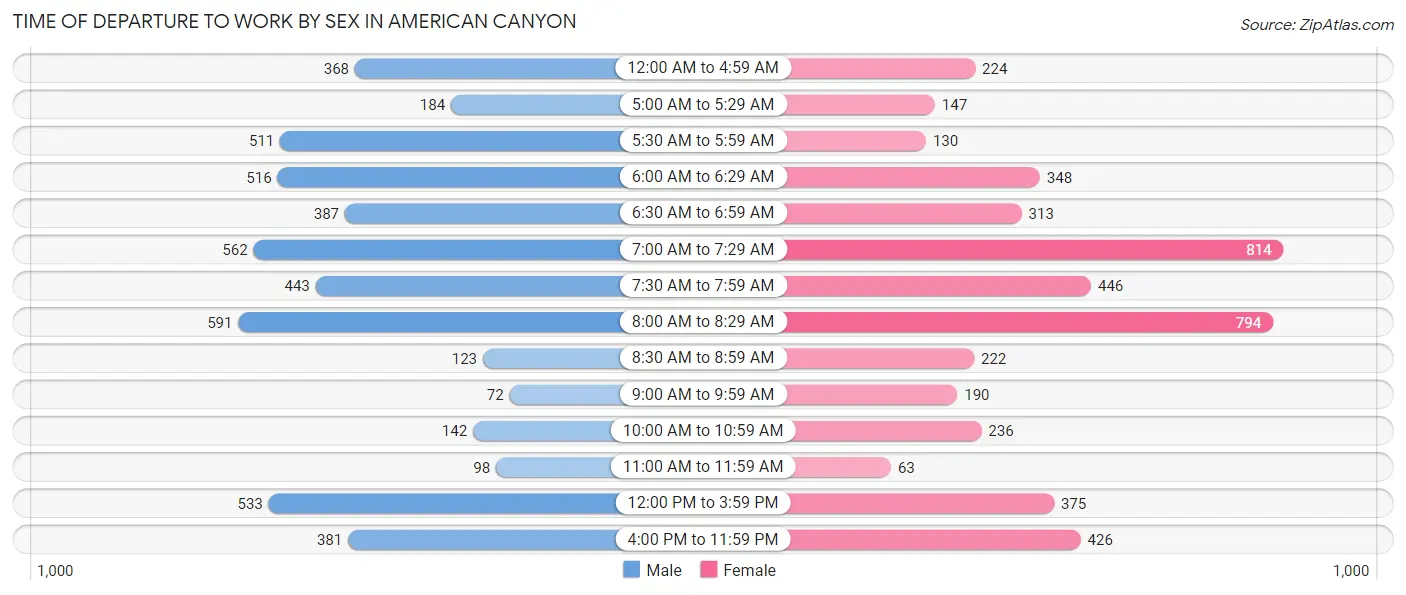
| Time of Departure | Male | Female |
| 12:00 AM to 4:59 AM | 368 (7.5%) | 224 (4.7%) |
| 5:00 AM to 5:29 AM | 184 (3.7%) | 147 (3.1%) |
| 5:30 AM to 5:59 AM | 511 (10.4%) | 130 (2.8%) |
| 6:00 AM to 6:29 AM | 516 (10.5%) | 348 (7.4%) |
| 6:30 AM to 6:59 AM | 387 (7.9%) | 313 (6.6%) |
| 7:00 AM to 7:29 AM | 562 (11.4%) | 814 (17.2%) |
| 7:30 AM to 7:59 AM | 443 (9.0%) | 446 (9.4%) |
| 8:00 AM to 8:29 AM | 591 (12.0%) | 794 (16.8%) |
| 8:30 AM to 8:59 AM | 123 (2.5%) | 222 (4.7%) |
| 9:00 AM to 9:59 AM | 72 (1.5%) | 190 (4.0%) |
| 10:00 AM to 10:59 AM | 142 (2.9%) | 236 (5.0%) |
| 11:00 AM to 11:59 AM | 98 (2.0%) | 63 (1.3%) |
| 12:00 PM to 3:59 PM | 533 (10.8%) | 375 (7.9%) |
| 4:00 PM to 11:59 PM | 381 (7.8%) | 426 (9.0%) |
| Total | 4,911 (100.0%) | 4,728 (100.0%) |
Housing Occupancy in American Canyon
Occupancy by Ownership in American Canyon
Of the total 5,725 dwellings in American Canyon, owner-occupied units account for 4,520 (78.9%), while renter-occupied units make up 1,205 (21.0%).
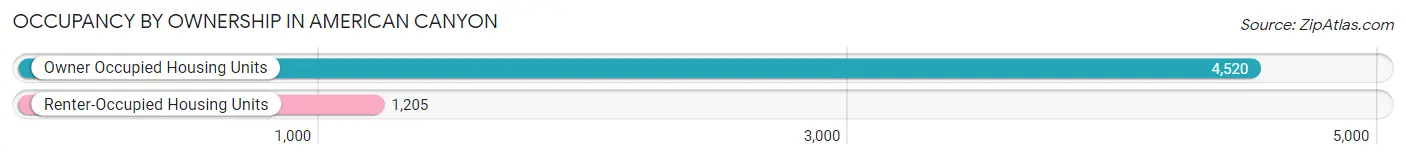
| Occupancy | # Housing Units | % Housing Units |
| Owner Occupied Housing Units | 4,520 | 78.9% |
| Renter-Occupied Housing Units | 1,205 | 21.0% |
| Total Occupied Housing Units | 5,725 | 100.0% |
Occupancy by Household Size in American Canyon
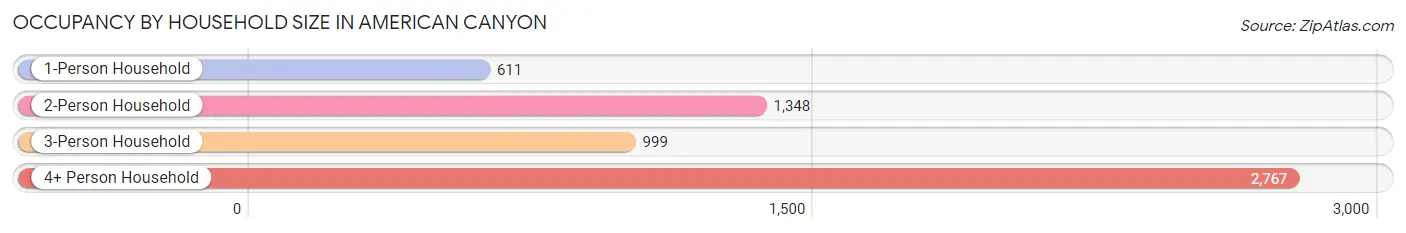
| Household Size | # Housing Units | % Housing Units |
| 1-Person Household | 611 | 10.7% |
| 2-Person Household | 1,348 | 23.5% |
| 3-Person Household | 999 | 17.4% |
| 4+ Person Household | 2,767 | 48.3% |
| Total Housing Units | 5,725 | 100.0% |
Occupancy by Ownership by Household Size in American Canyon
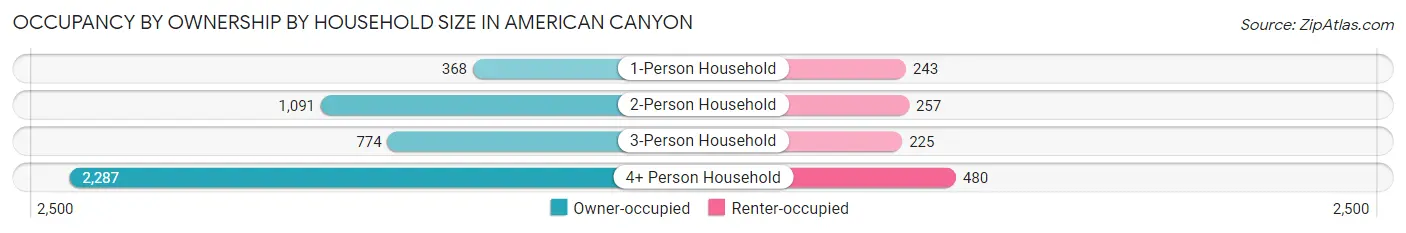
| Household Size | Owner-occupied | Renter-occupied |
| 1-Person Household | 368 (60.2%) | 243 (39.8%) |
| 2-Person Household | 1,091 (80.9%) | 257 (19.1%) |
| 3-Person Household | 774 (77.5%) | 225 (22.5%) |
| 4+ Person Household | 2,287 (82.7%) | 480 (17.3%) |
| Total Housing Units | 4,520 (78.9%) | 1,205 (21.0%) |
Occupancy by Educational Attainment in American Canyon
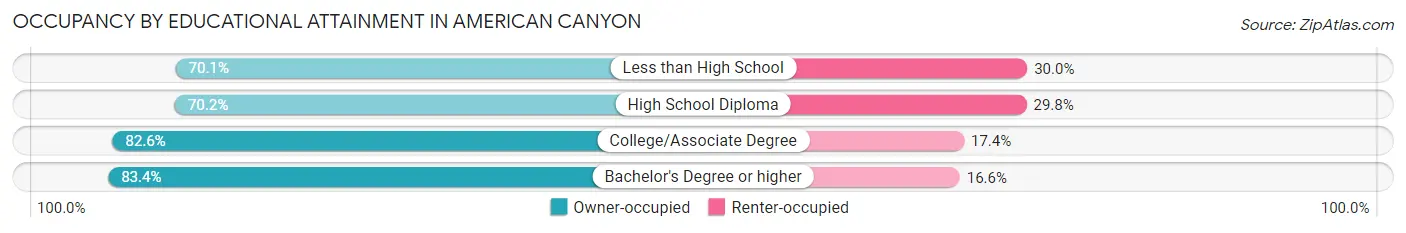
| Household Size | Owner-occupied | Renter-occupied |
| Less than High School | 414 (70.1%) | 177 (29.9%) |
| High School Diploma | 852 (70.2%) | 362 (29.8%) |
| College/Associate Degree | 1,583 (82.6%) | 334 (17.4%) |
| Bachelor's Degree or higher | 1,671 (83.4%) | 332 (16.6%) |
Occupancy by Age of Householder in American Canyon
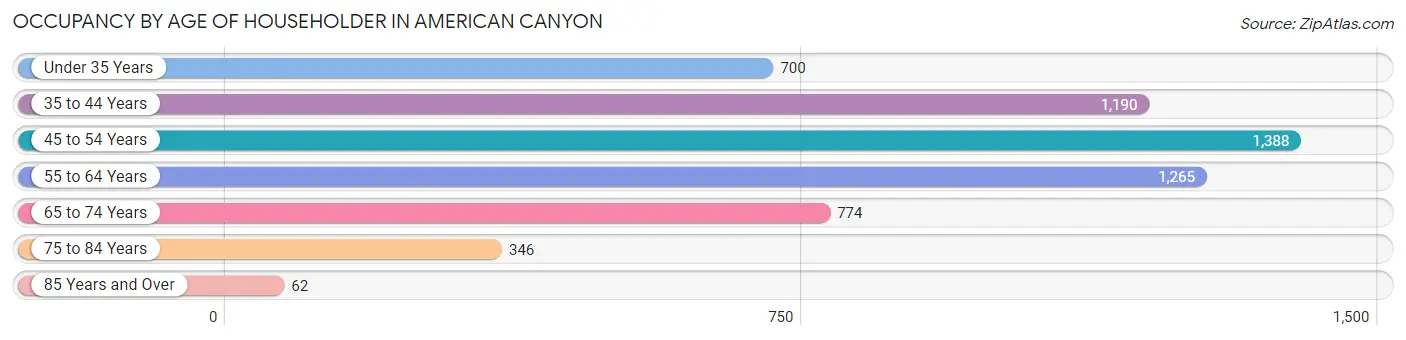
| Age Bracket | # Households | % Households |
| Under 35 Years | 700 | 12.2% |
| 35 to 44 Years | 1,190 | 20.8% |
| 45 to 54 Years | 1,388 | 24.2% |
| 55 to 64 Years | 1,265 | 22.1% |
| 65 to 74 Years | 774 | 13.5% |
| 75 to 84 Years | 346 | 6.0% |
| 85 Years and Over | 62 | 1.1% |
| Total | 5,725 | 100.0% |
Housing Finances in American Canyon
Median Income by Occupancy in American Canyon
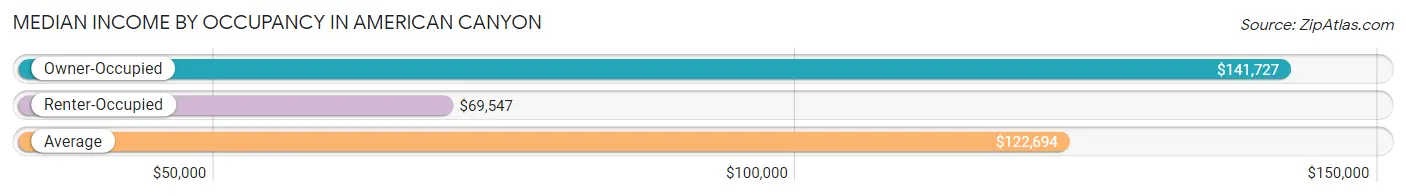
| Occupancy Type | # Households | Median Income |
| Owner-Occupied | 4,520 (78.9%) | $141,727 |
| Renter-Occupied | 1,205 (21.0%) | $69,547 |
| Average | 5,725 (100.0%) | $122,694 |
Occupancy by Householder Income Bracket in American Canyon
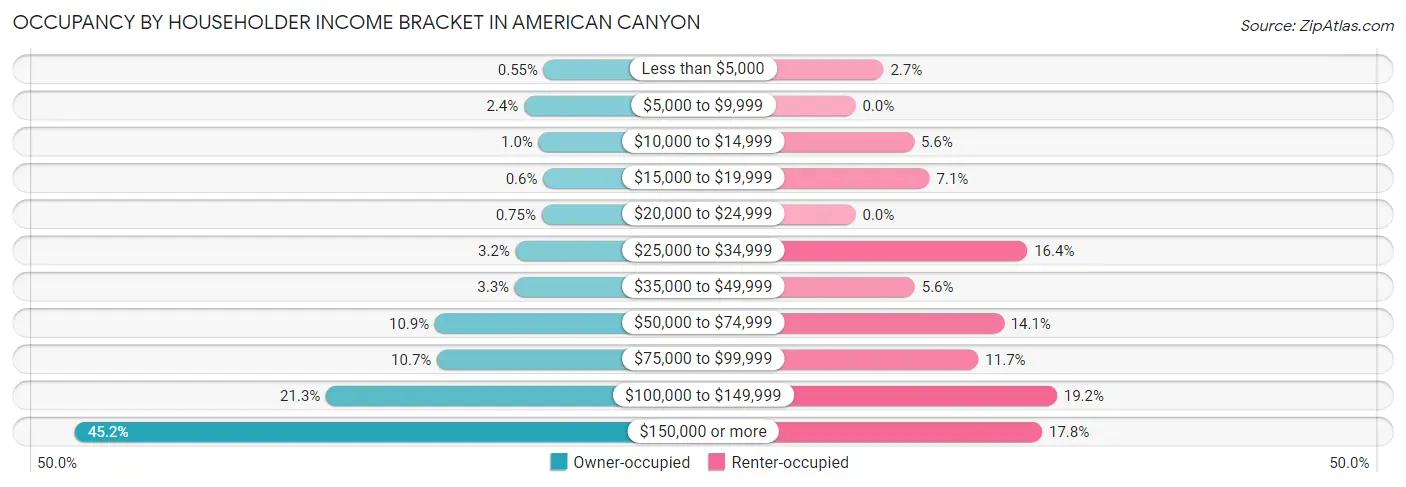
| Income Bracket | Owner-occupied | Renter-occupied |
| Less than $5,000 | 25 (0.5%) | 32 (2.7%) |
| $5,000 to $9,999 | 110 (2.4%) | 0 (0.0%) |
| $10,000 to $14,999 | 47 (1.0%) | 67 (5.6%) |
| $15,000 to $19,999 | 27 (0.6%) | 85 (7.0%) |
| $20,000 to $24,999 | 34 (0.7%) | 0 (0.0%) |
| $25,000 to $34,999 | 146 (3.2%) | 197 (16.4%) |
| $35,000 to $49,999 | 149 (3.3%) | 68 (5.6%) |
| $50,000 to $74,999 | 493 (10.9%) | 170 (14.1%) |
| $75,000 to $99,999 | 484 (10.7%) | 141 (11.7%) |
| $100,000 to $149,999 | 962 (21.3%) | 231 (19.2%) |
| $150,000 or more | 2,043 (45.2%) | 214 (17.8%) |
| Total | 4,520 (100.0%) | 1,205 (100.0%) |
Monthly Housing Cost Tiers in American Canyon
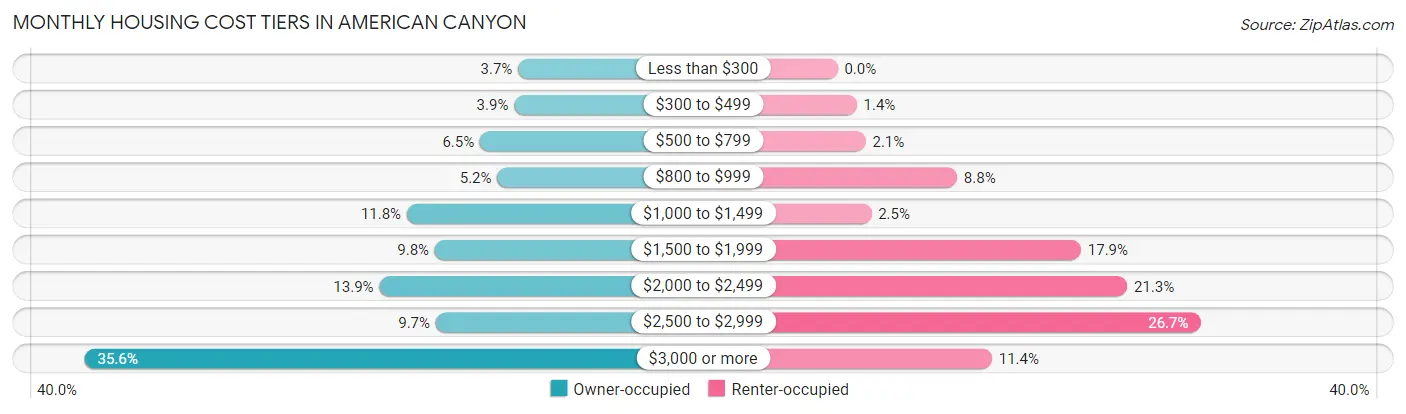
| Monthly Cost | Owner-occupied | Renter-occupied |
| Less than $300 | 165 (3.6%) | 0 (0.0%) |
| $300 to $499 | 178 (3.9%) | 17 (1.4%) |
| $500 to $799 | 292 (6.5%) | 25 (2.1%) |
| $800 to $999 | 234 (5.2%) | 106 (8.8%) |
| $1,000 to $1,499 | 535 (11.8%) | 30 (2.5%) |
| $1,500 to $1,999 | 442 (9.8%) | 216 (17.9%) |
| $2,000 to $2,499 | 627 (13.9%) | 257 (21.3%) |
| $2,500 to $2,999 | 439 (9.7%) | 322 (26.7%) |
| $3,000 or more | 1,608 (35.6%) | 137 (11.4%) |
| Total | 4,520 (100.0%) | 1,205 (100.0%) |
Physical Housing Characteristics in American Canyon
Housing Structures in American Canyon
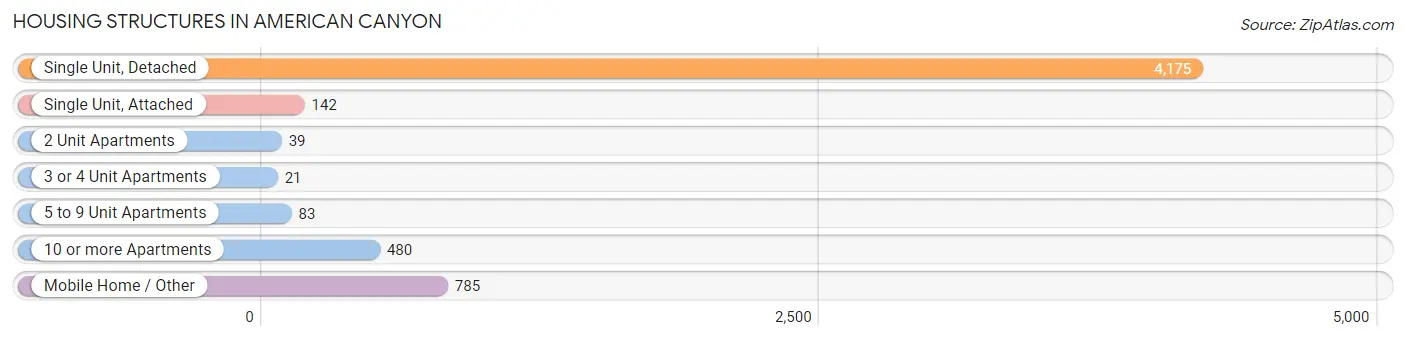
| Structure Type | # Housing Units | % Housing Units |
| Single Unit, Detached | 4,175 | 72.9% |
| Single Unit, Attached | 142 | 2.5% |
| 2 Unit Apartments | 39 | 0.7% |
| 3 or 4 Unit Apartments | 21 | 0.4% |
| 5 to 9 Unit Apartments | 83 | 1.5% |
| 10 or more Apartments | 480 | 8.4% |
| Mobile Home / Other | 785 | 13.7% |
| Total | 5,725 | 100.0% |
Housing Structures by Occupancy in American Canyon
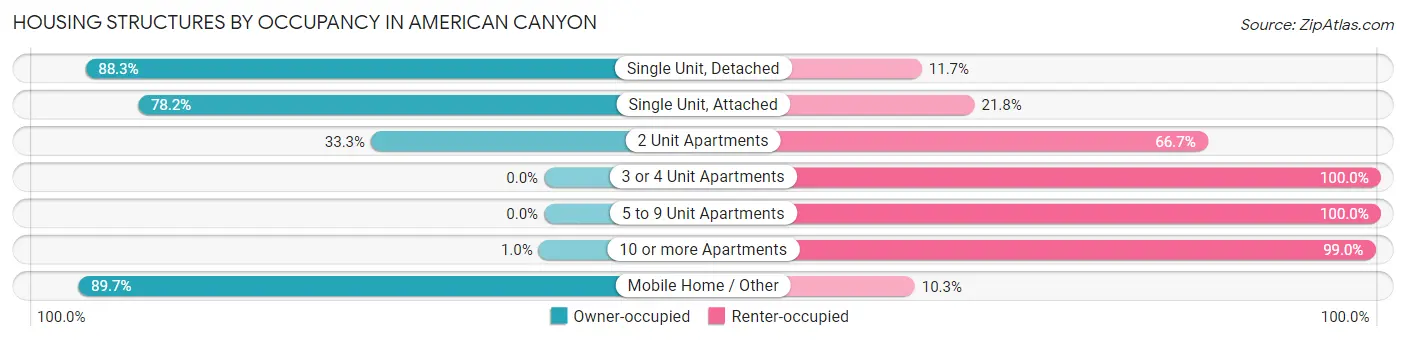
| Structure Type | Owner-occupied | Renter-occupied |
| Single Unit, Detached | 3,687 (88.3%) | 488 (11.7%) |
| Single Unit, Attached | 111 (78.2%) | 31 (21.8%) |
| 2 Unit Apartments | 13 (33.3%) | 26 (66.7%) |
| 3 or 4 Unit Apartments | 0 (0.0%) | 21 (100.0%) |
| 5 to 9 Unit Apartments | 0 (0.0%) | 83 (100.0%) |
| 10 or more Apartments | 5 (1.0%) | 475 (99.0%) |
| Mobile Home / Other | 704 (89.7%) | 81 (10.3%) |
| Total | 4,520 (78.9%) | 1,205 (21.0%) |
Housing Structures by Number of Rooms in American Canyon
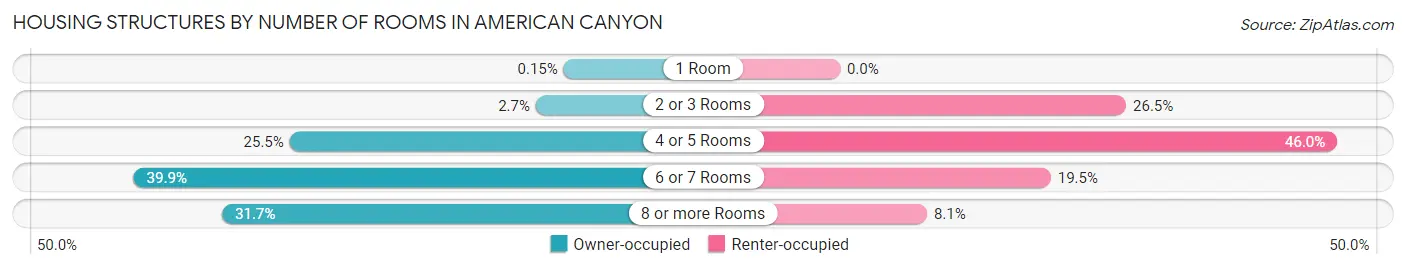
| Number of Rooms | Owner-occupied | Renter-occupied |
| 1 Room | 7 (0.2%) | 0 (0.0%) |
| 2 or 3 Rooms | 123 (2.7%) | 319 (26.5%) |
| 4 or 5 Rooms | 1,152 (25.5%) | 554 (46.0%) |
| 6 or 7 Rooms | 1,804 (39.9%) | 235 (19.5%) |
| 8 or more Rooms | 1,434 (31.7%) | 97 (8.1%) |
| Total | 4,520 (100.0%) | 1,205 (100.0%) |
Housing Structure by Heating Type in American Canyon
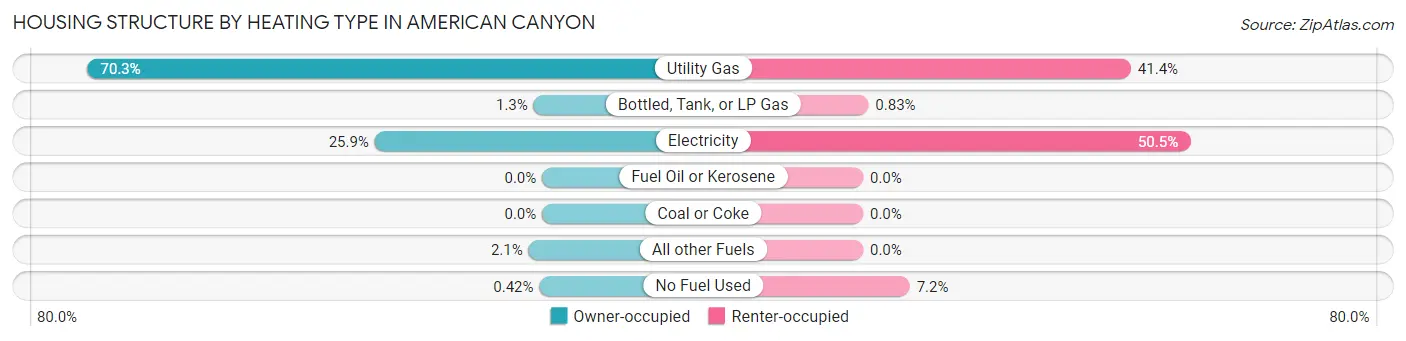
| Heating Type | Owner-occupied | Renter-occupied |
| Utility Gas | 3,177 (70.3%) | 499 (41.4%) |
| Bottled, Tank, or LP Gas | 59 (1.3%) | 10 (0.8%) |
| Electricity | 1,170 (25.9%) | 609 (50.5%) |
| Fuel Oil or Kerosene | 0 (0.0%) | 0 (0.0%) |
| Coal or Coke | 0 (0.0%) | 0 (0.0%) |
| All other Fuels | 95 (2.1%) | 0 (0.0%) |
| No Fuel Used | 19 (0.4%) | 87 (7.2%) |
| Total | 4,520 (100.0%) | 1,205 (100.0%) |
Household Vehicle Usage in American Canyon
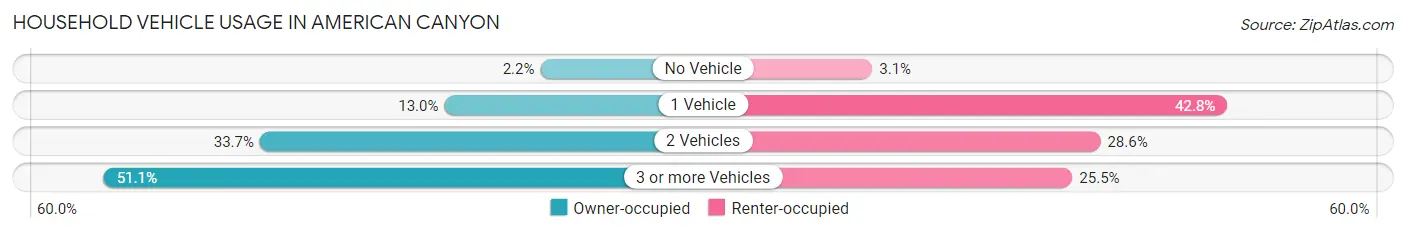
| Vehicles per Household | Owner-occupied | Renter-occupied |
| No Vehicle | 101 (2.2%) | 37 (3.1%) |
| 1 Vehicle | 587 (13.0%) | 516 (42.8%) |
| 2 Vehicles | 1,521 (33.7%) | 345 (28.6%) |
| 3 or more Vehicles | 2,311 (51.1%) | 307 (25.5%) |
| Total | 4,520 (100.0%) | 1,205 (100.0%) |
Real Estate & Mortgages in American Canyon
Real Estate and Mortgage Overview in American Canyon
| Characteristic | Without Mortgage | With Mortgage |
| Housing Units | 1,234 | 3,286 |
| Median Property Value | $466,700 | $671,500 |
| Median Household Income | $100,167 | $1,661 |
| Monthly Housing Costs | $806 | $1,580 |
| Real Estate Taxes | $3,300 | $24 |
Property Value by Mortgage Status in American Canyon
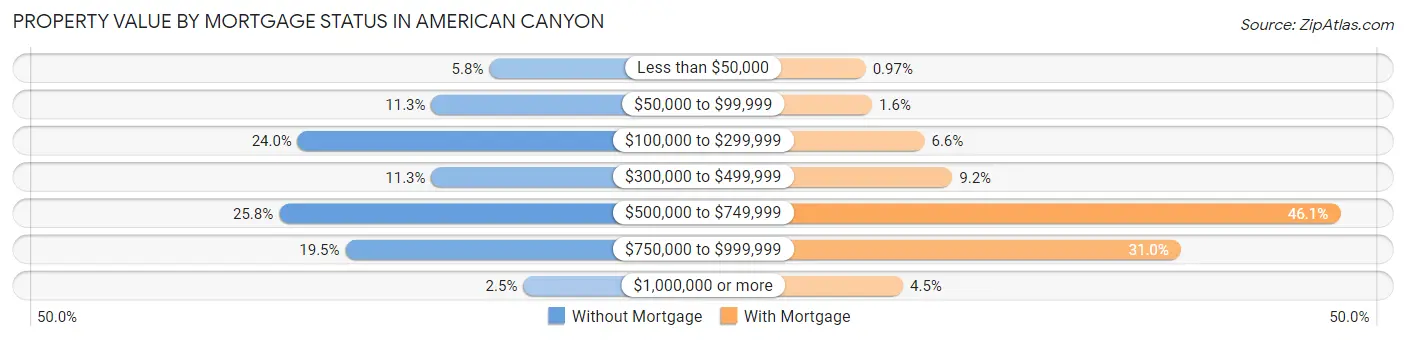
| Property Value | Without Mortgage | With Mortgage |
| Less than $50,000 | 71 (5.8%) | 32 (1.0%) |
| $50,000 to $99,999 | 139 (11.3%) | 52 (1.6%) |
| $100,000 to $299,999 | 296 (24.0%) | 216 (6.6%) |
| $300,000 to $499,999 | 139 (11.3%) | 303 (9.2%) |
| $500,000 to $749,999 | 318 (25.8%) | 1,516 (46.1%) |
| $750,000 to $999,999 | 240 (19.5%) | 1,018 (31.0%) |
| $1,000,000 or more | 31 (2.5%) | 149 (4.5%) |
| Total | 1,234 (100.0%) | 3,286 (100.0%) |
Household Income by Mortgage Status in American Canyon
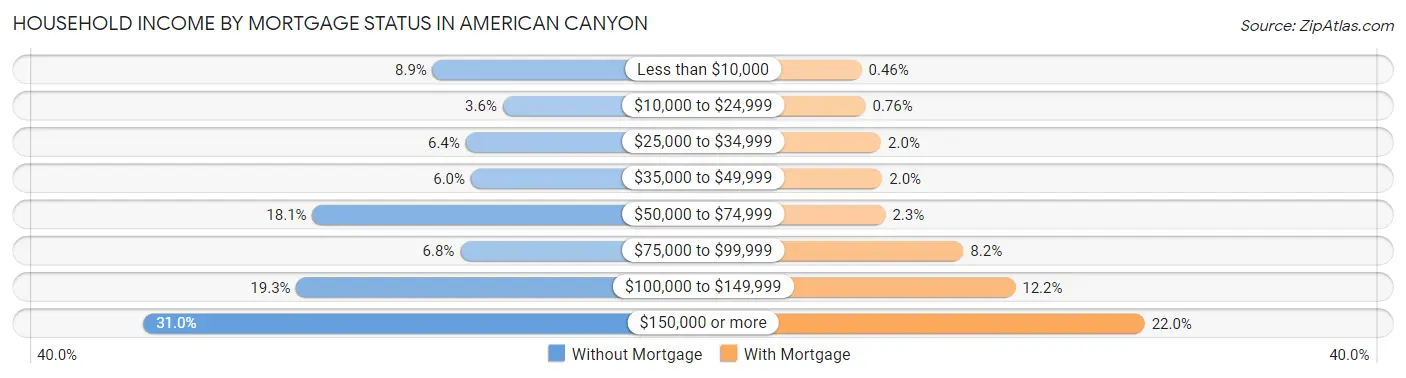
| Household Income | Without Mortgage | With Mortgage |
| Less than $10,000 | 110 (8.9%) | 15 (0.5%) |
| $10,000 to $24,999 | 44 (3.6%) | 25 (0.8%) |
| $25,000 to $34,999 | 79 (6.4%) | 64 (1.9%) |
| $35,000 to $49,999 | 74 (6.0%) | 67 (2.0%) |
| $50,000 to $74,999 | 223 (18.1%) | 75 (2.3%) |
| $75,000 to $99,999 | 84 (6.8%) | 270 (8.2%) |
| $100,000 to $149,999 | 238 (19.3%) | 400 (12.2%) |
| $150,000 or more | 382 (31.0%) | 724 (22.0%) |
| Total | 1,234 (100.0%) | 3,286 (100.0%) |
Property Value to Household Income Ratio in American Canyon
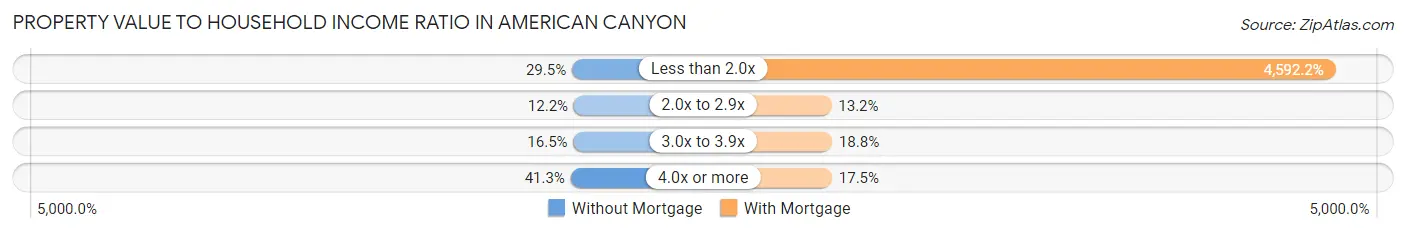
| Value-to-Income Ratio | Without Mortgage | With Mortgage |
| Less than 2.0x | 364 (29.5%) | 150,900 (4,592.2%) |
| 2.0x to 2.9x | 150 (12.2%) | 433 (13.2%) |
| 3.0x to 3.9x | 204 (16.5%) | 619 (18.8%) |
| 4.0x or more | 509 (41.2%) | 576 (17.5%) |
| Total | 1,234 (100.0%) | 3,286 (100.0%) |
Real Estate Taxes by Mortgage Status in American Canyon
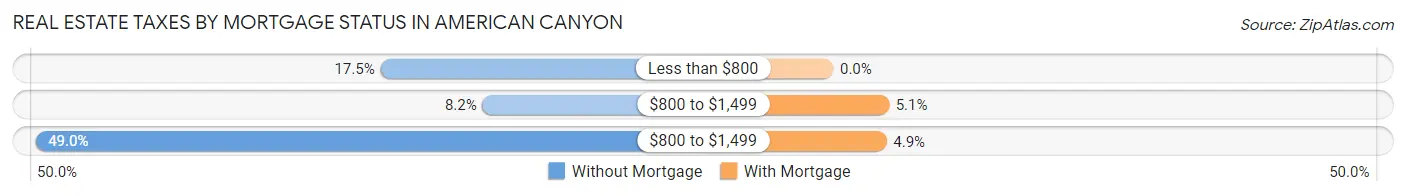
| Property Taxes | Without Mortgage | With Mortgage |
| Less than $800 | 216 (17.5%) | 0 (0.0%) |
| $800 to $1,499 | 101 (8.2%) | 167 (5.1%) |
| $800 to $1,499 | 605 (49.0%) | 160 (4.9%) |
| Total | 1,234 (100.0%) | 3,286 (100.0%) |
Health & Disability in American Canyon
Health Insurance Coverage by Age in American Canyon
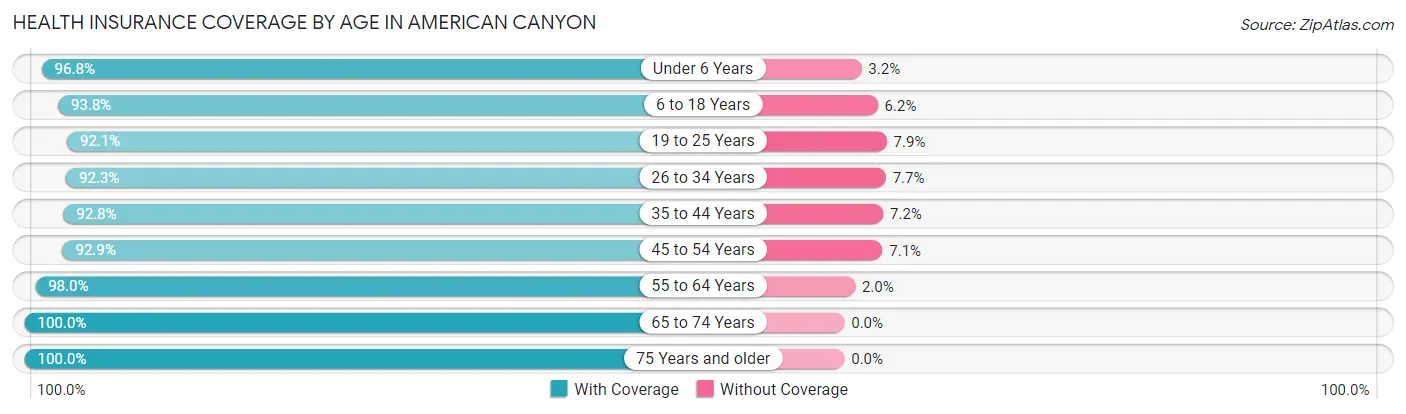
| Age Bracket | With Coverage | Without Coverage |
| Under 6 Years | 1,307 (96.8%) | 43 (3.2%) |
| 6 to 18 Years | 4,239 (93.8%) | 281 (6.2%) |
| 19 to 25 Years | 2,262 (92.1%) | 194 (7.9%) |
| 26 to 34 Years | 2,077 (92.3%) | 174 (7.7%) |
| 35 to 44 Years | 2,425 (92.8%) | 189 (7.2%) |
| 45 to 54 Years | 2,740 (92.9%) | 209 (7.1%) |
| 55 to 64 Years | 2,711 (98.0%) | 55 (2.0%) |
| 65 to 74 Years | 1,619 (100.0%) | 0 (0.0%) |
| 75 Years and older | 1,134 (100.0%) | 0 (0.0%) |
| Total | 20,514 (94.7%) | 1,145 (5.3%) |
Health Insurance Coverage by Citizenship Status in American Canyon
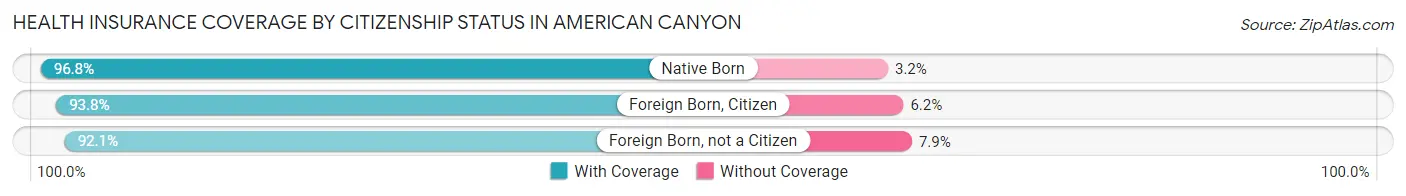
| Citizenship Status | With Coverage | Without Coverage |
| Native Born | 1,307 (96.8%) | 43 (3.2%) |
| Foreign Born, Citizen | 4,239 (93.8%) | 281 (6.2%) |
| Foreign Born, not a Citizen | 2,262 (92.1%) | 194 (7.9%) |
Health Insurance Coverage by Household Income in American Canyon
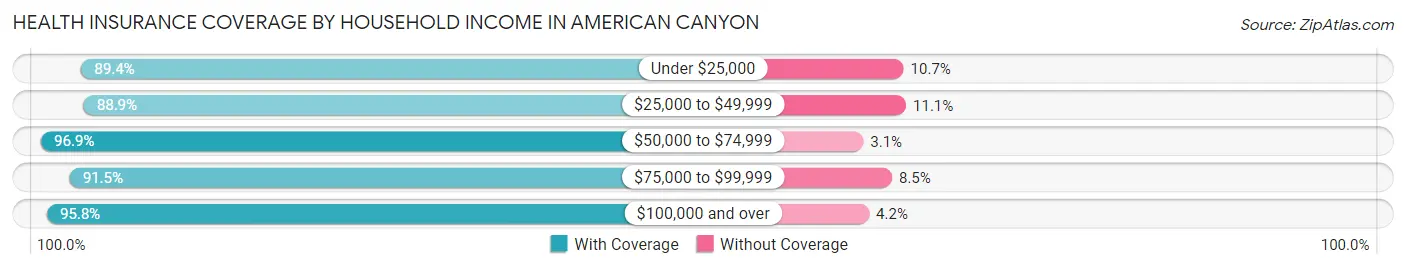
| Household Income | With Coverage | Without Coverage |
| Under $25,000 | 780 (89.3%) | 93 (10.6%) |
| $25,000 to $49,999 | 1,232 (88.9%) | 154 (11.1%) |
| $50,000 to $74,999 | 2,157 (96.9%) | 69 (3.1%) |
| $75,000 to $99,999 | 2,062 (91.5%) | 191 (8.5%) |
| $100,000 and over | 14,193 (95.8%) | 620 (4.2%) |
Public vs Private Health Insurance Coverage by Age in American Canyon
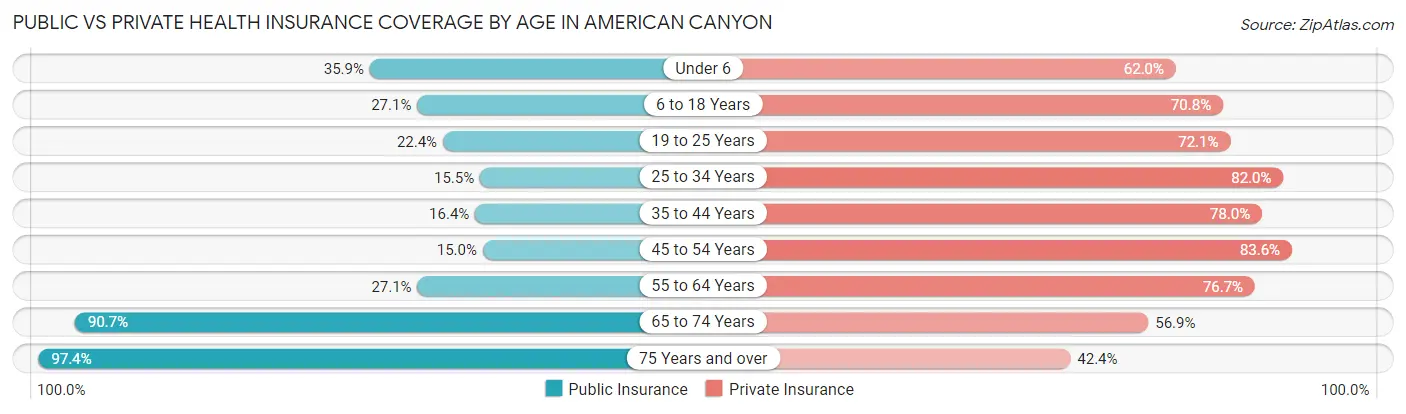
| Age Bracket | Public Insurance | Private Insurance |
| Under 6 | 485 (35.9%) | 837 (62.0%) |
| 6 to 18 Years | 1,226 (27.1%) | 3,198 (70.8%) |
| 19 to 25 Years | 549 (22.4%) | 1,771 (72.1%) |
| 25 to 34 Years | 348 (15.5%) | 1,845 (82.0%) |
| 35 to 44 Years | 428 (16.4%) | 2,039 (78.0%) |
| 45 to 54 Years | 441 (14.9%) | 2,464 (83.6%) |
| 55 to 64 Years | 749 (27.1%) | 2,121 (76.7%) |
| 65 to 74 Years | 1,468 (90.7%) | 921 (56.9%) |
| 75 Years and over | 1,105 (97.4%) | 481 (42.4%) |
| Total | 6,799 (31.4%) | 15,677 (72.4%) |
Disability Status by Sex by Age in American Canyon
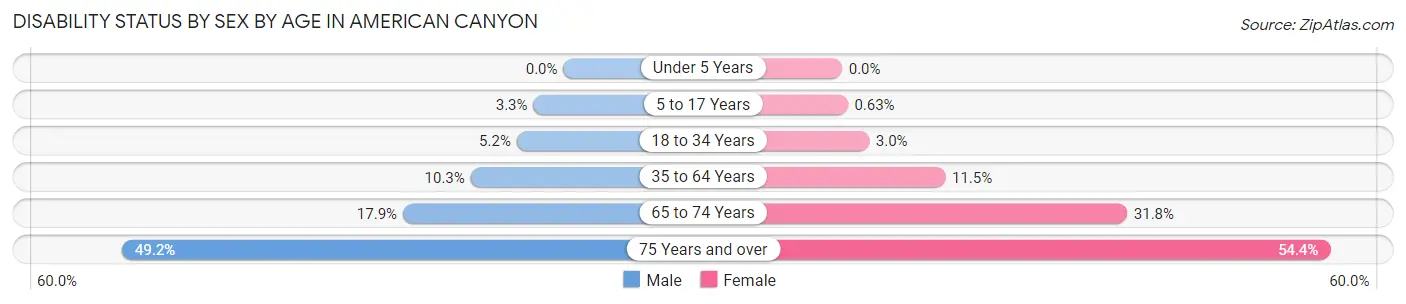
| Age Bracket | Male | Female |
| Under 5 Years | 0 (0.0%) | 0 (0.0%) |
| 5 to 17 Years | 72 (3.3%) | 14 (0.6%) |
| 18 to 34 Years | 130 (5.2%) | 77 (3.0%) |
| 35 to 64 Years | 420 (10.3%) | 490 (11.5%) |
| 65 to 74 Years | 139 (17.9%) | 267 (31.8%) |
| 75 Years and over | 233 (49.2%) | 359 (54.4%) |
Disability Class by Sex by Age in American Canyon
Disability Class: Hearing Difficulty
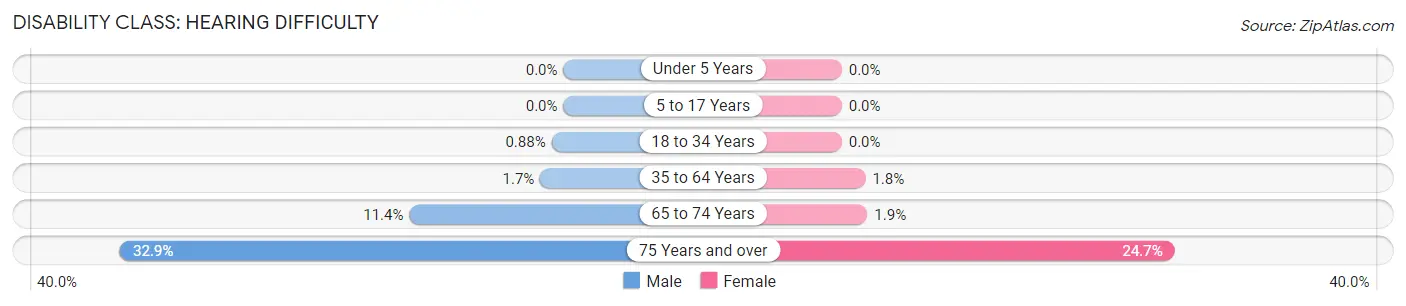
| Age Bracket | Male | Female |
| Under 5 Years | 0 (0.0%) | 0 (0.0%) |
| 5 to 17 Years | 0 (0.0%) | 0 (0.0%) |
| 18 to 34 Years | 22 (0.9%) | 0 (0.0%) |
| 35 to 64 Years | 70 (1.7%) | 75 (1.8%) |
| 65 to 74 Years | 89 (11.4%) | 16 (1.9%) |
| 75 Years and over | 156 (32.9%) | 163 (24.7%) |
Disability Class: Vision Difficulty
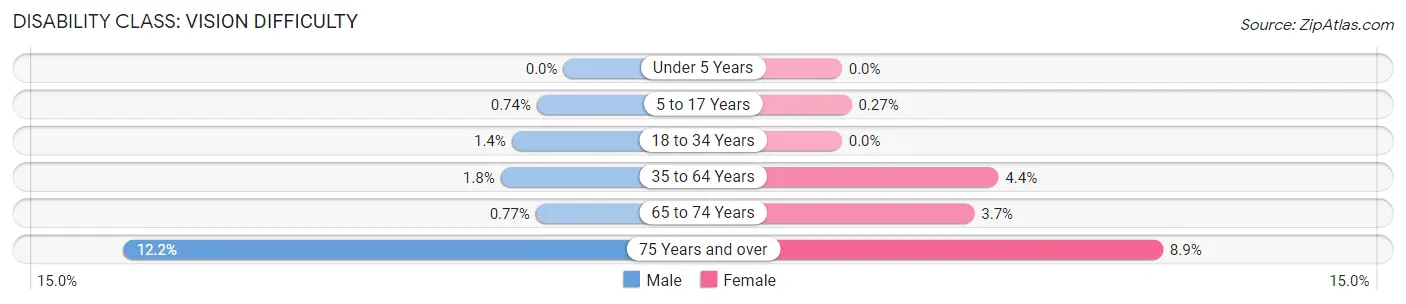
| Age Bracket | Male | Female |
| Under 5 Years | 0 (0.0%) | 0 (0.0%) |
| 5 to 17 Years | 16 (0.7%) | 6 (0.3%) |
| 18 to 34 Years | 36 (1.4%) | 0 (0.0%) |
| 35 to 64 Years | 71 (1.8%) | 186 (4.4%) |
| 65 to 74 Years | 6 (0.8%) | 31 (3.7%) |
| 75 Years and over | 58 (12.2%) | 59 (8.9%) |
Disability Class: Cognitive Difficulty
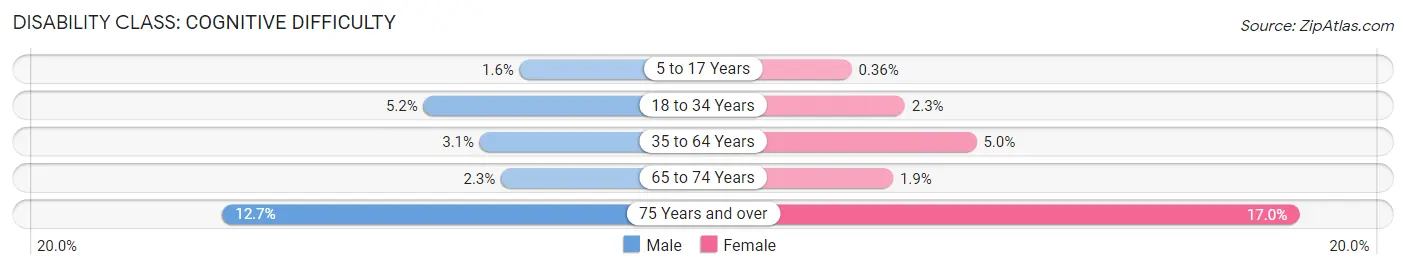
| Age Bracket | Male | Female |
| 5 to 17 Years | 35 (1.6%) | 8 (0.4%) |
| 18 to 34 Years | 130 (5.2%) | 60 (2.3%) |
| 35 to 64 Years | 126 (3.1%) | 213 (5.0%) |
| 65 to 74 Years | 18 (2.3%) | 16 (1.9%) |
| 75 Years and over | 60 (12.7%) | 112 (17.0%) |
Disability Class: Ambulatory Difficulty
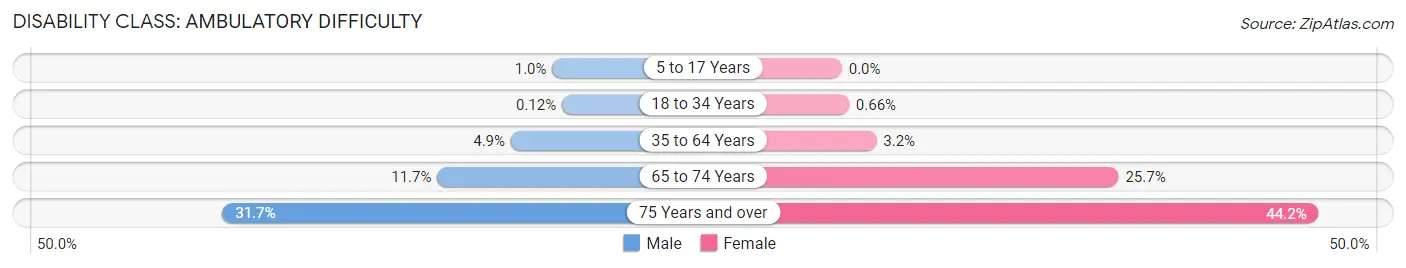
| Age Bracket | Male | Female |
| 5 to 17 Years | 22 (1.0%) | 0 (0.0%) |
| 18 to 34 Years | 3 (0.1%) | 17 (0.7%) |
| 35 to 64 Years | 198 (4.9%) | 137 (3.2%) |
| 65 to 74 Years | 91 (11.7%) | 216 (25.7%) |
| 75 Years and over | 150 (31.7%) | 292 (44.2%) |
Disability Class: Self-Care Difficulty
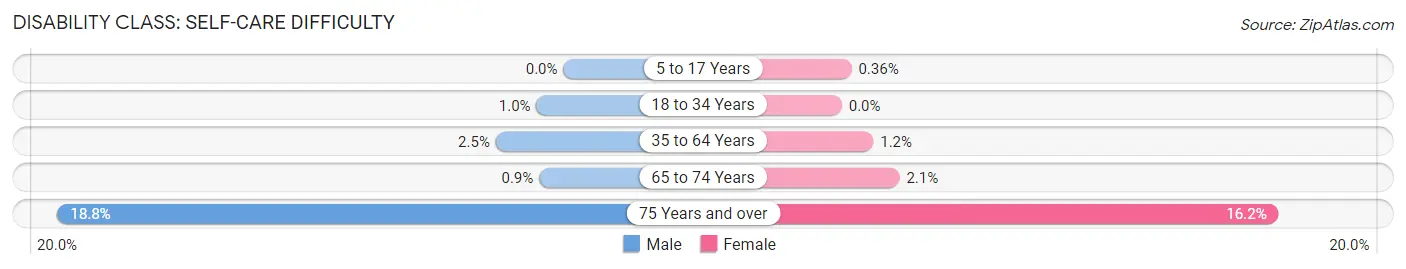
| Age Bracket | Male | Female |
| 5 to 17 Years | 0 (0.0%) | 8 (0.4%) |
| 18 to 34 Years | 25 (1.0%) | 0 (0.0%) |
| 35 to 64 Years | 102 (2.5%) | 50 (1.2%) |
| 65 to 74 Years | 7 (0.9%) | 18 (2.1%) |
| 75 Years and over | 89 (18.8%) | 107 (16.2%) |
Technology Access in American Canyon
Computing Device Access in American Canyon
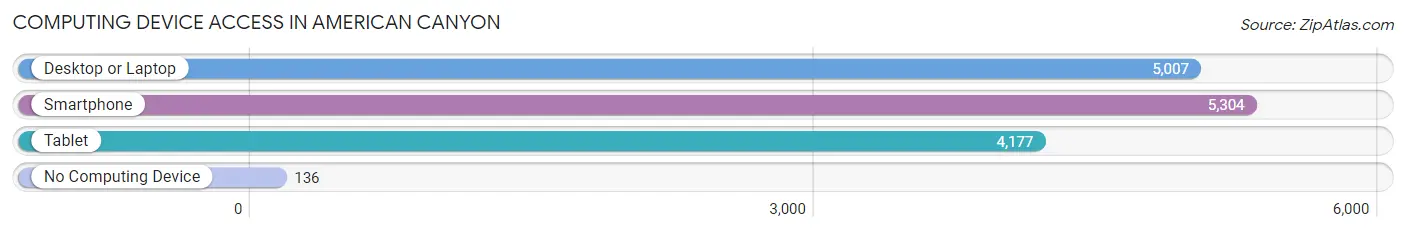
| Device Type | # Households | % Households |
| Desktop or Laptop | 5,007 | 87.5% |
| Smartphone | 5,304 | 92.6% |
| Tablet | 4,177 | 73.0% |
| No Computing Device | 136 | 2.4% |
| Total | 5,725 | 100.0% |
Internet Access in American Canyon
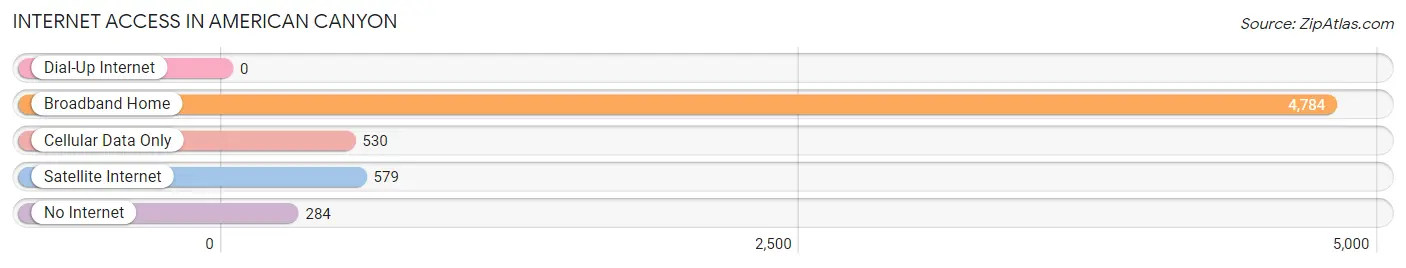
| Internet Type | # Households | % Households |
| Dial-Up Internet | 0 | 0.0% |
| Broadband Home | 4,784 | 83.6% |
| Cellular Data Only | 530 | 9.3% |
| Satellite Internet | 579 | 10.1% |
| No Internet | 284 | 5.0% |
| Total | 5,725 | 100.0% |
American Canyon Summary
History
American Canyon is a city located in Napa County, California, United States. It is part of the Napa Valley region and is located approximately 30 miles northeast of San Francisco. The city was incorporated in 1992 and has a population of approximately 19,000 people.
The area that is now American Canyon was originally inhabited by the Patwin Native Americans. The first European settlers arrived in the area in the early 1800s and began to farm the land. The area was known as “Rancheria de los Americanos” or “Ranch of the Americans” and was named after the American settlers who had moved into the area.
In the late 1800s, the area was developed as a railroad town. The railroad was built to connect the Napa Valley to the San Francisco Bay Area. The town was officially incorporated in 1992 and has since grown to become a thriving community.
Geography
American Canyon is located in the northern part of Napa County, California. It is situated in the Napa Valley region and is approximately 30 miles northeast of San Francisco. The city is bordered by the Napa River to the east and the Vaca Mountains to the west. The city has a total area of 8.3 square miles and is located at an elevation of approximately 200 feet.
The climate in American Canyon is Mediterranean, with hot, dry summers and mild, wet winters. The average temperature in the summer is around 80 degrees Fahrenheit and the average temperature in the winter is around 50 degrees Fahrenheit.
Economy
American Canyon’s economy is largely based on tourism and agriculture. The city is home to several wineries and vineyards, as well as a number of restaurants and hotels. The city is also home to a number of manufacturing and industrial businesses, including a large paper mill.
The city is also home to a number of retail stores, including a Walmart Supercenter, a Target, and a Home Depot. The city is also home to a number of corporate offices, including those of the Napa Valley Wine Train and the Napa Valley Unified School District.
Demographics
As of the 2010 census, American Canyon had a population of 19,454 people. The racial makeup of the city was 57.3% White, 16.2% Hispanic or Latino, 15.2% Asian, 8.2% African American, 0.7% Native American, and 2.4% from other races.
The median household income in American Canyon was $71,817 in 2019. The median age of the population was 36.7 years. The city has a higher percentage of college-educated residents than the national average, with 37.2% of the population having a bachelor’s degree or higher.
Conclusion
American Canyon is a city located in Napa County, California. It is part of the Napa Valley region and is located approximately 30 miles northeast of San Francisco. The city was incorporated in 1992 and has a population of approximately 19,000 people. The economy of American Canyon is largely based on tourism and agriculture, with a number of wineries, vineyards, restaurants, hotels, and retail stores located in the city. The population of American Canyon is diverse, with a majority of the population being White, Hispanic or Latino, Asian, African American, and Native American. The median household income in American Canyon is $71,817 and the median age of the population is 36.7 years.
Common Questions
What is Per Capita Income in American Canyon?
Per Capita income in American Canyon is $41,813.
What is the Median Family Income in American Canyon?
Median Family Income in American Canyon is $134,676.
What is the Median Household income in American Canyon?
Median Household Income in American Canyon is $122,694.
What is Income or Wage Gap in American Canyon?
Income or Wage Gap in American Canyon is 21.8%.
Women in American Canyon earn 78.2 cents for every dollar earned by a man.
What is Family Income Deficit in American Canyon?
Family Income Deficit in American Canyon is $9,853.
Families that are below poverty line in American Canyon earn $9,853 less on average than the poverty threshold level.
What is Inequality or Gini Index in American Canyon?
Inequality or Gini Index in American Canyon is 0.42.
What is the Total Population of American Canyon?
Total Population of American Canyon is 21,669.
What is the Total Male Population of American Canyon?
Total Male Population of American Canyon is 10,518.
What is the Total Female Population of American Canyon?
Total Female Population of American Canyon is 11,151.
What is the Ratio of Males per 100 Females in American Canyon?
There are 94.32 Males per 100 Females in American Canyon.
What is the Ratio of Females per 100 Males in American Canyon?
There are 106.02 Females per 100 Males in American Canyon.
What is the Median Population Age in American Canyon?
Median Population Age in American Canyon is 36.2 Years.
What is the Average Family Size in American Canyon
Average Family Size in American Canyon is 4.0 People.
What is the Average Household Size in American Canyon
Average Household Size in American Canyon is 3.8 People.
How Large is the Labor Force in American Canyon?
There are 11,396 People in the Labor Forcein in American Canyon.
What is the Percentage of People in the Labor Force in American Canyon?
67.1% of People are in the Labor Force in American Canyon.
What is the Unemployment Rate in American Canyon?
Unemployment Rate in American Canyon is 5.0%.