Zip Codes with the Highest Percentage of Population Employed in Health Diagnosing & Treating in Garden Grove, CA
RELATED REPORTS & OPTIONS
Health Diagnosing & Treating
Garden Grove
Compare Zip Codes
Map of Zip Codes with the Highest Percentage of Population Employed in Health Diagnosing & Treating in Garden Grove
3.2%
5.7%
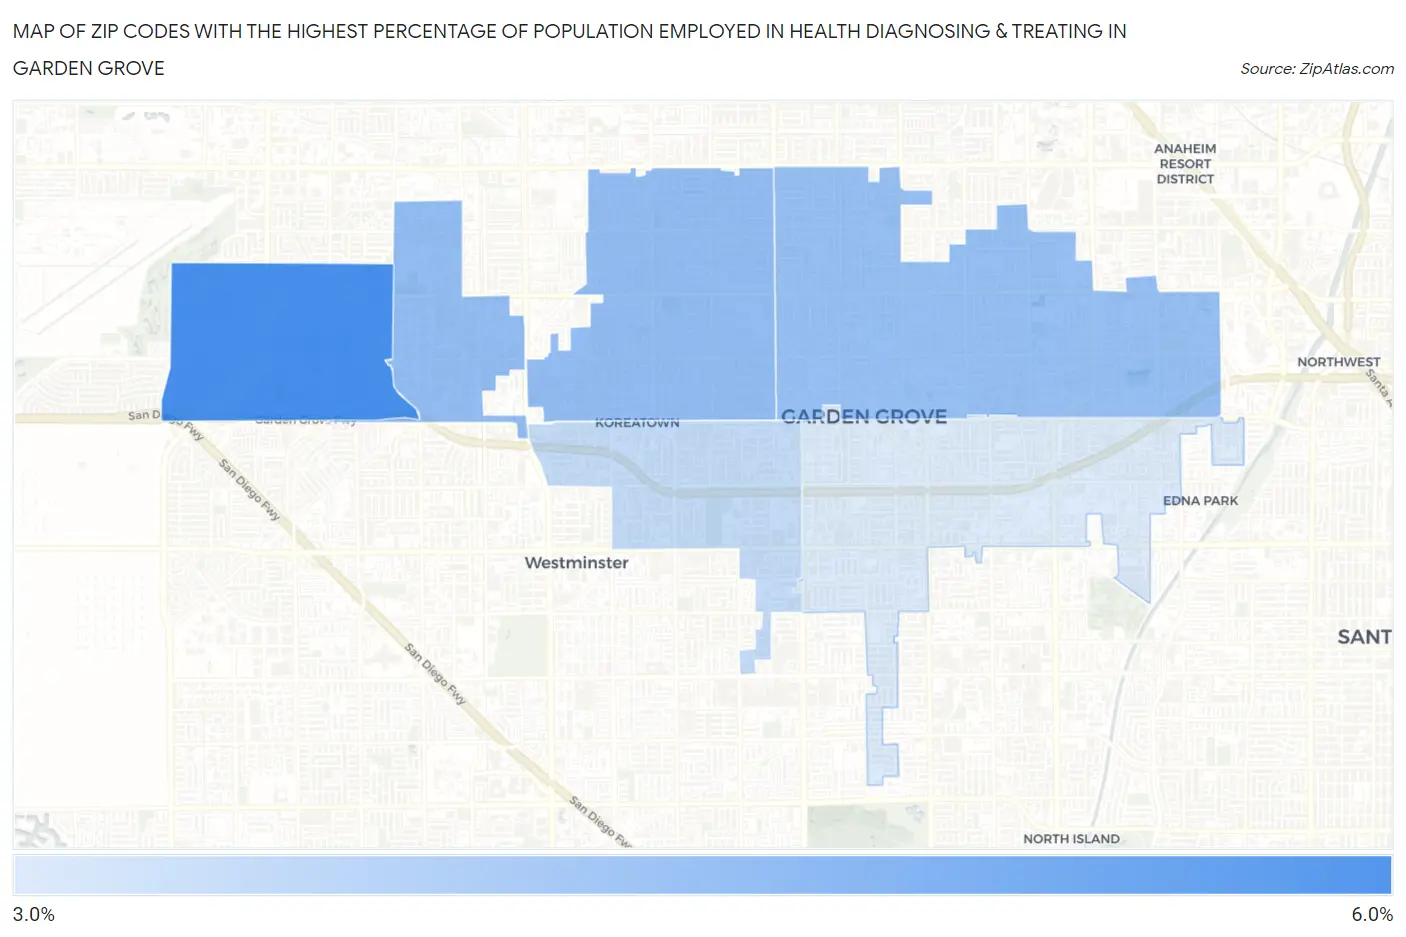
Zip Codes with the Highest Percentage of Population Employed in Health Diagnosing & Treating in Garden Grove, CA
| Zip Code | % Employed | vs State | vs National | |
| 1. | 92845 | 5.7% | 5.3%(+0.436)#621 | 6.2%(-0.497)#14,802 |
| 2. | 92841 | 4.5% | 5.3%(-0.857)#906 | 6.2%(-1.79)#19,805 |
| 3. | 92840 | 4.4% | 5.3%(-0.956)#930 | 6.2%(-1.89)#20,152 |
| 4. | 92844 | 3.6% | 5.3%(-1.69)#1,088 | 6.2%(-2.62)#22,543 |
| 5. | 92843 | 3.2% | 5.3%(-2.13)#1,167 | 6.2%(-3.06)#23,834 |
1
Common Questions
What are the Top 3 Zip Codes with the Highest Percentage of Population Employed in Health Diagnosing & Treating in Garden Grove, CA?
Top 3 Zip Codes with the Highest Percentage of Population Employed in Health Diagnosing & Treating in Garden Grove, CA are:
What zip code has the Highest Percentage of Population Employed in Health Diagnosing & Treating in Garden Grove, CA?
92845 has the Highest Percentage of Population Employed in Health Diagnosing & Treating in Garden Grove, CA with 5.7%.
What is the Percentage of Population Employed in Health Diagnosing & Treating in Garden Grove, CA?
Percentage of Population Employed in Health Diagnosing & Treating in Garden Grove is 4.1%.
What is the Percentage of Population Employed in Health Diagnosing & Treating in California?
Percentage of Population Employed in Health Diagnosing & Treating in California is 5.3%.
What is the Percentage of Population Employed in Health Diagnosing & Treating in the United States?
Percentage of Population Employed in Health Diagnosing & Treating in the United States is 6.2%.