Cities with the Highest Percentage of Population Employed in Health Diagnosing & Treating in New York
RELATED REPORTS & OPTIONS
Health Diagnosing & Treating
New York
Compare Cities
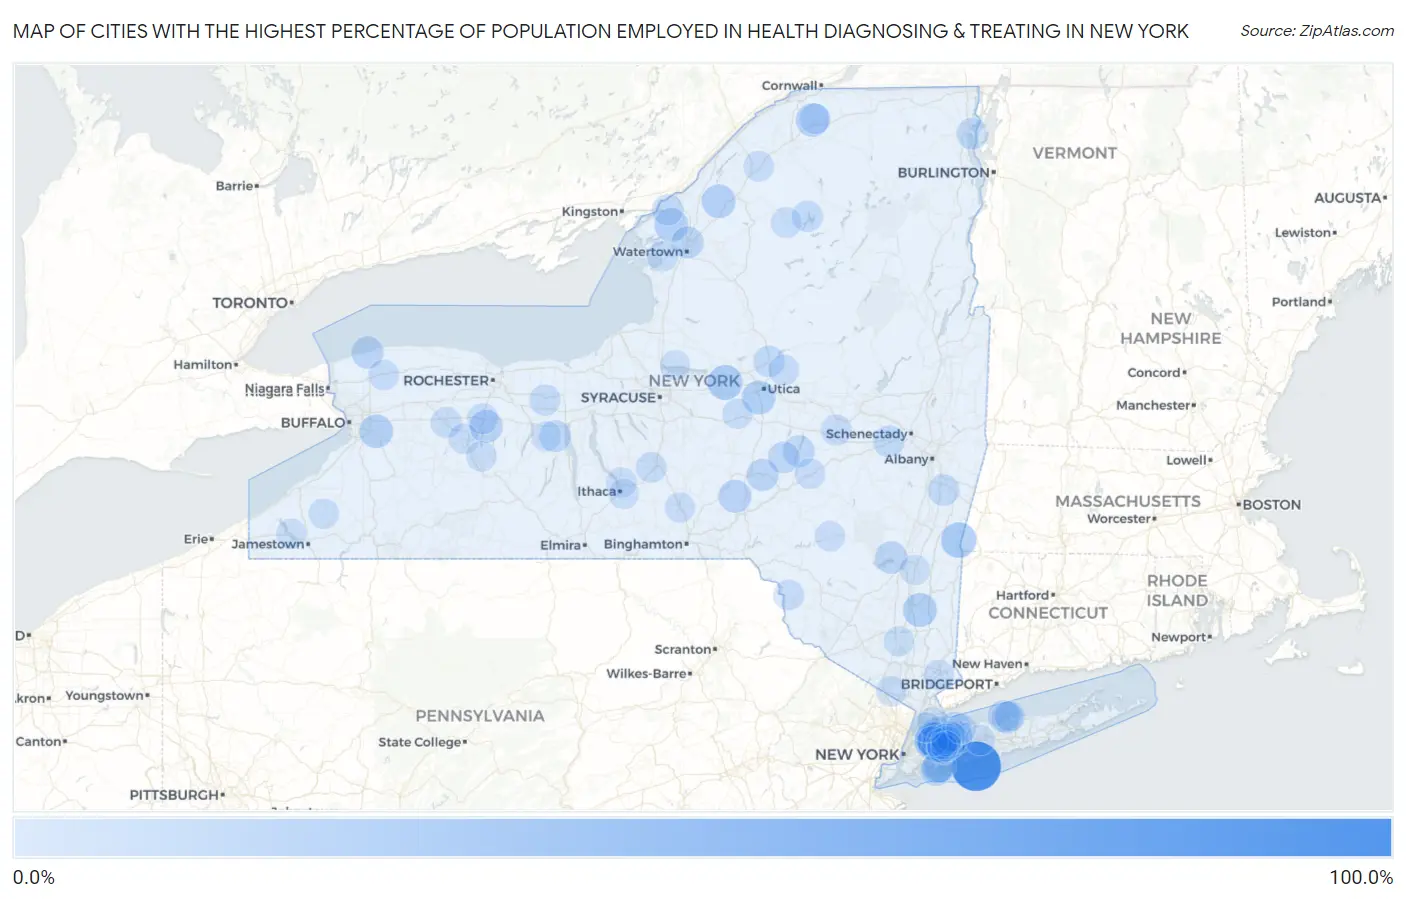
Map of Cities with the Highest Percentage of Population Employed in Health Diagnosing & Treating in New York
0.0%
100.0%
Cities with the Highest Percentage of Population Employed in Health Diagnosing & Treating in New York
| City | % Employed | vs State | vs National | |
| 1. | Gilgo | 86.5% | 6.6%(+79.9)#1 | 6.2%(+80.2)#22 |
| 2. | Eagle Bay | 50.0% | 6.6%(+43.4)#2 | 6.2%(+43.8)#83 |
| 3. | Saddle Rock Estates | 43.1% | 6.6%(+36.5)#3 | 6.2%(+36.9)#117 |
| 4. | Fly Creek | 43.1% | 6.6%(+36.5)#4 | 6.2%(+36.9)#118 |
| 5. | Great Neck Gardens | 39.8% | 6.6%(+33.2)#5 | 6.2%(+33.6)#146 |
| 6. | Copake Falls | 32.6% | 6.6%(+26.1)#6 | 6.2%(+26.4)#248 |
| 7. | Verona | 31.4% | 6.6%(+24.8)#7 | 6.2%(+25.1)#284 |
| 8. | Titusville | 28.0% | 6.6%(+21.5)#8 | 6.2%(+21.8)#354 |
| 9. | Washington Mills | 27.2% | 6.6%(+20.6)#9 | 6.2%(+20.9)#370 |
| 10. | Oxbow | 26.8% | 6.6%(+20.3)#10 | 6.2%(+20.6)#378 |
| 11. | Depauville | 26.5% | 6.6%(+19.9)#11 | 6.2%(+20.2)#389 |
| 12. | North Granville | 26.3% | 6.6%(+19.7)#12 | 6.2%(+20.0)#399 |
| 13. | Elma Center | 26.1% | 6.6%(+19.5)#13 | 6.2%(+19.8)#408 |
| 14. | Roslyn | 26.0% | 6.6%(+19.4)#14 | 6.2%(+19.8)#410 |
| 15. | Winthrop | 25.6% | 6.6%(+19.0)#15 | 6.2%(+19.4)#419 |
| 16. | Portlandville | 24.4% | 6.6%(+17.8)#16 | 6.2%(+18.1)#472 |
| 17. | South Lima | 24.2% | 6.6%(+17.6)#17 | 6.2%(+17.9)#484 |
| 18. | Willsboro Point | 24.1% | 6.6%(+17.5)#18 | 6.2%(+17.9)#489 |
| 19. | Guilford | 24.1% | 6.6%(+17.5)#19 | 6.2%(+17.8)#491 |
| 20. | Muttontown | 23.2% | 6.6%(+16.7)#20 | 6.2%(+17.0)#534 |
| 21. | East Frankfort | 23.2% | 6.6%(+16.6)#21 | 6.2%(+16.9)#538 |
| 22. | Woodbourne | 22.2% | 6.6%(+15.6)#22 | 6.2%(+15.9)#596 |
| 23. | West Hurley | 22.0% | 6.6%(+15.4)#23 | 6.2%(+15.8)#603 |
| 24. | Olcott | 21.7% | 6.6%(+15.1)#24 | 6.2%(+15.4)#623 |
| 25. | Kauneonga Lake | 21.6% | 6.6%(+15.1)#25 | 6.2%(+15.4)#625 |
| 26. | Pamelia Center | 21.2% | 6.6%(+14.6)#26 | 6.2%(+15.0)#644 |
| 27. | Morris | 21.1% | 6.6%(+14.5)#27 | 6.2%(+14.9)#652 |
| 28. | Harbor Hills | 20.9% | 6.6%(+14.4)#28 | 6.2%(+14.7)#665 |
| 29. | Cooperstown | 20.8% | 6.6%(+14.3)#29 | 6.2%(+14.6)#674 |
| 30. | Hall | 20.6% | 6.6%(+14.0)#30 | 6.2%(+14.4)#695 |
| 31. | Old Field | 20.4% | 6.6%(+13.8)#31 | 6.2%(+14.1)#712 |
| 32. | Searingtown | 20.4% | 6.6%(+13.8)#32 | 6.2%(+14.1)#717 |
| 33. | Conesus | 20.3% | 6.6%(+13.8)#33 | 6.2%(+14.1)#718 |
| 34. | Hartwick | 20.1% | 6.6%(+13.5)#34 | 6.2%(+13.8)#732 |
| 35. | Lawrence | 20.0% | 6.6%(+13.5)#35 | 6.2%(+13.8)#736 |
| 36. | Cumberland Head | 19.9% | 6.6%(+13.3)#36 | 6.2%(+13.6)#762 |
| 37. | Poquott | 19.8% | 6.6%(+13.3)#37 | 6.2%(+13.6)#764 |
| 38. | Lake Success | 19.8% | 6.6%(+13.2)#38 | 6.2%(+13.5)#769 |
| 39. | Sands Point | 19.8% | 6.6%(+13.2)#39 | 6.2%(+13.5)#770 |
| 40. | Old Westbury | 19.7% | 6.6%(+13.1)#40 | 6.2%(+13.4)#782 |
| 41. | Hewlett Harbor | 19.7% | 6.6%(+13.1)#41 | 6.2%(+13.4)#783 |
| 42. | Niverville | 19.6% | 6.6%(+13.0)#42 | 6.2%(+13.3)#792 |
| 43. | Barrytown | 19.5% | 6.6%(+12.9)#43 | 6.2%(+13.3)#795 |
| 44. | Mill Neck | 19.5% | 6.6%(+12.9)#44 | 6.2%(+13.2)#797 |
| 45. | Setauket | 19.3% | 6.6%(+12.7)#45 | 6.2%(+13.1)#809 |
| 46. | Woodsburgh | 19.3% | 6.6%(+12.7)#46 | 6.2%(+13.1)#810 |
| 47. | Duanesburg | 19.3% | 6.6%(+12.7)#47 | 6.2%(+13.1)#811 |
| 48. | Brookville | 19.0% | 6.6%(+12.4)#48 | 6.2%(+12.8)#842 |
| 49. | Barneveld | 18.6% | 6.6%(+12.1)#49 | 6.2%(+12.4)#881 |
| 50. | Cranberry Lake | 18.2% | 6.6%(+11.6)#50 | 6.2%(+11.9)#936 |
| 51. | Clayton | 18.2% | 6.6%(+11.6)#51 | 6.2%(+11.9)#943 |
| 52. | Port Gibson | 17.7% | 6.6%(+11.1)#52 | 6.2%(+11.4)#988 |
| 53. | Wurtsboro Hills | 17.4% | 6.6%(+10.9)#53 | 6.2%(+11.2)#1,017 |
| 54. | Schuyler Lake | 17.4% | 6.6%(+10.8)#54 | 6.2%(+11.1)#1,020 |
| 55. | East Avon | 17.2% | 6.6%(+10.6)#55 | 6.2%(+11.0)#1,051 |
| 56. | Ames | 17.2% | 6.6%(+10.6)#56 | 6.2%(+11.0)#1,052 |
| 57. | Roslyn Heights | 17.1% | 6.6%(+10.5)#57 | 6.2%(+10.8)#1,072 |
| 58. | Pavilion | 17.0% | 6.6%(+10.4)#58 | 6.2%(+10.8)#1,086 |
| 59. | Roslyn Estates | 16.8% | 6.6%(+10.2)#59 | 6.2%(+10.6)#1,122 |
| 60. | Cortland West | 16.8% | 6.6%(+10.2)#60 | 6.2%(+10.5)#1,129 |
| 61. | Brasher Falls | 16.8% | 6.6%(+10.2)#61 | 6.2%(+10.5)#1,131 |
| 62. | Sackets Harbor | 16.6% | 6.6%(+10.1)#62 | 6.2%(+10.4)#1,164 |
| 63. | Poland | 16.6% | 6.6%(+10.0)#63 | 6.2%(+10.4)#1,166 |
| 64. | Star Lake | 16.6% | 6.6%(+10.0)#64 | 6.2%(+10.4)#1,167 |
| 65. | Gasport | 16.5% | 6.6%(+9.92)#65 | 6.2%(+10.2)#1,180 |
| 66. | Hortonville | 16.3% | 6.6%(+9.75)#66 | 6.2%(+10.1)#1,211 |
| 67. | Dekalb Junction | 16.3% | 6.6%(+9.71)#67 | 6.2%(+10.0)#1,218 |
| 68. | Plandome Heights | 16.2% | 6.6%(+9.67)#68 | 6.2%(+10.00)#1,231 |
| 69. | Jefferson | 16.1% | 6.6%(+9.56)#69 | 6.2%(+9.88)#1,256 |
| 70. | Montebello | 16.1% | 6.6%(+9.55)#70 | 6.2%(+9.88)#1,262 |
| 71. | Garden City Park | 16.1% | 6.6%(+9.55)#71 | 6.2%(+9.88)#1,263 |
| 72. | Schenevus | 16.1% | 6.6%(+9.50)#72 | 6.2%(+9.83)#1,272 |
| 73. | Larchmont | 15.9% | 6.6%(+9.29)#73 | 6.2%(+9.61)#1,313 |
| 74. | Cuylerville | 15.8% | 6.6%(+9.22)#74 | 6.2%(+9.54)#1,323 |
| 75. | Oriskany Falls | 15.8% | 6.6%(+9.20)#75 | 6.2%(+9.53)#1,336 |
| 76. | North Hills | 15.7% | 6.6%(+9.16)#76 | 6.2%(+9.49)#1,345 |
| 77. | Lansing | 15.5% | 6.6%(+8.93)#77 | 6.2%(+9.26)#1,393 |
| 78. | Bedford Hills | 15.5% | 6.6%(+8.92)#78 | 6.2%(+9.25)#1,396 |
| 79. | Whitney Point | 15.4% | 6.6%(+8.83)#79 | 6.2%(+9.16)#1,412 |
| 80. | Old Brookville | 15.4% | 6.6%(+8.83)#80 | 6.2%(+9.16)#1,414 |
| 81. | Dix Hills | 15.4% | 6.6%(+8.82)#81 | 6.2%(+9.15)#1,415 |
| 82. | Walworth | 15.3% | 6.6%(+8.75)#82 | 6.2%(+9.07)#1,435 |
| 83. | Margaretville | 15.3% | 6.6%(+8.73)#83 | 6.2%(+9.06)#1,443 |
| 84. | Cherry Creek | 15.3% | 6.6%(+8.71)#84 | 6.2%(+9.03)#1,453 |
| 85. | Scottsburg | 15.2% | 6.6%(+8.65)#85 | 6.2%(+8.97)#1,460 |
| 86. | Roslyn Harbor | 15.1% | 6.6%(+8.55)#86 | 6.2%(+8.88)#1,479 |
| 87. | Saddle Rock | 15.0% | 6.6%(+8.45)#87 | 6.2%(+8.78)#1,500 |
| 88. | Vails Gate | 15.0% | 6.6%(+8.43)#88 | 6.2%(+8.76)#1,502 |
| 89. | East Ithaca | 15.0% | 6.6%(+8.39)#89 | 6.2%(+8.72)#1,517 |
| 90. | Herricks | 14.9% | 6.6%(+8.36)#90 | 6.2%(+8.69)#1,521 |
| 91. | Belle Terre | 14.9% | 6.6%(+8.33)#91 | 6.2%(+8.66)#1,528 |
| 92. | Rhinebeck | 14.9% | 6.6%(+8.31)#92 | 6.2%(+8.64)#1,534 |
| 93. | East Herkimer | 14.9% | 6.6%(+8.28)#93 | 6.2%(+8.61)#1,540 |
| 94. | Bemus Point | 14.7% | 6.6%(+8.11)#94 | 6.2%(+8.43)#1,584 |
| 95. | East Hills | 14.6% | 6.6%(+8.02)#95 | 6.2%(+8.35)#1,624 |
| 96. | Cove Neck | 14.5% | 6.6%(+7.93)#96 | 6.2%(+8.26)#1,645 |
| 97. | Gorham | 14.5% | 6.6%(+7.90)#97 | 6.2%(+8.23)#1,656 |
| 98. | Constantia | 14.5% | 6.6%(+7.90)#98 | 6.2%(+8.23)#1,659 |
| 99. | Pelham Manor | 14.4% | 6.6%(+7.87)#99 | 6.2%(+8.20)#1,665 |
| 100. | East Williston | 14.4% | 6.6%(+7.83)#100 | 6.2%(+8.15)#1,677 |
Common Questions
What are the Top 10 Cities with the Highest Percentage of Population Employed in Health Diagnosing & Treating in New York?
Top 10 Cities with the Highest Percentage of Population Employed in Health Diagnosing & Treating in New York are:
#1
86.5%
#2
43.1%
#3
39.8%
#4
32.6%
#5
31.4%
#6
28.0%
#7
27.2%
#8
26.8%
#9
26.5%
#10
26.1%
What city has the Highest Percentage of Population Employed in Health Diagnosing & Treating in New York?
Gilgo has the Highest Percentage of Population Employed in Health Diagnosing & Treating in New York with 86.5%.
What is the Percentage of Population Employed in Health Diagnosing & Treating in the State of New York?
Percentage of Population Employed in Health Diagnosing & Treating in New York is 6.6%.
What is the Percentage of Population Employed in Health Diagnosing & Treating in the United States?
Percentage of Population Employed in Health Diagnosing & Treating in the United States is 6.2%.