Coffee Creek, CA Map & Demographics
Coffee Creek Map
Coffee Creek Overview
$42,103
PER CAPITA INCOME
$61,250
AVG HOUSEHOLD INCOME
69.3%
WAGE / INCOME GAP [ % ]
30.7¢/ $1
WAGE / INCOME GAP [ $ ]
0.44
INEQUALITY / GINI INDEX
278
TOTAL POPULATION
135
MALE POPULATION
143
FEMALE POPULATION
94.41
MALES / 100 FEMALES
105.93
FEMALES / 100 MALES
52.7
MEDIAN AGE
3.1
AVG FAMILY SIZE
2.4
AVG HOUSEHOLD SIZE
100
LABOR FORCE [ PEOPLE ]
38.3%
PERCENT IN LABOR FORCE
5.0%
UNEMPLOYMENT RATE
Income in Coffee Creek
Income Overview in Coffee Creek
| Characteristic | Number | Measure |
| Per Capita Income | 278 | $42,103 |
| Median Family Income | 67 | $0 |
| Mean Family Income | 67 | $117,266 |
| Median Household Income | 103 | $61,250 |
| Mean Household Income | 103 | $103,543 |
| Income Deficit | 67 | $0 |
| Wage / Income Gap (%) | 278 | 69.28% |
| Wage / Income Gap ($) | 278 | 30.72¢ per $1 |
| Gini / Inequality Index | 278 | 0.44 |
Earnings by Sex in Coffee Creek
Average Earnings in Coffee Creek are $23,125, $45,568 for men and $14,000 for women, a difference of 69.3%.
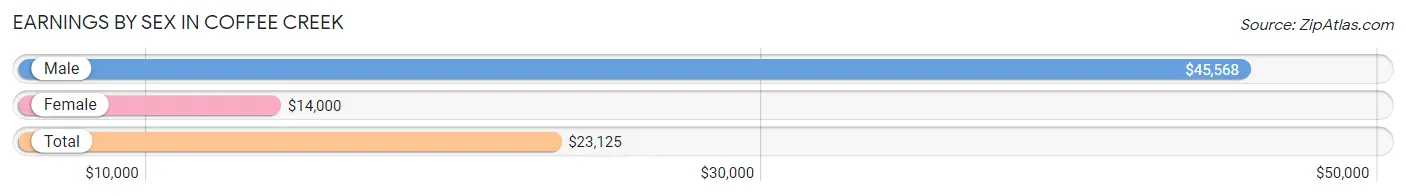
| Sex | Number | Average Earnings |
| Male | 55 (39.0%) | $45,568 |
| Female | 86 (61.0%) | $14,000 |
| Total | 141 (100.0%) | $23,125 |
Earnings by Sex by Income Bracket in Coffee Creek
The most common earnings brackets in Coffee Creek are $65,000 to $74,999 for men (17 | 30.9%) and $12,500 to $14,999 for women (40 | 46.5%).
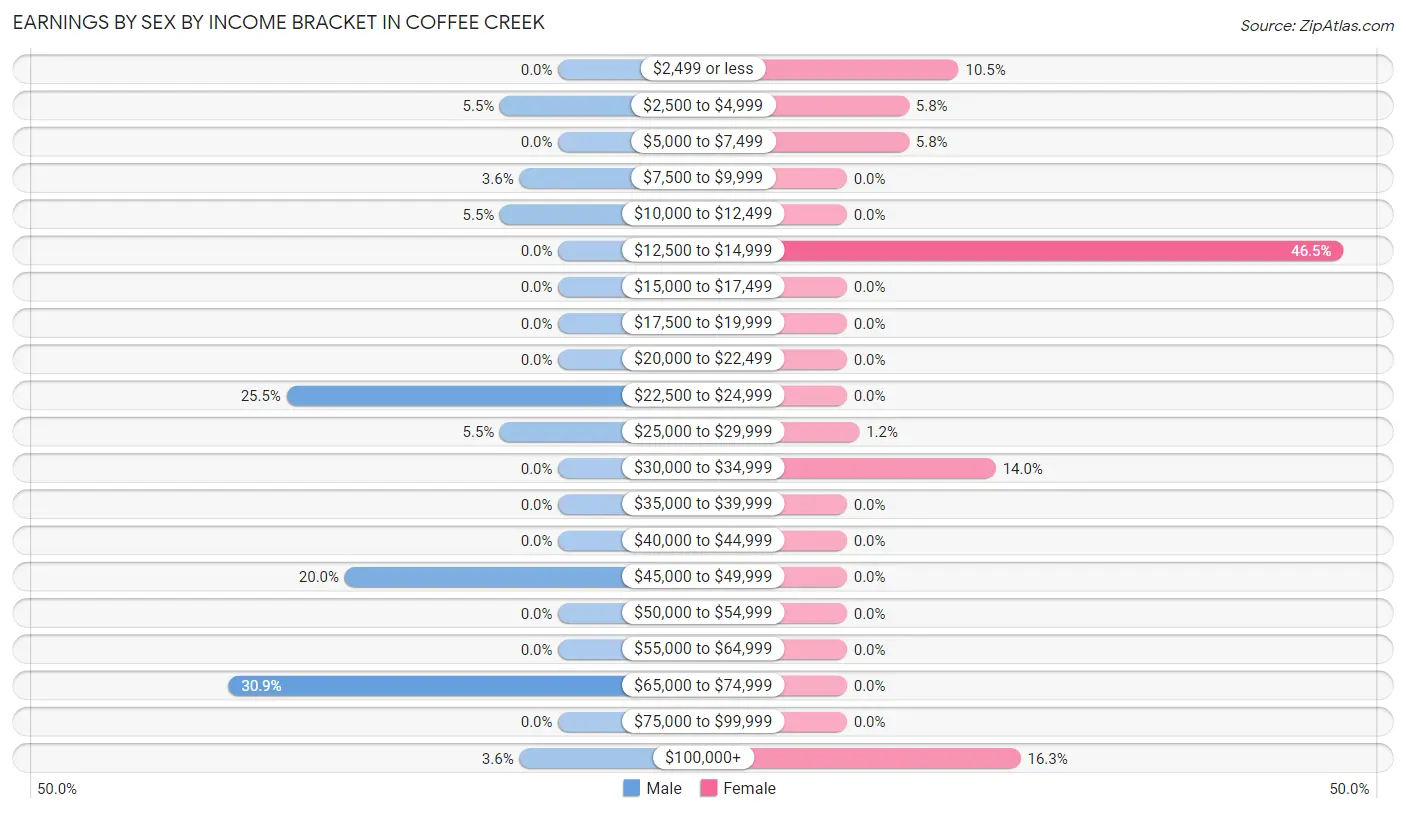
| Income | Male | Female |
| $2,499 or less | 0 (0.0%) | 9 (10.5%) |
| $2,500 to $4,999 | 3 (5.4%) | 5 (5.8%) |
| $5,000 to $7,499 | 0 (0.0%) | 5 (5.8%) |
| $7,500 to $9,999 | 2 (3.6%) | 0 (0.0%) |
| $10,000 to $12,499 | 3 (5.4%) | 0 (0.0%) |
| $12,500 to $14,999 | 0 (0.0%) | 40 (46.5%) |
| $15,000 to $17,499 | 0 (0.0%) | 0 (0.0%) |
| $17,500 to $19,999 | 0 (0.0%) | 0 (0.0%) |
| $20,000 to $22,499 | 0 (0.0%) | 0 (0.0%) |
| $22,500 to $24,999 | 14 (25.5%) | 0 (0.0%) |
| $25,000 to $29,999 | 3 (5.4%) | 1 (1.2%) |
| $30,000 to $34,999 | 0 (0.0%) | 12 (14.0%) |
| $35,000 to $39,999 | 0 (0.0%) | 0 (0.0%) |
| $40,000 to $44,999 | 0 (0.0%) | 0 (0.0%) |
| $45,000 to $49,999 | 11 (20.0%) | 0 (0.0%) |
| $50,000 to $54,999 | 0 (0.0%) | 0 (0.0%) |
| $55,000 to $64,999 | 0 (0.0%) | 0 (0.0%) |
| $65,000 to $74,999 | 17 (30.9%) | 0 (0.0%) |
| $75,000 to $99,999 | 0 (0.0%) | 0 (0.0%) |
| $100,000+ | 2 (3.6%) | 14 (16.3%) |
| Total | 55 (100.0%) | 86 (100.0%) |
Earnings by Sex by Educational Attainment in Coffee Creek
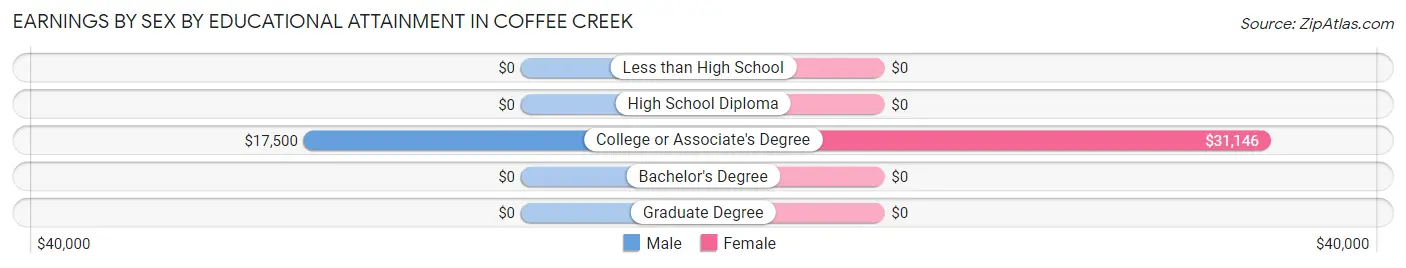
| Educational Attainment | Male Income | Female Income |
| Less than High School | - | - |
| High School Diploma | - | - |
| College or Associate's Degree | $17,500 | $31,146 |
| Bachelor's Degree | - | - |
| Graduate Degree | - | - |
| Total | $45,909 | $0 |
Family Income in Coffee Creek
Family Income Brackets in Coffee Creek
According to the Coffee Creek family income data, there are 19 families falling into the $100,000 to $149,999 income range, which is the most common income bracket and makes up 28.4% of all families.
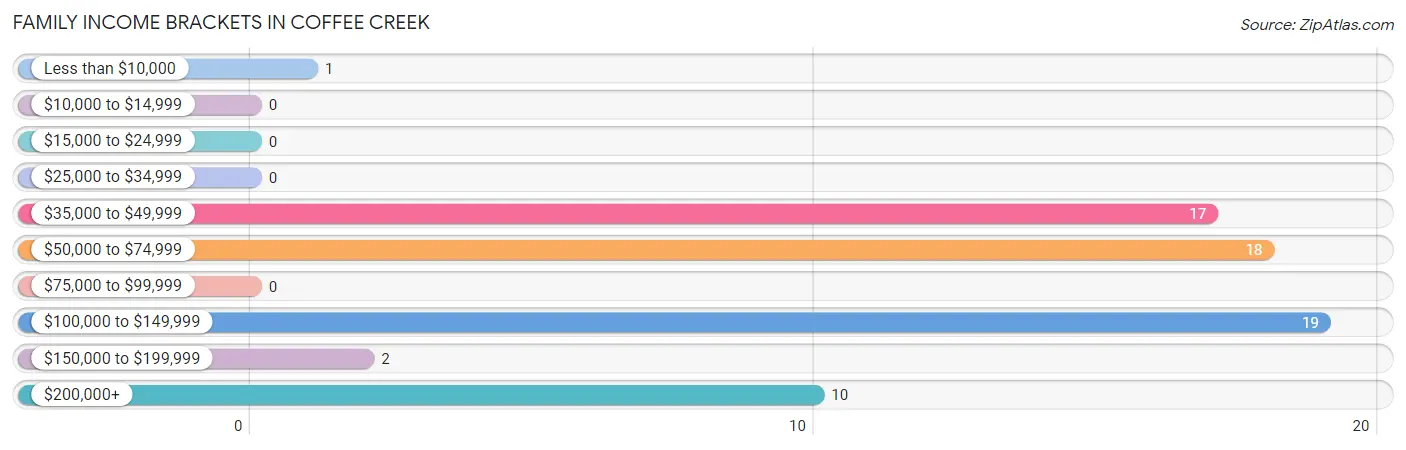
| Income Bracket | # Families | % Families |
| Less than $10,000 | 1 | 1.5% |
| $10,000 to $14,999 | 0 | 0.0% |
| $15,000 to $24,999 | 0 | 0.0% |
| $25,000 to $34,999 | 0 | 0.0% |
| $35,000 to $49,999 | 17 | 25.4% |
| $50,000 to $74,999 | 18 | 26.9% |
| $75,000 to $99,999 | 0 | 0.0% |
| $100,000 to $149,999 | 19 | 28.4% |
| $150,000 to $199,999 | 2 | 3.0% |
| $200,000+ | 10 | 14.9% |
Family Income by Famaliy Size in Coffee Creek
2-person families (50 | 74.6%) account for the highest median family income in Coffee Creek with $118,750 per family, while 2-person families (50 | 74.6%) have the highest median income of $59,375 per family member.
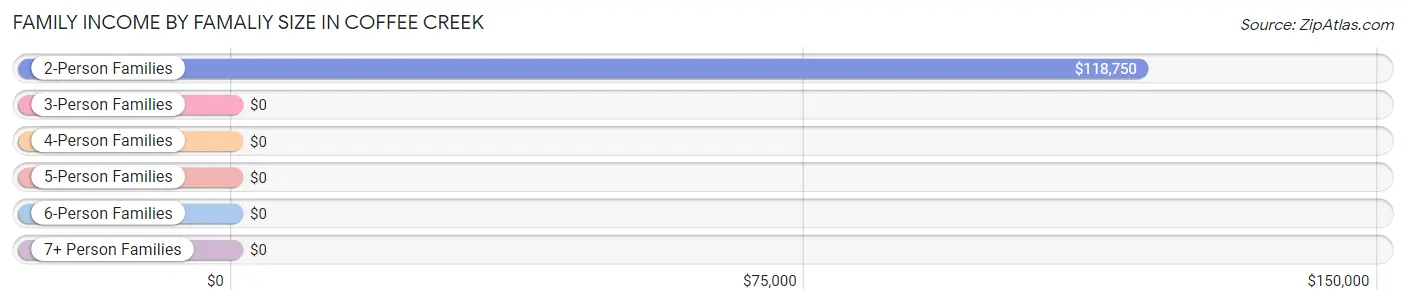
| Income Bracket | # Families | Median Income |
| 2-Person Families | 50 (74.6%) | $118,750 |
| 3-Person Families | 4 (6.0%) | $0 |
| 4-Person Families | 2 (3.0%) | $0 |
| 5-Person Families | 11 (16.4%) | $0 |
| 6-Person Families | 0 (0.0%) | $0 |
| 7+ Person Families | 0 (0.0%) | $0 |
| Total | 67 (100.0%) | $0 |
Family Income by Number of Earners in Coffee Creek
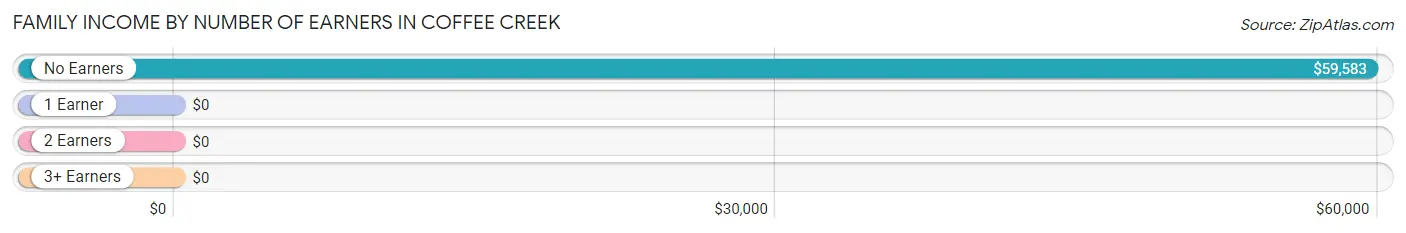
| Number of Earners | # Families | Median Income |
| No Earners | 13 (19.4%) | $59,583 |
| 1 Earner | 23 (34.3%) | $0 |
| 2 Earners | 31 (46.3%) | $0 |
| 3+ Earners | 0 (0.0%) | $0 |
| Total | 67 (100.0%) | $0 |
Household Income in Coffee Creek
Household Income Brackets in Coffee Creek
With 31 households falling in the category, the $35,000 to $49,999 income range is the most frequent in Coffee Creek, accounting for 30.1% of all households.
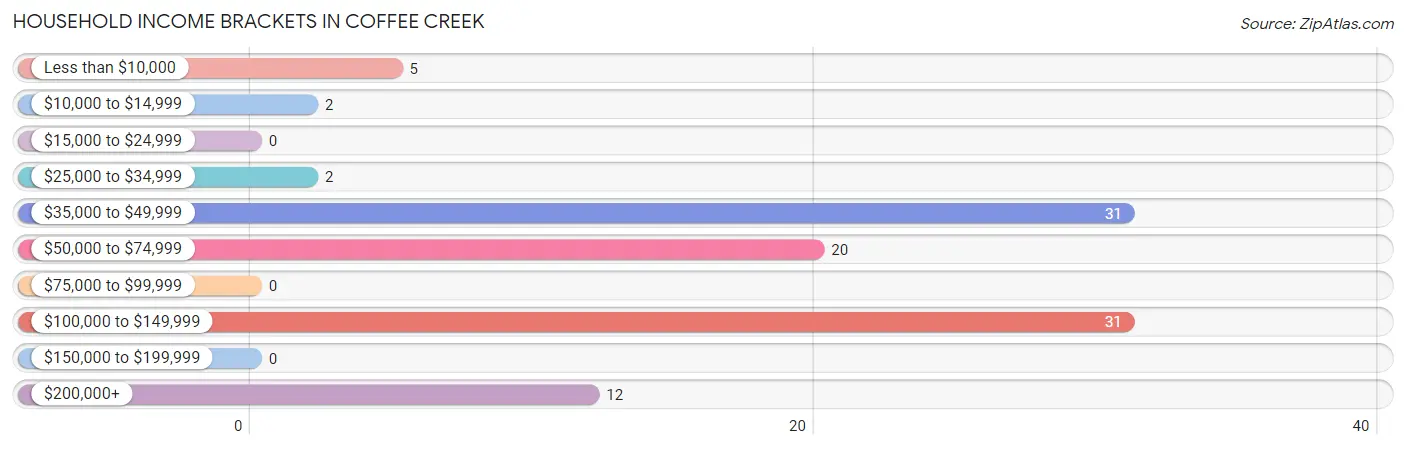
| Income Bracket | # Households | % Households |
| Less than $10,000 | 5 | 4.9% |
| $10,000 to $14,999 | 2 | 1.9% |
| $15,000 to $24,999 | 0 | 0.0% |
| $25,000 to $34,999 | 2 | 1.9% |
| $35,000 to $49,999 | 31 | 30.1% |
| $50,000 to $74,999 | 20 | 19.4% |
| $75,000 to $99,999 | 0 | 0.0% |
| $100,000 to $149,999 | 31 | 30.1% |
| $150,000 to $199,999 | 0 | 0.0% |
| $200,000+ | 12 | 11.7% |
Household Income by Householder Age in Coffee Creek
The median household income in Coffee Creek is $61,250, with the highest median household income of $53,750 found in the 65+ years age bracket for the primary householder. A total of 44 households (42.7%) fall into this category.
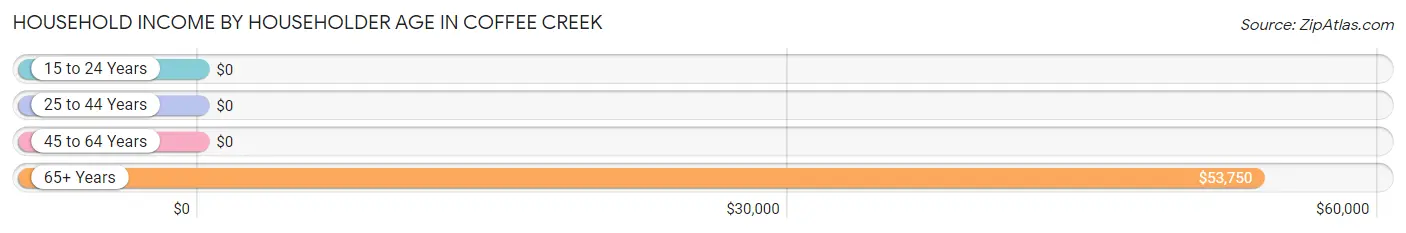
| Income Bracket | # Households | Median Income |
| 15 to 24 Years | 0 (0.0%) | $0 |
| 25 to 44 Years | 0 (0.0%) | $0 |
| 45 to 64 Years | 59 (57.3%) | $0 |
| 65+ Years | 44 (42.7%) | $53,750 |
| Total | 103 (100.0%) | $61,250 |
Poverty in Coffee Creek
Income Below Poverty by Sex and Age in Coffee Creek
With 5.2% poverty level for males and 23.1% for females among the residents of Coffee Creek, 18 to 24 year old males and 18 to 24 year old females are the most vulnerable to poverty, with 3 males (18.8%) and 27 females (100.0%) in their respective age groups living below the poverty level.
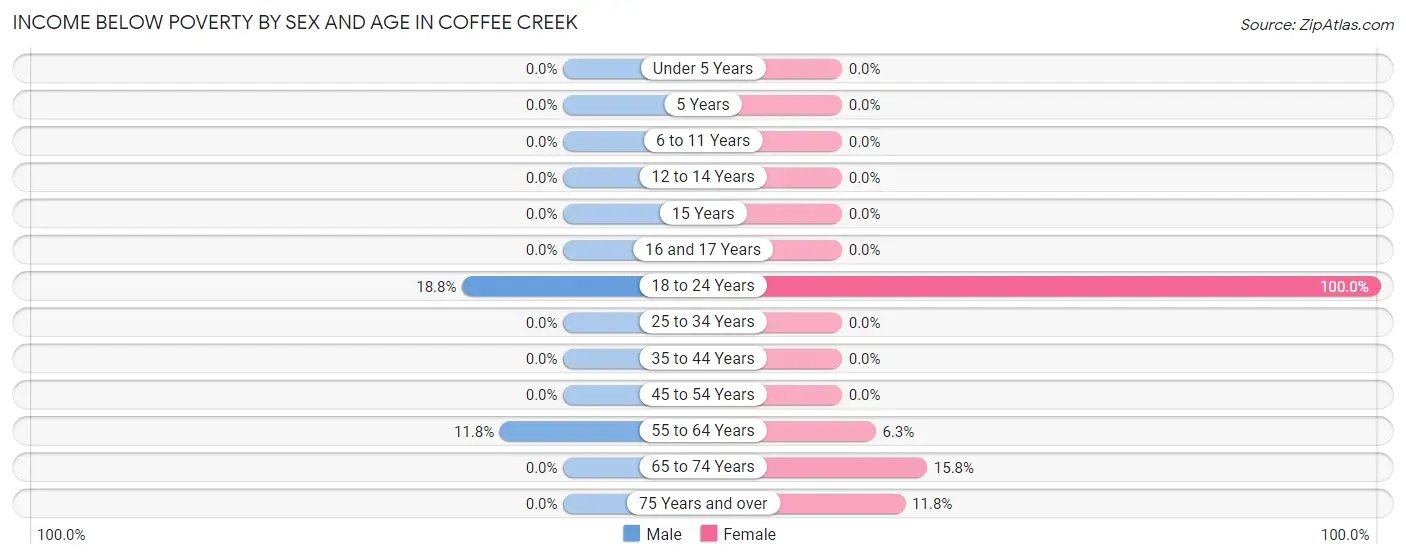
| Age Bracket | Male | Female |
| Under 5 Years | 0 (0.0%) | 0 (0.0%) |
| 5 Years | 0 (0.0%) | 0 (0.0%) |
| 6 to 11 Years | 0 (0.0%) | 0 (0.0%) |
| 12 to 14 Years | 0 (0.0%) | 0 (0.0%) |
| 15 Years | 0 (0.0%) | 0 (0.0%) |
| 16 and 17 Years | 0 (0.0%) | 0 (0.0%) |
| 18 to 24 Years | 3 (18.8%) | 27 (100.0%) |
| 25 to 34 Years | 0 (0.0%) | 0 (0.0%) |
| 35 to 44 Years | 0 (0.0%) | 0 (0.0%) |
| 45 to 54 Years | 0 (0.0%) | 0 (0.0%) |
| 55 to 64 Years | 4 (11.8%) | 1 (6.2%) |
| 65 to 74 Years | 0 (0.0%) | 3 (15.8%) |
| 75 Years and over | 0 (0.0%) | 2 (11.8%) |
| Total | 7 (5.2%) | 33 (23.1%) |
Income Above Poverty by Sex and Age in Coffee Creek
According to the poverty statistics in Coffee Creek, males aged 6 to 11 years and females aged 12 to 14 years are the age groups that are most secure financially, with 100.0% of males and 100.0% of females in these age groups living above the poverty line.
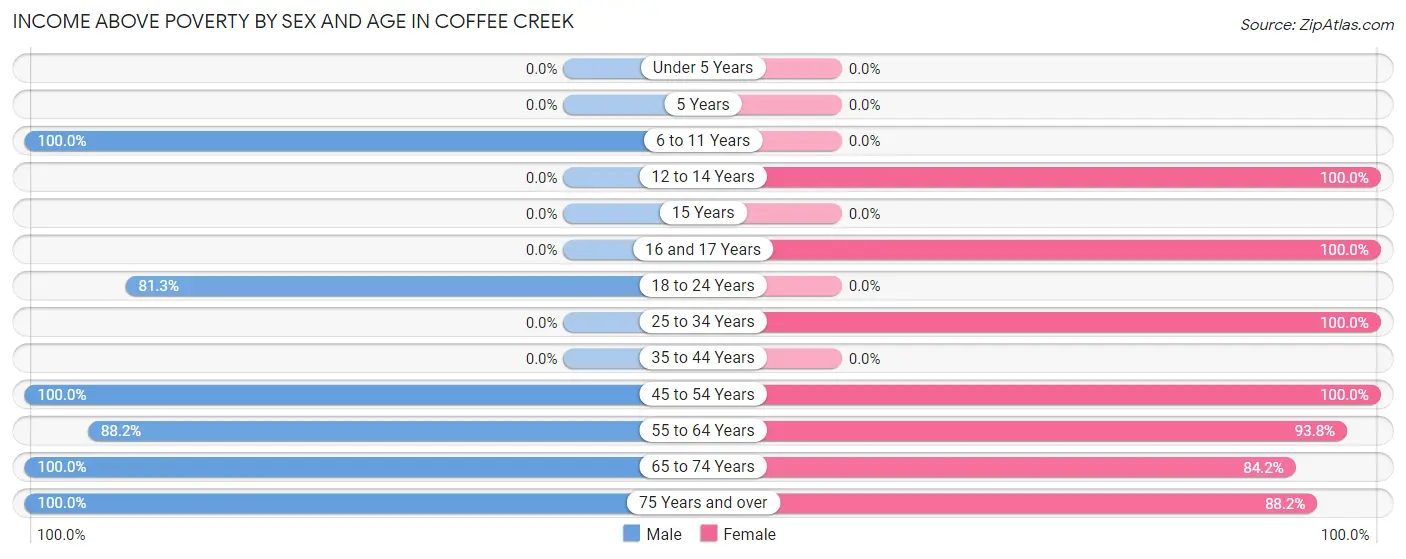
| Age Bracket | Male | Female |
| Under 5 Years | 0 (0.0%) | 0 (0.0%) |
| 5 Years | 0 (0.0%) | 0 (0.0%) |
| 6 to 11 Years | 13 (100.0%) | 0 (0.0%) |
| 12 to 14 Years | 0 (0.0%) | 4 (100.0%) |
| 15 Years | 0 (0.0%) | 0 (0.0%) |
| 16 and 17 Years | 0 (0.0%) | 4 (100.0%) |
| 18 to 24 Years | 13 (81.2%) | 0 (0.0%) |
| 25 to 34 Years | 0 (0.0%) | 27 (100.0%) |
| 35 to 44 Years | 0 (0.0%) | 0 (0.0%) |
| 45 to 54 Years | 24 (100.0%) | 29 (100.0%) |
| 55 to 64 Years | 30 (88.2%) | 15 (93.8%) |
| 65 to 74 Years | 24 (100.0%) | 16 (84.2%) |
| 75 Years and over | 24 (100.0%) | 15 (88.2%) |
| Total | 128 (94.8%) | 110 (76.9%) |
Income Below Poverty Among Married-Couple Families in Coffee Creek
The poverty statistics for married-couple families in Coffee Creek show that 1.8% or 1 of the total 57 families live below the poverty line. Families with no children have the highest poverty rate of 2.2%, comprising of 1 families. On the other hand, families with 1 or 2 children have the lowest poverty rate of 0.0%, which includes 0 families.
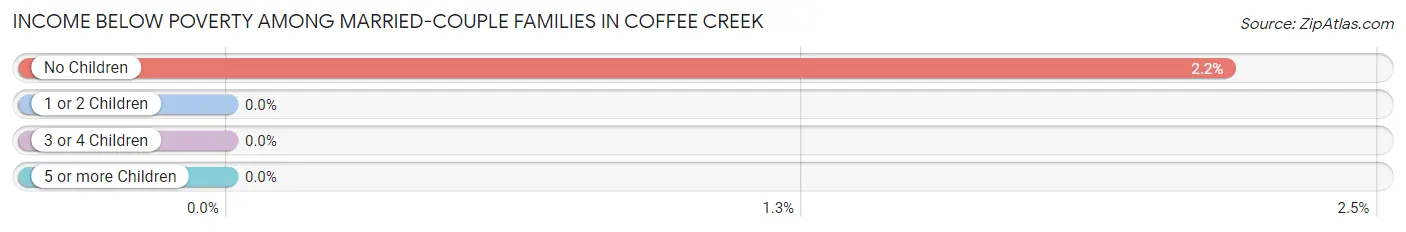
| Children | Above Poverty | Below Poverty |
| No Children | 45 (97.8%) | 1 (2.2%) |
| 1 or 2 Children | 11 (100.0%) | 0 (0.0%) |
| 3 or 4 Children | 0 (0.0%) | 0 (0.0%) |
| 5 or more Children | 0 (0.0%) | 0 (0.0%) |
| Total | 56 (98.3%) | 1 (1.8%) |
Income Below Poverty Among Single-Parent Households in Coffee Creek
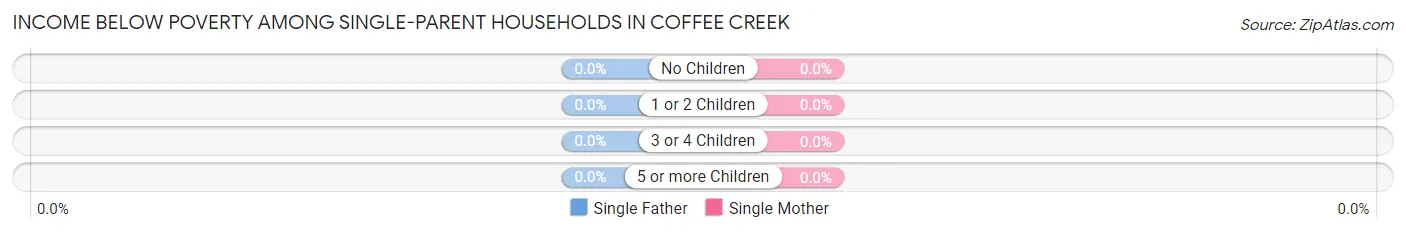
| Children | Single Father | Single Mother |
| No Children | 0 (0.0%) | 0 (0.0%) |
| 1 or 2 Children | 0 (0.0%) | 0 (0.0%) |
| 3 or 4 Children | 0 (0.0%) | 0 (0.0%) |
| 5 or more Children | 0 (0.0%) | 0 (0.0%) |
| Total | 0 (0.0%) | 0 (0.0%) |
Income Below Poverty Among Married-Couple vs Single-Parent Households in Coffee Creek
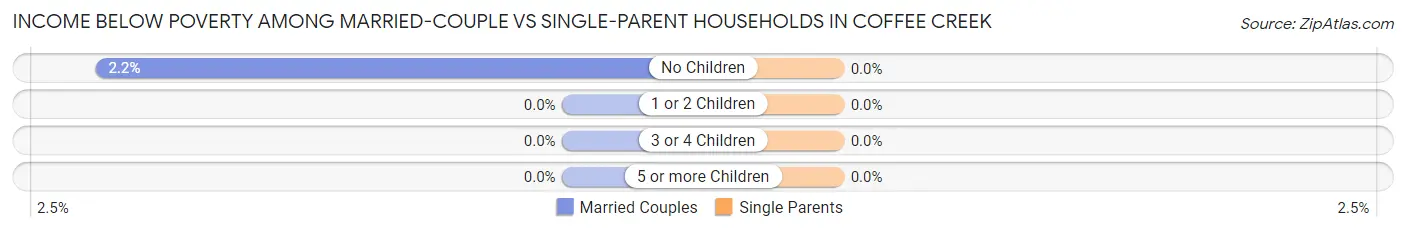
| Children | Married-Couple Families | Single-Parent Households |
| No Children | 1 (2.2%) | 0 (0.0%) |
| 1 or 2 Children | 0 (0.0%) | 0 (0.0%) |
| 3 or 4 Children | 0 (0.0%) | 0 (0.0%) |
| 5 or more Children | 0 (0.0%) | 0 (0.0%) |
| Total | 1 (1.8%) | 0 (0.0%) |
Race in Coffee Creek
The most populous races in Coffee Creek are White / Caucasian (255 | 91.7%), Hispanic or Latino (13 | 4.7%), and Some other Race (13 | 4.7%).
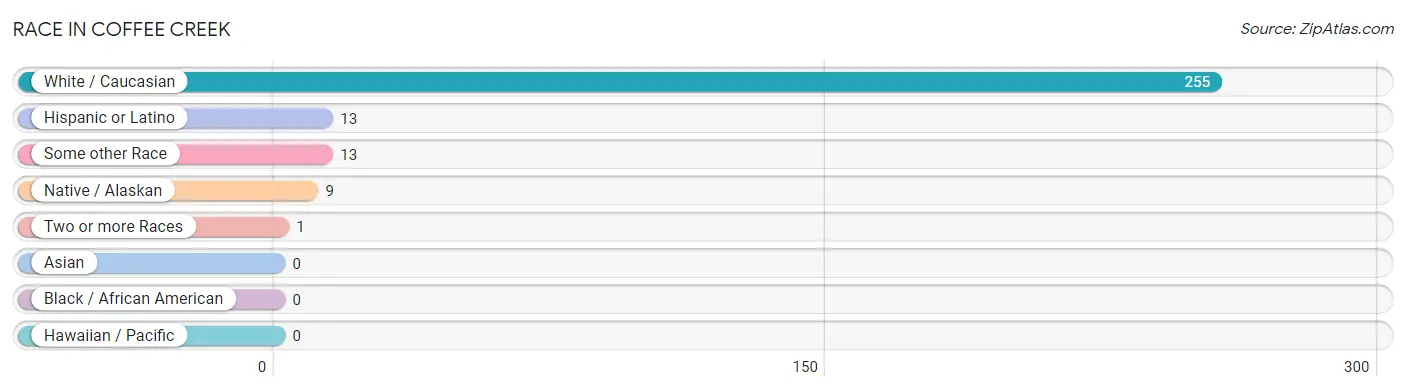
| Race | # Population | % Population |
| Asian | 0 | 0.0% |
| Black / African American | 0 | 0.0% |
| Hawaiian / Pacific | 0 | 0.0% |
| Hispanic or Latino | 13 | 4.7% |
| Native / Alaskan | 9 | 3.2% |
| White / Caucasian | 255 | 91.7% |
| Two or more Races | 1 | 0.4% |
| Some other Race | 13 | 4.7% |
| Total | 278 | 100.0% |
Ancestry in Coffee Creek
The most populous ancestries reported in Coffee Creek are American (50 | 18.0%), German (43 | 15.5%), Irish (38 | 13.7%), English (21 | 7.5%), and Mexican (13 | 4.7%), together accounting for 59.4% of all Coffee Creek residents.
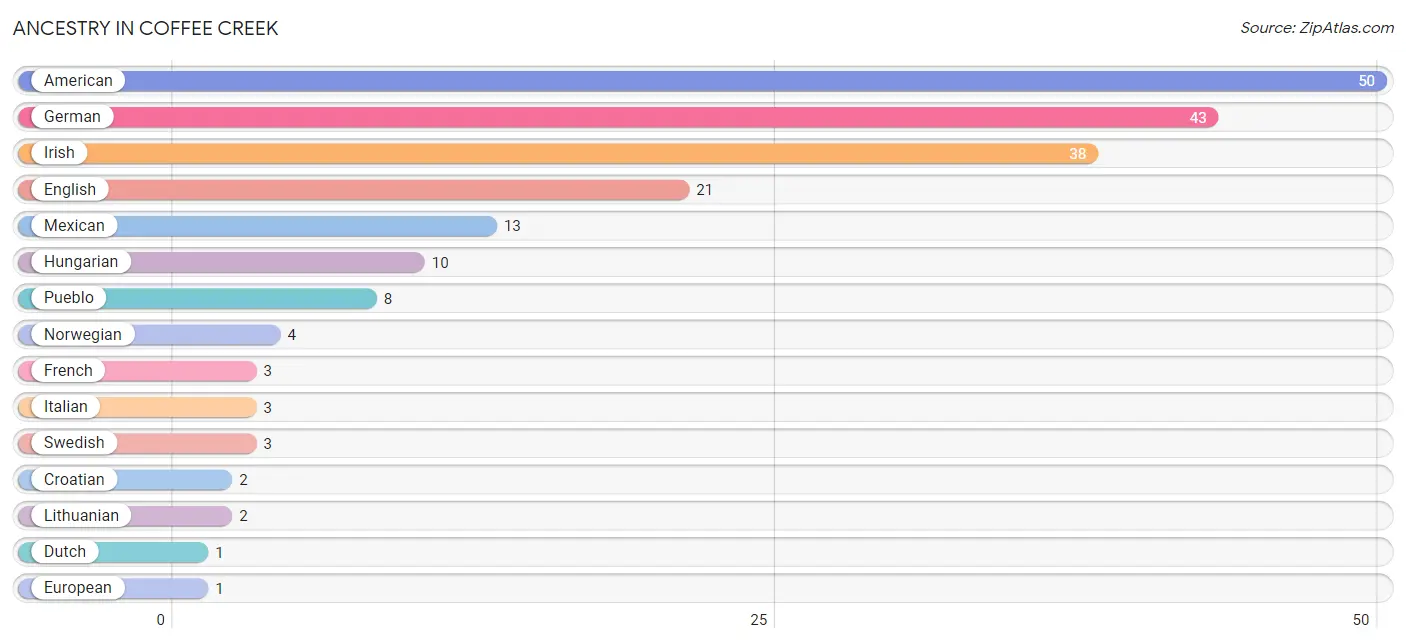
| Ancestry | # Population | % Population |
| American | 50 | 18.0% |
| Croatian | 2 | 0.7% |
| Dutch | 1 | 0.4% |
| English | 21 | 7.5% |
| European | 1 | 0.4% |
| French | 3 | 1.1% |
| German | 43 | 15.5% |
| Hungarian | 10 | 3.6% |
| Irish | 38 | 13.7% |
| Italian | 3 | 1.1% |
| Lithuanian | 2 | 0.7% |
| Mexican | 13 | 4.7% |
| Norwegian | 4 | 1.4% |
| Pueblo | 8 | 2.9% |
| Russian | 1 | 0.4% |
| Scottish | 1 | 0.4% |
| Swedish | 3 | 1.1% | View All 17 Rows |
Immigrants in Coffee Creek
The most numerous immigrant groups reported in Coffee Creek came from Central America (2 | 0.7%), Eastern Europe (2 | 0.7%), Europe (2 | 0.7%), Hungary (2 | 0.7%), and Latin America (2 | 0.7%), together accounting for 3.6% of all Coffee Creek residents.
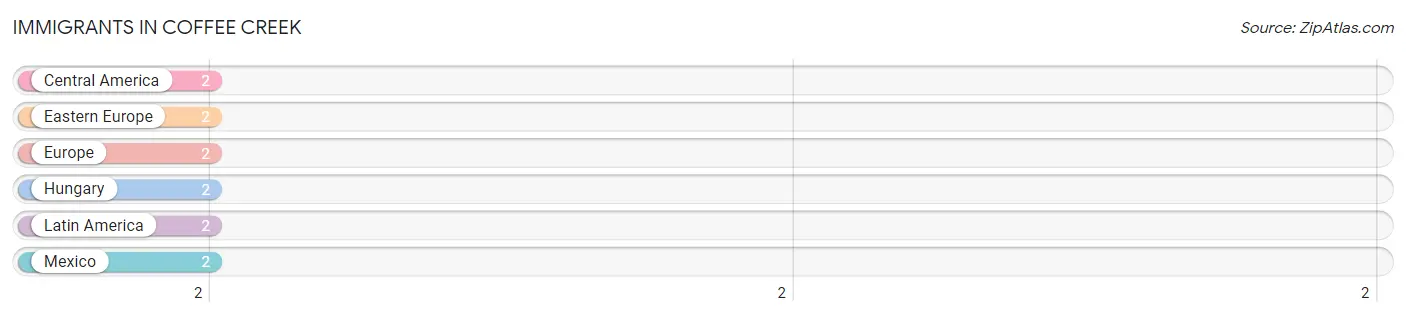
| Immigration Origin | # Population | % Population |
| Central America | 2 | 0.7% |
| Eastern Europe | 2 | 0.7% |
| Europe | 2 | 0.7% |
| Hungary | 2 | 0.7% |
| Latin America | 2 | 0.7% |
| Mexico | 2 | 0.7% | View All 6 Rows |
Sex and Age in Coffee Creek
Sex and Age in Coffee Creek
The most populous age groups in Coffee Creek are 75 to 79 Years (21 | 15.6%) for men and 20 to 24 Years (27 | 18.9%) for women.
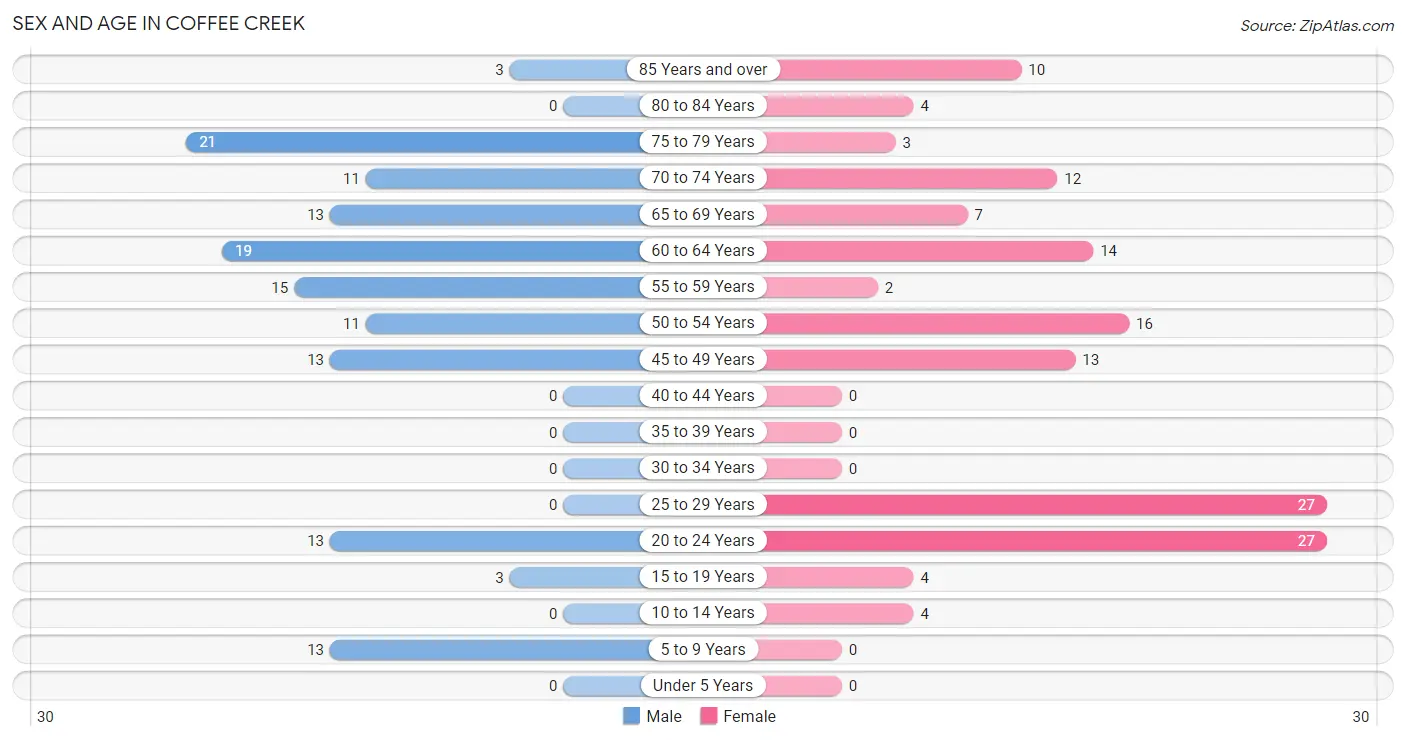
| Age Bracket | Male | Female |
| Under 5 Years | 0 (0.0%) | 0 (0.0%) |
| 5 to 9 Years | 13 (9.6%) | 0 (0.0%) |
| 10 to 14 Years | 0 (0.0%) | 4 (2.8%) |
| 15 to 19 Years | 3 (2.2%) | 4 (2.8%) |
| 20 to 24 Years | 13 (9.6%) | 27 (18.9%) |
| 25 to 29 Years | 0 (0.0%) | 27 (18.9%) |
| 30 to 34 Years | 0 (0.0%) | 0 (0.0%) |
| 35 to 39 Years | 0 (0.0%) | 0 (0.0%) |
| 40 to 44 Years | 0 (0.0%) | 0 (0.0%) |
| 45 to 49 Years | 13 (9.6%) | 13 (9.1%) |
| 50 to 54 Years | 11 (8.2%) | 16 (11.2%) |
| 55 to 59 Years | 15 (11.1%) | 2 (1.4%) |
| 60 to 64 Years | 19 (14.1%) | 14 (9.8%) |
| 65 to 69 Years | 13 (9.6%) | 7 (4.9%) |
| 70 to 74 Years | 11 (8.2%) | 12 (8.4%) |
| 75 to 79 Years | 21 (15.6%) | 3 (2.1%) |
| 80 to 84 Years | 0 (0.0%) | 4 (2.8%) |
| 85 Years and over | 3 (2.2%) | 10 (7.0%) |
| Total | 135 (100.0%) | 143 (100.0%) |
Families and Households in Coffee Creek
Median Family Size in Coffee Creek
The median family size in Coffee Creek is 3.13 persons per family, with single male/father families (6 | 9.0%) accounting for the largest median family size of 5.5 persons per family. On the other hand, married-couple families (57 | 85.1%) represent the smallest median family size with 2.86 persons per family.
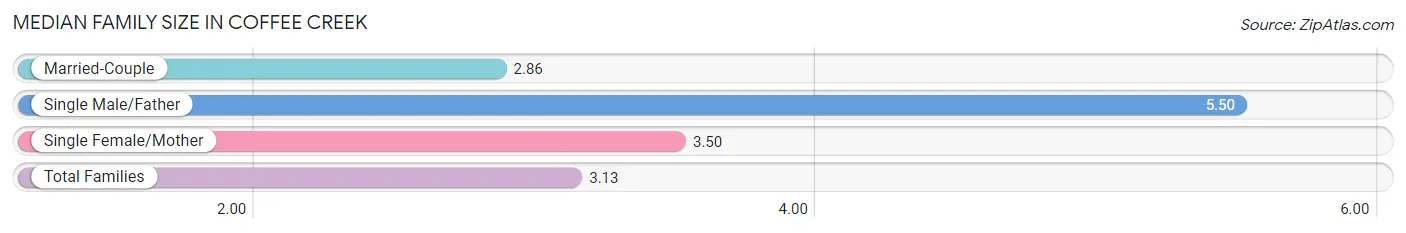
| Family Type | # Families | Family Size |
| Married-Couple | 57 (85.1%) | 2.86 |
| Single Male/Father | 6 (9.0%) | 5.50 |
| Single Female/Mother | 4 (6.0%) | 3.50 |
| Total Families | 67 (100.0%) | 3.13 |
Median Household Size in Coffee Creek
The median household size in Coffee Creek is 2.44 persons per household, with single male/father households (6 | 5.8%) accounting for the largest median household size of 5.67 persons per household. non-family households (36 | 34.9%) represent the smallest median household size with 1.11 persons per household.
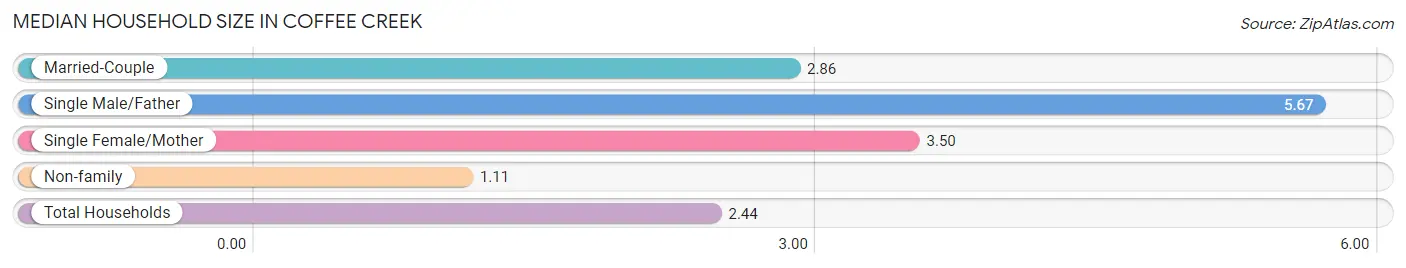
| Household Type | # Households | Household Size |
| Married-Couple | 57 (55.3%) | 2.86 |
| Single Male/Father | 6 (5.8%) | 5.67 |
| Single Female/Mother | 4 (3.9%) | 3.50 |
| Non-family | 36 (34.9%) | 1.11 |
| Total Households | 103 (100.0%) | 2.44 |
Household Size by Marriage Status in Coffee Creek
Out of a total of 103 households in Coffee Creek, 67 (65.0%) are family households, while 36 (34.9%) are nonfamily households. The most numerous type of family households are 2-person households, comprising 50, and the most common type of nonfamily households are 1-person households, comprising 24.
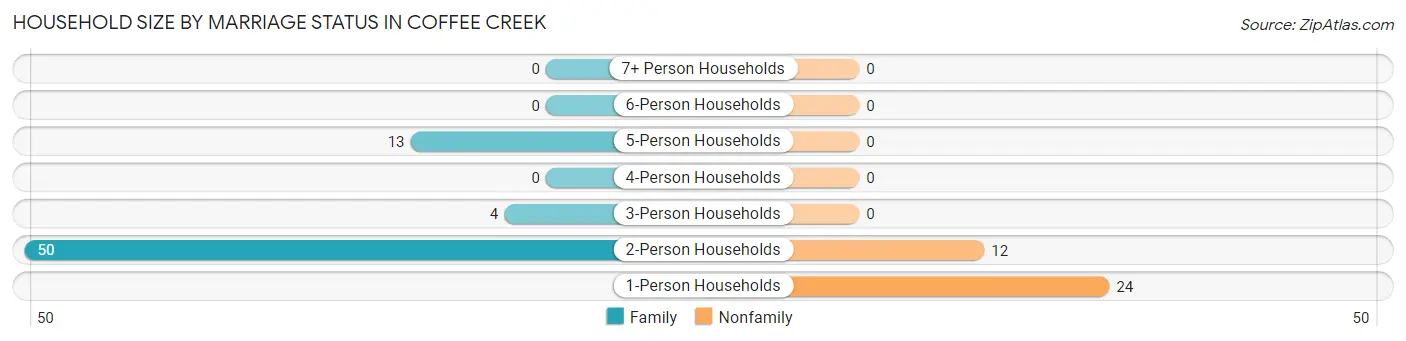
| Household Size | Family Households | Nonfamily Households |
| 1-Person Households | - | 24 (23.3%) |
| 2-Person Households | 50 (48.5%) | 12 (11.7%) |
| 3-Person Households | 4 (3.9%) | 0 (0.0%) |
| 4-Person Households | 0 (0.0%) | 0 (0.0%) |
| 5-Person Households | 13 (12.6%) | 0 (0.0%) |
| 6-Person Households | 0 (0.0%) | 0 (0.0%) |
| 7+ Person Households | 0 (0.0%) | 0 (0.0%) |
| Total | 67 (65.0%) | 36 (34.9%) |
Female Fertility in Coffee Creek
Fertility by Age in Coffee Creek
| Age Bracket | Women with Births | Births / 1,000 Women |
| 15 to 19 years | 0 (0.0%) | 0.0 |
| 20 to 34 years | 0 (0.0%) | 0.0 |
| 35 to 50 years | 0 (0.0%) | 0.0 |
| Total | 0 (0.0%) | 0.0 |
Fertility by Age by Marriage Status in Coffee Creek
| Age Bracket | Married | Unmarried |
| 15 to 19 years | 0 (0.0%) | 0 (0.0%) |
| 20 to 34 years | 0 (0.0%) | 0 (0.0%) |
| 35 to 50 years | 0 (0.0%) | 0 (0.0%) |
| Total | 0 (0.0%) | 0 (0.0%) |
Fertility by Education in Coffee Creek
| Educational Attainment | Women with Births | Births / 1,000 Women |
| Less than High School | 0 (0.0%) | 0.0 |
| High School Diploma | 0 (0.0%) | 0.0 |
| College or Associate's Degree | 0 (0.0%) | 0.0 |
| Bachelor's Degree | 0 (0.0%) | 0.0 |
| Graduate Degree | 0 (0.0%) | 0.0 |
| Total | 0 (0.0%) | 0.0 |
Fertility by Education by Marriage Status in Coffee Creek
| Educational Attainment | Married | Unmarried |
| Less than High School | 0 (0.0%) | 0 (0.0%) |
| High School Diploma | 0 (0.0%) | 0 (0.0%) |
| College or Associate's Degree | 0 (0.0%) | 0 (0.0%) |
| Bachelor's Degree | 0 (0.0%) | 0 (0.0%) |
| Graduate Degree | 0 (0.0%) | 0 (0.0%) |
| Total | 0 (0.0%) | 0 (0.0%) |
Employment Characteristics in Coffee Creek
Employment by Class of Employer in Coffee Creek
Among the 95 employed individuals in Coffee Creek, private company employees (51 | 53.7%), self-employed (not incorporated) (31 | 32.6%), and self-employed (incorporated) (8 | 8.4%) make up the most common classes of employment.
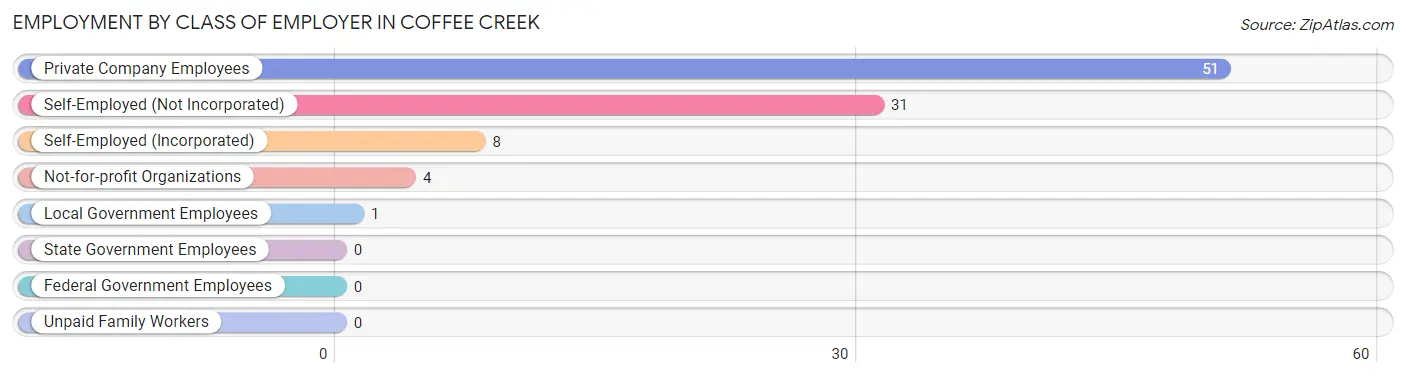
| Employer Class | # Employees | % Employees |
| Private Company Employees | 51 | 53.7% |
| Self-Employed (Incorporated) | 8 | 8.4% |
| Self-Employed (Not Incorporated) | 31 | 32.6% |
| Not-for-profit Organizations | 4 | 4.2% |
| Local Government Employees | 1 | 1.1% |
| State Government Employees | 0 | 0.0% |
| Federal Government Employees | 0 | 0.0% |
| Unpaid Family Workers | 0 | 0.0% |
| Total | 95 | 100.0% |
Employment Status by Age in Coffee Creek
According to the labor force statistics for Coffee Creek, out of the total population over 16 years of age (261), 38.3% or 100 individuals are in the labor force, with 5.0% or 5 of them unemployed. The age group with the highest labor force participation rate is 45 to 54 years, with 96.2% or 51 individuals in the labor force. Within the labor force, the 60 to 64 years age range has the highest percentage of unemployed individuals, with 12.5% or 1 of them being unemployed.
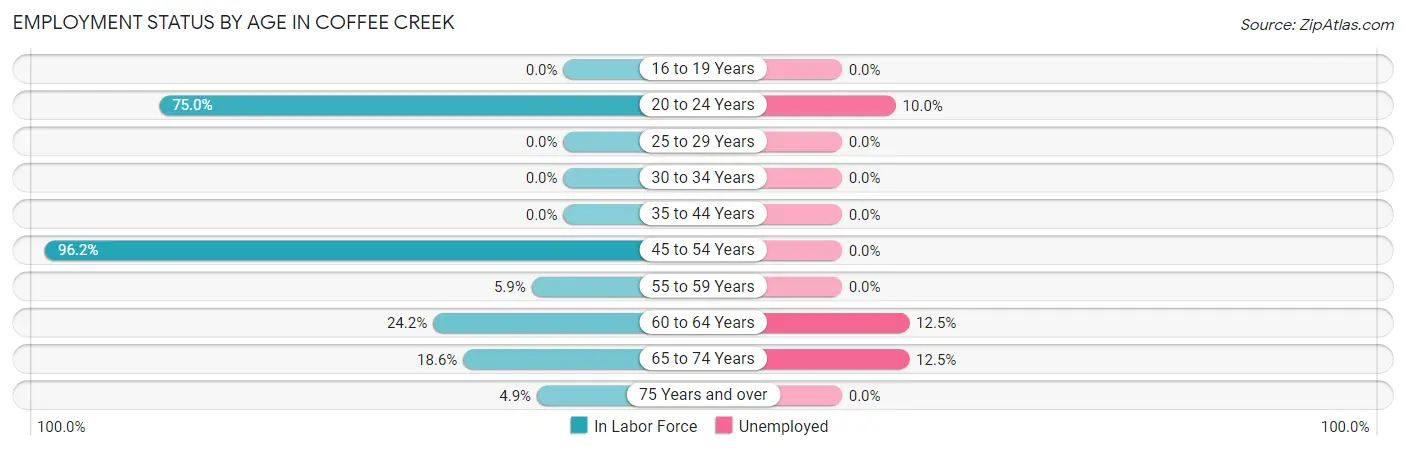
| Age Bracket | In Labor Force | Unemployed |
| 16 to 19 Years | 0 (0.0%) | 0 (0.0%) |
| 20 to 24 Years | 30 (75.0%) | 3 (10.0%) |
| 25 to 29 Years | 0 (0.0%) | 0 (0.0%) |
| 30 to 34 Years | 0 (0.0%) | 0 (0.0%) |
| 35 to 44 Years | 0 (0.0%) | 0 (0.0%) |
| 45 to 54 Years | 51 (96.2%) | 0 (0.0%) |
| 55 to 59 Years | 1 (5.9%) | 0 (0.0%) |
| 60 to 64 Years | 8 (24.2%) | 1 (12.5%) |
| 65 to 74 Years | 8 (18.6%) | 1 (12.5%) |
| 75 Years and over | 2 (4.9%) | 0 (0.0%) |
| Total | 100 (38.3%) | 5 (5.0%) |
Employment Status by Educational Attainment in Coffee Creek
According to labor force statistics for Coffee Creek, 46.2% of individuals (60) out of the total population between 25 and 64 years of age (130) are in the labor force, with 1.7% or 1 of them being unemployed. The group with the highest labor force participation rate are those with the educational attainment of less than high school, with 91.7% or 11 individuals in the labor force. Within the labor force, individuals with college / associate degree education have the highest percentage of unemployment, with 5.0% or 1 of them being unemployed.
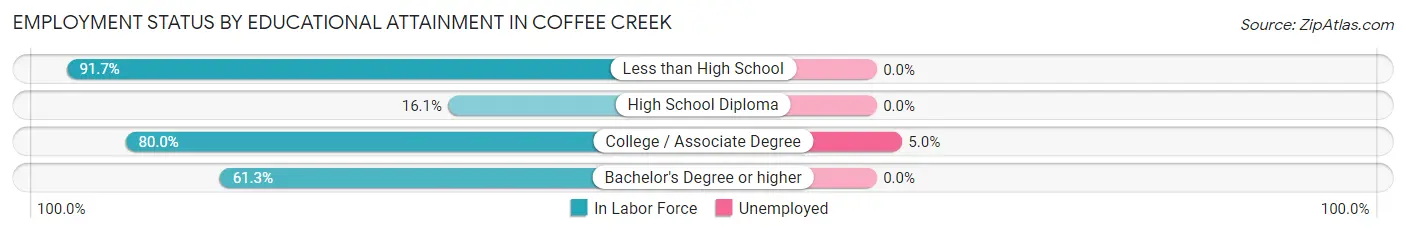
| Educational Attainment | In Labor Force | Unemployed |
| Less than High School | 11 (91.7%) | 0 (0.0%) |
| High School Diploma | 10 (16.1%) | 0 (0.0%) |
| College / Associate Degree | 20 (80.0%) | 1 (5.0%) |
| Bachelor's Degree or higher | 19 (61.3%) | 0 (0.0%) |
| Total | 60 (46.2%) | 2 (1.7%) |
Employment Occupations by Sex in Coffee Creek
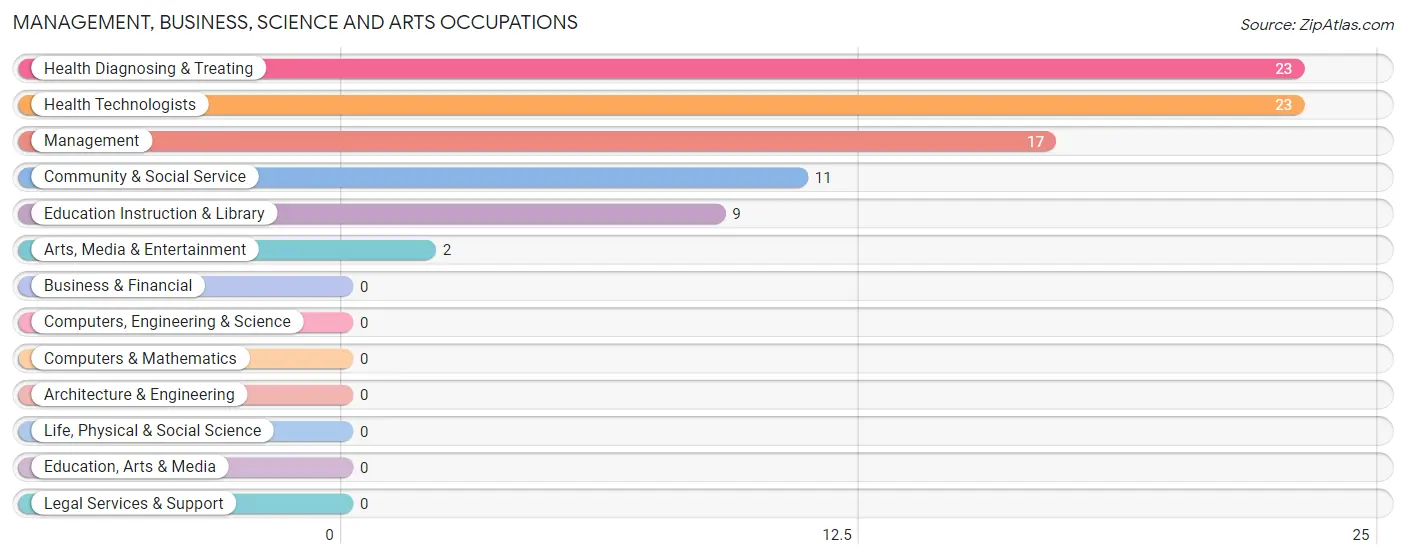
Management, Business, Science and Arts Occupations
The most common Management, Business, Science and Arts occupations in Coffee Creek are Health Diagnosing & Treating (23 | 24.2%), Health Technologists (23 | 24.2%), Management (17 | 17.9%), Community & Social Service (11 | 11.6%), and Education Instruction & Library (9 | 9.5%).
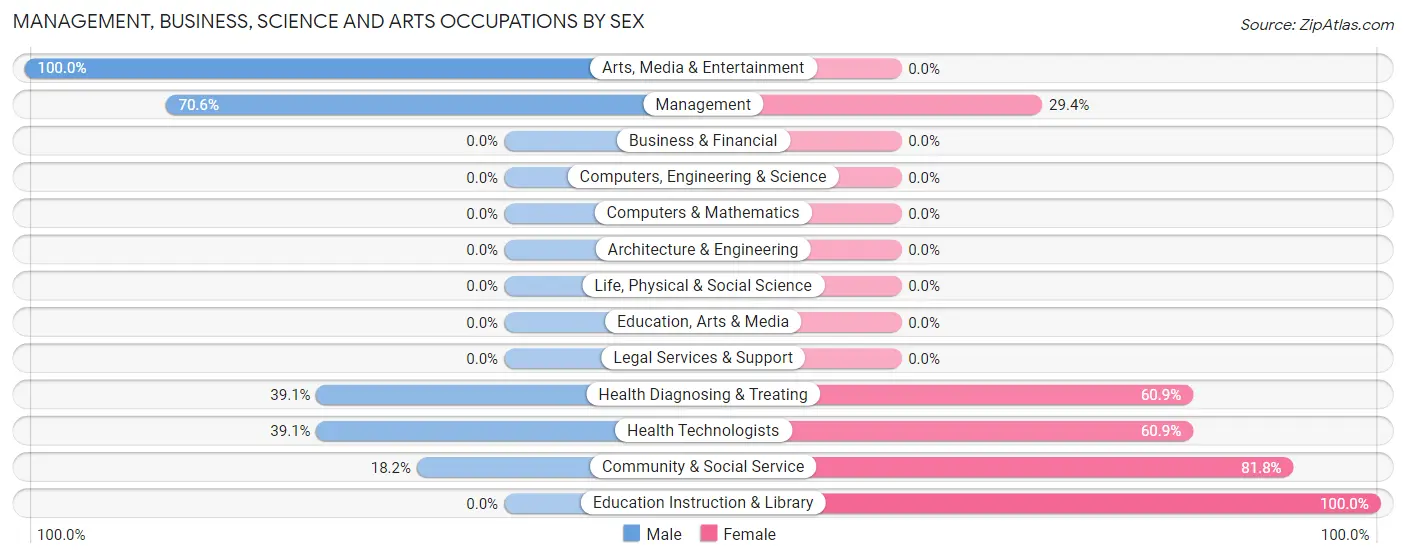
Management, Business, Science and Arts Occupations by Sex
Within the Management, Business, Science and Arts occupations in Coffee Creek, the most male-oriented occupations are Arts, Media & Entertainment (100.0%), Management (70.6%), and Health Diagnosing & Treating (39.1%), while the most female-oriented occupations are Education Instruction & Library (100.0%), Community & Social Service (81.8%), and Health Diagnosing & Treating (60.9%).
| Occupation | Male | Female |
| Management | 12 (70.6%) | 5 (29.4%) |
| Business & Financial | 0 (0.0%) | 0 (0.0%) |
| Computers, Engineering & Science | 0 (0.0%) | 0 (0.0%) |
| Computers & Mathematics | 0 (0.0%) | 0 (0.0%) |
| Architecture & Engineering | 0 (0.0%) | 0 (0.0%) |
| Life, Physical & Social Science | 0 (0.0%) | 0 (0.0%) |
| Community & Social Service | 2 (18.2%) | 9 (81.8%) |
| Education, Arts & Media | 0 (0.0%) | 0 (0.0%) |
| Legal Services & Support | 0 (0.0%) | 0 (0.0%) |
| Education Instruction & Library | 0 (0.0%) | 9 (100.0%) |
| Arts, Media & Entertainment | 2 (100.0%) | 0 (0.0%) |
| Health Diagnosing & Treating | 9 (39.1%) | 14 (60.9%) |
| Health Technologists | 9 (39.1%) | 14 (60.9%) |
| Total (Category) | 23 (45.1%) | 28 (54.9%) |
| Total (Overall) | 36 (37.9%) | 59 (62.1%) |
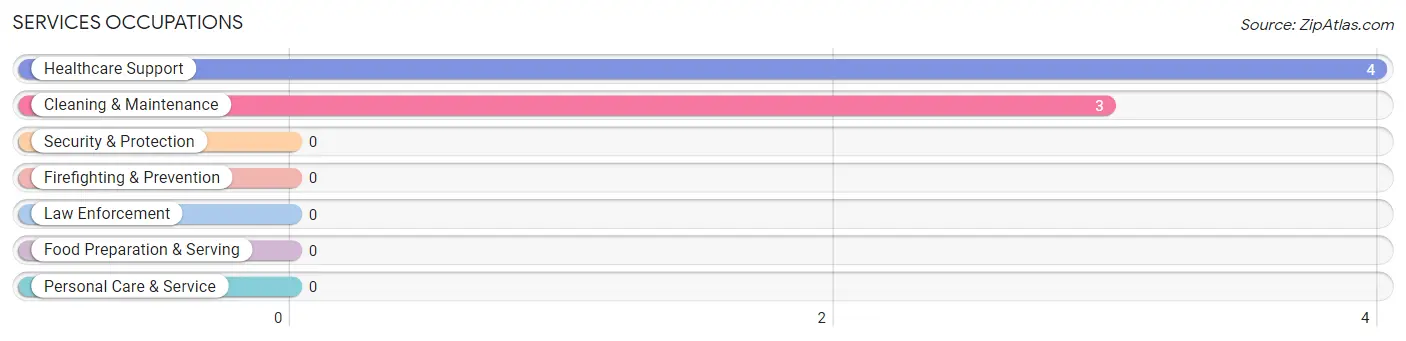
Services Occupations
The most common Services occupations in Coffee Creek are Healthcare Support (4 | 4.2%), and Cleaning & Maintenance (3 | 3.2%).
Services Occupations by Sex
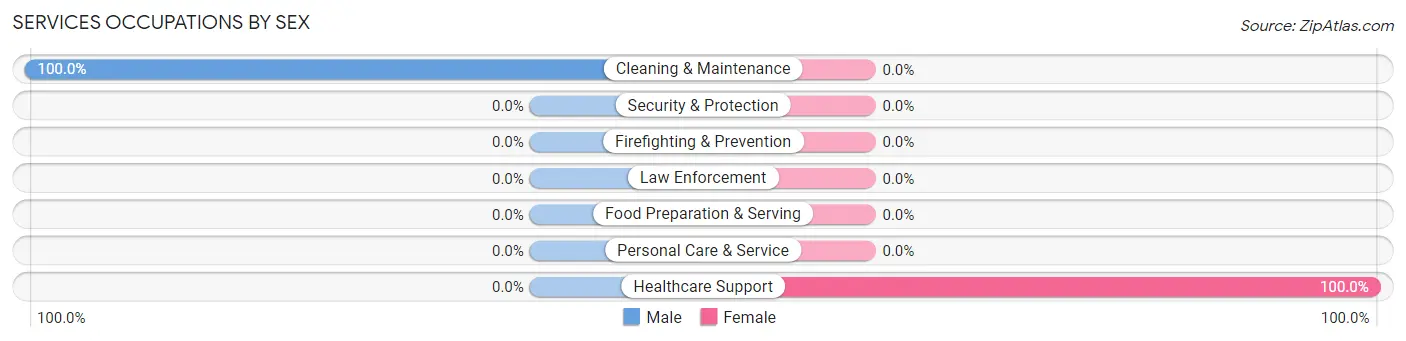
| Occupation | Male | Female |
| Healthcare Support | 0 (0.0%) | 4 (100.0%) |
| Security & Protection | 0 (0.0%) | 0 (0.0%) |
| Firefighting & Prevention | 0 (0.0%) | 0 (0.0%) |
| Law Enforcement | 0 (0.0%) | 0 (0.0%) |
| Food Preparation & Serving | 0 (0.0%) | 0 (0.0%) |
| Cleaning & Maintenance | 3 (100.0%) | 0 (0.0%) |
| Personal Care & Service | 0 (0.0%) | 0 (0.0%) |
| Total (Category) | 3 (42.9%) | 4 (57.1%) |
| Total (Overall) | 36 (37.9%) | 59 (62.1%) |
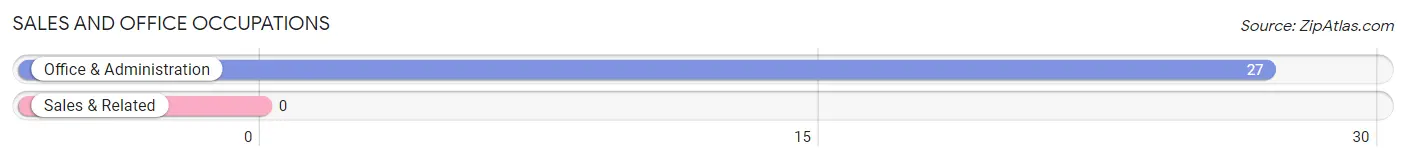
Sales and Office Occupations
The most common Sales and Office occupations in Coffee Creek are , and Office & Administration (27 | 28.4%).
Sales and Office Occupations by Sex
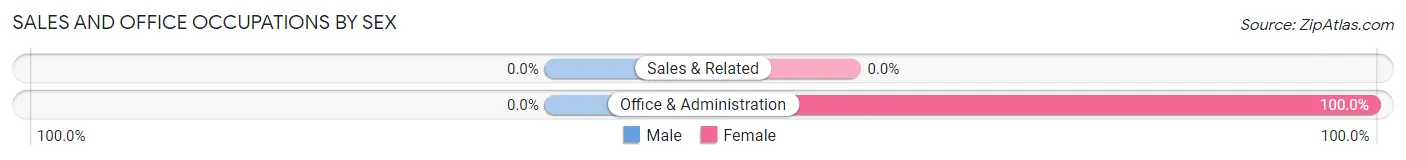
| Occupation | Male | Female |
| Sales & Related | 0 (0.0%) | 0 (0.0%) |
| Office & Administration | 0 (0.0%) | 27 (100.0%) |
| Total (Category) | 0 (0.0%) | 27 (100.0%) |
| Total (Overall) | 36 (37.9%) | 59 (62.1%) |
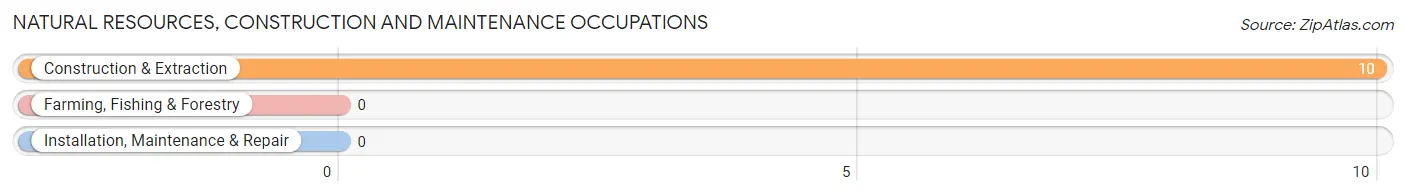
Natural Resources, Construction and Maintenance Occupations
The most common Natural Resources, Construction and Maintenance occupations in Coffee Creek are , and Construction & Extraction (10 | 10.5%).
Natural Resources, Construction and Maintenance Occupations by Sex
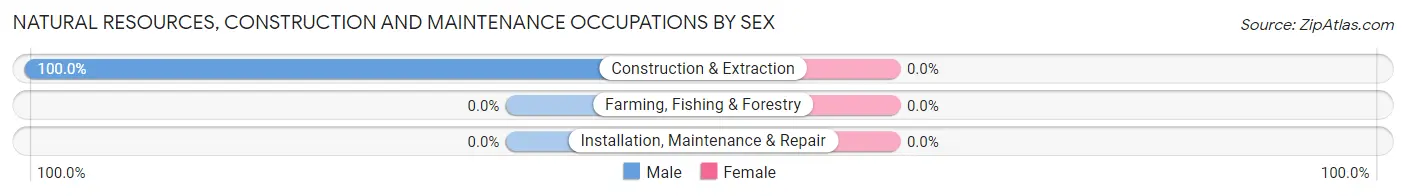
| Occupation | Male | Female |
| Farming, Fishing & Forestry | 0 (0.0%) | 0 (0.0%) |
| Construction & Extraction | 10 (100.0%) | 0 (0.0%) |
| Installation, Maintenance & Repair | 0 (0.0%) | 0 (0.0%) |
| Total (Category) | 10 (100.0%) | 0 (0.0%) |
| Total (Overall) | 36 (37.9%) | 59 (62.1%) |
Production, Transportation and Moving Occupations
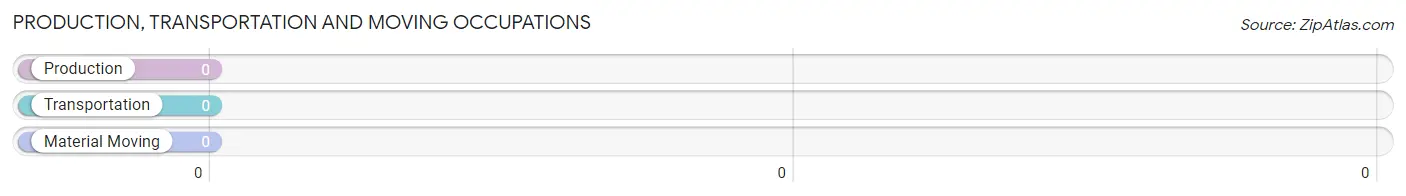
Production, Transportation and Moving Occupations by Sex
| Occupation | Male | Female |
| Production | 0 (0.0%) | 0 (0.0%) |
| Transportation | 0 (0.0%) | 0 (0.0%) |
| Material Moving | 0 (0.0%) | 0 (0.0%) |
| Total (Category) | 0 (0.0%) | 0 (0.0%) |
| Total (Overall) | 36 (37.9%) | 59 (62.1%) |
Employment Industries by Sex in Coffee Creek
Employment Industries in Coffee Creek
The major employment industries in Coffee Creek include Health Care & Social Assistance (27 | 28.4%), Accommodation & Food Services (27 | 28.4%), Construction (21 | 22.1%), Manufacturing (10 | 10.5%), and Administrative & Support (9 | 9.5%).
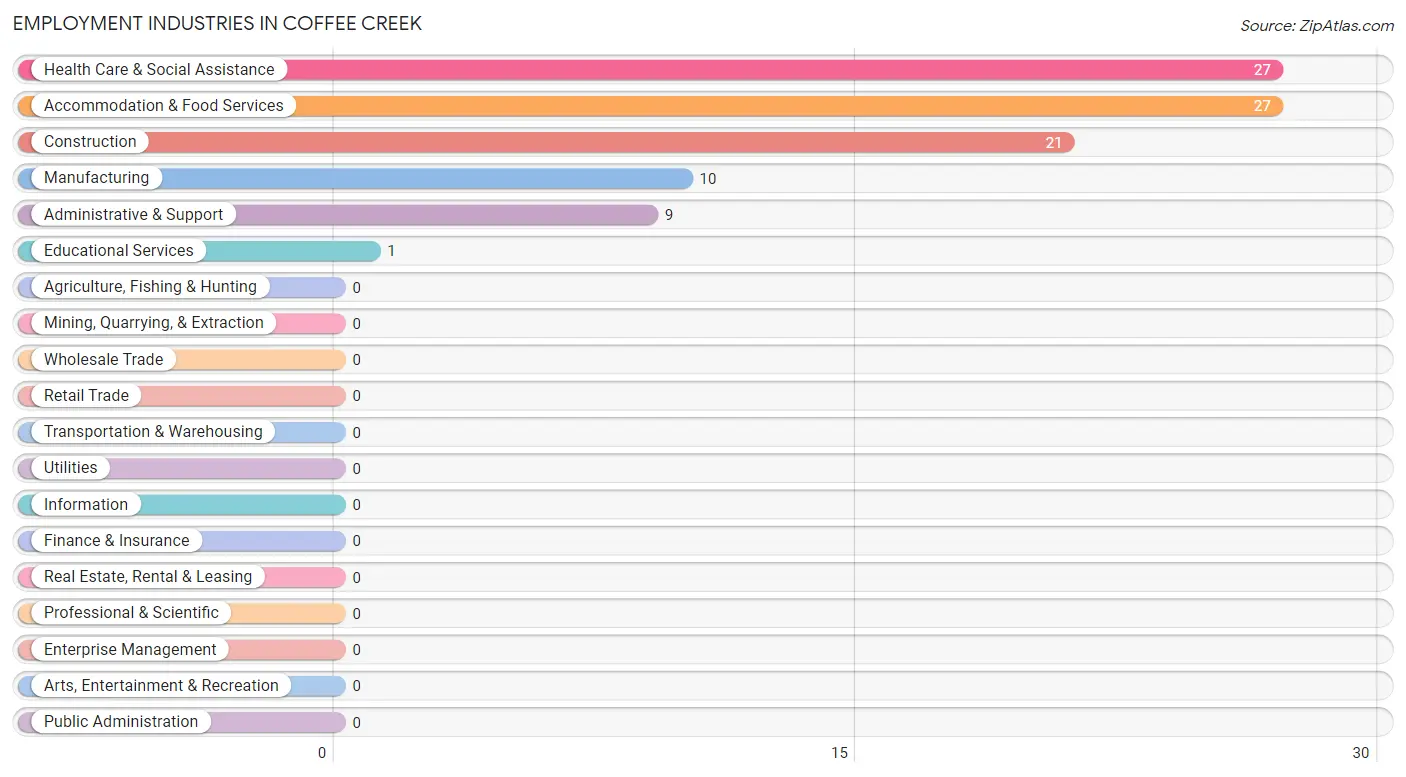
Employment Industries by Sex in Coffee Creek
The Coffee Creek industries that see more men than women are Construction (100.0%), Administrative & Support (44.4%), and Health Care & Social Assistance (33.3%), whereas the industries that tend to have a higher number of women are Educational Services (100.0%), Accommodation & Food Services (100.0%), and Manufacturing (80.0%).
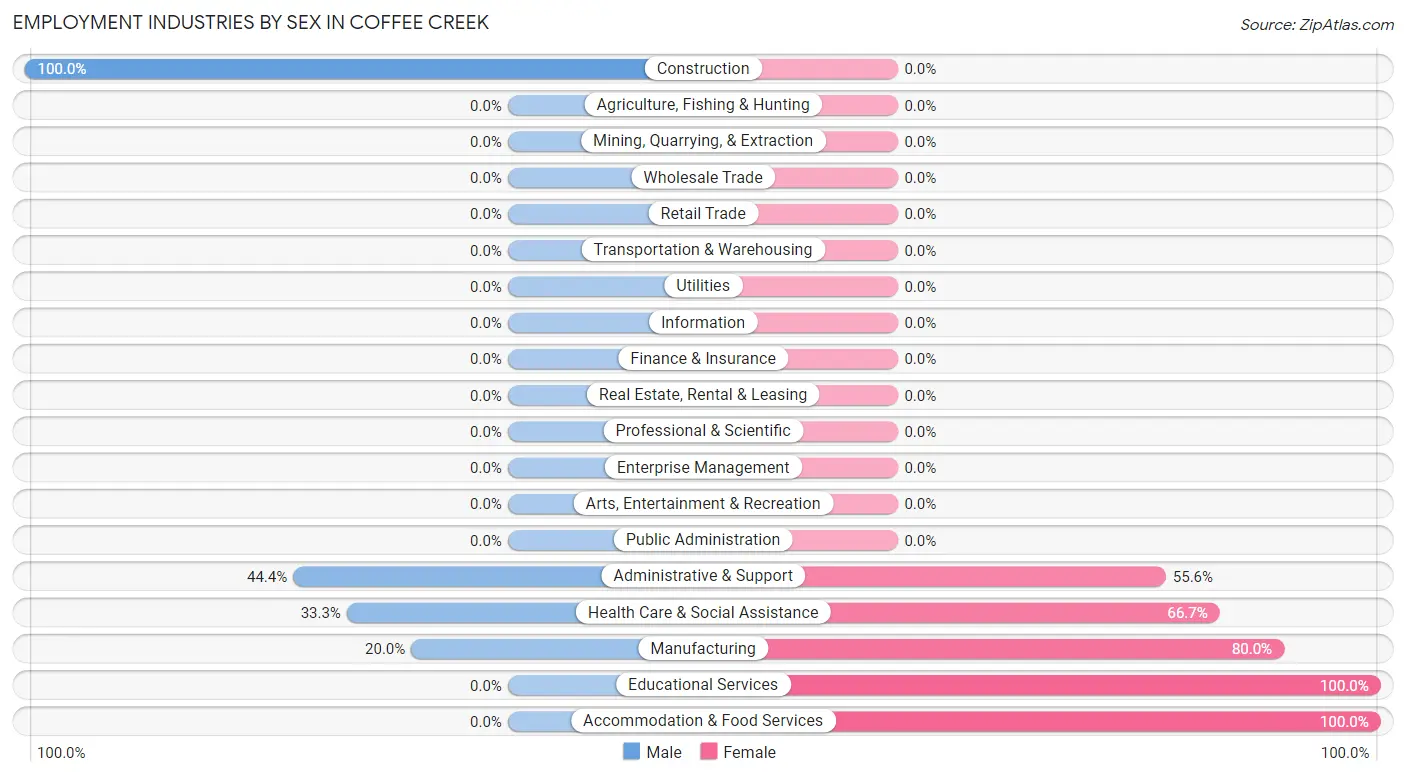
| Industry | Male | Female |
| Agriculture, Fishing & Hunting | 0 (0.0%) | 0 (0.0%) |
| Mining, Quarrying, & Extraction | 0 (0.0%) | 0 (0.0%) |
| Construction | 21 (100.0%) | 0 (0.0%) |
| Manufacturing | 2 (20.0%) | 8 (80.0%) |
| Wholesale Trade | 0 (0.0%) | 0 (0.0%) |
| Retail Trade | 0 (0.0%) | 0 (0.0%) |
| Transportation & Warehousing | 0 (0.0%) | 0 (0.0%) |
| Utilities | 0 (0.0%) | 0 (0.0%) |
| Information | 0 (0.0%) | 0 (0.0%) |
| Finance & Insurance | 0 (0.0%) | 0 (0.0%) |
| Real Estate, Rental & Leasing | 0 (0.0%) | 0 (0.0%) |
| Professional & Scientific | 0 (0.0%) | 0 (0.0%) |
| Enterprise Management | 0 (0.0%) | 0 (0.0%) |
| Administrative & Support | 4 (44.4%) | 5 (55.6%) |
| Educational Services | 0 (0.0%) | 1 (100.0%) |
| Health Care & Social Assistance | 9 (33.3%) | 18 (66.7%) |
| Arts, Entertainment & Recreation | 0 (0.0%) | 0 (0.0%) |
| Accommodation & Food Services | 0 (0.0%) | 27 (100.0%) |
| Public Administration | 0 (0.0%) | 0 (0.0%) |
| Total | 36 (37.9%) | 59 (62.1%) |
Education in Coffee Creek
School Enrollment in Coffee Creek
The most common levels of schooling among the 52 students in Coffee Creek are college / undergraduate (30 | 57.7%), elementary school (13 | 25.0%), and high school (7 | 13.5%).
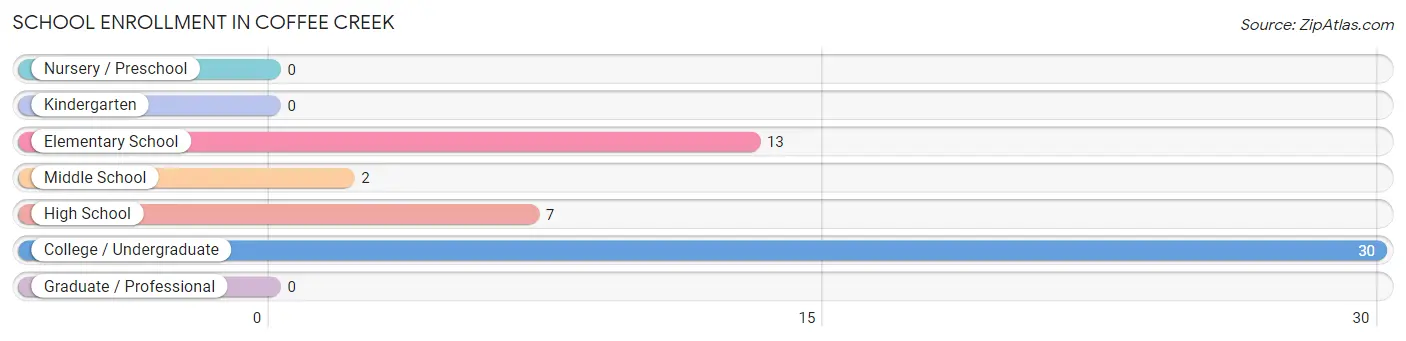
| School Level | # Students | % Students |
| Nursery / Preschool | 0 | 0.0% |
| Kindergarten | 0 | 0.0% |
| Elementary School | 13 | 25.0% |
| Middle School | 2 | 3.8% |
| High School | 7 | 13.5% |
| College / Undergraduate | 30 | 57.7% |
| Graduate / Professional | 0 | 0.0% |
| Total | 52 | 100.0% |
School Enrollment by Age by Funding Source in Coffee Creek
Out of a total of 52 students who are enrolled in schools in Coffee Creek, 28 (53.8%) attend a private institution, while the remaining 24 (46.2%) are enrolled in public schools. The age group of 35 years and over has the highest likelihood of being enrolled in private schools, with 1 (100.0% in the age bracket) enrolled. Conversely, the age group of 5 to 9 year old has the lowest likelihood of being enrolled in a private school, with 13 (100.0% in the age bracket) attending a public institution.
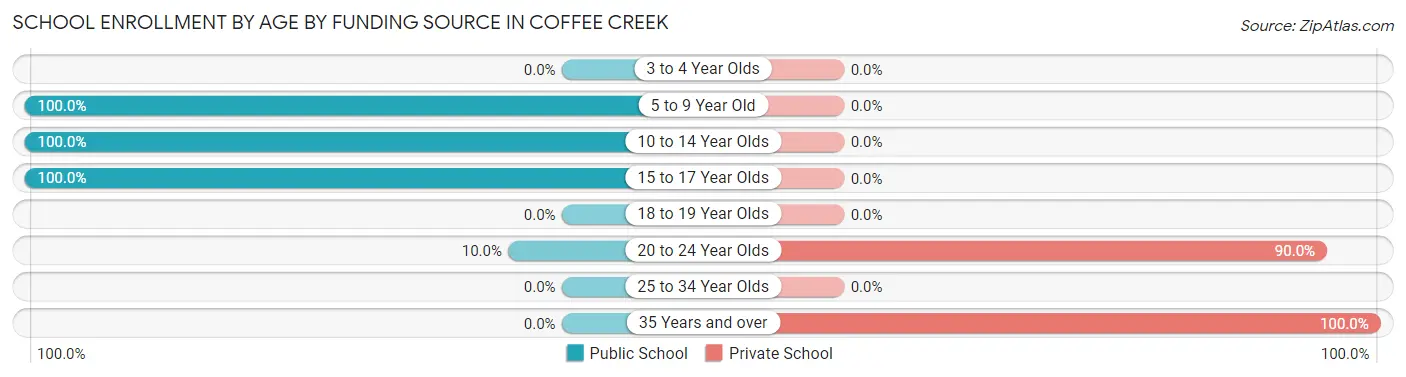
| Age Bracket | Public School | Private School |
| 3 to 4 Year Olds | 0 (0.0%) | 0 (0.0%) |
| 5 to 9 Year Old | 13 (100.0%) | 0 (0.0%) |
| 10 to 14 Year Olds | 4 (100.0%) | 0 (0.0%) |
| 15 to 17 Year Olds | 4 (100.0%) | 0 (0.0%) |
| 18 to 19 Year Olds | 0 (0.0%) | 0 (0.0%) |
| 20 to 24 Year Olds | 3 (10.0%) | 27 (90.0%) |
| 25 to 34 Year Olds | 0 (0.0%) | 0 (0.0%) |
| 35 Years and over | 0 (0.0%) | 1 (100.0%) |
| Total | 24 (46.2%) | 28 (53.8%) |
Educational Attainment by Field of Study in Coffee Creek
Social sciences (13 | 21.0%), science & technology (13 | 21.0%), bio, nature & agricultural (9 | 14.5%), psychology (7 | 11.3%), and business (5 | 8.1%) are the most common fields of study among 62 individuals in Coffee Creek who have obtained a bachelor's degree or higher.
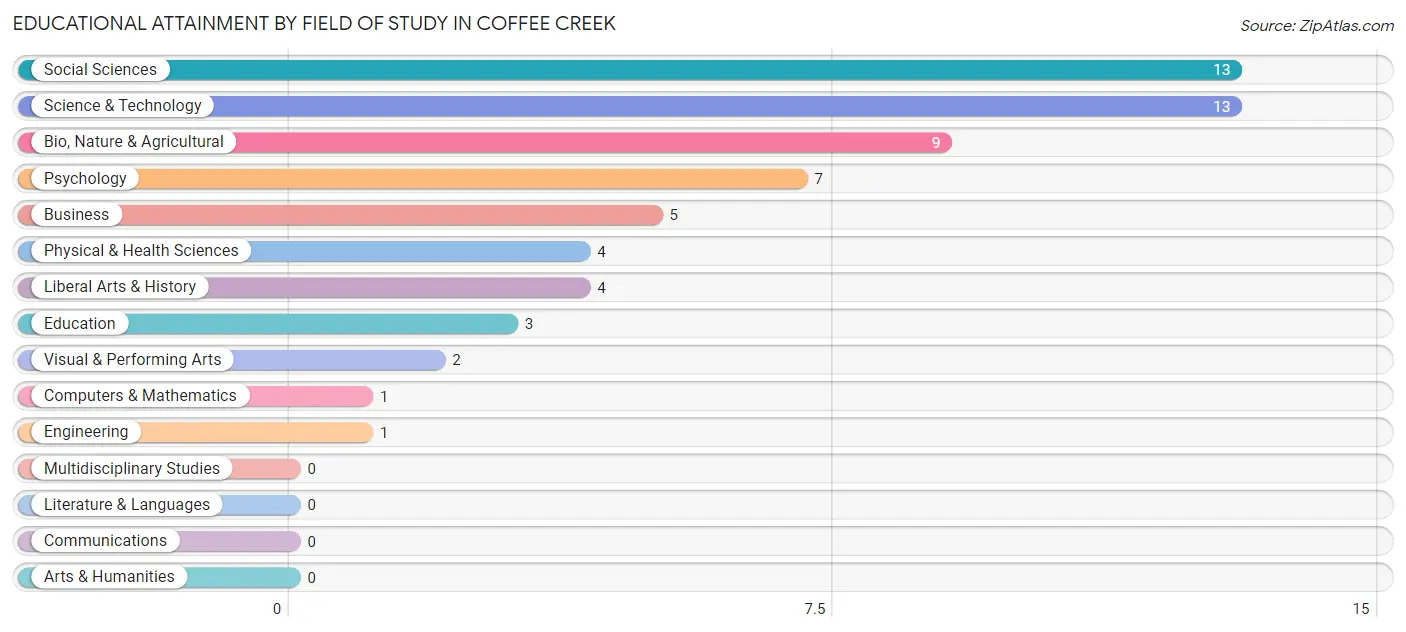
| Field of Study | # Graduates | % Graduates |
| Computers & Mathematics | 1 | 1.6% |
| Bio, Nature & Agricultural | 9 | 14.5% |
| Physical & Health Sciences | 4 | 6.5% |
| Psychology | 7 | 11.3% |
| Social Sciences | 13 | 21.0% |
| Engineering | 1 | 1.6% |
| Multidisciplinary Studies | 0 | 0.0% |
| Science & Technology | 13 | 21.0% |
| Business | 5 | 8.1% |
| Education | 3 | 4.8% |
| Literature & Languages | 0 | 0.0% |
| Liberal Arts & History | 4 | 6.5% |
| Visual & Performing Arts | 2 | 3.2% |
| Communications | 0 | 0.0% |
| Arts & Humanities | 0 | 0.0% |
| Total | 62 | 100.0% |
Transportation & Commute in Coffee Creek
Vehicle Availability by Sex in Coffee Creek
The most prevalent vehicle ownership categories in Coffee Creek are males with 2 vehicles (14, accounting for 38.9%) and females with 2 vehicles (23, making up 43.8%).
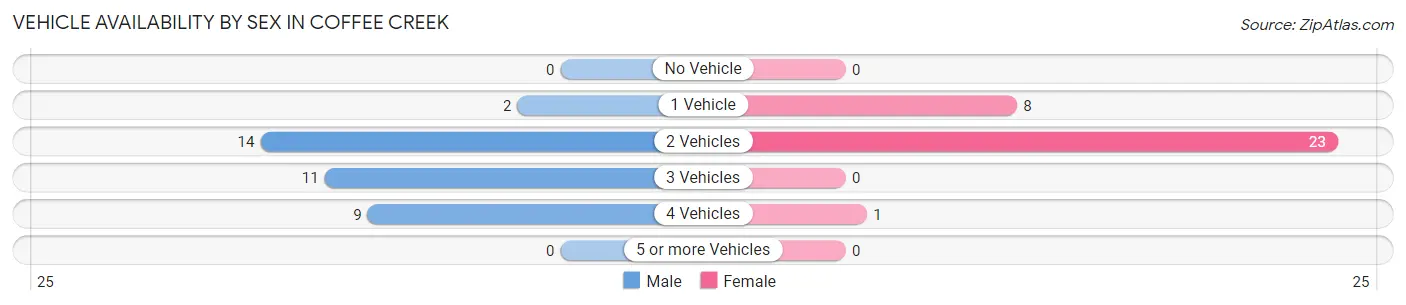
| Vehicles Available | Male | Female |
| No Vehicle | 0 (0.0%) | 0 (0.0%) |
| 1 Vehicle | 2 (5.6%) | 8 (25.0%) |
| 2 Vehicles | 14 (38.9%) | 23 (71.9%) |
| 3 Vehicles | 11 (30.6%) | 0 (0.0%) |
| 4 Vehicles | 9 (25.0%) | 1 (3.1%) |
| 5 or more Vehicles | 0 (0.0%) | 0 (0.0%) |
| Total | 36 (100.0%) | 32 (100.0%) |
Commute Time in Coffee Creek
The most frequently occuring commute durations in Coffee Creek are 45 to 59 minutes (27 commuters, 36.0%), 30 to 34 minutes (19 commuters, 25.3%), and 10 to 14 minutes (15 commuters, 20.0%).
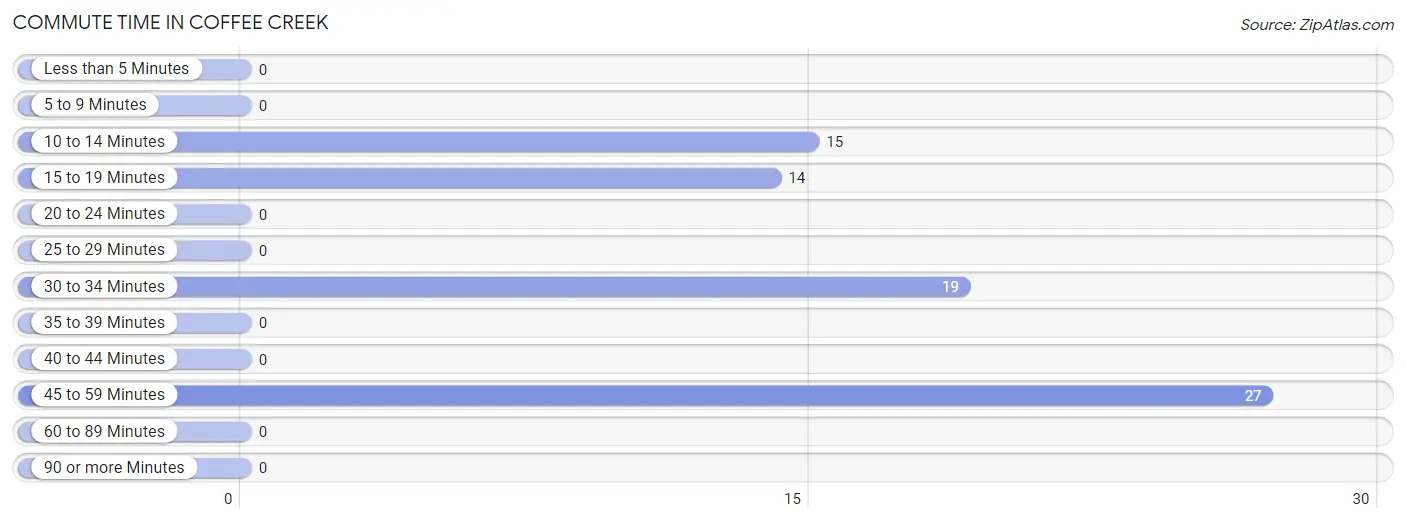
| Commute Time | # Commuters | % Commuters |
| Less than 5 Minutes | 0 | 0.0% |
| 5 to 9 Minutes | 0 | 0.0% |
| 10 to 14 Minutes | 15 | 20.0% |
| 15 to 19 Minutes | 14 | 18.7% |
| 20 to 24 Minutes | 0 | 0.0% |
| 25 to 29 Minutes | 0 | 0.0% |
| 30 to 34 Minutes | 19 | 25.3% |
| 35 to 39 Minutes | 0 | 0.0% |
| 40 to 44 Minutes | 0 | 0.0% |
| 45 to 59 Minutes | 27 | 36.0% |
| 60 to 89 Minutes | 0 | 0.0% |
| 90 or more Minutes | 0 | 0.0% |
Commute Time by Sex in Coffee Creek
The most common commute times in Coffee Creek are 30 to 34 minutes (19 commuters, 57.6%) for males and 45 to 59 minutes (27 commuters, 64.3%) for females.
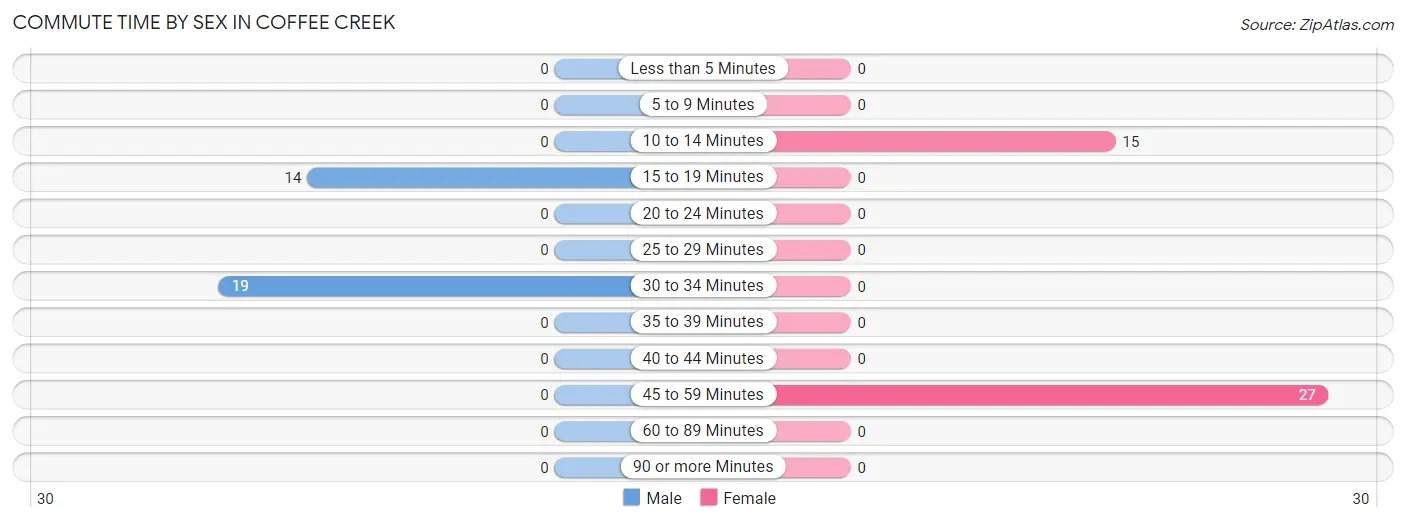
| Commute Time | Male | Female |
| Less than 5 Minutes | 0 (0.0%) | 0 (0.0%) |
| 5 to 9 Minutes | 0 (0.0%) | 0 (0.0%) |
| 10 to 14 Minutes | 0 (0.0%) | 15 (35.7%) |
| 15 to 19 Minutes | 14 (42.4%) | 0 (0.0%) |
| 20 to 24 Minutes | 0 (0.0%) | 0 (0.0%) |
| 25 to 29 Minutes | 0 (0.0%) | 0 (0.0%) |
| 30 to 34 Minutes | 19 (57.6%) | 0 (0.0%) |
| 35 to 39 Minutes | 0 (0.0%) | 0 (0.0%) |
| 40 to 44 Minutes | 0 (0.0%) | 0 (0.0%) |
| 45 to 59 Minutes | 0 (0.0%) | 27 (64.3%) |
| 60 to 89 Minutes | 0 (0.0%) | 0 (0.0%) |
| 90 or more Minutes | 0 (0.0%) | 0 (0.0%) |
Time of Departure to Work by Sex in Coffee Creek
The most frequent times of departure to work in Coffee Creek are 6:30 AM to 6:59 AM (21, 63.6%) for males and 6:30 AM to 6:59 AM (27, 64.3%) for females.
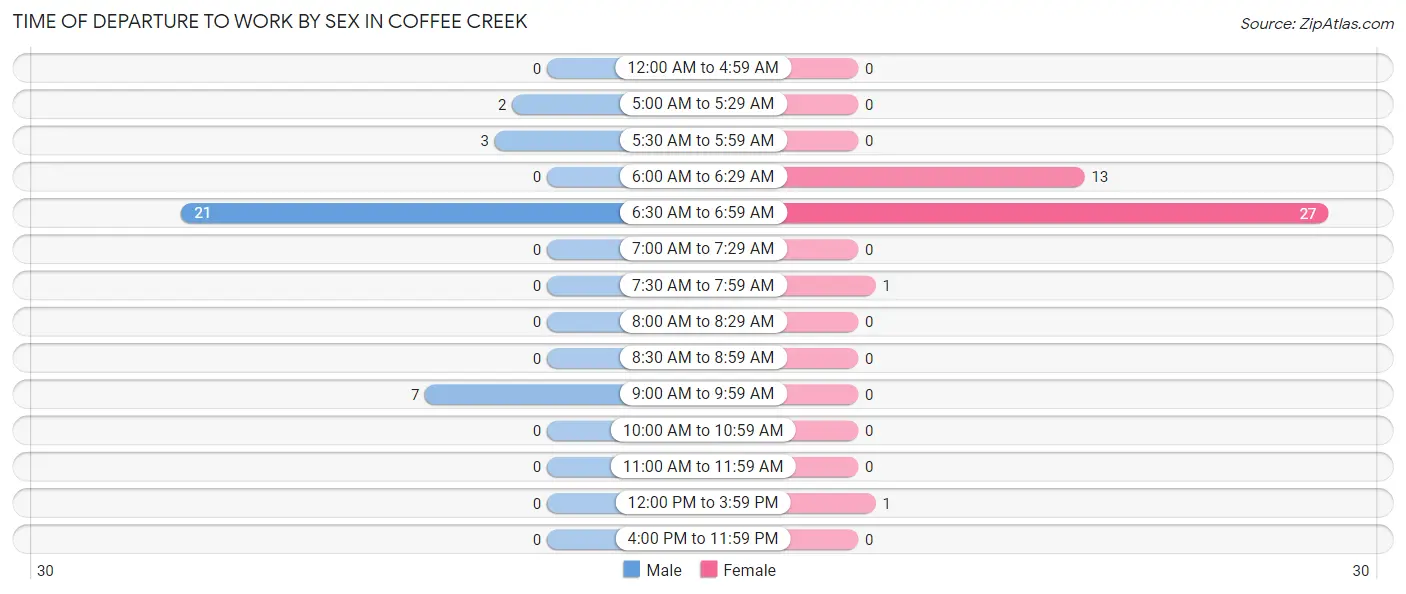
| Time of Departure | Male | Female |
| 12:00 AM to 4:59 AM | 0 (0.0%) | 0 (0.0%) |
| 5:00 AM to 5:29 AM | 2 (6.1%) | 0 (0.0%) |
| 5:30 AM to 5:59 AM | 3 (9.1%) | 0 (0.0%) |
| 6:00 AM to 6:29 AM | 0 (0.0%) | 13 (30.9%) |
| 6:30 AM to 6:59 AM | 21 (63.6%) | 27 (64.3%) |
| 7:00 AM to 7:29 AM | 0 (0.0%) | 0 (0.0%) |
| 7:30 AM to 7:59 AM | 0 (0.0%) | 1 (2.4%) |
| 8:00 AM to 8:29 AM | 0 (0.0%) | 0 (0.0%) |
| 8:30 AM to 8:59 AM | 0 (0.0%) | 0 (0.0%) |
| 9:00 AM to 9:59 AM | 7 (21.2%) | 0 (0.0%) |
| 10:00 AM to 10:59 AM | 0 (0.0%) | 0 (0.0%) |
| 11:00 AM to 11:59 AM | 0 (0.0%) | 0 (0.0%) |
| 12:00 PM to 3:59 PM | 0 (0.0%) | 1 (2.4%) |
| 4:00 PM to 11:59 PM | 0 (0.0%) | 0 (0.0%) |
| Total | 33 (100.0%) | 42 (100.0%) |
Housing Occupancy in Coffee Creek
Occupancy by Ownership in Coffee Creek
Of the total 103 dwellings in Coffee Creek, owner-occupied units account for 89 (86.4%), while renter-occupied units make up 14 (13.6%).
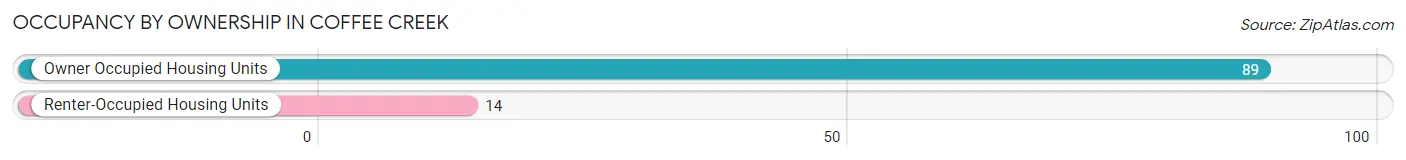
| Occupancy | # Housing Units | % Housing Units |
| Owner Occupied Housing Units | 89 | 86.4% |
| Renter-Occupied Housing Units | 14 | 13.6% |
| Total Occupied Housing Units | 103 | 100.0% |
Occupancy by Household Size in Coffee Creek
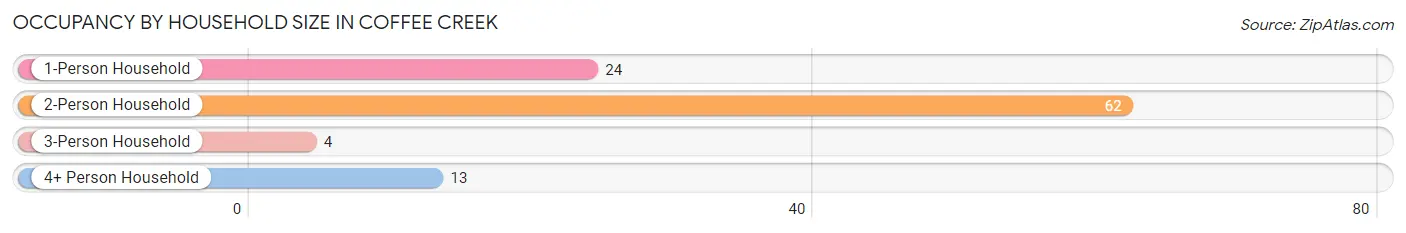
| Household Size | # Housing Units | % Housing Units |
| 1-Person Household | 24 | 23.3% |
| 2-Person Household | 62 | 60.2% |
| 3-Person Household | 4 | 3.9% |
| 4+ Person Household | 13 | 12.6% |
| Total Housing Units | 103 | 100.0% |
Occupancy by Ownership by Household Size in Coffee Creek
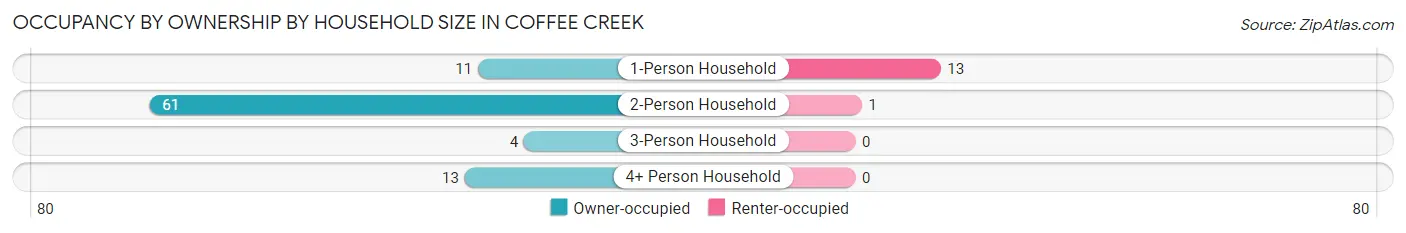
| Household Size | Owner-occupied | Renter-occupied |
| 1-Person Household | 11 (45.8%) | 13 (54.2%) |
| 2-Person Household | 61 (98.4%) | 1 (1.6%) |
| 3-Person Household | 4 (100.0%) | 0 (0.0%) |
| 4+ Person Household | 13 (100.0%) | 0 (0.0%) |
| Total Housing Units | 89 (86.4%) | 14 (13.6%) |
Occupancy by Educational Attainment in Coffee Creek
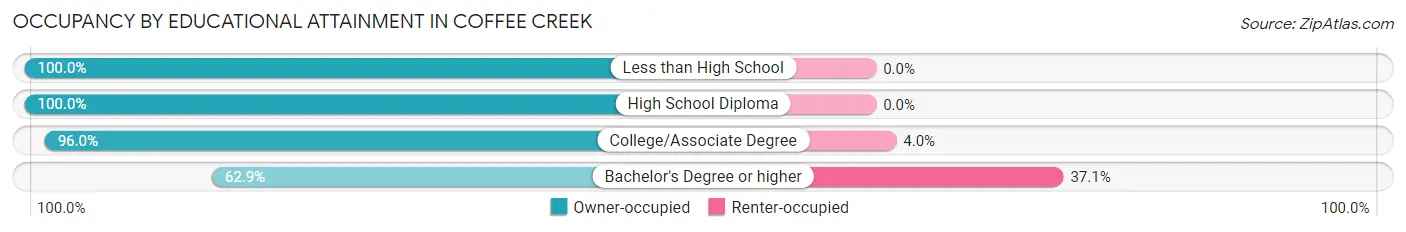
| Household Size | Owner-occupied | Renter-occupied |
| Less than High School | 11 (100.0%) | 0 (0.0%) |
| High School Diploma | 32 (100.0%) | 0 (0.0%) |
| College/Associate Degree | 24 (96.0%) | 1 (4.0%) |
| Bachelor's Degree or higher | 22 (62.9%) | 13 (37.1%) |
Occupancy by Age of Householder in Coffee Creek
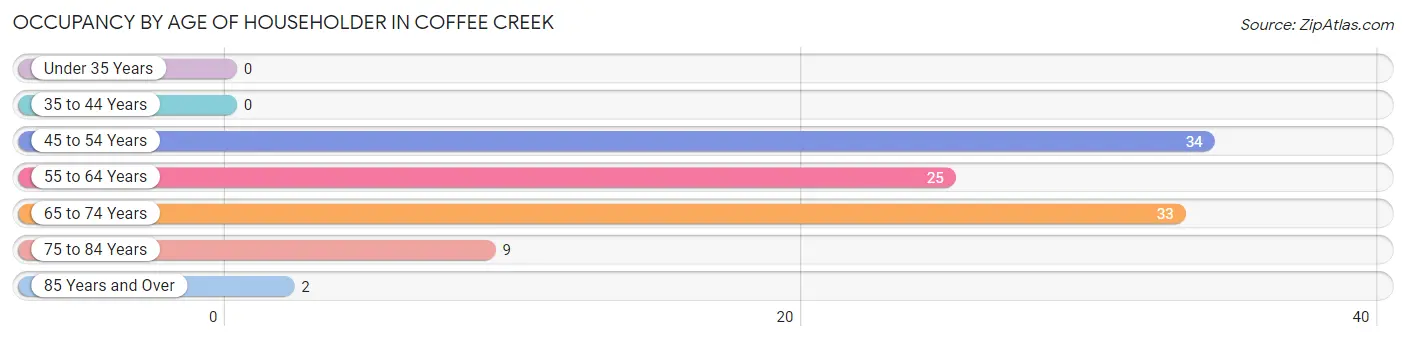
| Age Bracket | # Households | % Households |
| Under 35 Years | 0 | 0.0% |
| 35 to 44 Years | 0 | 0.0% |
| 45 to 54 Years | 34 | 33.0% |
| 55 to 64 Years | 25 | 24.3% |
| 65 to 74 Years | 33 | 32.0% |
| 75 to 84 Years | 9 | 8.7% |
| 85 Years and Over | 2 | 1.9% |
| Total | 103 | 100.0% |
Housing Finances in Coffee Creek
Median Income by Occupancy in Coffee Creek
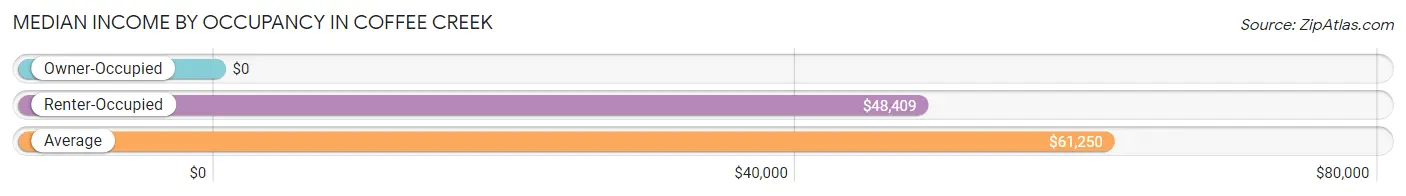
| Occupancy Type | # Households | Median Income |
| Owner-Occupied | 89 (86.4%) | $0 |
| Renter-Occupied | 14 (13.6%) | $48,409 |
| Average | 103 (100.0%) | $61,250 |
Occupancy by Householder Income Bracket in Coffee Creek
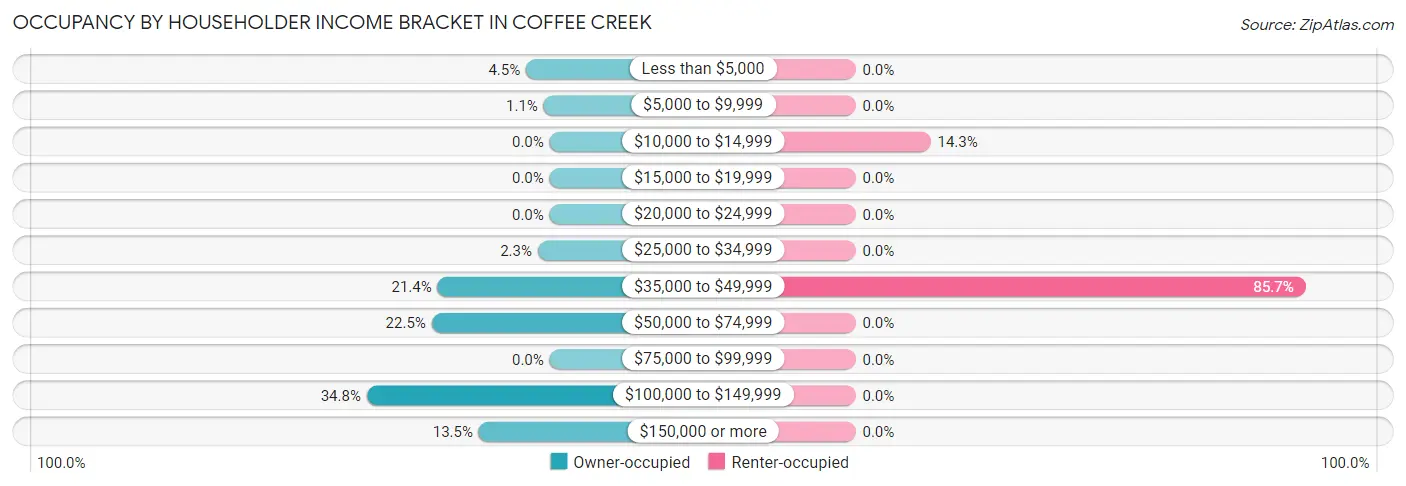
| Income Bracket | Owner-occupied | Renter-occupied |
| Less than $5,000 | 4 (4.5%) | 0 (0.0%) |
| $5,000 to $9,999 | 1 (1.1%) | 0 (0.0%) |
| $10,000 to $14,999 | 0 (0.0%) | 2 (14.3%) |
| $15,000 to $19,999 | 0 (0.0%) | 0 (0.0%) |
| $20,000 to $24,999 | 0 (0.0%) | 0 (0.0%) |
| $25,000 to $34,999 | 2 (2.2%) | 0 (0.0%) |
| $35,000 to $49,999 | 19 (21.3%) | 12 (85.7%) |
| $50,000 to $74,999 | 20 (22.5%) | 0 (0.0%) |
| $75,000 to $99,999 | 0 (0.0%) | 0 (0.0%) |
| $100,000 to $149,999 | 31 (34.8%) | 0 (0.0%) |
| $150,000 or more | 12 (13.5%) | 0 (0.0%) |
| Total | 89 (100.0%) | 14 (100.0%) |
Monthly Housing Cost Tiers in Coffee Creek
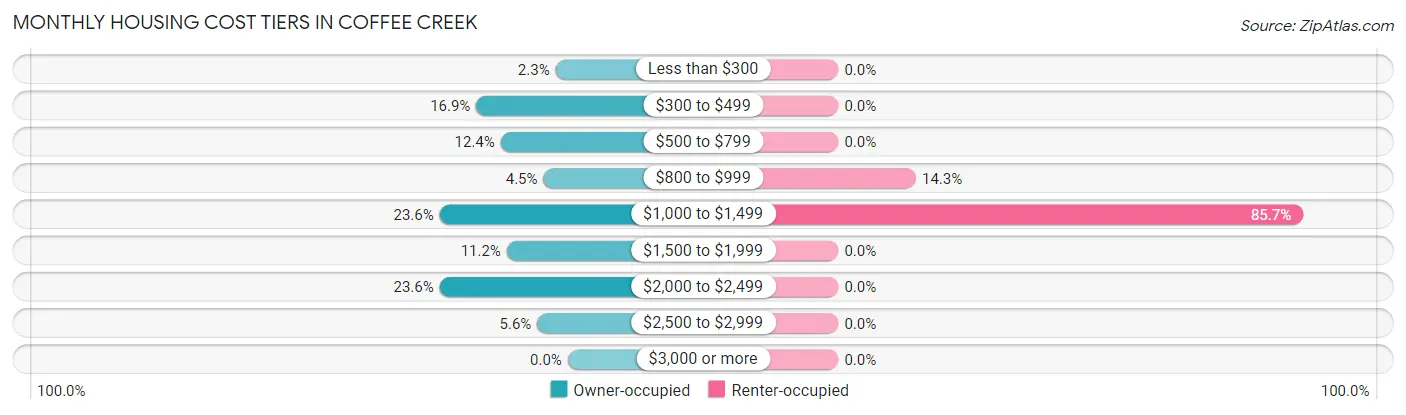
| Monthly Cost | Owner-occupied | Renter-occupied |
| Less than $300 | 2 (2.2%) | 0 (0.0%) |
| $300 to $499 | 15 (16.9%) | 0 (0.0%) |
| $500 to $799 | 11 (12.4%) | 0 (0.0%) |
| $800 to $999 | 4 (4.5%) | 2 (14.3%) |
| $1,000 to $1,499 | 21 (23.6%) | 12 (85.7%) |
| $1,500 to $1,999 | 10 (11.2%) | 0 (0.0%) |
| $2,000 to $2,499 | 21 (23.6%) | 0 (0.0%) |
| $2,500 to $2,999 | 5 (5.6%) | 0 (0.0%) |
| $3,000 or more | 0 (0.0%) | 0 (0.0%) |
| Total | 89 (100.0%) | 14 (100.0%) |
Physical Housing Characteristics in Coffee Creek
Housing Structures in Coffee Creek
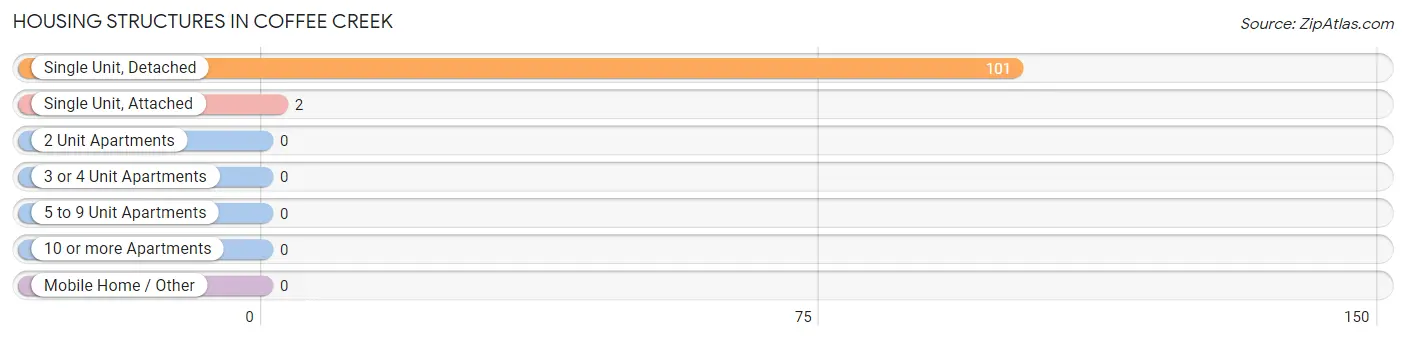
| Structure Type | # Housing Units | % Housing Units |
| Single Unit, Detached | 101 | 98.1% |
| Single Unit, Attached | 2 | 1.9% |
| 2 Unit Apartments | 0 | 0.0% |
| 3 or 4 Unit Apartments | 0 | 0.0% |
| 5 to 9 Unit Apartments | 0 | 0.0% |
| 10 or more Apartments | 0 | 0.0% |
| Mobile Home / Other | 0 | 0.0% |
| Total | 103 | 100.0% |
Housing Structures by Occupancy in Coffee Creek
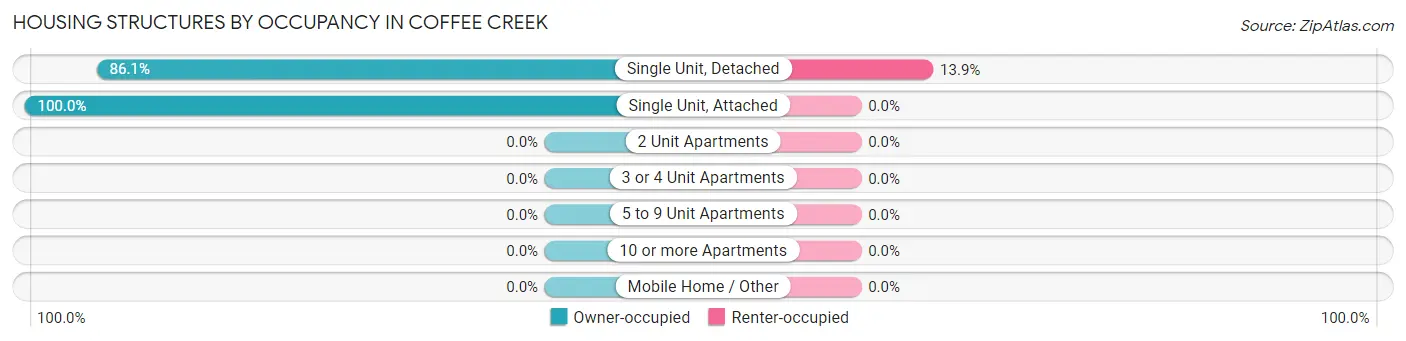
| Structure Type | Owner-occupied | Renter-occupied |
| Single Unit, Detached | 87 (86.1%) | 14 (13.9%) |
| Single Unit, Attached | 2 (100.0%) | 0 (0.0%) |
| 2 Unit Apartments | 0 (0.0%) | 0 (0.0%) |
| 3 or 4 Unit Apartments | 0 (0.0%) | 0 (0.0%) |
| 5 to 9 Unit Apartments | 0 (0.0%) | 0 (0.0%) |
| 10 or more Apartments | 0 (0.0%) | 0 (0.0%) |
| Mobile Home / Other | 0 (0.0%) | 0 (0.0%) |
| Total | 89 (86.4%) | 14 (13.6%) |
Housing Structures by Number of Rooms in Coffee Creek
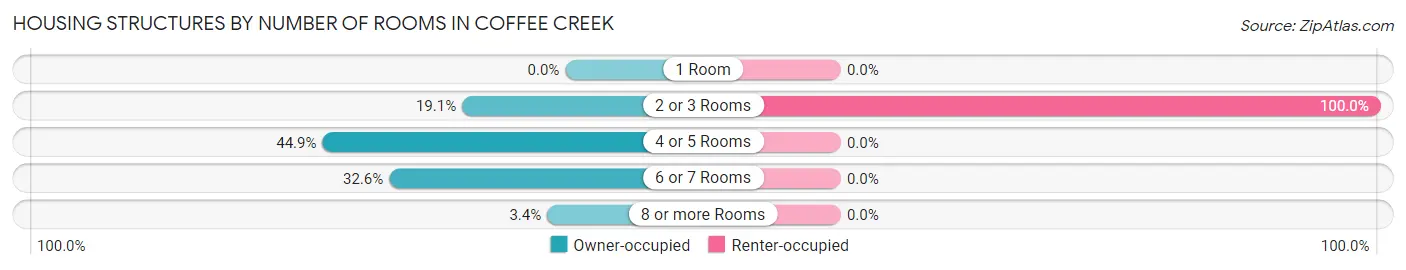
| Number of Rooms | Owner-occupied | Renter-occupied |
| 1 Room | 0 (0.0%) | 0 (0.0%) |
| 2 or 3 Rooms | 17 (19.1%) | 14 (100.0%) |
| 4 or 5 Rooms | 40 (44.9%) | 0 (0.0%) |
| 6 or 7 Rooms | 29 (32.6%) | 0 (0.0%) |
| 8 or more Rooms | 3 (3.4%) | 0 (0.0%) |
| Total | 89 (100.0%) | 14 (100.0%) |
Housing Structure by Heating Type in Coffee Creek
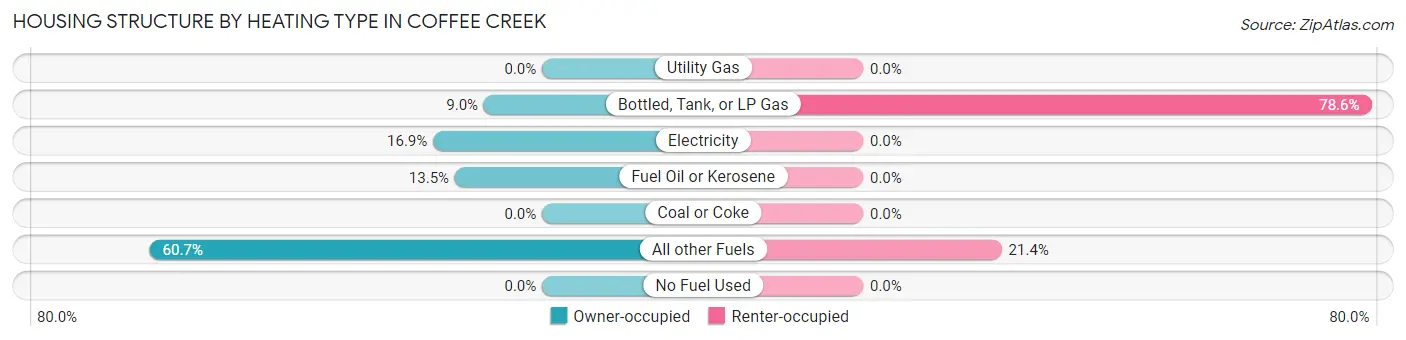
| Heating Type | Owner-occupied | Renter-occupied |
| Utility Gas | 0 (0.0%) | 0 (0.0%) |
| Bottled, Tank, or LP Gas | 8 (9.0%) | 11 (78.6%) |
| Electricity | 15 (16.9%) | 0 (0.0%) |
| Fuel Oil or Kerosene | 12 (13.5%) | 0 (0.0%) |
| Coal or Coke | 0 (0.0%) | 0 (0.0%) |
| All other Fuels | 54 (60.7%) | 3 (21.4%) |
| No Fuel Used | 0 (0.0%) | 0 (0.0%) |
| Total | 89 (100.0%) | 14 (100.0%) |
Household Vehicle Usage in Coffee Creek
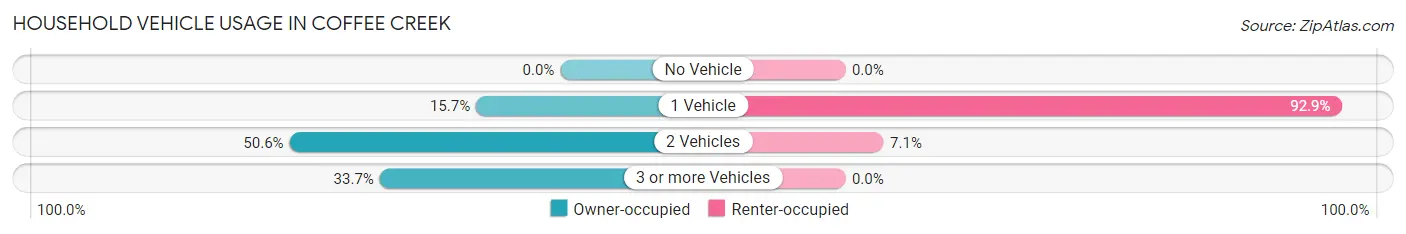
| Vehicles per Household | Owner-occupied | Renter-occupied |
| No Vehicle | 0 (0.0%) | 0 (0.0%) |
| 1 Vehicle | 14 (15.7%) | 13 (92.9%) |
| 2 Vehicles | 45 (50.6%) | 1 (7.1%) |
| 3 or more Vehicles | 30 (33.7%) | 0 (0.0%) |
| Total | 89 (100.0%) | 14 (100.0%) |
Real Estate & Mortgages in Coffee Creek
Real Estate and Mortgage Overview in Coffee Creek
| Characteristic | Without Mortgage | With Mortgage |
| Housing Units | 34 | 55 |
| Median Property Value | $362,500 | $424,100 |
| Median Household Income | $116,250 | $10 |
| Monthly Housing Costs | $500 | $0 |
| Real Estate Taxes | $1,600 | $0 |
Property Value by Mortgage Status in Coffee Creek
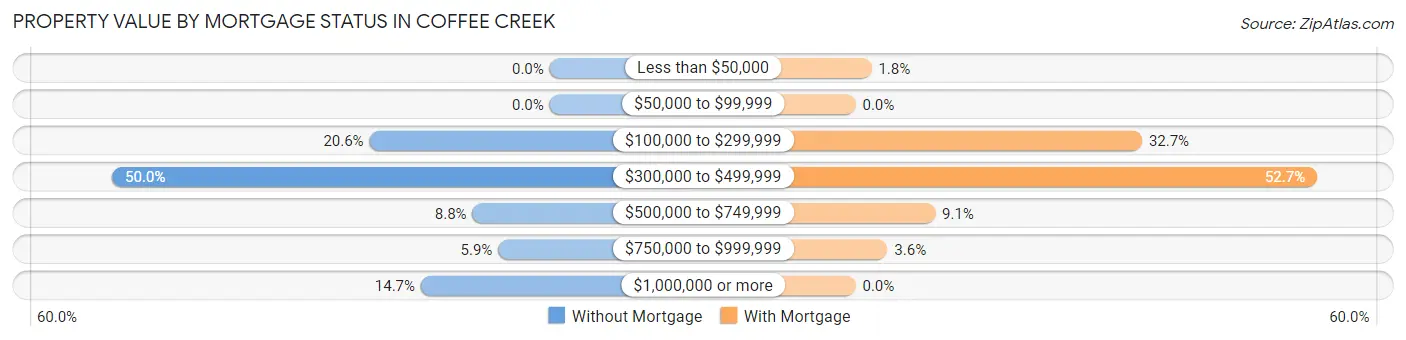
| Property Value | Without Mortgage | With Mortgage |
| Less than $50,000 | 0 (0.0%) | 1 (1.8%) |
| $50,000 to $99,999 | 0 (0.0%) | 0 (0.0%) |
| $100,000 to $299,999 | 7 (20.6%) | 18 (32.7%) |
| $300,000 to $499,999 | 17 (50.0%) | 29 (52.7%) |
| $500,000 to $749,999 | 3 (8.8%) | 5 (9.1%) |
| $750,000 to $999,999 | 2 (5.9%) | 2 (3.6%) |
| $1,000,000 or more | 5 (14.7%) | 0 (0.0%) |
| Total | 34 (100.0%) | 55 (100.0%) |
Household Income by Mortgage Status in Coffee Creek
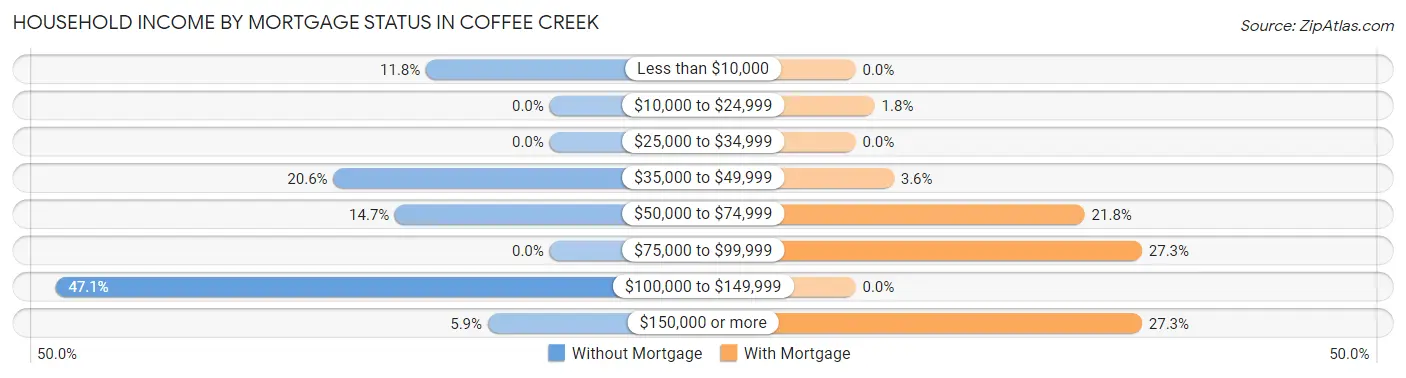
| Household Income | Without Mortgage | With Mortgage |
| Less than $10,000 | 4 (11.8%) | 0 (0.0%) |
| $10,000 to $24,999 | 0 (0.0%) | 1 (1.8%) |
| $25,000 to $34,999 | 0 (0.0%) | 0 (0.0%) |
| $35,000 to $49,999 | 7 (20.6%) | 2 (3.6%) |
| $50,000 to $74,999 | 5 (14.7%) | 12 (21.8%) |
| $75,000 to $99,999 | 0 (0.0%) | 15 (27.3%) |
| $100,000 to $149,999 | 16 (47.1%) | 0 (0.0%) |
| $150,000 or more | 2 (5.9%) | 15 (27.3%) |
| Total | 34 (100.0%) | 55 (100.0%) |
Property Value to Household Income Ratio in Coffee Creek
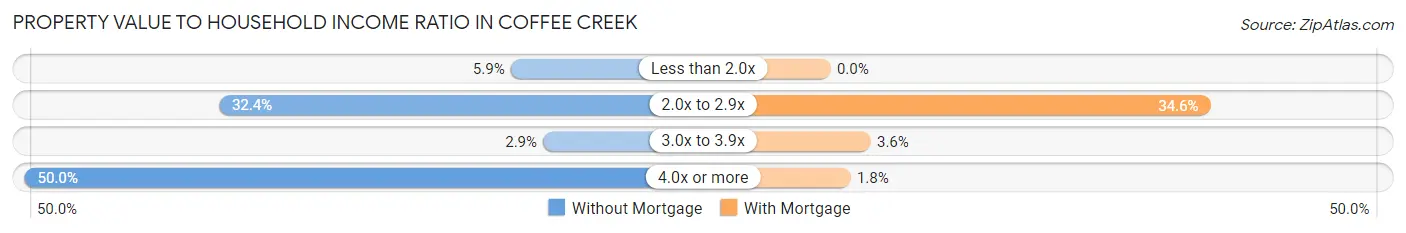
| Value-to-Income Ratio | Without Mortgage | With Mortgage |
| Less than 2.0x | 2 (5.9%) | 0 (0.0%) |
| 2.0x to 2.9x | 11 (32.4%) | 19 (34.5%) |
| 3.0x to 3.9x | 1 (2.9%) | 2 (3.6%) |
| 4.0x or more | 17 (50.0%) | 1 (1.8%) |
| Total | 34 (100.0%) | 55 (100.0%) |
Real Estate Taxes by Mortgage Status in Coffee Creek
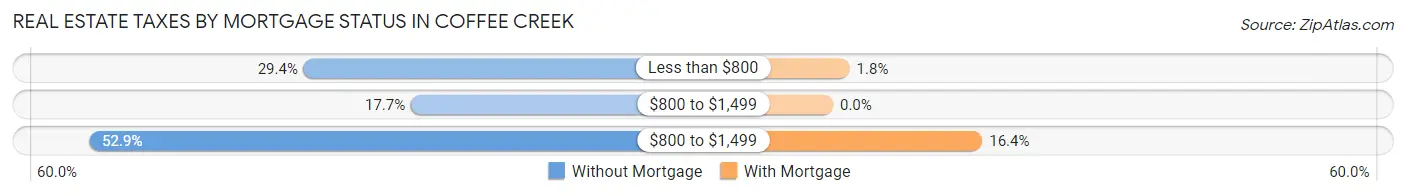
| Property Taxes | Without Mortgage | With Mortgage |
| Less than $800 | 10 (29.4%) | 1 (1.8%) |
| $800 to $1,499 | 6 (17.6%) | 0 (0.0%) |
| $800 to $1,499 | 18 (52.9%) | 9 (16.4%) |
| Total | 34 (100.0%) | 55 (100.0%) |
Health & Disability in Coffee Creek
Health Insurance Coverage by Age in Coffee Creek
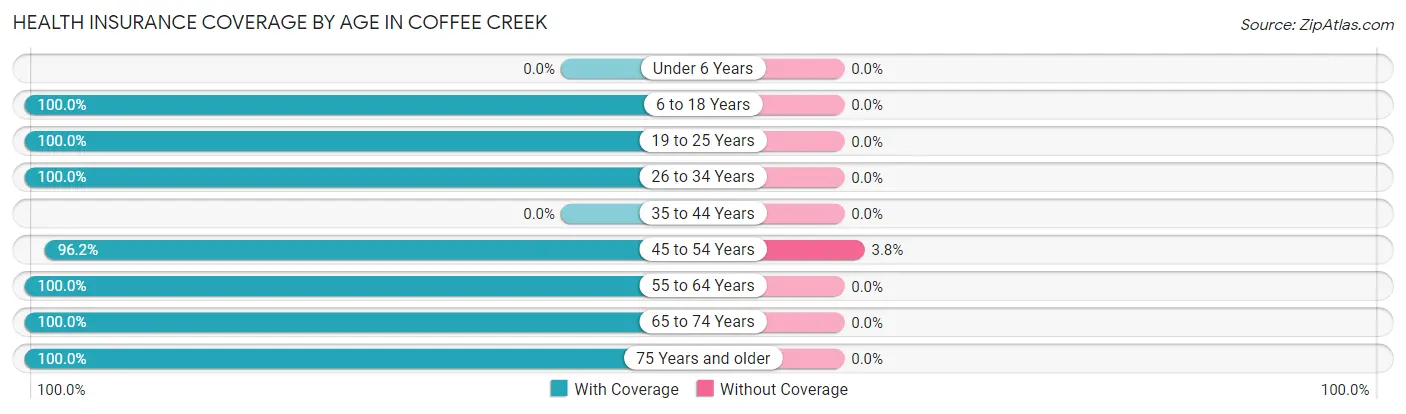
| Age Bracket | With Coverage | Without Coverage |
| Under 6 Years | 0 (0.0%) | 0 (0.0%) |
| 6 to 18 Years | 24 (100.0%) | 0 (0.0%) |
| 19 to 25 Years | 40 (100.0%) | 0 (0.0%) |
| 26 to 34 Years | 27 (100.0%) | 0 (0.0%) |
| 35 to 44 Years | 0 (0.0%) | 0 (0.0%) |
| 45 to 54 Years | 51 (96.2%) | 2 (3.8%) |
| 55 to 64 Years | 50 (100.0%) | 0 (0.0%) |
| 65 to 74 Years | 43 (100.0%) | 0 (0.0%) |
| 75 Years and older | 41 (100.0%) | 0 (0.0%) |
| Total | 276 (99.3%) | 2 (0.7%) |
Health Insurance Coverage by Citizenship Status in Coffee Creek
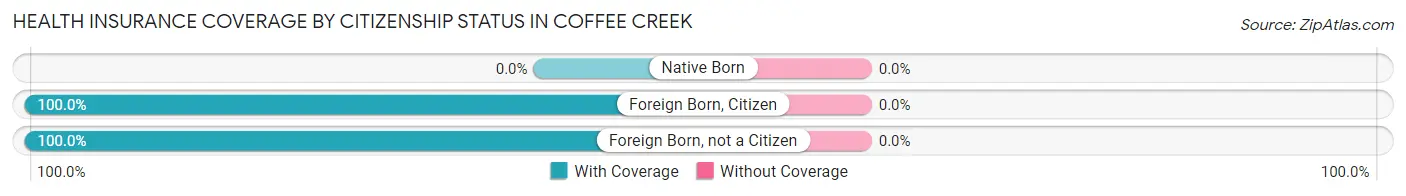
| Citizenship Status | With Coverage | Without Coverage |
| Native Born | 0 (0.0%) | 0 (0.0%) |
| Foreign Born, Citizen | 24 (100.0%) | 0 (0.0%) |
| Foreign Born, not a Citizen | 40 (100.0%) | 0 (0.0%) |
Health Insurance Coverage by Household Income in Coffee Creek
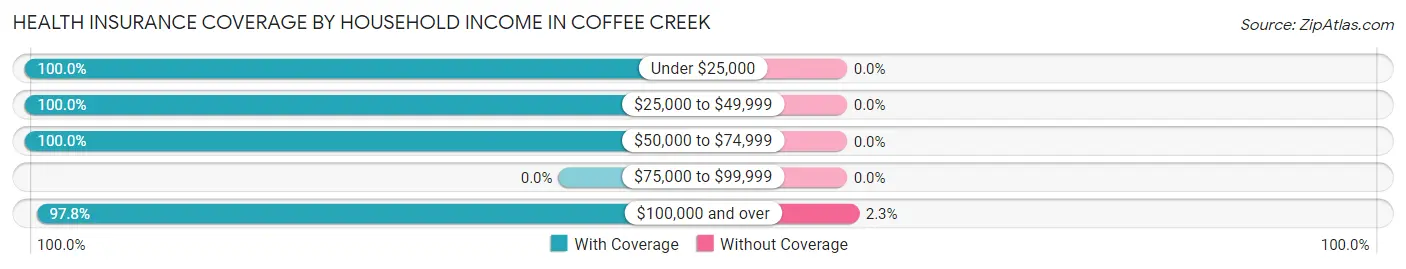
| Household Income | With Coverage | Without Coverage |
| Under $25,000 | 13 (100.0%) | 0 (0.0%) |
| $25,000 to $49,999 | 73 (100.0%) | 0 (0.0%) |
| $50,000 to $74,999 | 76 (100.0%) | 0 (0.0%) |
| $75,000 to $99,999 | 0 (0.0%) | 0 (0.0%) |
| $100,000 and over | 87 (97.8%) | 2 (2.2%) |
Public vs Private Health Insurance Coverage by Age in Coffee Creek
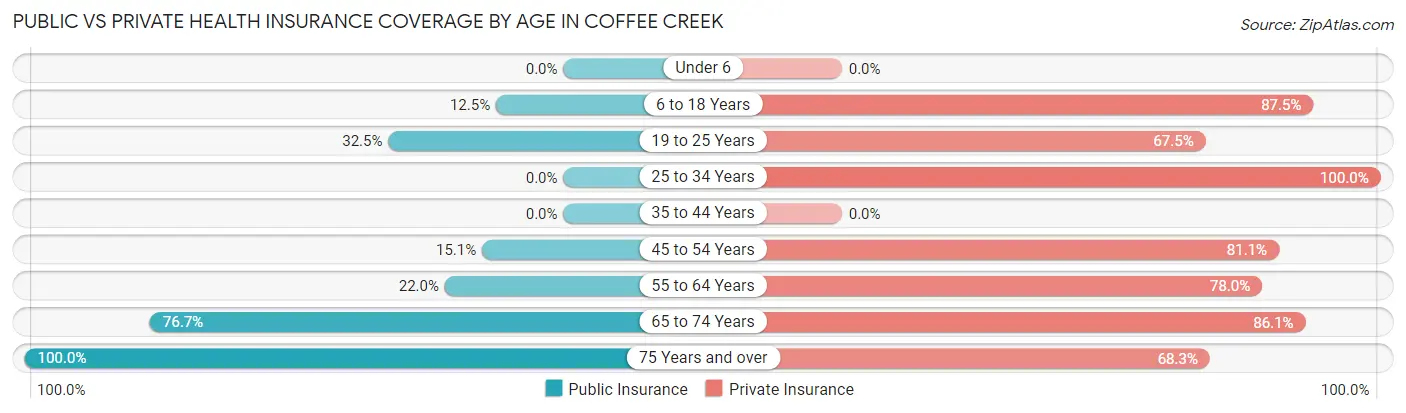
| Age Bracket | Public Insurance | Private Insurance |
| Under 6 | 0 (0.0%) | 0 (0.0%) |
| 6 to 18 Years | 3 (12.5%) | 21 (87.5%) |
| 19 to 25 Years | 13 (32.5%) | 27 (67.5%) |
| 25 to 34 Years | 0 (0.0%) | 27 (100.0%) |
| 35 to 44 Years | 0 (0.0%) | 0 (0.0%) |
| 45 to 54 Years | 8 (15.1%) | 43 (81.1%) |
| 55 to 64 Years | 11 (22.0%) | 39 (78.0%) |
| 65 to 74 Years | 33 (76.7%) | 37 (86.1%) |
| 75 Years and over | 41 (100.0%) | 28 (68.3%) |
| Total | 109 (39.2%) | 222 (79.9%) |
Disability Status by Sex by Age in Coffee Creek
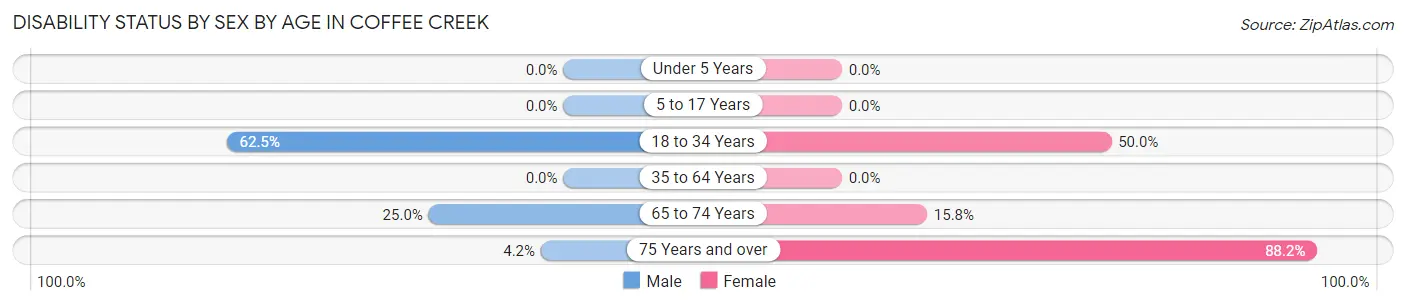
| Age Bracket | Male | Female |
| Under 5 Years | 0 (0.0%) | 0 (0.0%) |
| 5 to 17 Years | 0 (0.0%) | 0 (0.0%) |
| 18 to 34 Years | 10 (62.5%) | 27 (50.0%) |
| 35 to 64 Years | 0 (0.0%) | 0 (0.0%) |
| 65 to 74 Years | 6 (25.0%) | 3 (15.8%) |
| 75 Years and over | 1 (4.2%) | 15 (88.2%) |
Disability Class by Sex by Age in Coffee Creek
Disability Class: Hearing Difficulty
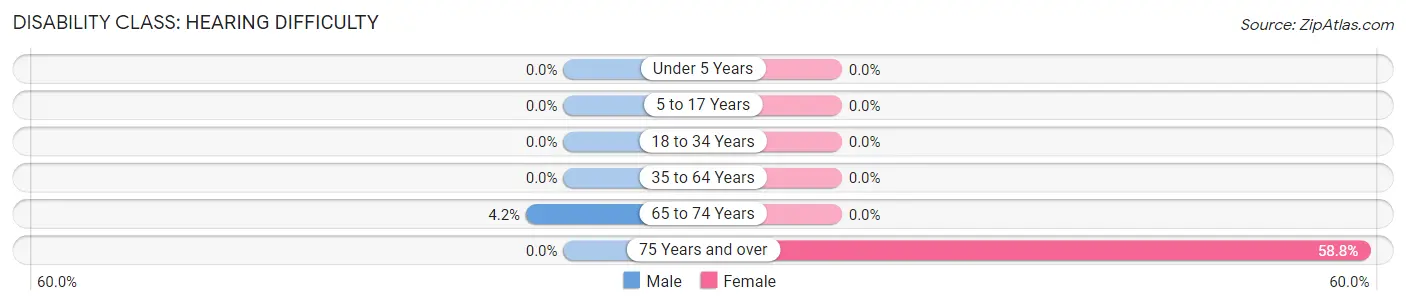
| Age Bracket | Male | Female |
| Under 5 Years | 0 (0.0%) | 0 (0.0%) |
| 5 to 17 Years | 0 (0.0%) | 0 (0.0%) |
| 18 to 34 Years | 0 (0.0%) | 0 (0.0%) |
| 35 to 64 Years | 0 (0.0%) | 0 (0.0%) |
| 65 to 74 Years | 1 (4.2%) | 0 (0.0%) |
| 75 Years and over | 0 (0.0%) | 10 (58.8%) |
Disability Class: Vision Difficulty
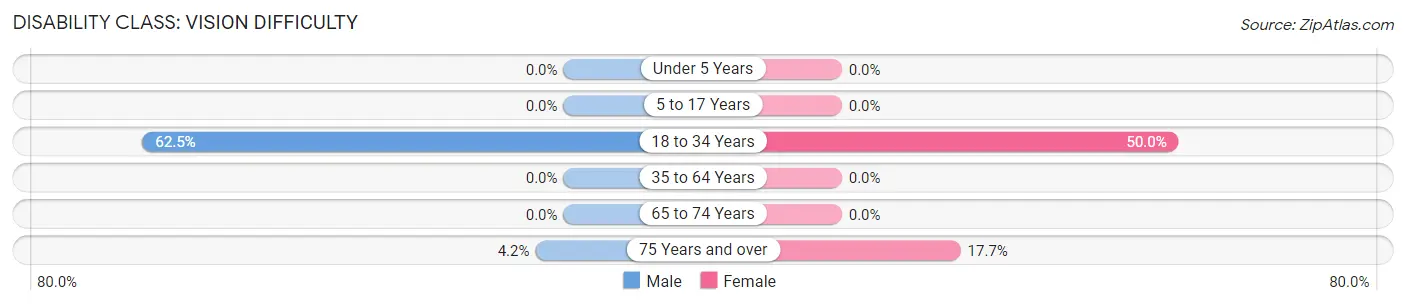
| Age Bracket | Male | Female |
| Under 5 Years | 0 (0.0%) | 0 (0.0%) |
| 5 to 17 Years | 0 (0.0%) | 0 (0.0%) |
| 18 to 34 Years | 10 (62.5%) | 27 (50.0%) |
| 35 to 64 Years | 0 (0.0%) | 0 (0.0%) |
| 65 to 74 Years | 0 (0.0%) | 0 (0.0%) |
| 75 Years and over | 1 (4.2%) | 3 (17.6%) |
Disability Class: Cognitive Difficulty
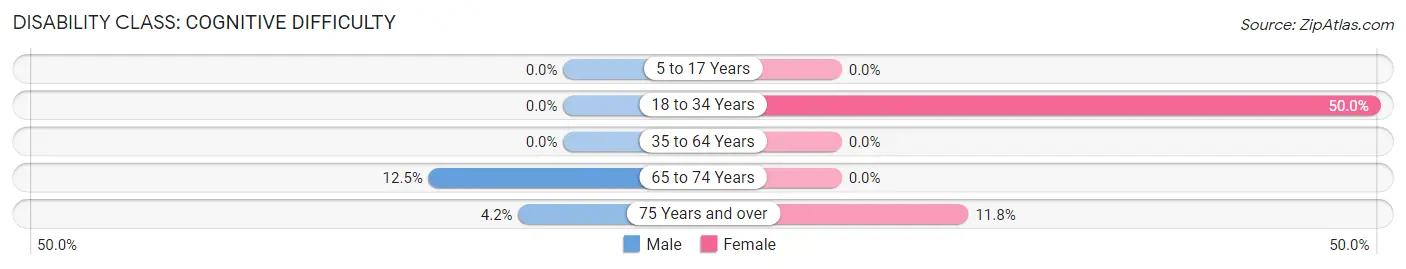
| Age Bracket | Male | Female |
| 5 to 17 Years | 0 (0.0%) | 0 (0.0%) |
| 18 to 34 Years | 0 (0.0%) | 27 (50.0%) |
| 35 to 64 Years | 0 (0.0%) | 0 (0.0%) |
| 65 to 74 Years | 3 (12.5%) | 0 (0.0%) |
| 75 Years and over | 1 (4.2%) | 2 (11.8%) |
Disability Class: Ambulatory Difficulty
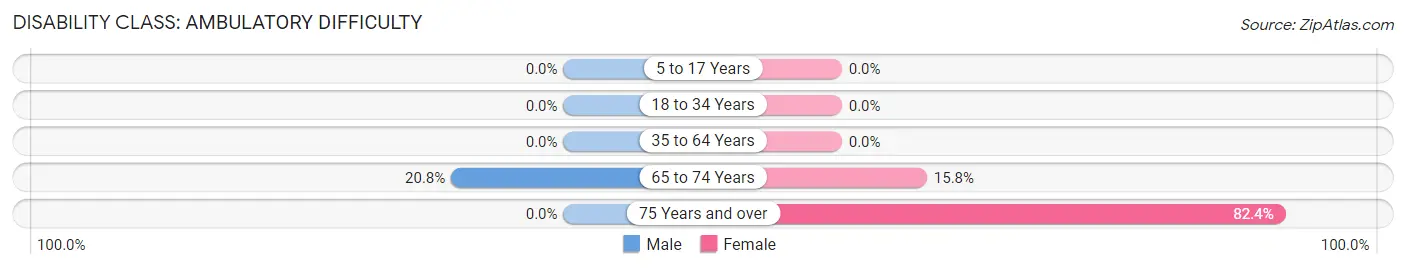
| Age Bracket | Male | Female |
| 5 to 17 Years | 0 (0.0%) | 0 (0.0%) |
| 18 to 34 Years | 0 (0.0%) | 0 (0.0%) |
| 35 to 64 Years | 0 (0.0%) | 0 (0.0%) |
| 65 to 74 Years | 5 (20.8%) | 3 (15.8%) |
| 75 Years and over | 0 (0.0%) | 14 (82.4%) |
Disability Class: Self-Care Difficulty
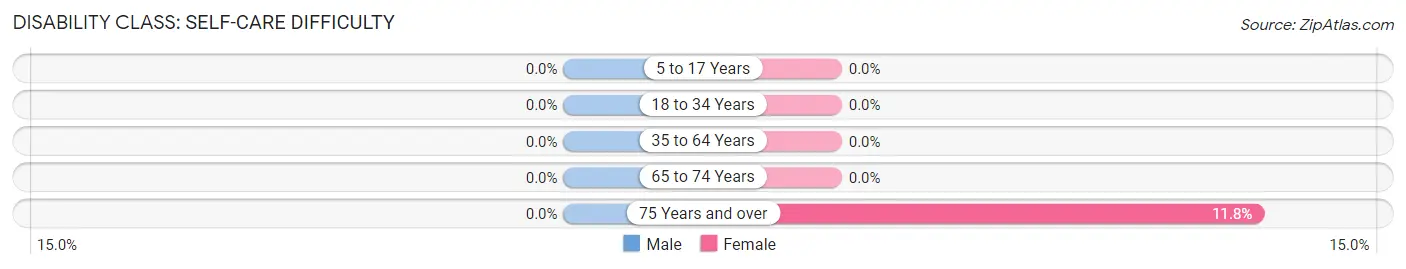
| Age Bracket | Male | Female |
| 5 to 17 Years | 0 (0.0%) | 0 (0.0%) |
| 18 to 34 Years | 0 (0.0%) | 0 (0.0%) |
| 35 to 64 Years | 0 (0.0%) | 0 (0.0%) |
| 65 to 74 Years | 0 (0.0%) | 0 (0.0%) |
| 75 Years and over | 0 (0.0%) | 2 (11.8%) |
Technology Access in Coffee Creek
Computing Device Access in Coffee Creek
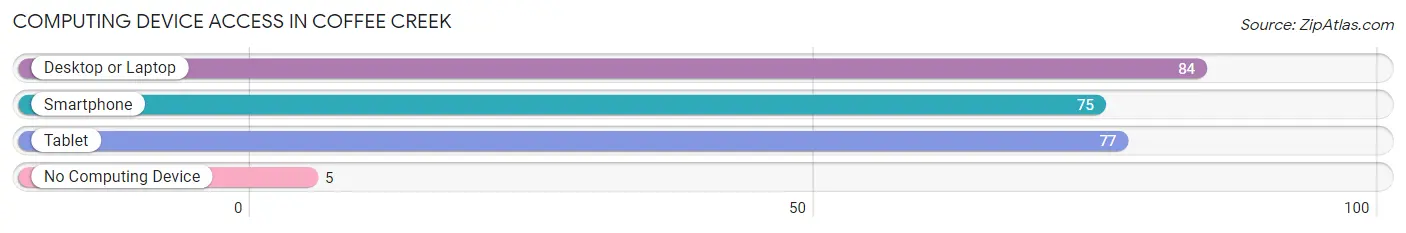
| Device Type | # Households | % Households |
| Desktop or Laptop | 84 | 81.6% |
| Smartphone | 75 | 72.8% |
| Tablet | 77 | 74.8% |
| No Computing Device | 5 | 4.9% |
| Total | 103 | 100.0% |
Internet Access in Coffee Creek
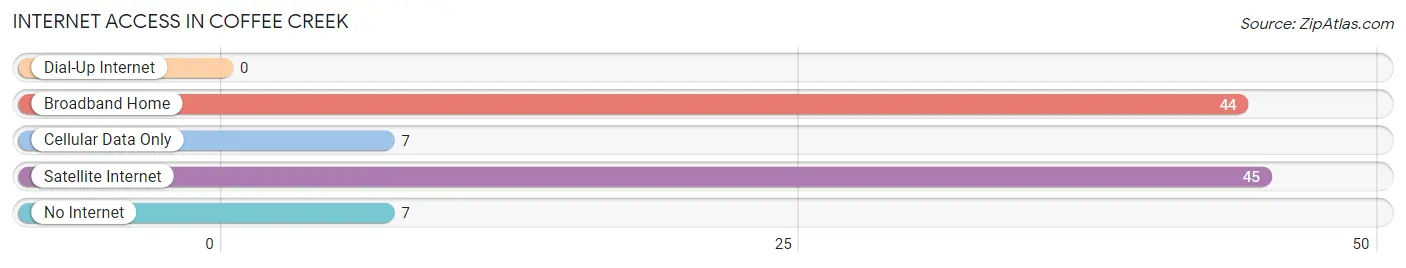
| Internet Type | # Households | % Households |
| Dial-Up Internet | 0 | 0.0% |
| Broadband Home | 44 | 42.7% |
| Cellular Data Only | 7 | 6.8% |
| Satellite Internet | 45 | 43.7% |
| No Internet | 7 | 6.8% |
| Total | 103 | 100.0% |
Coffee Creek Summary
Coffee Creek is a small unincorporated community located in the Sierra Nevada foothills of California, in Plumas County. It is situated in a rural area, surrounded by forests and mountains, and is home to a population of approximately 200 people.
History
The area that is now Coffee Creek was first settled in the late 1800s by miners and loggers. The town was originally known as “Coffee Camp”, and was named after the creek that runs through the area. The creek was named for the coffee-colored water that ran through it.
In the early 1900s, the town was home to a sawmill, a general store, a post office, and a school. The town was also home to a number of small businesses, including a blacksmith shop, a barber shop, and a hotel.
In the 1950s, the town began to decline as the logging industry moved away from the area. The sawmill closed, and the post office was shut down. The school was also closed, and the town’s population began to dwindle.
In the late 1970s, the town was revitalized when a group of artists and craftspeople moved to the area. They opened a number of galleries and shops, and the town began to attract tourists. The town’s population began to grow again, and it is now home to a diverse population of artists, craftspeople, and other professionals.
Geography
Coffee Creek is located in the Sierra Nevada foothills of California, in Plumas County. It is situated in a rural area, surrounded by forests and mountains. The town is located at an elevation of 2,400 feet, and is approximately 25 miles from the nearest major city, Quincy.
The town is located in a valley, and is bordered by the Feather River to the north, and the Coffee Creek to the south. The town is also located near the Plumas National Forest, which provides a variety of recreational activities, including camping, fishing, and hiking.
Economy
The economy of Coffee Creek is largely based on tourism. The town is home to a number of galleries and shops, which attract visitors from all over the region. The town is also home to a number of small businesses, including a cafe, a bakery, and a general store.
The town is also home to a number of small farms, which produce a variety of fruits and vegetables. The town is also home to a number of wineries, which produce a variety of wines.
Demographics
As of the 2010 census, the population of Coffee Creek was approximately 200 people. The town is home to a diverse population, with a variety of ethnic backgrounds. The town is also home to a number of artists and craftspeople, who contribute to the town’s economy.
The median household income in Coffee Creek is approximately $35,000, and the median home value is approximately $150,000. The town is served by a number of public schools, including a high school, a middle school, and an elementary school.
Common Questions
What is Per Capita Income in Coffee Creek?
Per Capita income in Coffee Creek is $42,103.
What is the Median Household income in Coffee Creek?
Median Household Income in Coffee Creek is $61,250.
What is Income or Wage Gap in Coffee Creek?
Income or Wage Gap in Coffee Creek is 69.3%.
Women in Coffee Creek earn 30.7 cents for every dollar earned by a man.
What is Inequality or Gini Index in Coffee Creek?
Inequality or Gini Index in Coffee Creek is 0.44.
What is the Total Population of Coffee Creek?
Total Population of Coffee Creek is 278.
What is the Total Male Population of Coffee Creek?
Total Male Population of Coffee Creek is 135.
What is the Total Female Population of Coffee Creek?
Total Female Population of Coffee Creek is 143.
What is the Ratio of Males per 100 Females in Coffee Creek?
There are 94.41 Males per 100 Females in Coffee Creek.
What is the Ratio of Females per 100 Males in Coffee Creek?
There are 105.93 Females per 100 Males in Coffee Creek.
What is the Median Population Age in Coffee Creek?
Median Population Age in Coffee Creek is 52.7 Years.
What is the Average Family Size in Coffee Creek
Average Family Size in Coffee Creek is 3.1 People.
What is the Average Household Size in Coffee Creek
Average Household Size in Coffee Creek is 2.4 People.
How Large is the Labor Force in Coffee Creek?
There are 100 People in the Labor Forcein in Coffee Creek.
What is the Percentage of People in the Labor Force in Coffee Creek?
38.3% of People are in the Labor Force in Coffee Creek.
What is the Unemployment Rate in Coffee Creek?
Unemployment Rate in Coffee Creek is 5.0%.