Cities with the Highest Percentage of Population Employed in Health Diagnosing & Treating in West Virginia
RELATED REPORTS & OPTIONS
Health Diagnosing & Treating
West Virginia
Compare Cities
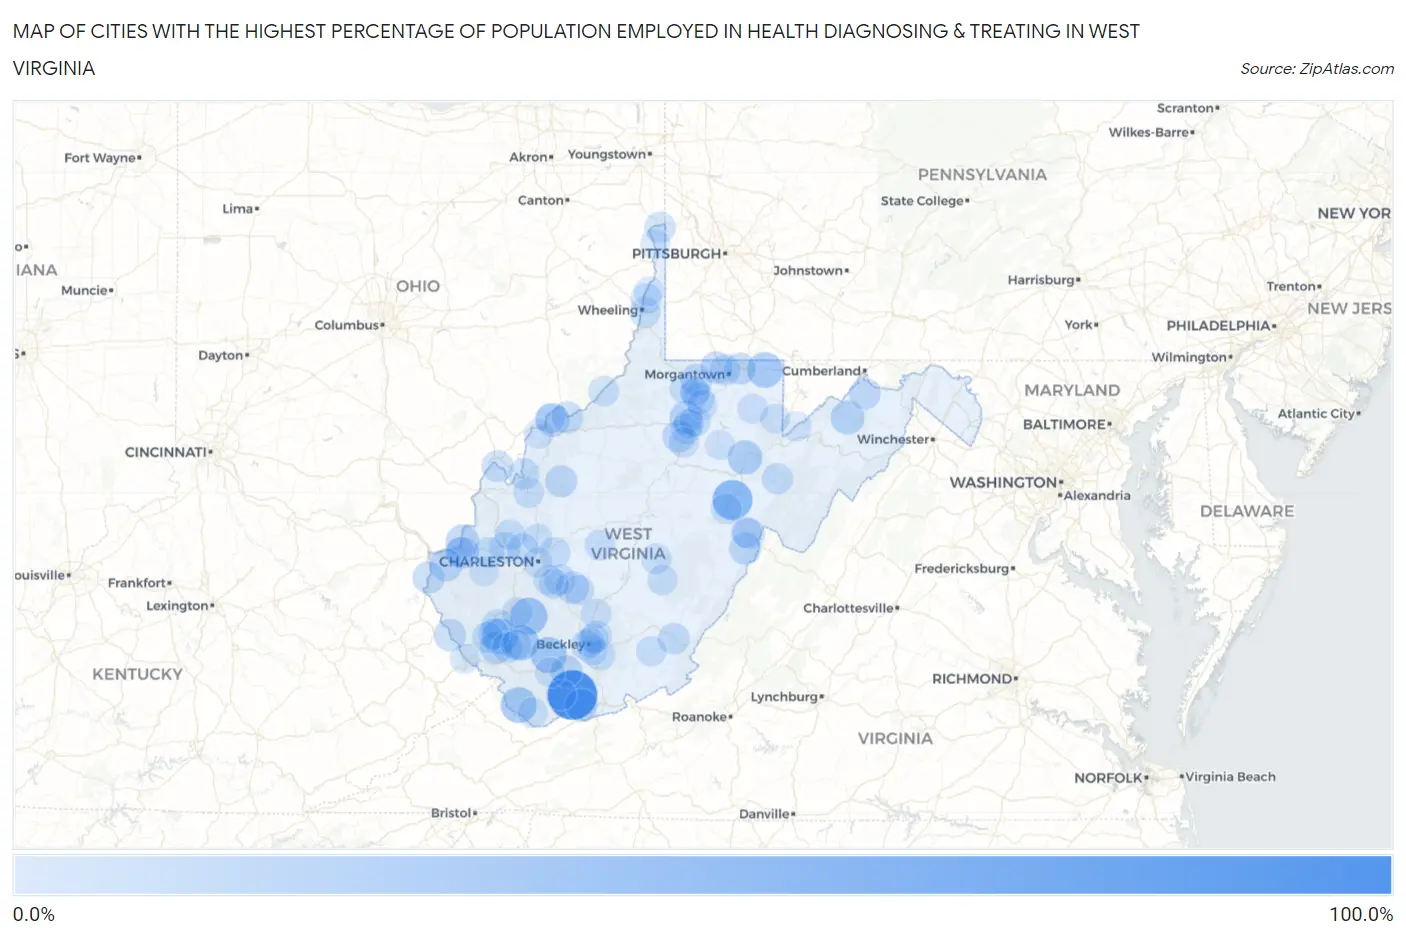
Map of Cities with the Highest Percentage of Population Employed in Health Diagnosing & Treating in West Virginia
0.0%
100.0%
Cities with the Highest Percentage of Population Employed in Health Diagnosing & Treating in West Virginia
| City | % Employed | vs State | vs National | |
| 1. | Crumpler | 100.0% | 8.0%(+92.0)#1 | 6.2%(+93.8)#2 |
| 2. | Valley Bend | 54.5% | 8.0%(+46.5)#2 | 6.2%(+48.2)#59 |
| 3. | Raleigh | 49.1% | 8.0%(+41.1)#3 | 6.2%(+42.8)#87 |
| 4. | Van | 41.7% | 8.0%(+33.7)#4 | 6.2%(+35.4)#131 |
| 5. | Mcconnell | 36.1% | 8.0%(+28.1)#5 | 6.2%(+29.9)#179 |
| 6. | Glen Fork | 36.0% | 8.0%(+28.0)#6 | 6.2%(+29.8)#183 |
| 7. | Bradshaw | 35.6% | 8.0%(+27.6)#7 | 6.2%(+29.4)#191 |
| 8. | Robinette | 35.2% | 8.0%(+27.2)#8 | 6.2%(+28.9)#199 |
| 9. | Bruceton Mills | 34.3% | 8.0%(+26.3)#9 | 6.2%(+28.1)#213 |
| 10. | Kanawha | 33.6% | 8.0%(+25.6)#10 | 6.2%(+27.3)#221 |
| 11. | Gatewood | 32.4% | 8.0%(+24.4)#11 | 6.2%(+26.2)#257 |
| 12. | Montrose | 28.8% | 8.0%(+20.8)#12 | 6.2%(+22.6)#323 |
| 13. | Burlington | 26.0% | 8.0%(+18.0)#13 | 6.2%(+19.8)#409 |
| 14. | North Hills | 24.9% | 8.0%(+16.9)#14 | 6.2%(+18.7)#452 |
| 15. | Hepzibah | 24.0% | 8.0%(+16.0)#15 | 6.2%(+17.8)#495 |
| 16. | Lesage | 23.9% | 8.0%(+15.9)#16 | 6.2%(+17.7)#498 |
| 17. | Omar | 22.4% | 8.0%(+14.4)#17 | 6.2%(+16.2)#578 |
| 18. | Barboursville | 22.2% | 8.0%(+14.2)#18 | 6.2%(+15.9)#597 |
| 19. | Lavalette | 21.6% | 8.0%(+13.6)#19 | 6.2%(+15.4)#626 |
| 20. | Montcalm | 21.0% | 8.0%(+13.0)#20 | 6.2%(+14.8)#662 |
| 21. | Montgomery | 20.6% | 8.0%(+12.6)#21 | 6.2%(+14.4)#691 |
| 22. | West Milford | 20.6% | 8.0%(+12.6)#22 | 6.2%(+14.3)#696 |
| 23. | Fairview | 19.7% | 8.0%(+11.7)#23 | 6.2%(+13.5)#776 |
| 24. | Cassville | 19.4% | 8.0%(+11.4)#24 | 6.2%(+13.1)#803 |
| 25. | Kermit | 19.0% | 8.0%(+11.0)#25 | 6.2%(+12.8)#834 |
| 26. | Prichard | 18.7% | 8.0%(+10.7)#26 | 6.2%(+12.5)#872 |
| 27. | Arbovale | 18.6% | 8.0%(+10.6)#27 | 6.2%(+12.3)#886 |
| 28. | Mullens | 18.6% | 8.0%(+10.6)#28 | 6.2%(+12.3)#889 |
| 29. | Reedy | 18.2% | 8.0%(+10.2)#29 | 6.2%(+11.9)#932 |
| 30. | Cheat Lake | 18.1% | 8.0%(+10.1)#30 | 6.2%(+11.8)#947 |
| 31. | Dupont | 18.0% | 8.0%(+10.0)#31 | 6.2%(+11.8)#953 |
| 32. | Waverly | 17.8% | 8.0%(+9.75)#32 | 6.2%(+11.5)#980 |
| 33. | Hartford City | 17.5% | 8.0%(+9.53)#33 | 6.2%(+11.3)#1,005 |
| 34. | Bartow | 17.5% | 8.0%(+9.49)#34 | 6.2%(+11.3)#1,010 |
| 35. | Lewisburg | 16.6% | 8.0%(+8.58)#35 | 6.2%(+10.3)#1,169 |
| 36. | Fort Ashby | 16.4% | 8.0%(+8.42)#36 | 6.2%(+10.2)#1,192 |
| 37. | Mitchell Heights | 16.2% | 8.0%(+8.22)#37 | 6.2%(+9.99)#1,236 |
| 38. | Cedar Grove | 16.0% | 8.0%(+7.97)#38 | 6.2%(+9.73)#1,284 |
| 39. | Harman | 15.6% | 8.0%(+7.61)#39 | 6.2%(+9.38)#1,368 |
| 40. | Ravenswood | 15.4% | 8.0%(+7.43)#40 | 6.2%(+9.20)#1,405 |
| 41. | Mount Gay Shamrock | 15.3% | 8.0%(+7.28)#41 | 6.2%(+9.05)#1,449 |
| 42. | Holden | 15.2% | 8.0%(+7.20)#42 | 6.2%(+8.96)#1,463 |
| 43. | Teays Valley | 15.2% | 8.0%(+7.19)#43 | 6.2%(+8.96)#1,464 |
| 44. | Star City | 14.9% | 8.0%(+6.91)#44 | 6.2%(+8.68)#1,522 |
| 45. | Chester | 14.9% | 8.0%(+6.90)#45 | 6.2%(+8.66)#1,524 |
| 46. | Monongah | 14.7% | 8.0%(+6.68)#46 | 6.2%(+8.44)#1,580 |
| 47. | Adrian | 14.6% | 8.0%(+6.62)#47 | 6.2%(+8.39)#1,603 |
| 48. | Piney View | 14.6% | 8.0%(+6.60)#48 | 6.2%(+8.37)#1,611 |
| 49. | Nutter Fort | 14.6% | 8.0%(+6.59)#49 | 6.2%(+8.35)#1,622 |
| 50. | Shady Spring | 14.4% | 8.0%(+6.38)#50 | 6.2%(+8.15)#1,679 |
| 51. | Culloden | 14.4% | 8.0%(+6.35)#51 | 6.2%(+8.11)#1,688 |
| 52. | Huttonsville | 14.3% | 8.0%(+6.27)#52 | 6.2%(+8.04)#1,710 |
| 53. | Bridgeport | 14.2% | 8.0%(+6.18)#53 | 6.2%(+7.95)#1,748 |
| 54. | Bethlehem | 13.9% | 8.0%(+5.86)#54 | 6.2%(+7.63)#1,837 |
| 55. | Winfield | 13.7% | 8.0%(+5.70)#55 | 6.2%(+7.47)#1,908 |
| 56. | Man | 13.7% | 8.0%(+5.68)#56 | 6.2%(+7.44)#1,921 |
| 57. | Cross Lanes | 13.7% | 8.0%(+5.67)#57 | 6.2%(+7.44)#1,924 |
| 58. | Pinch | 13.5% | 8.0%(+5.54)#58 | 6.2%(+7.30)#1,962 |
| 59. | Clay | 13.5% | 8.0%(+5.45)#59 | 6.2%(+7.22)#1,995 |
| 60. | Accoville | 13.2% | 8.0%(+5.20)#60 | 6.2%(+6.96)#2,099 |
| 61. | Camden On Gauley | 13.2% | 8.0%(+5.20)#61 | 6.2%(+6.96)#2,100 |
| 62. | West Dunbar | 13.0% | 8.0%(+5.01)#62 | 6.2%(+6.78)#2,176 |
| 63. | Mabscott | 13.0% | 8.0%(+4.99)#63 | 6.2%(+6.75)#2,192 |
| 64. | Ripley | 12.9% | 8.0%(+4.88)#64 | 6.2%(+6.65)#2,249 |
| 65. | Frank | 12.8% | 8.0%(+4.76)#65 | 6.2%(+6.52)#2,301 |
| 66. | Alderson | 12.7% | 8.0%(+4.70)#66 | 6.2%(+6.47)#2,325 |
| 67. | Lost Creek | 12.6% | 8.0%(+4.55)#67 | 6.2%(+6.32)#2,392 |
| 68. | Greenville | 12.4% | 8.0%(+4.39)#68 | 6.2%(+6.15)#2,482 |
| 69. | Clearview | 12.3% | 8.0%(+4.32)#69 | 6.2%(+6.09)#2,515 |
| 70. | Friendly | 12.2% | 8.0%(+4.18)#70 | 6.2%(+5.95)#2,582 |
| 71. | Boomer | 12.0% | 8.0%(+3.97)#71 | 6.2%(+5.73)#2,689 |
| 72. | Chesapeake | 12.0% | 8.0%(+3.96)#72 | 6.2%(+5.73)#2,690 |
| 73. | Mannington | 11.9% | 8.0%(+3.89)#73 | 6.2%(+5.66)#2,720 |
| 74. | Pea Ridge | 11.8% | 8.0%(+3.81)#74 | 6.2%(+5.58)#2,765 |
| 75. | Idamay | 11.7% | 8.0%(+3.66)#75 | 6.2%(+5.42)#2,853 |
| 76. | White Hall | 11.7% | 8.0%(+3.64)#76 | 6.2%(+5.41)#2,869 |
| 77. | Despard | 11.7% | 8.0%(+3.64)#77 | 6.2%(+5.41)#2,870 |
| 78. | Chelyan | 11.6% | 8.0%(+3.60)#78 | 6.2%(+5.37)#2,897 |
| 79. | Greenview | 11.6% | 8.0%(+3.58)#79 | 6.2%(+5.35)#2,914 |
| 80. | Beaver | 11.5% | 8.0%(+3.53)#80 | 6.2%(+5.29)#2,945 |
| 81. | Northfork | 11.3% | 8.0%(+3.29)#81 | 6.2%(+5.06)#3,118 |
| 82. | Charleston | 11.3% | 8.0%(+3.24)#82 | 6.2%(+5.01)#3,152 |
| 83. | Oak Hill | 11.2% | 8.0%(+3.15)#83 | 6.2%(+4.91)#3,218 |
| 84. | Tunnelton | 10.9% | 8.0%(+2.87)#84 | 6.2%(+4.64)#3,399 |
| 85. | Pineville | 10.8% | 8.0%(+2.77)#85 | 6.2%(+4.54)#3,484 |
| 86. | Richwood | 10.7% | 8.0%(+2.74)#86 | 6.2%(+4.50)#3,520 |
| 87. | Sissonville | 10.5% | 8.0%(+2.53)#87 | 6.2%(+4.29)#3,698 |
| 88. | Bayard | 10.3% | 8.0%(+2.25)#88 | 6.2%(+4.01)#3,962 |
| 89. | War | 10.2% | 8.0%(+2.19)#89 | 6.2%(+3.96)#4,006 |
| 90. | Stanaford | 10.1% | 8.0%(+2.09)#90 | 6.2%(+3.86)#4,103 |
| 91. | Beckley | 10.1% | 8.0%(+2.06)#91 | 6.2%(+3.82)#4,133 |
| 92. | Philippi | 9.9% | 8.0%(+1.88)#92 | 6.2%(+3.65)#4,320 |
| 93. | Lubeck | 9.8% | 8.0%(+1.81)#93 | 6.2%(+3.57)#4,409 |
| 94. | Vienna | 9.8% | 8.0%(+1.79)#94 | 6.2%(+3.56)#4,424 |
| 95. | Windsor Heights | 9.8% | 8.0%(+1.79)#95 | 6.2%(+3.56)#4,427 |
| 96. | Hamlin | 9.8% | 8.0%(+1.79)#96 | 6.2%(+3.55)#4,438 |
| 97. | Williamson | 9.7% | 8.0%(+1.67)#97 | 6.2%(+3.44)#4,553 |
| 98. | Aurora | 9.7% | 8.0%(+1.67)#98 | 6.2%(+3.43)#4,564 |
| 99. | Farmington | 9.7% | 8.0%(+1.65)#99 | 6.2%(+3.42)#4,581 |
| 100. | New Cumberland | 9.6% | 8.0%(+1.63)#100 | 6.2%(+3.40)#4,597 |
Common Questions
What are the Top 10 Cities with the Highest Percentage of Population Employed in Health Diagnosing & Treating in West Virginia?
Top 10 Cities with the Highest Percentage of Population Employed in Health Diagnosing & Treating in West Virginia are:
#1
100.0%
#2
54.5%
#3
41.7%
#4
36.1%
#5
36.0%
#6
35.6%
#7
35.2%
#8
34.3%
#9
28.8%
#10
26.0%
What city has the Highest Percentage of Population Employed in Health Diagnosing & Treating in West Virginia?
Crumpler has the Highest Percentage of Population Employed in Health Diagnosing & Treating in West Virginia with 100.0%.
What is the Percentage of Population Employed in Health Diagnosing & Treating in the State of West Virginia?
Percentage of Population Employed in Health Diagnosing & Treating in West Virginia is 8.0%.
What is the Percentage of Population Employed in Health Diagnosing & Treating in the United States?
Percentage of Population Employed in Health Diagnosing & Treating in the United States is 6.2%.