Bishop, CA Map & Demographics
Bishop Map
Bishop Overview
$47,064
PER CAPITA INCOME
$102,982
AVG FAMILY INCOME
$75,451
AVG HOUSEHOLD INCOME
14.9%
WAGE / INCOME GAP [ % ]
85.1¢/ $1
WAGE / INCOME GAP [ $ ]
0.38
INEQUALITY / GINI INDEX
3,802
TOTAL POPULATION
1,560
MALE POPULATION
2,242
FEMALE POPULATION
69.58
MALES / 100 FEMALES
143.72
FEMALES / 100 MALES
48.6
MEDIAN AGE
2.7
AVG FAMILY SIZE
1.8
AVG HOUSEHOLD SIZE
2,281
LABOR FORCE [ PEOPLE ]
67.9%
PERCENT IN LABOR FORCE
2.7%
UNEMPLOYMENT RATE
Bishop Zip Codes
Income in Bishop
Income Overview in Bishop
Per Capita Income in Bishop is $47,064, while median incomes of families and households are $102,982 and $75,451 respectively.
| Characteristic | Number | Measure |
| Per Capita Income | 3,802 | $47,064 |
| Median Family Income | 864 | $102,982 |
| Mean Family Income | 864 | $118,097 |
| Median Household Income | 2,035 | $75,451 |
| Mean Household Income | 2,035 | $84,687 |
| Income Deficit | 864 | $0 |
| Wage / Income Gap (%) | 3,802 | 14.88% |
| Wage / Income Gap ($) | 3,802 | 85.12¢ per $1 |
| Gini / Inequality Index | 3,802 | 0.38 |
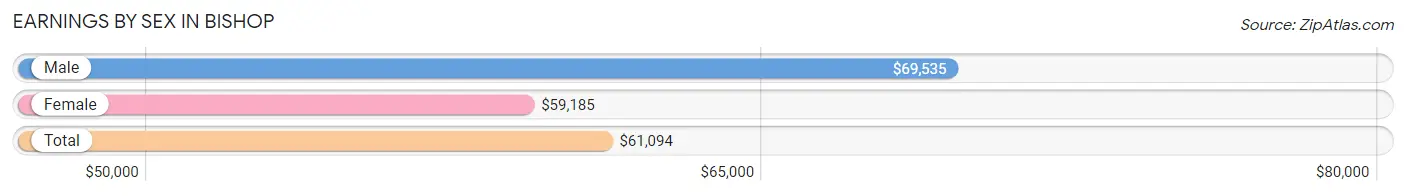
Earnings by Sex in Bishop
Average Earnings in Bishop are $61,094, $69,535 for men and $59,185 for women, a difference of 14.9%.
| Sex | Number | Average Earnings |
| Male | 1,007 (43.5%) | $69,535 |
| Female | 1,309 (56.5%) | $59,185 |
| Total | 2,316 (100.0%) | $61,094 |
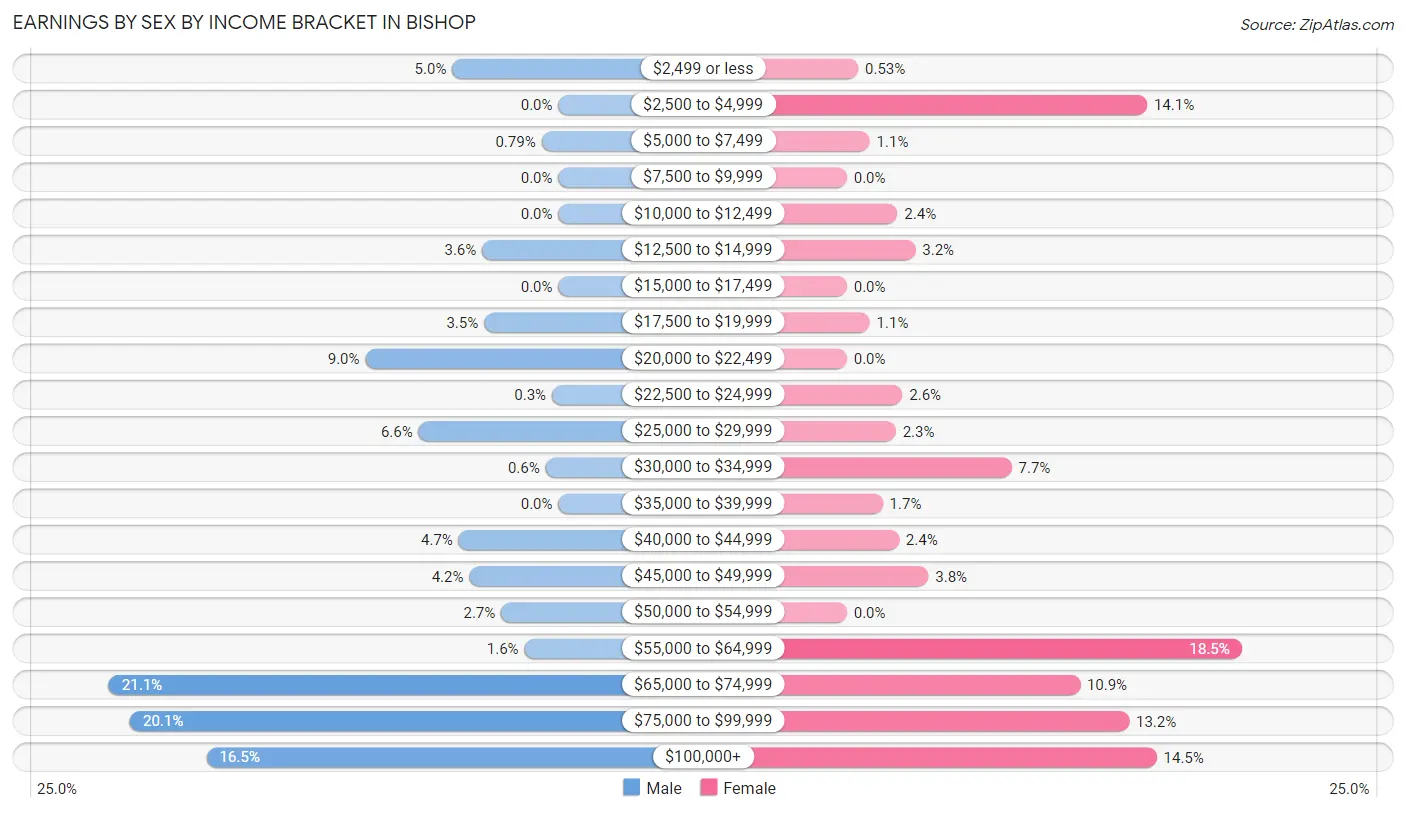
Earnings by Sex by Income Bracket in Bishop
The most common earnings brackets in Bishop are $65,000 to $74,999 for men (212 | 21.0%) and $55,000 to $64,999 for women (242 | 18.5%).
| Income | Male | Female |
| $2,499 or less | 50 (5.0%) | 7 (0.5%) |
| $2,500 to $4,999 | 0 (0.0%) | 184 (14.1%) |
| $5,000 to $7,499 | 8 (0.8%) | 14 (1.1%) |
| $7,500 to $9,999 | 0 (0.0%) | 0 (0.0%) |
| $10,000 to $12,499 | 0 (0.0%) | 31 (2.4%) |
| $12,500 to $14,999 | 36 (3.6%) | 42 (3.2%) |
| $15,000 to $17,499 | 0 (0.0%) | 0 (0.0%) |
| $17,500 to $19,999 | 35 (3.5%) | 14 (1.1%) |
| $20,000 to $22,499 | 91 (9.0%) | 0 (0.0%) |
| $22,500 to $24,999 | 3 (0.3%) | 34 (2.6%) |
| $25,000 to $29,999 | 66 (6.6%) | 30 (2.3%) |
| $30,000 to $34,999 | 6 (0.6%) | 101 (7.7%) |
| $35,000 to $39,999 | 0 (0.0%) | 22 (1.7%) |
| $40,000 to $44,999 | 47 (4.7%) | 32 (2.4%) |
| $45,000 to $49,999 | 42 (4.2%) | 50 (3.8%) |
| $50,000 to $54,999 | 27 (2.7%) | 0 (0.0%) |
| $55,000 to $64,999 | 16 (1.6%) | 242 (18.5%) |
| $65,000 to $74,999 | 212 (21.0%) | 143 (10.9%) |
| $75,000 to $99,999 | 202 (20.1%) | 173 (13.2%) |
| $100,000+ | 166 (16.5%) | 190 (14.5%) |
| Total | 1,007 (100.0%) | 1,309 (100.0%) |
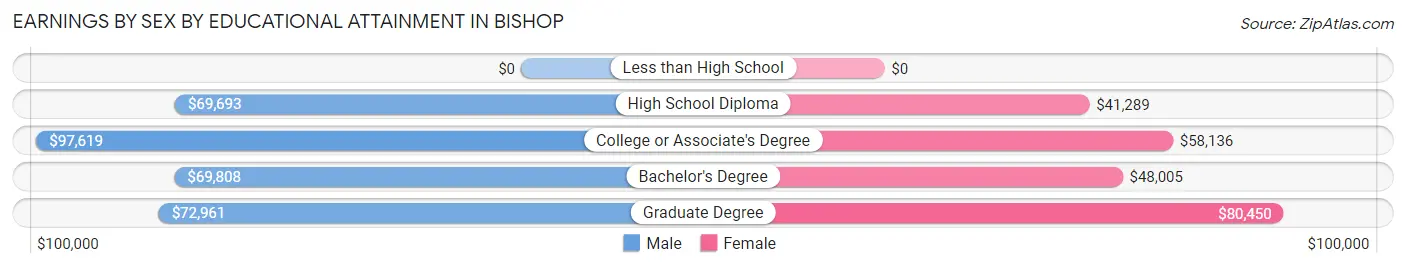
Earnings by Sex by Educational Attainment in Bishop
Average earnings in Bishop are $73,157 for men and $58,806 for women, a difference of 19.6%. Men with an educational attainment of college or associate's degree enjoy the highest average annual earnings of $97,619, while those with high school diploma education earn the least with $69,693. Women with an educational attainment of graduate degree earn the most with the average annual earnings of $80,450, while those with high school diploma education have the smallest earnings of $41,289.
| Educational Attainment | Male Income | Female Income |
| Less than High School | - | - |
| High School Diploma | $69,693 | $41,289 |
| College or Associate's Degree | $97,619 | $58,136 |
| Bachelor's Degree | $69,808 | $48,005 |
| Graduate Degree | $72,961 | $80,450 |
| Total | $73,157 | $58,806 |
Family Income in Bishop
Family Income Brackets in Bishop
According to the Bishop family income data, there are 222 families falling into the $75,000 to $99,999 income range, which is the most common income bracket and makes up 25.7% of all families.
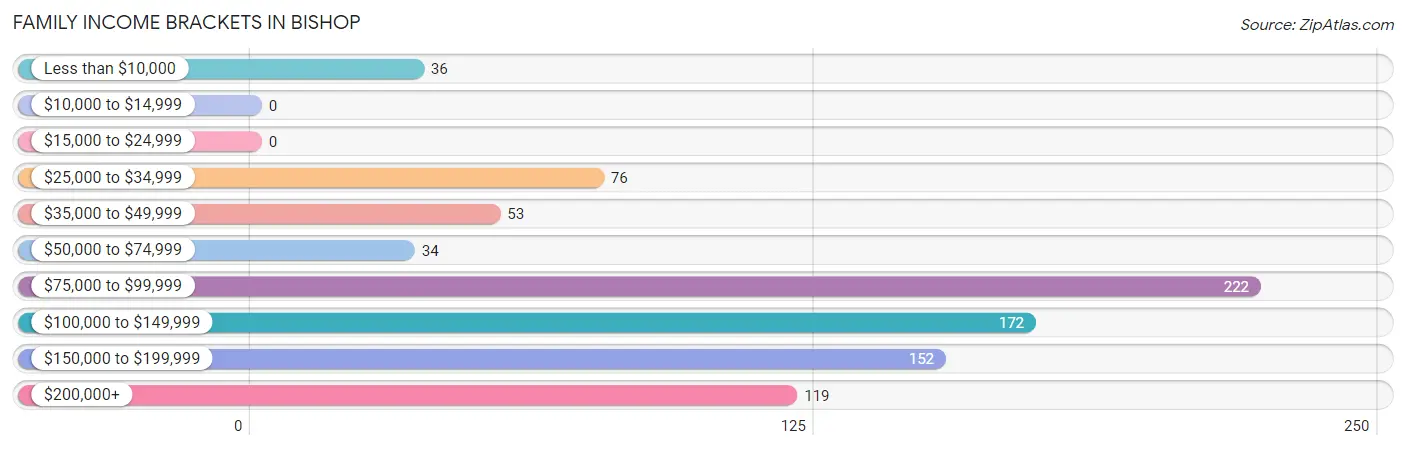
| Income Bracket | # Families | % Families |
| Less than $10,000 | 36 | 4.2% |
| $10,000 to $14,999 | 0 | 0.0% |
| $15,000 to $24,999 | 0 | 0.0% |
| $25,000 to $34,999 | 76 | 8.8% |
| $35,000 to $49,999 | 53 | 6.1% |
| $50,000 to $74,999 | 34 | 3.9% |
| $75,000 to $99,999 | 222 | 25.7% |
| $100,000 to $149,999 | 172 | 19.9% |
| $150,000 to $199,999 | 152 | 17.6% |
| $200,000+ | 119 | 13.8% |
Family Income by Famaliy Size in Bishop
2-person families (545 | 63.1%) account for the highest median family income in Bishop with $80,934 per family, while 2-person families (545 | 63.1%) have the highest median income of $40,467 per family member.
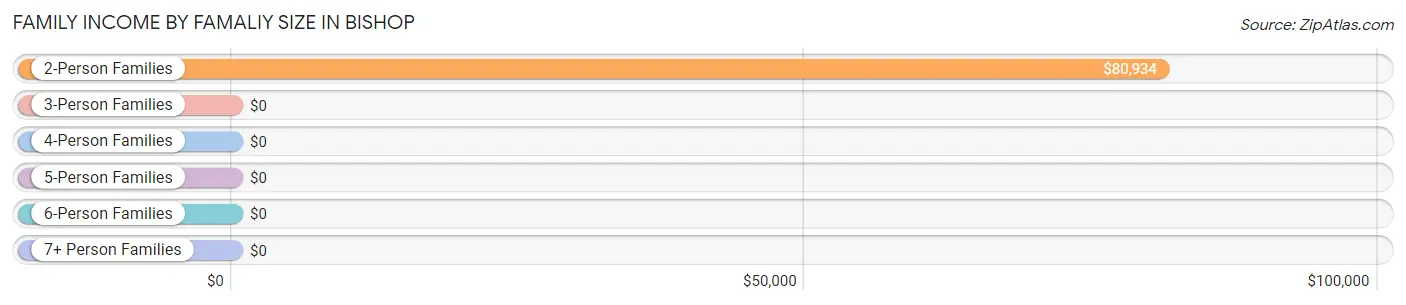
| Income Bracket | # Families | Median Income |
| 2-Person Families | 545 (63.1%) | $80,934 |
| 3-Person Families | 199 (23.0%) | $0 |
| 4-Person Families | 114 (13.2%) | $0 |
| 5-Person Families | 6 (0.7%) | $0 |
| 6-Person Families | 0 (0.0%) | $0 |
| 7+ Person Families | 0 (0.0%) | $0 |
| Total | 864 (100.0%) | $102,982 |
Family Income by Number of Earners in Bishop
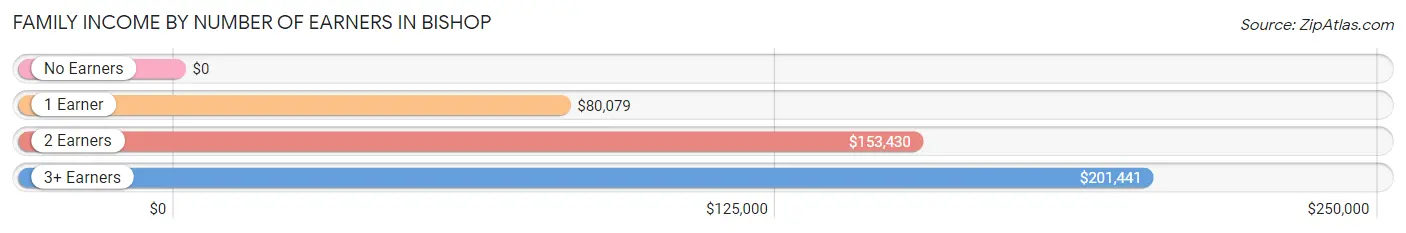
| Number of Earners | # Families | Median Income |
| No Earners | 145 (16.8%) | $0 |
| 1 Earner | 316 (36.6%) | $80,079 |
| 2 Earners | 301 (34.8%) | $153,430 |
| 3+ Earners | 102 (11.8%) | $201,441 |
| Total | 864 (100.0%) | $102,982 |
Household Income in Bishop
Household Income Brackets in Bishop
With 470 households falling in the category, the $75,000 to $99,999 income range is the most frequent in Bishop, accounting for 23.1% of all households. In contrast, only 59 households (2.9%) fall into the less than $10,000 income bracket, making it the least populous group.
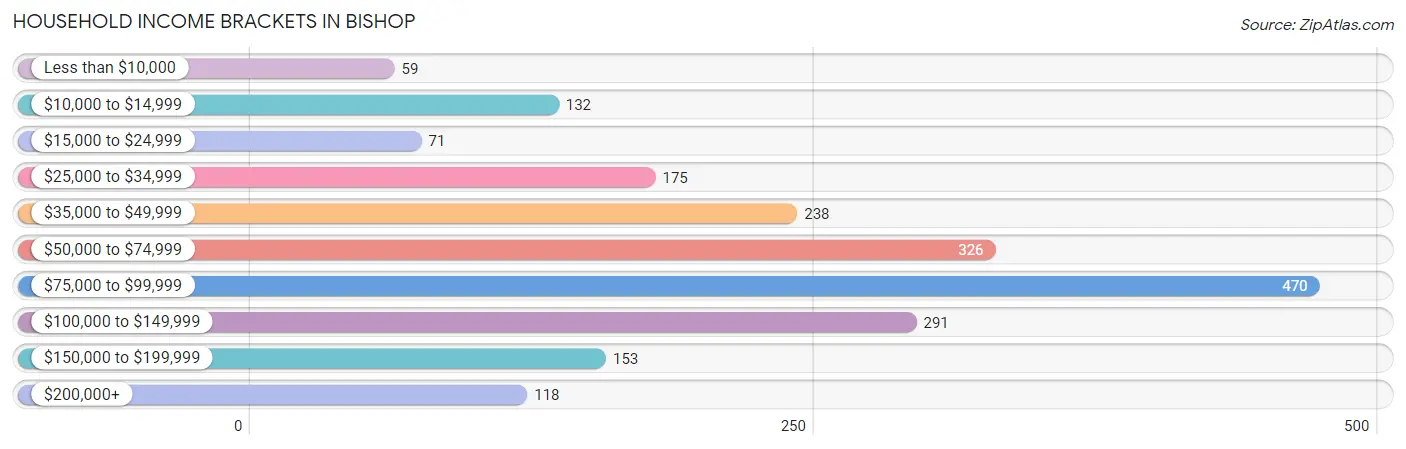
| Income Bracket | # Households | % Households |
| Less than $10,000 | 59 | 2.9% |
| $10,000 to $14,999 | 132 | 6.5% |
| $15,000 to $24,999 | 71 | 3.5% |
| $25,000 to $34,999 | 175 | 8.6% |
| $35,000 to $49,999 | 238 | 11.7% |
| $50,000 to $74,999 | 326 | 16.0% |
| $75,000 to $99,999 | 470 | 23.1% |
| $100,000 to $149,999 | 291 | 14.3% |
| $150,000 to $199,999 | 153 | 7.5% |
| $200,000+ | 118 | 5.8% |
Household Income by Householder Age in Bishop
The median household income in Bishop is $75,451, with the highest median household income of $86,979 found in the 25 to 44 years age bracket for the primary householder. A total of 491 households (24.1%) fall into this category.
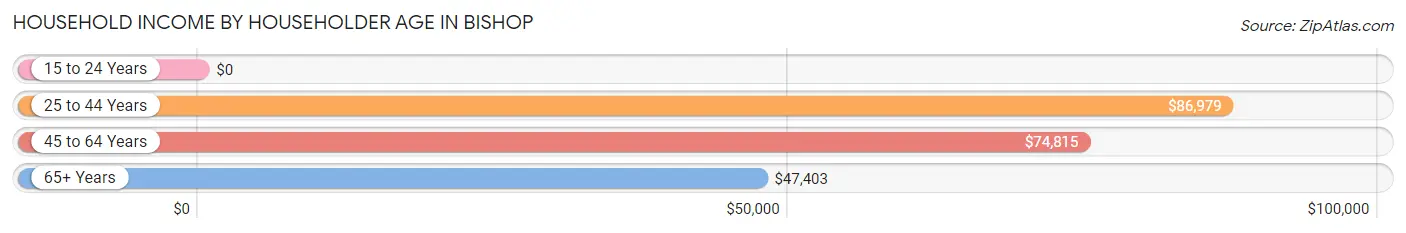
| Income Bracket | # Households | Median Income |
| 15 to 24 Years | 0 (0.0%) | $0 |
| 25 to 44 Years | 491 (24.1%) | $86,979 |
| 45 to 64 Years | 832 (40.9%) | $74,815 |
| 65+ Years | 712 (35.0%) | $47,403 |
| Total | 2,035 (100.0%) | $75,451 |
Poverty in Bishop
Income Below Poverty by Sex and Age in Bishop
With 10.3% poverty level for males and 5.2% for females among the residents of Bishop, 25 to 34 year old males and 55 to 64 year old females are the most vulnerable to poverty, with 30 males (36.6%) and 48 females (13.5%) in their respective age groups living below the poverty level.
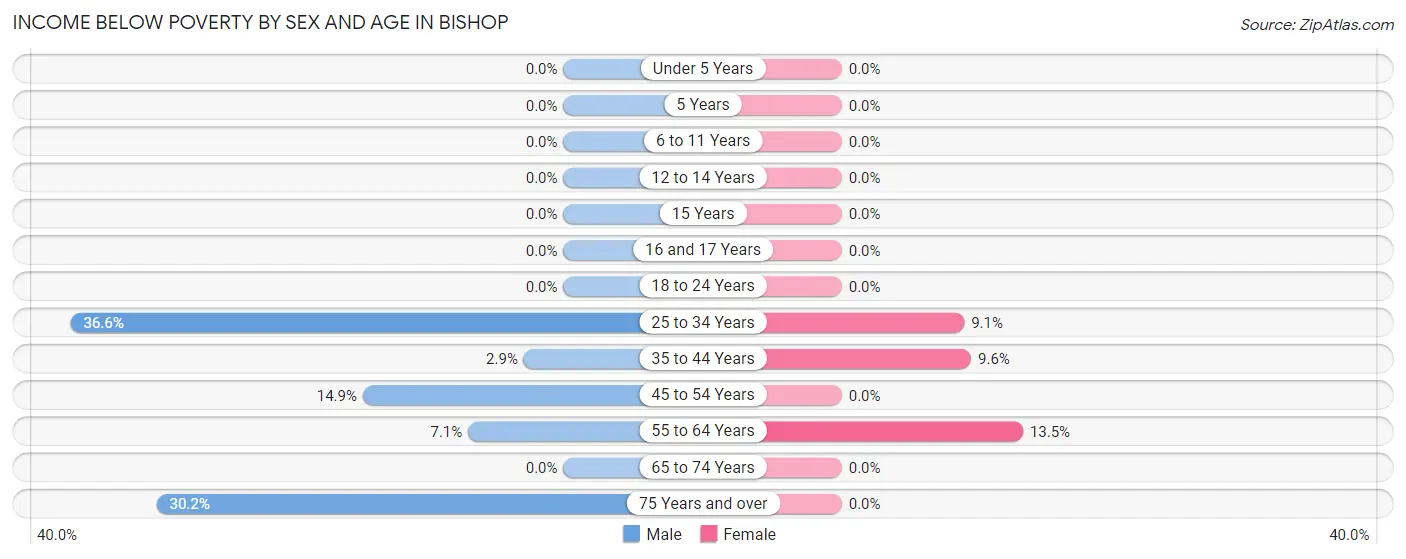
| Age Bracket | Male | Female |
| Under 5 Years | 0 (0.0%) | 0 (0.0%) |
| 5 Years | 0 (0.0%) | 0 (0.0%) |
| 6 to 11 Years | 0 (0.0%) | 0 (0.0%) |
| 12 to 14 Years | 0 (0.0%) | 0 (0.0%) |
| 15 Years | 0 (0.0%) | 0 (0.0%) |
| 16 and 17 Years | 0 (0.0%) | 0 (0.0%) |
| 18 to 24 Years | 0 (0.0%) | 0 (0.0%) |
| 25 to 34 Years | 30 (36.6%) | 43 (9.1%) |
| 35 to 44 Years | 6 (2.9%) | 24 (9.6%) |
| 45 to 54 Years | 39 (14.9%) | 0 (0.0%) |
| 55 to 64 Years | 22 (7.1%) | 48 (13.5%) |
| 65 to 74 Years | 0 (0.0%) | 0 (0.0%) |
| 75 Years and over | 61 (30.2%) | 0 (0.0%) |
| Total | 158 (10.3%) | 115 (5.2%) |
Income Above Poverty by Sex and Age in Bishop
According to the poverty statistics in Bishop, males aged under 5 years and females aged 5 years are the age groups that are most secure financially, with 100.0% of males and 100.0% of females in these age groups living above the poverty line.
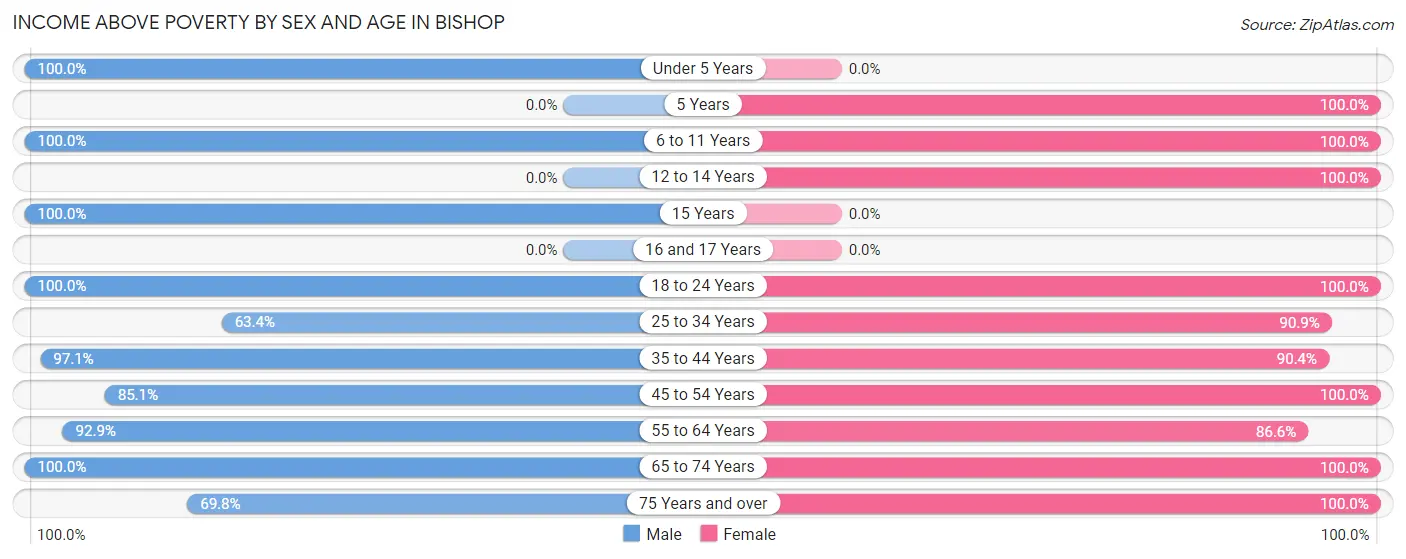
| Age Bracket | Male | Female |
| Under 5 Years | 14 (100.0%) | 0 (0.0%) |
| 5 Years | 0 (0.0%) | 95 (100.0%) |
| 6 to 11 Years | 76 (100.0%) | 170 (100.0%) |
| 12 to 14 Years | 0 (0.0%) | 59 (100.0%) |
| 15 Years | 29 (100.0%) | 0 (0.0%) |
| 16 and 17 Years | 0 (0.0%) | 0 (0.0%) |
| 18 to 24 Years | 97 (100.0%) | 102 (100.0%) |
| 25 to 34 Years | 52 (63.4%) | 430 (90.9%) |
| 35 to 44 Years | 198 (97.1%) | 226 (90.4%) |
| 45 to 54 Years | 223 (85.1%) | 252 (100.0%) |
| 55 to 64 Years | 289 (92.9%) | 309 (86.6%) |
| 65 to 74 Years | 262 (100.0%) | 150 (100.0%) |
| 75 Years and over | 141 (69.8%) | 281 (100.0%) |
| Total | 1,381 (89.7%) | 2,074 (94.8%) |
Income Below Poverty Among Married-Couple Families in Bishop
The poverty statistics for married-couple families in Bishop show that 5.1% or 36 of the total 707 families live below the poverty line. Families with no children have the highest poverty rate of 7.0%, comprising of 36 families. On the other hand, families with 1 or 2 children have the lowest poverty rate of 0.0%, which includes 0 families.
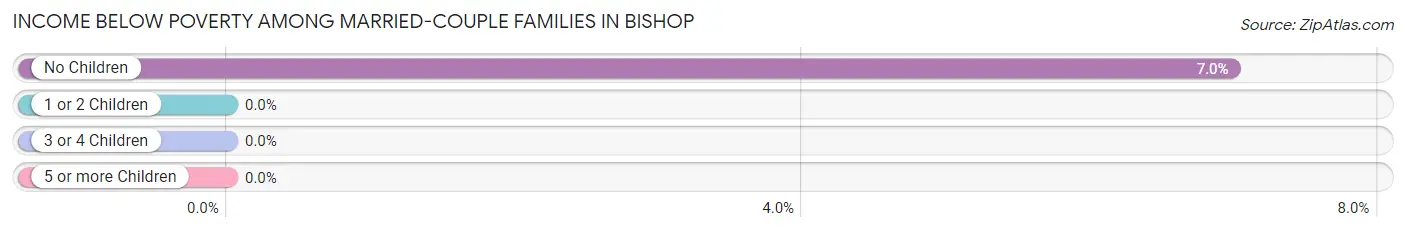
| Children | Above Poverty | Below Poverty |
| No Children | 480 (93.0%) | 36 (7.0%) |
| 1 or 2 Children | 191 (100.0%) | 0 (0.0%) |
| 3 or 4 Children | 0 (0.0%) | 0 (0.0%) |
| 5 or more Children | 0 (0.0%) | 0 (0.0%) |
| Total | 671 (94.9%) | 36 (5.1%) |
Income Below Poverty Among Single-Parent Households in Bishop
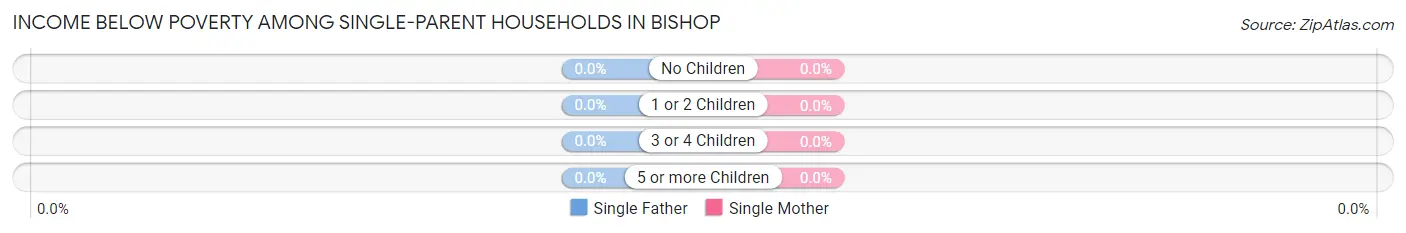
| Children | Single Father | Single Mother |
| No Children | 0 (0.0%) | 0 (0.0%) |
| 1 or 2 Children | 0 (0.0%) | 0 (0.0%) |
| 3 or 4 Children | 0 (0.0%) | 0 (0.0%) |
| 5 or more Children | 0 (0.0%) | 0 (0.0%) |
| Total | 0 (0.0%) | 0 (0.0%) |
Income Below Poverty Among Married-Couple vs Single-Parent Households in Bishop
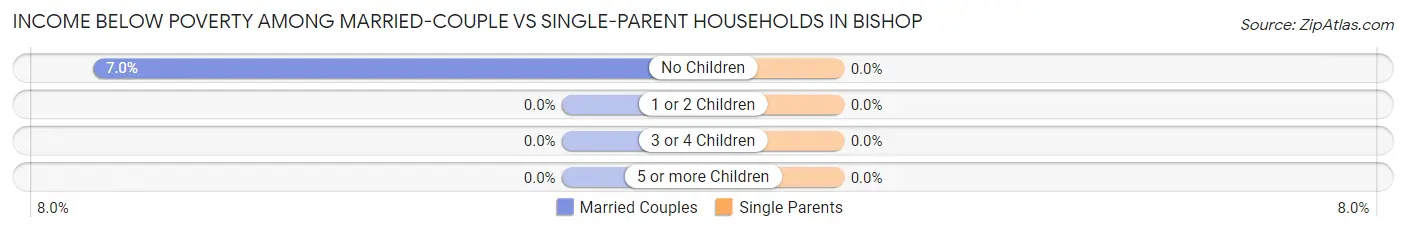
| Children | Married-Couple Families | Single-Parent Households |
| No Children | 36 (7.0%) | 0 (0.0%) |
| 1 or 2 Children | 0 (0.0%) | 0 (0.0%) |
| 3 or 4 Children | 0 (0.0%) | 0 (0.0%) |
| 5 or more Children | 0 (0.0%) | 0 (0.0%) |
| Total | 36 (5.1%) | 0 (0.0%) |
Race in Bishop
The most populous races in Bishop are White / Caucasian (3,209 | 84.4%), Hispanic or Latino (660 | 17.4%), and Two or more Races (454 | 11.9%).
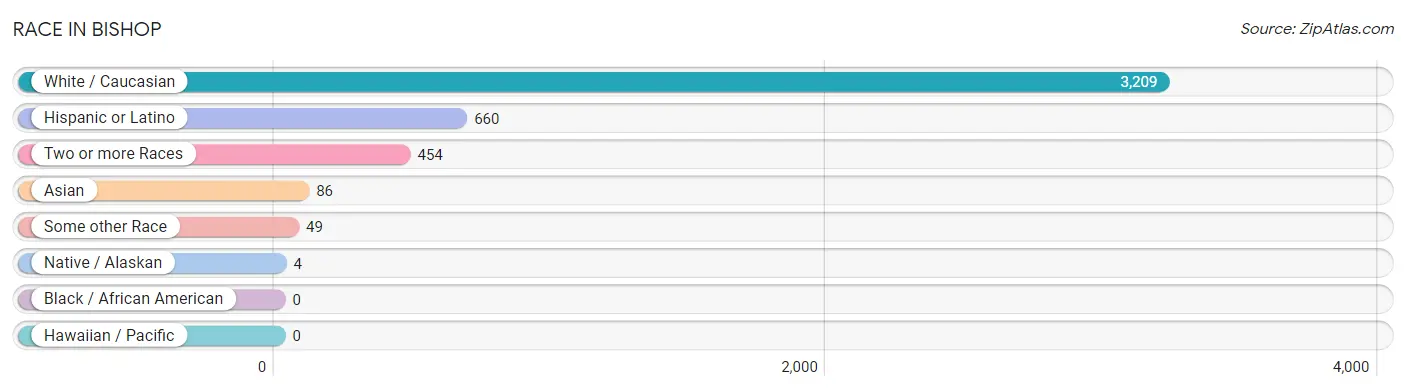
| Race | # Population | % Population |
| Asian | 86 | 2.3% |
| Black / African American | 0 | 0.0% |
| Hawaiian / Pacific | 0 | 0.0% |
| Hispanic or Latino | 660 | 17.4% |
| Native / Alaskan | 4 | 0.1% |
| White / Caucasian | 3,209 | 84.4% |
| Two or more Races | 454 | 11.9% |
| Some other Race | 49 | 1.3% |
| Total | 3,802 | 100.0% |
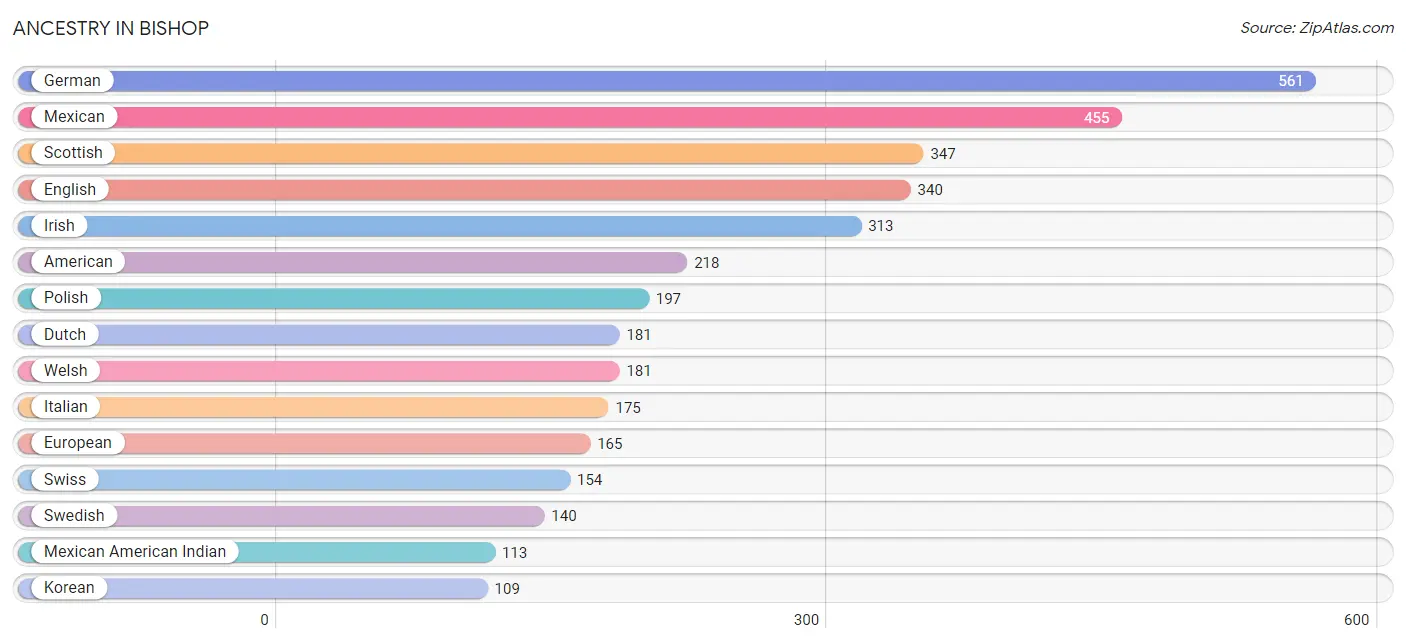
Ancestry in Bishop
The most populous ancestries reported in Bishop are German (561 | 14.8%), Mexican (455 | 12.0%), Scottish (347 | 9.1%), English (340 | 8.9%), and Irish (313 | 8.2%), together accounting for 53.0% of all Bishop residents.
| Ancestry | # Population | % Population |
| American | 218 | 5.7% |
| Arab | 23 | 0.6% |
| Armenian | 26 | 0.7% |
| Belgian | 14 | 0.4% |
| British | 90 | 2.4% |
| Cherokee | 3 | 0.1% |
| Czech | 14 | 0.4% |
| Dutch | 181 | 4.8% |
| Eastern European | 36 | 0.9% |
| English | 340 | 8.9% |
| European | 165 | 4.3% |
| French | 25 | 0.7% |
| German | 561 | 14.8% |
| Greek | 13 | 0.3% |
| Hungarian | 35 | 0.9% |
| Indian (Asian) | 35 | 0.9% |
| Irish | 313 | 8.2% |
| Italian | 175 | 4.6% |
| Korean | 109 | 2.9% |
| Latvian | 19 | 0.5% |
| Lithuanian | 10 | 0.3% |
| Mexican | 455 | 12.0% |
| Mexican American Indian | 113 | 3.0% |
| Paiute | 4 | 0.1% |
| Polish | 197 | 5.2% |
| Puerto Rican | 94 | 2.5% |
| Russian | 35 | 0.9% |
| Scottish | 347 | 9.1% |
| Spanish | 81 | 2.1% |
| Sri Lankan | 5 | 0.1% |
| Subsaharan African | 82 | 2.2% |
| Swedish | 140 | 3.7% |
| Swiss | 154 | 4.1% |
| Syrian | 23 | 0.6% |
| Ukrainian | 25 | 0.7% |
| Welsh | 181 | 4.8% | View All 36 Rows |
Immigrants in Bishop
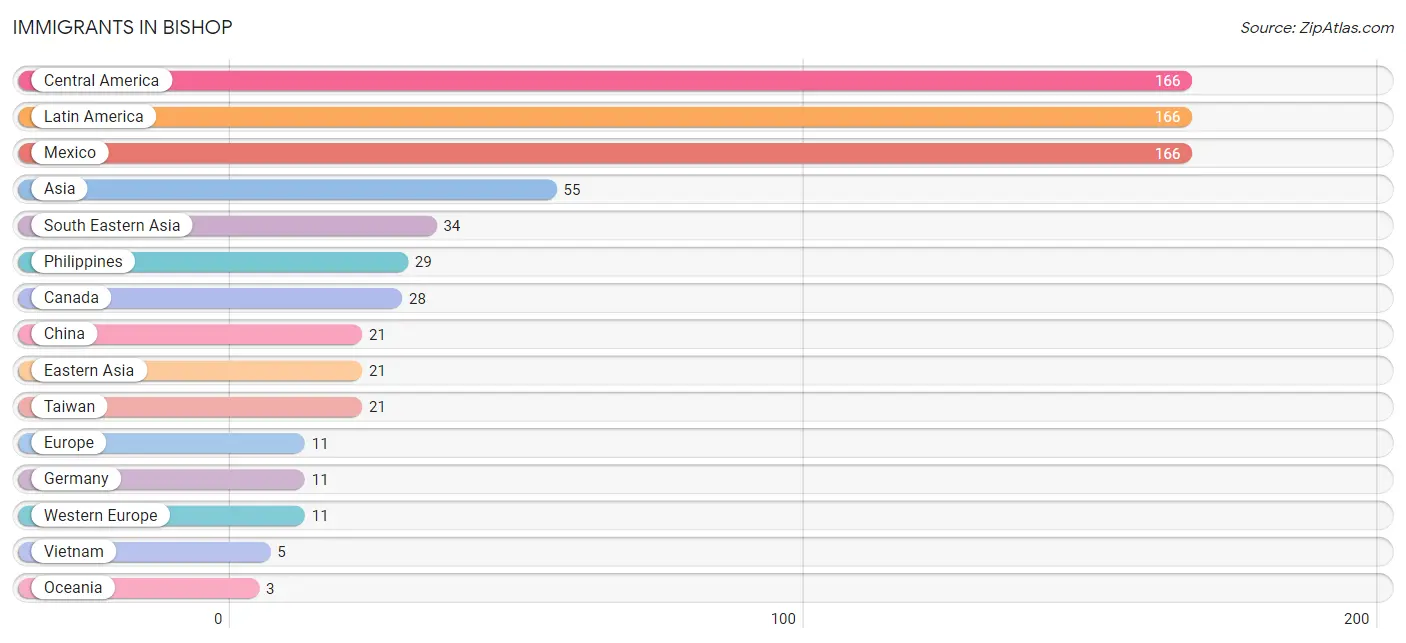
The most numerous immigrant groups reported in Bishop came from Central America (166 | 4.4%), Latin America (166 | 4.4%), Mexico (166 | 4.4%), Asia (55 | 1.5%), and South Eastern Asia (34 | 0.9%), together accounting for 15.4% of all Bishop residents.
| Immigration Origin | # Population | % Population |
| Asia | 55 | 1.5% |
| Canada | 28 | 0.7% |
| Central America | 166 | 4.4% |
| China | 21 | 0.5% |
| Eastern Asia | 21 | 0.5% |
| Europe | 11 | 0.3% |
| Germany | 11 | 0.3% |
| Latin America | 166 | 4.4% |
| Mexico | 166 | 4.4% |
| Oceania | 3 | 0.1% |
| Philippines | 29 | 0.8% |
| South Eastern Asia | 34 | 0.9% |
| Taiwan | 21 | 0.5% |
| Vietnam | 5 | 0.1% |
| Western Europe | 11 | 0.3% | View All 15 Rows |
Sex and Age in Bishop
Sex and Age in Bishop
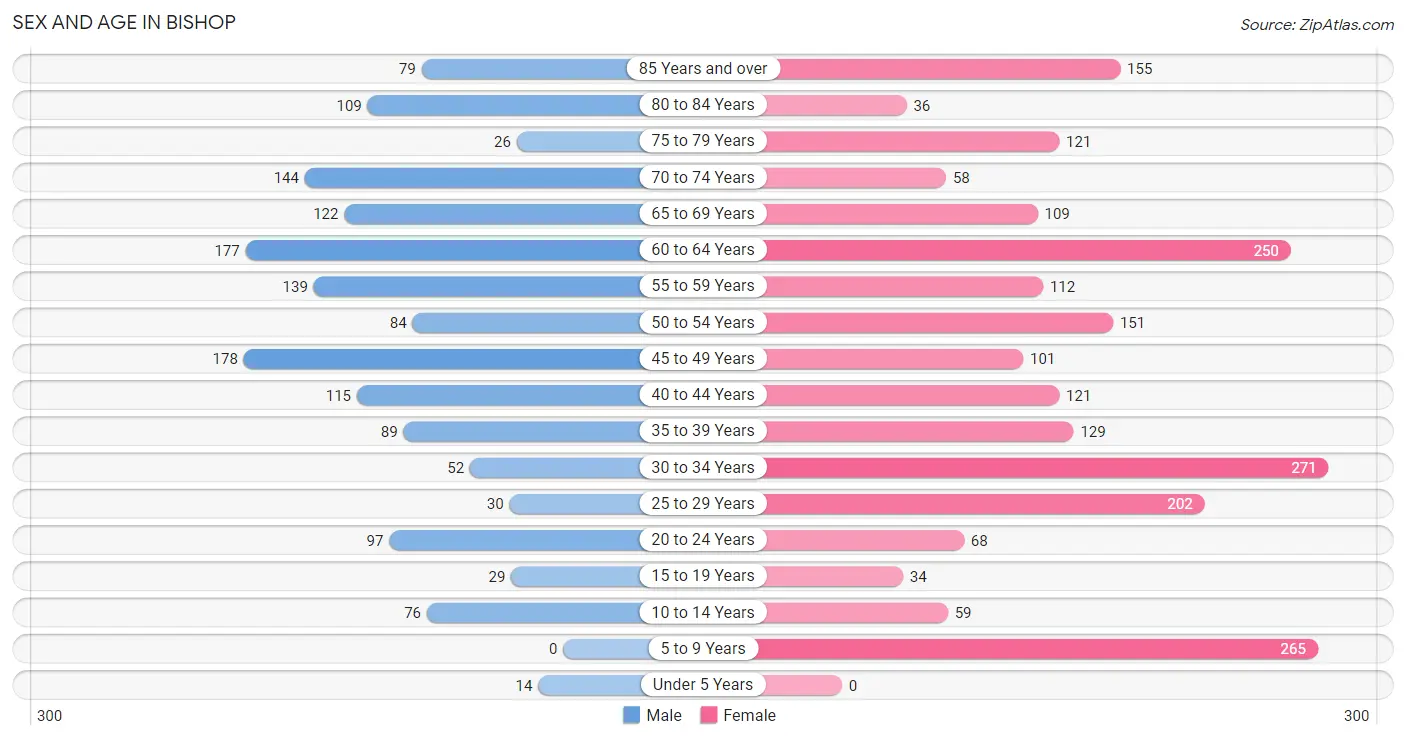
The most populous age groups in Bishop are 45 to 49 Years (178 | 11.4%) for men and 30 to 34 Years (271 | 12.1%) for women.
| Age Bracket | Male | Female |
| Under 5 Years | 14 (0.9%) | 0 (0.0%) |
| 5 to 9 Years | 0 (0.0%) | 265 (11.8%) |
| 10 to 14 Years | 76 (4.9%) | 59 (2.6%) |
| 15 to 19 Years | 29 (1.9%) | 34 (1.5%) |
| 20 to 24 Years | 97 (6.2%) | 68 (3.0%) |
| 25 to 29 Years | 30 (1.9%) | 202 (9.0%) |
| 30 to 34 Years | 52 (3.3%) | 271 (12.1%) |
| 35 to 39 Years | 89 (5.7%) | 129 (5.8%) |
| 40 to 44 Years | 115 (7.4%) | 121 (5.4%) |
| 45 to 49 Years | 178 (11.4%) | 101 (4.5%) |
| 50 to 54 Years | 84 (5.4%) | 151 (6.7%) |
| 55 to 59 Years | 139 (8.9%) | 112 (5.0%) |
| 60 to 64 Years | 177 (11.4%) | 250 (11.2%) |
| 65 to 69 Years | 122 (7.8%) | 109 (4.9%) |
| 70 to 74 Years | 144 (9.2%) | 58 (2.6%) |
| 75 to 79 Years | 26 (1.7%) | 121 (5.4%) |
| 80 to 84 Years | 109 (7.0%) | 36 (1.6%) |
| 85 Years and over | 79 (5.1%) | 155 (6.9%) |
| Total | 1,560 (100.0%) | 2,242 (100.0%) |
Families and Households in Bishop
Median Family Size in Bishop
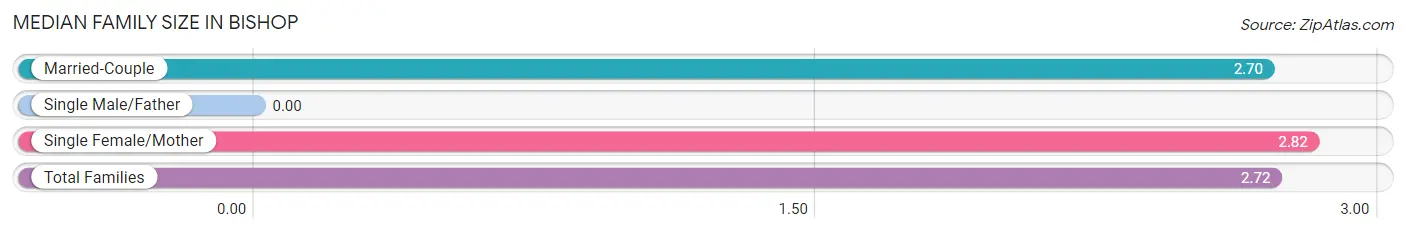
| Family Type | # Families | Family Size |
| Married-Couple | 707 (81.8%) | 2.70 |
| Single Male/Father | 0 (0.0%) | - |
| Single Female/Mother | 157 (18.2%) | 2.82 |
| Total Families | 864 (100.0%) | 2.72 |
Median Household Size in Bishop
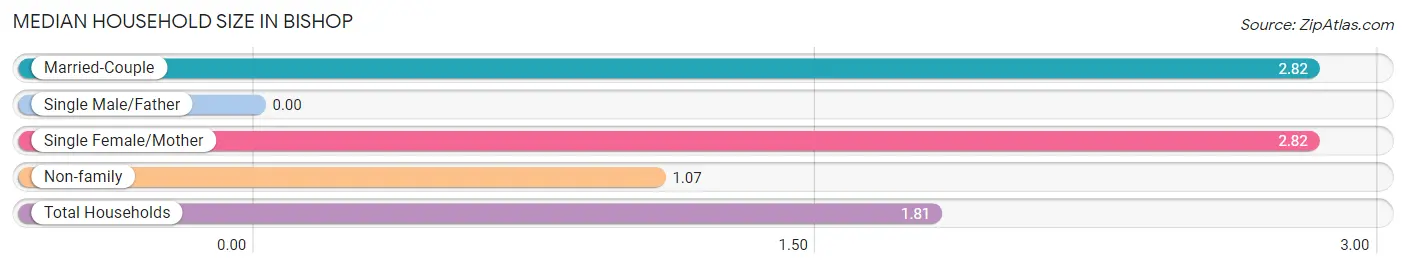
| Household Type | # Households | Household Size |
| Married-Couple | 707 (34.7%) | 2.82 |
| Single Male/Father | 0 (0.0%) | - |
| Single Female/Mother | 157 (7.7%) | 2.82 |
| Non-family | 1,171 (57.5%) | 1.07 |
| Total Households | 2,035 (100.0%) | 1.81 |
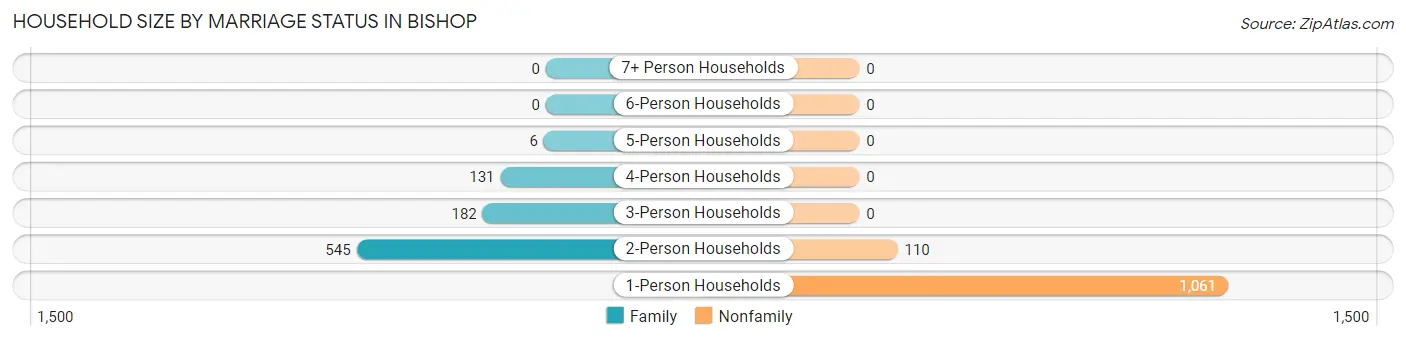
Household Size by Marriage Status in Bishop
Out of a total of 2,035 households in Bishop, 864 (42.5%) are family households, while 1,171 (57.5%) are nonfamily households. The most numerous type of family households are 2-person households, comprising 545, and the most common type of nonfamily households are 1-person households, comprising 1,061.
| Household Size | Family Households | Nonfamily Households |
| 1-Person Households | - | 1,061 (52.1%) |
| 2-Person Households | 545 (26.8%) | 110 (5.4%) |
| 3-Person Households | 182 (8.9%) | 0 (0.0%) |
| 4-Person Households | 131 (6.4%) | 0 (0.0%) |
| 5-Person Households | 6 (0.3%) | 0 (0.0%) |
| 6-Person Households | 0 (0.0%) | 0 (0.0%) |
| 7+ Person Households | 0 (0.0%) | 0 (0.0%) |
| Total | 864 (42.5%) | 1,171 (57.5%) |
Female Fertility in Bishop
Fertility by Age in Bishop
| Age Bracket | Women with Births | Births / 1,000 Women |
| 15 to 19 years | 0 (0.0%) | 0.0 |
| 20 to 34 years | 0 (0.0%) | 0.0 |
| 35 to 50 years | 0 (0.0%) | 0.0 |
| Total | 0 (0.0%) | 0.0 |
Fertility by Age by Marriage Status in Bishop
| Age Bracket | Married | Unmarried |
| 15 to 19 years | 0 (0.0%) | 0 (0.0%) |
| 20 to 34 years | 0 (0.0%) | 0 (0.0%) |
| 35 to 50 years | 0 (0.0%) | 0 (0.0%) |
| Total | 0 (0.0%) | 0 (0.0%) |
Fertility by Education in Bishop
| Educational Attainment | Women with Births | Births / 1,000 Women |
| Less than High School | 0 (0.0%) | 0.0 |
| High School Diploma | 0 (0.0%) | 0.0 |
| College or Associate's Degree | 0 (0.0%) | 0.0 |
| Bachelor's Degree | 0 (0.0%) | 0.0 |
| Graduate Degree | 0 (0.0%) | 0.0 |
| Total | 0 (0.0%) | 0.0 |
Fertility by Education by Marriage Status in Bishop
| Educational Attainment | Married | Unmarried |
| Less than High School | 0 (0.0%) | 0 (0.0%) |
| High School Diploma | 0 (0.0%) | 0 (0.0%) |
| College or Associate's Degree | 0 (0.0%) | 0 (0.0%) |
| Bachelor's Degree | 0 (0.0%) | 0 (0.0%) |
| Graduate Degree | 0 (0.0%) | 0 (0.0%) |
| Total | 0 (0.0%) | 0 (0.0%) |
Employment Characteristics in Bishop
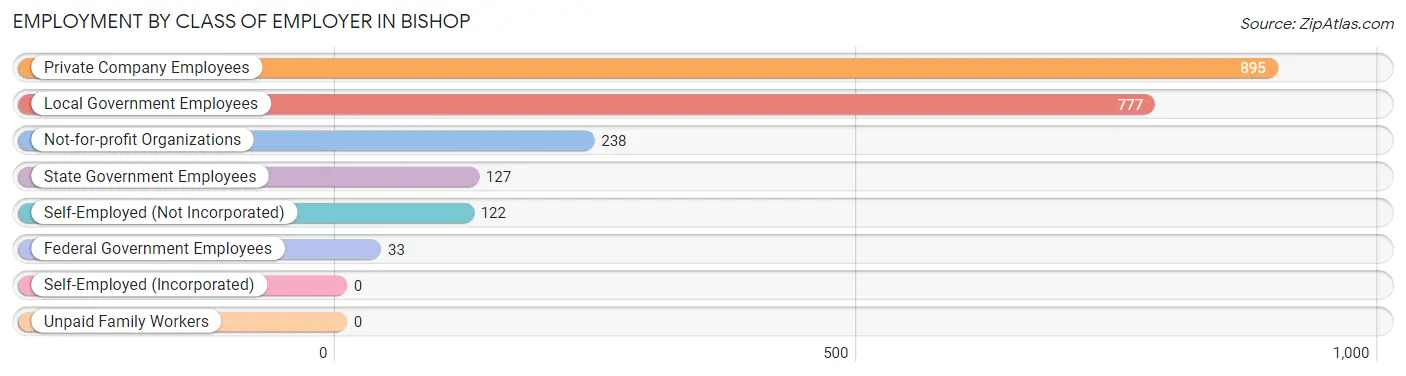
Employment by Class of Employer in Bishop
Among the 2,192 employed individuals in Bishop, private company employees (895 | 40.8%), local government employees (777 | 35.4%), and not-for-profit organizations (238 | 10.9%) make up the most common classes of employment.
| Employer Class | # Employees | % Employees |
| Private Company Employees | 895 | 40.8% |
| Self-Employed (Incorporated) | 0 | 0.0% |
| Self-Employed (Not Incorporated) | 122 | 5.6% |
| Not-for-profit Organizations | 238 | 10.9% |
| Local Government Employees | 777 | 35.4% |
| State Government Employees | 127 | 5.8% |
| Federal Government Employees | 33 | 1.5% |
| Unpaid Family Workers | 0 | 0.0% |
| Total | 2,192 | 100.0% |
Employment Status by Age in Bishop
According to the labor force statistics for Bishop, out of the total population over 16 years of age (3,359), 67.9% or 2,281 individuals are in the labor force, with 2.7% or 62 of them unemployed. The age group with the highest labor force participation rate is 16 to 19 years, with 100.0% or 34 individuals in the labor force. Within the labor force, the 75 years and over age range has the highest percentage of unemployed individuals, with 100.0% or 11 of them being unemployed.
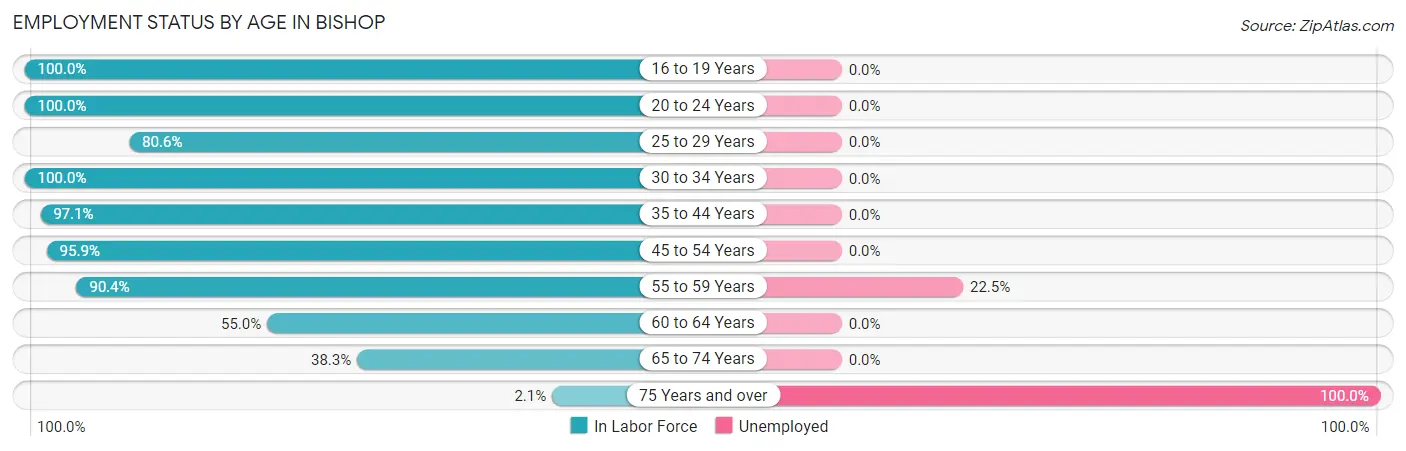
| Age Bracket | In Labor Force | Unemployed |
| 16 to 19 Years | 34 (100.0%) | 0 (0.0%) |
| 20 to 24 Years | 165 (100.0%) | 0 (0.0%) |
| 25 to 29 Years | 187 (80.6%) | 0 (0.0%) |
| 30 to 34 Years | 323 (100.0%) | 0 (0.0%) |
| 35 to 44 Years | 441 (97.1%) | 0 (0.0%) |
| 45 to 54 Years | 493 (95.9%) | 0 (0.0%) |
| 55 to 59 Years | 227 (90.4%) | 51 (22.5%) |
| 60 to 64 Years | 235 (55.0%) | 0 (0.0%) |
| 65 to 74 Years | 166 (38.3%) | 0 (0.0%) |
| 75 Years and over | 11 (2.1%) | 11 (100.0%) |
| Total | 2,281 (67.9%) | 62 (2.7%) |
Employment Status by Educational Attainment in Bishop
According to labor force statistics for Bishop, 86.6% of individuals (1,906) out of the total population between 25 and 64 years of age (2,201) are in the labor force, with 2.7% or 51 of them being unemployed. The group with the highest labor force participation rate are those with the educational attainment of college / associate degree, with 94.0% or 860 individuals in the labor force. Within the labor force, individuals with bachelor's degree or higher education have the highest percentage of unemployment, with 6.6% or 51 of them being unemployed.
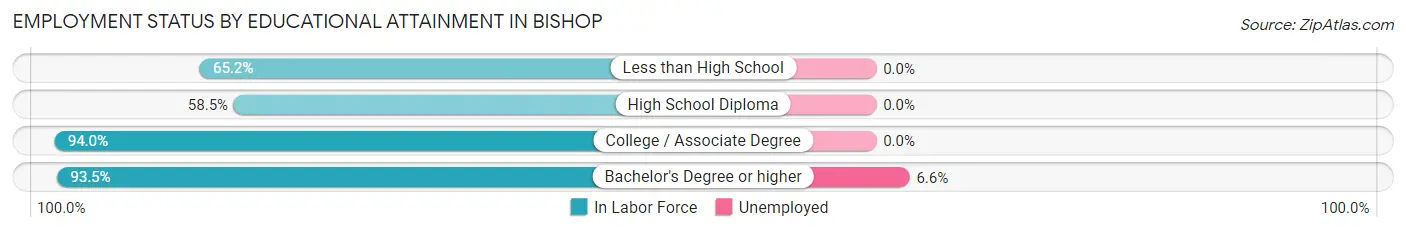
| Educational Attainment | In Labor Force | Unemployed |
| Less than High School | 30 (65.2%) | 0 (0.0%) |
| High School Diploma | 240 (58.5%) | 0 (0.0%) |
| College / Associate Degree | 860 (94.0%) | 0 (0.0%) |
| Bachelor's Degree or higher | 776 (93.5%) | 55 (6.6%) |
| Total | 1,906 (86.6%) | 59 (2.7%) |
Employment Occupations by Sex in Bishop
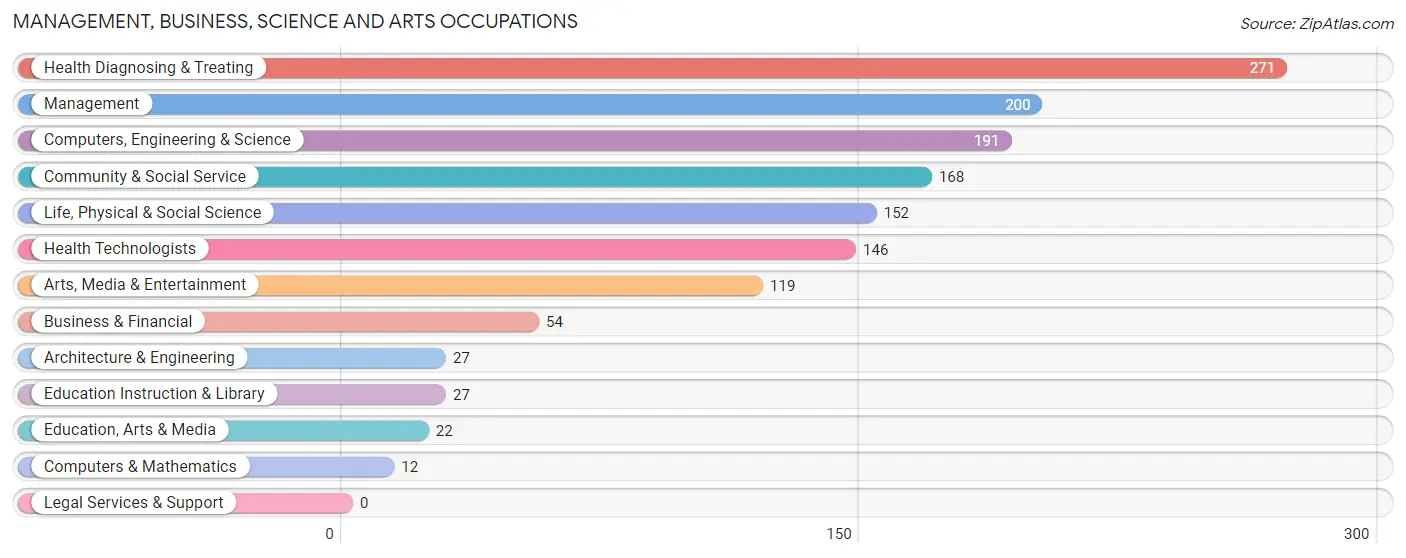
Management, Business, Science and Arts Occupations
The most common Management, Business, Science and Arts occupations in Bishop are Health Diagnosing & Treating (271 | 12.2%), Management (200 | 9.0%), Computers, Engineering & Science (191 | 8.6%), Community & Social Service (168 | 7.6%), and Life, Physical & Social Science (152 | 6.9%).
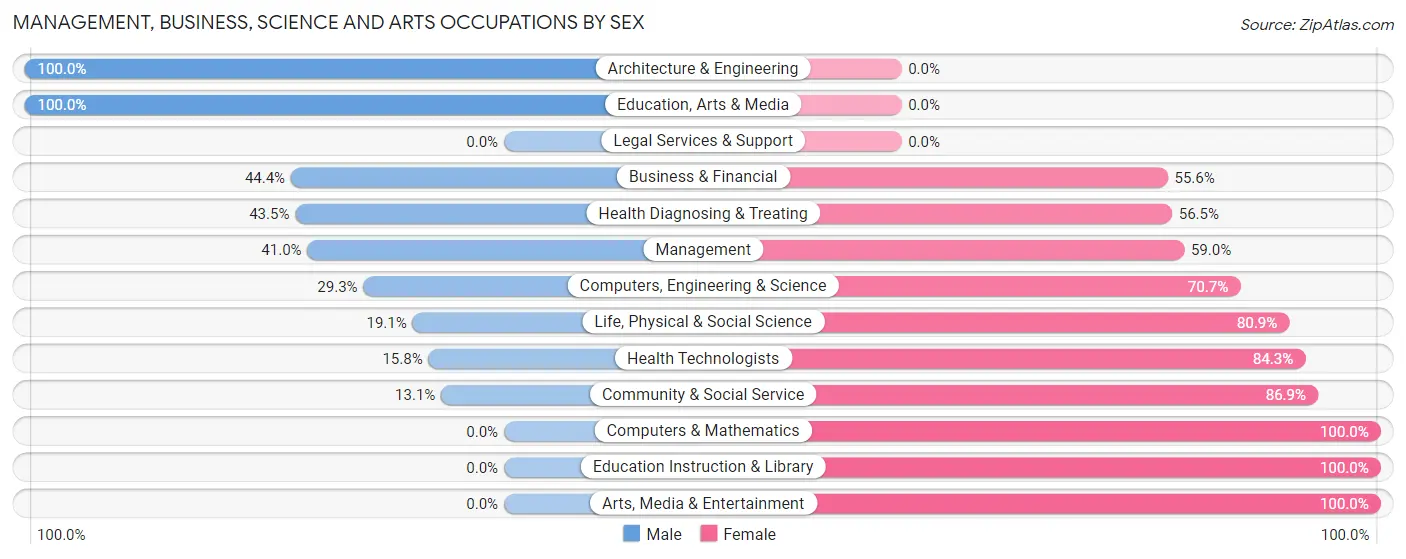
Management, Business, Science and Arts Occupations by Sex
Within the Management, Business, Science and Arts occupations in Bishop, the most male-oriented occupations are Architecture & Engineering (100.0%), Education, Arts & Media (100.0%), and Business & Financial (44.4%), while the most female-oriented occupations are Computers & Mathematics (100.0%), Education Instruction & Library (100.0%), and Arts, Media & Entertainment (100.0%).
| Occupation | Male | Female |
| Management | 82 (41.0%) | 118 (59.0%) |
| Business & Financial | 24 (44.4%) | 30 (55.6%) |
| Computers, Engineering & Science | 56 (29.3%) | 135 (70.7%) |
| Computers & Mathematics | 0 (0.0%) | 12 (100.0%) |
| Architecture & Engineering | 27 (100.0%) | 0 (0.0%) |
| Life, Physical & Social Science | 29 (19.1%) | 123 (80.9%) |
| Community & Social Service | 22 (13.1%) | 146 (86.9%) |
| Education, Arts & Media | 22 (100.0%) | 0 (0.0%) |
| Legal Services & Support | 0 (0.0%) | 0 (0.0%) |
| Education Instruction & Library | 0 (0.0%) | 27 (100.0%) |
| Arts, Media & Entertainment | 0 (0.0%) | 119 (100.0%) |
| Health Diagnosing & Treating | 118 (43.5%) | 153 (56.5%) |
| Health Technologists | 23 (15.8%) | 123 (84.3%) |
| Total (Category) | 302 (34.2%) | 582 (65.8%) |
| Total (Overall) | 911 (41.0%) | 1,309 (59.0%) |
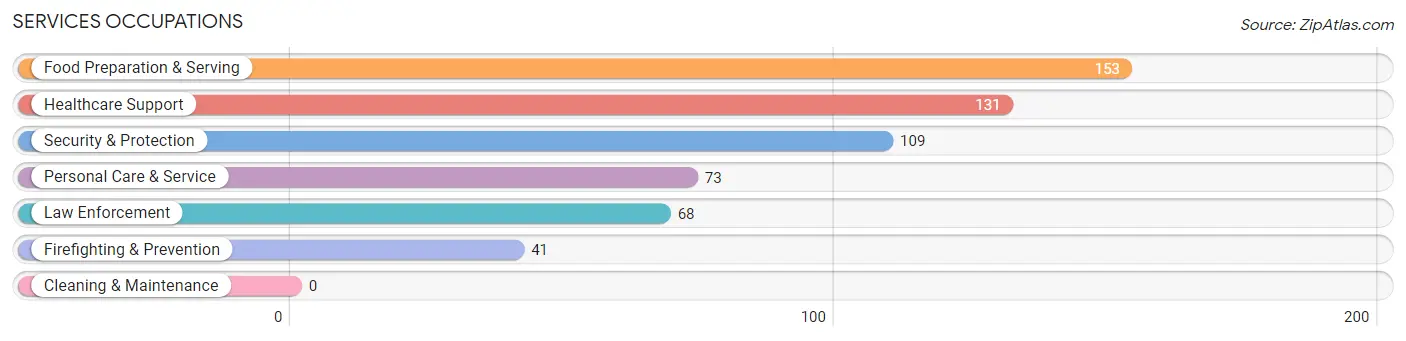
Services Occupations
The most common Services occupations in Bishop are Food Preparation & Serving (153 | 6.9%), Healthcare Support (131 | 5.9%), Security & Protection (109 | 4.9%), Personal Care & Service (73 | 3.3%), and Law Enforcement (68 | 3.1%).
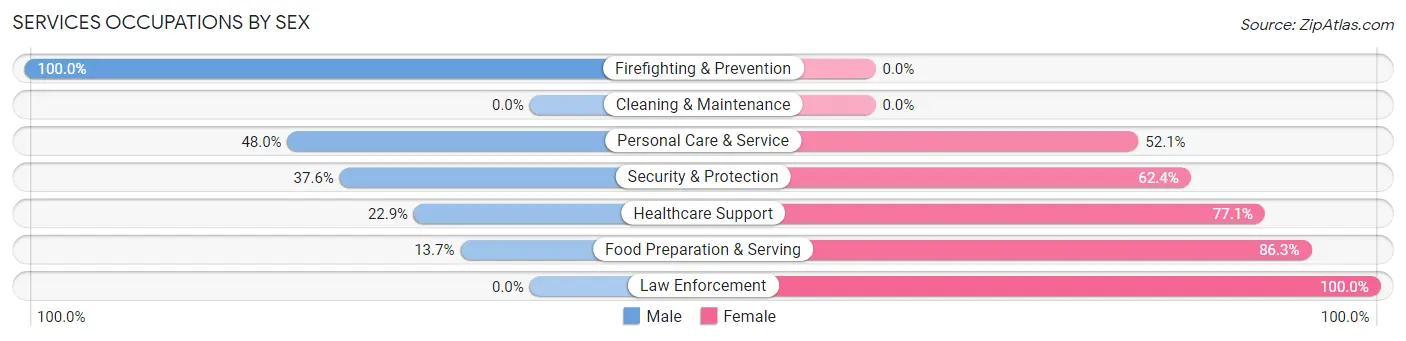
Services Occupations by Sex
Within the Services occupations in Bishop, the most male-oriented occupations are Firefighting & Prevention (100.0%), Personal Care & Service (47.9%), and Security & Protection (37.6%), while the most female-oriented occupations are Law Enforcement (100.0%), Food Preparation & Serving (86.3%), and Healthcare Support (77.1%).
| Occupation | Male | Female |
| Healthcare Support | 30 (22.9%) | 101 (77.1%) |
| Security & Protection | 41 (37.6%) | 68 (62.4%) |
| Firefighting & Prevention | 41 (100.0%) | 0 (0.0%) |
| Law Enforcement | 0 (0.0%) | 68 (100.0%) |
| Food Preparation & Serving | 21 (13.7%) | 132 (86.3%) |
| Cleaning & Maintenance | 0 (0.0%) | 0 (0.0%) |
| Personal Care & Service | 35 (47.9%) | 38 (52.0%) |
| Total (Category) | 127 (27.3%) | 339 (72.8%) |
| Total (Overall) | 911 (41.0%) | 1,309 (59.0%) |
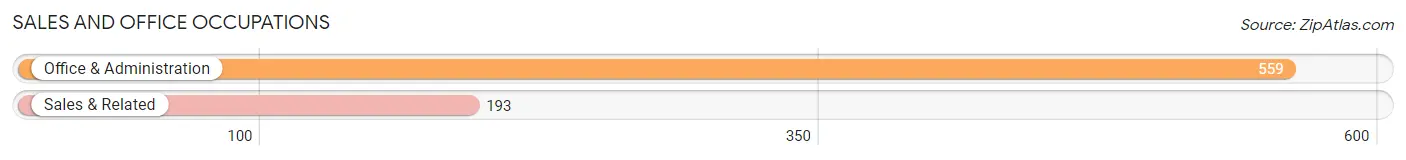
Sales and Office Occupations
The most common Sales and Office occupations in Bishop are Office & Administration (559 | 25.2%), and Sales & Related (193 | 8.7%).
Sales and Office Occupations by Sex
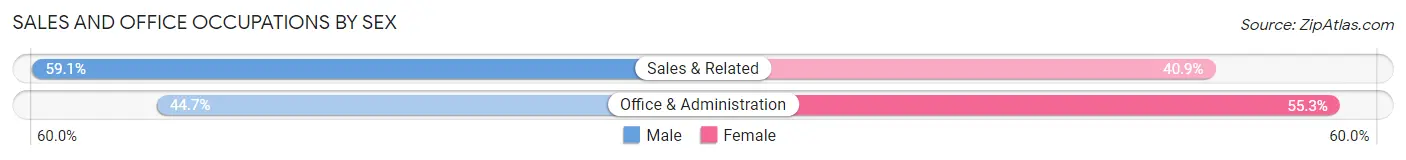
| Occupation | Male | Female |
| Sales & Related | 114 (59.1%) | 79 (40.9%) |
| Office & Administration | 250 (44.7%) | 309 (55.3%) |
| Total (Category) | 364 (48.4%) | 388 (51.6%) |
| Total (Overall) | 911 (41.0%) | 1,309 (59.0%) |
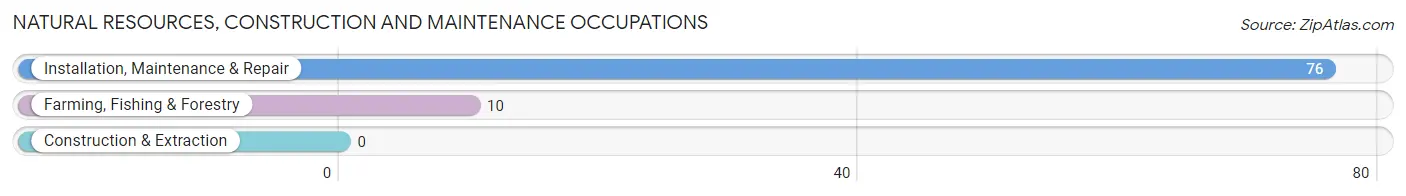
Natural Resources, Construction and Maintenance Occupations
The most common Natural Resources, Construction and Maintenance occupations in Bishop are Installation, Maintenance & Repair (76 | 3.4%), and Farming, Fishing & Forestry (10 | 0.4%).
Natural Resources, Construction and Maintenance Occupations by Sex
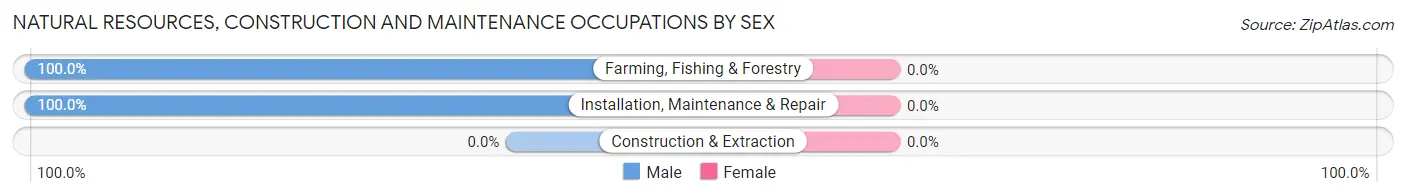
| Occupation | Male | Female |
| Farming, Fishing & Forestry | 10 (100.0%) | 0 (0.0%) |
| Construction & Extraction | 0 (0.0%) | 0 (0.0%) |
| Installation, Maintenance & Repair | 76 (100.0%) | 0 (0.0%) |
| Total (Category) | 86 (100.0%) | 0 (0.0%) |
| Total (Overall) | 911 (41.0%) | 1,309 (59.0%) |
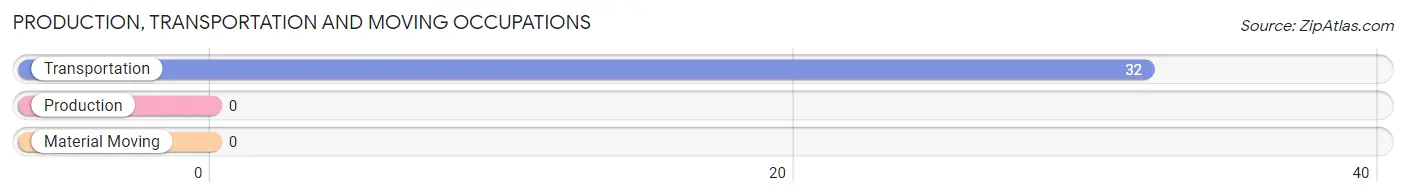
Production, Transportation and Moving Occupations
The most common Production, Transportation and Moving occupations in Bishop are , and Transportation (32 | 1.4%).
Production, Transportation and Moving Occupations by Sex
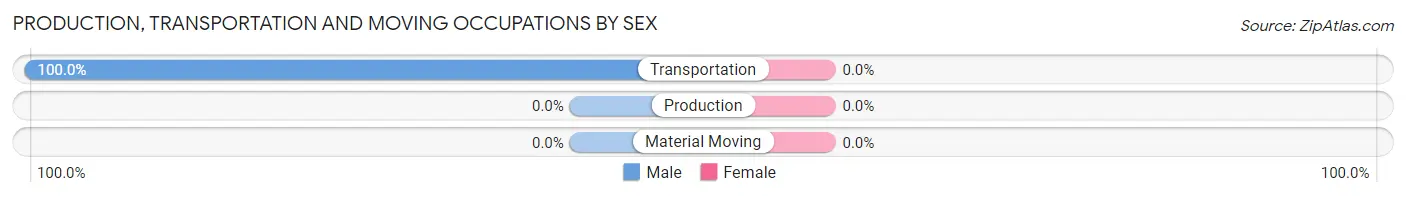
| Occupation | Male | Female |
| Production | 0 (0.0%) | 0 (0.0%) |
| Transportation | 32 (100.0%) | 0 (0.0%) |
| Material Moving | 0 (0.0%) | 0 (0.0%) |
| Total (Category) | 32 (100.0%) | 0 (0.0%) |
| Total (Overall) | 911 (41.0%) | 1,309 (59.0%) |
Employment Industries by Sex in Bishop
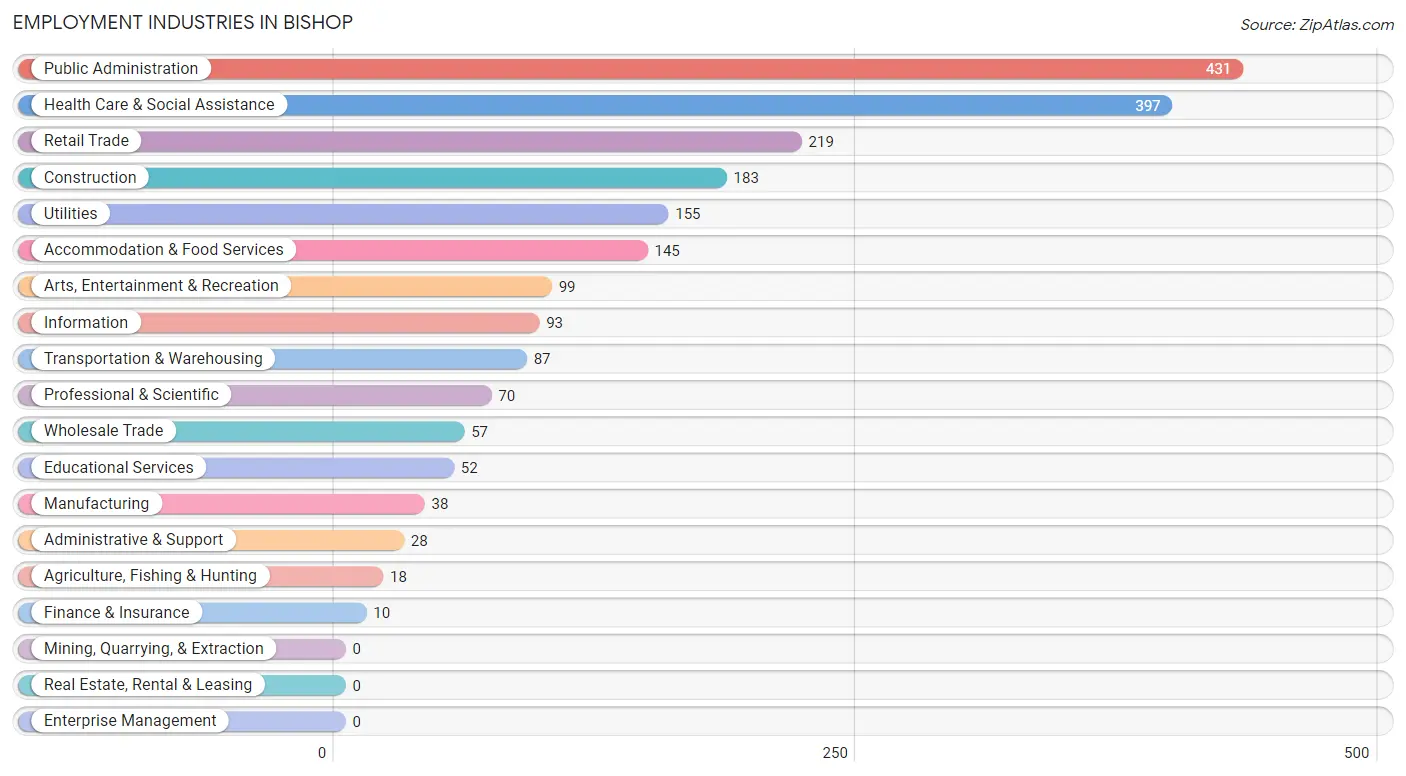
Employment Industries in Bishop
The major employment industries in Bishop include Public Administration (431 | 19.4%), Health Care & Social Assistance (397 | 17.9%), Retail Trade (219 | 9.9%), Construction (183 | 8.2%), and Utilities (155 | 7.0%).
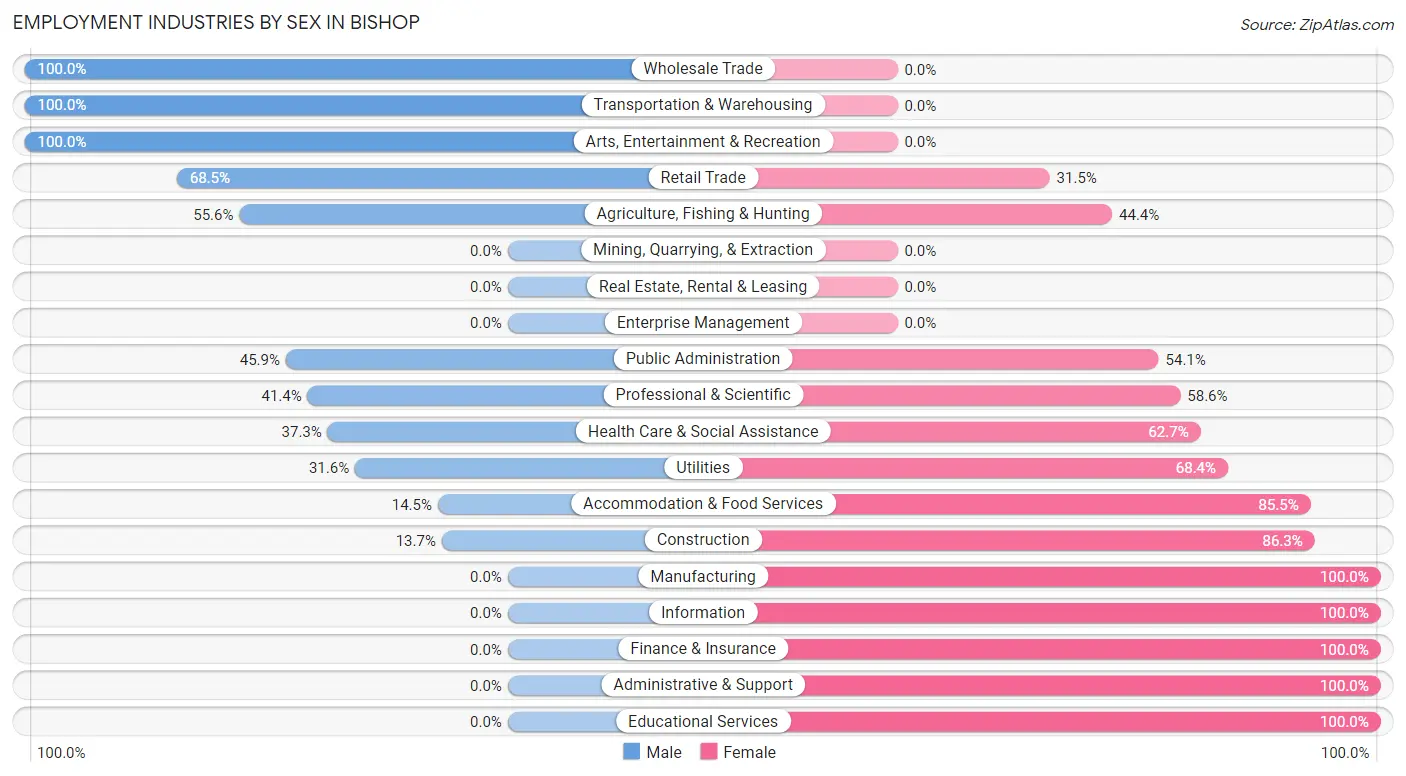
Employment Industries by Sex in Bishop
The Bishop industries that see more men than women are Wholesale Trade (100.0%), Transportation & Warehousing (100.0%), and Arts, Entertainment & Recreation (100.0%), whereas the industries that tend to have a higher number of women are Manufacturing (100.0%), Information (100.0%), and Finance & Insurance (100.0%).
| Industry | Male | Female |
| Agriculture, Fishing & Hunting | 10 (55.6%) | 8 (44.4%) |
| Mining, Quarrying, & Extraction | 0 (0.0%) | 0 (0.0%) |
| Construction | 25 (13.7%) | 158 (86.3%) |
| Manufacturing | 0 (0.0%) | 38 (100.0%) |
| Wholesale Trade | 57 (100.0%) | 0 (0.0%) |
| Retail Trade | 150 (68.5%) | 69 (31.5%) |
| Transportation & Warehousing | 87 (100.0%) | 0 (0.0%) |
| Utilities | 49 (31.6%) | 106 (68.4%) |
| Information | 0 (0.0%) | 93 (100.0%) |
| Finance & Insurance | 0 (0.0%) | 10 (100.0%) |
| Real Estate, Rental & Leasing | 0 (0.0%) | 0 (0.0%) |
| Professional & Scientific | 29 (41.4%) | 41 (58.6%) |
| Enterprise Management | 0 (0.0%) | 0 (0.0%) |
| Administrative & Support | 0 (0.0%) | 28 (100.0%) |
| Educational Services | 0 (0.0%) | 52 (100.0%) |
| Health Care & Social Assistance | 148 (37.3%) | 249 (62.7%) |
| Arts, Entertainment & Recreation | 99 (100.0%) | 0 (0.0%) |
| Accommodation & Food Services | 21 (14.5%) | 124 (85.5%) |
| Public Administration | 198 (45.9%) | 233 (54.1%) |
| Total | 911 (41.0%) | 1,309 (59.0%) |
Education in Bishop
School Enrollment in Bishop
The most common levels of schooling among the 592 students in Bishop are elementary school (182 | 30.7%), college / undergraduate (154 | 26.0%), and kindergarten (110 | 18.6%).
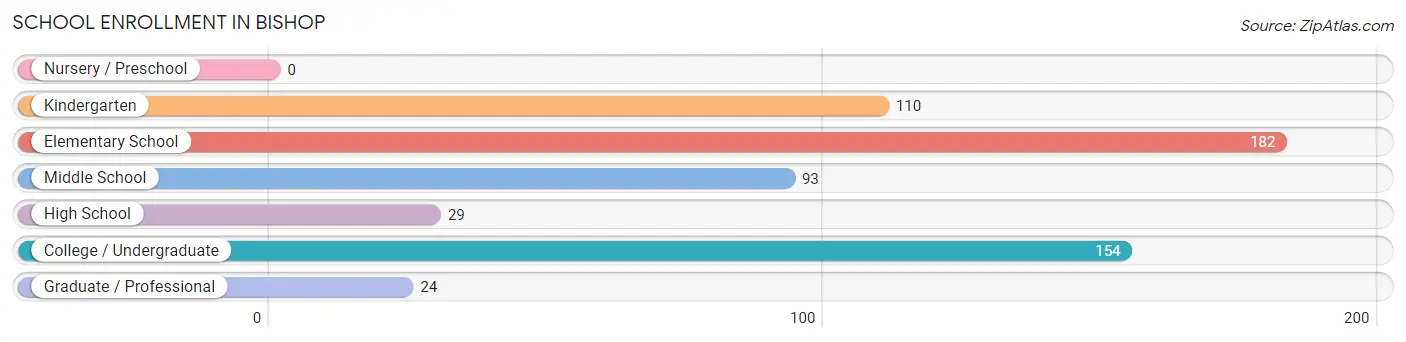
| School Level | # Students | % Students |
| Nursery / Preschool | 0 | 0.0% |
| Kindergarten | 110 | 18.6% |
| Elementary School | 182 | 30.7% |
| Middle School | 93 | 15.7% |
| High School | 29 | 4.9% |
| College / Undergraduate | 154 | 26.0% |
| Graduate / Professional | 24 | 4.1% |
| Total | 592 | 100.0% |
School Enrollment by Age by Funding Source in Bishop
Out of a total of 592 students who are enrolled in schools in Bishop, 147 (24.8%) attend a private institution, while the remaining 445 (75.2%) are enrolled in public schools. The age group of 20 to 24 year olds has the highest likelihood of being enrolled in private schools, with 68 (100.0% in the age bracket) enrolled. Conversely, the age group of 10 to 14 year olds has the lowest likelihood of being enrolled in a private school, with 135 (100.0% in the age bracket) attending a public institution.
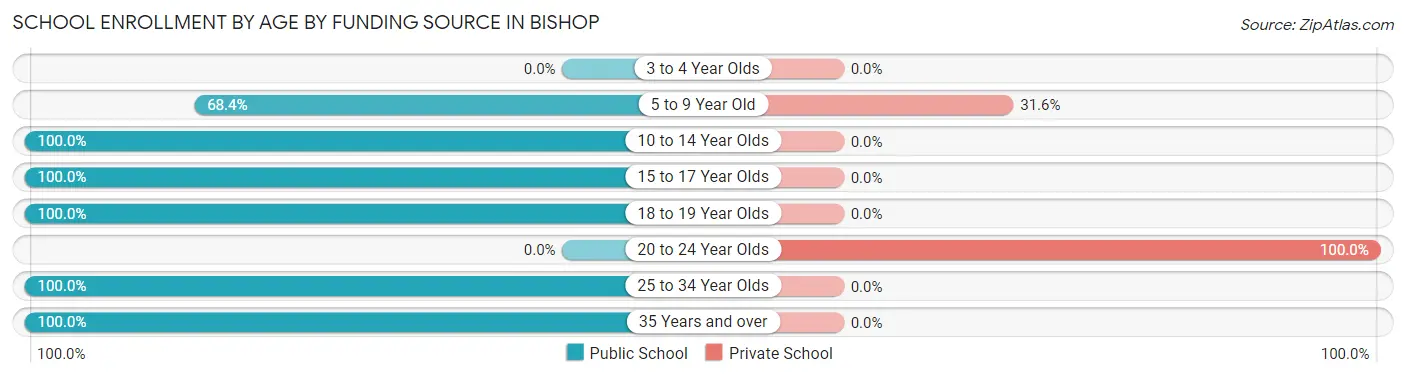
| Age Bracket | Public School | Private School |
| 3 to 4 Year Olds | 0 (0.0%) | 0 (0.0%) |
| 5 to 9 Year Old | 171 (68.4%) | 79 (31.6%) |
| 10 to 14 Year Olds | 135 (100.0%) | 0 (0.0%) |
| 15 to 17 Year Olds | 29 (100.0%) | 0 (0.0%) |
| 18 to 19 Year Olds | 34 (100.0%) | 0 (0.0%) |
| 20 to 24 Year Olds | 0 (0.0%) | 68 (100.0%) |
| 25 to 34 Year Olds | 66 (100.0%) | 0 (0.0%) |
| 35 Years and over | 10 (100.0%) | 0 (0.0%) |
| Total | 445 (75.2%) | 147 (24.8%) |
Educational Attainment by Field of Study in Bishop
Bio, nature & agricultural (288 | 24.4%), science & technology (212 | 18.0%), social sciences (208 | 17.6%), communications (137 | 11.6%), and engineering (127 | 10.8%) are the most common fields of study among 1,180 individuals in Bishop who have obtained a bachelor's degree or higher.
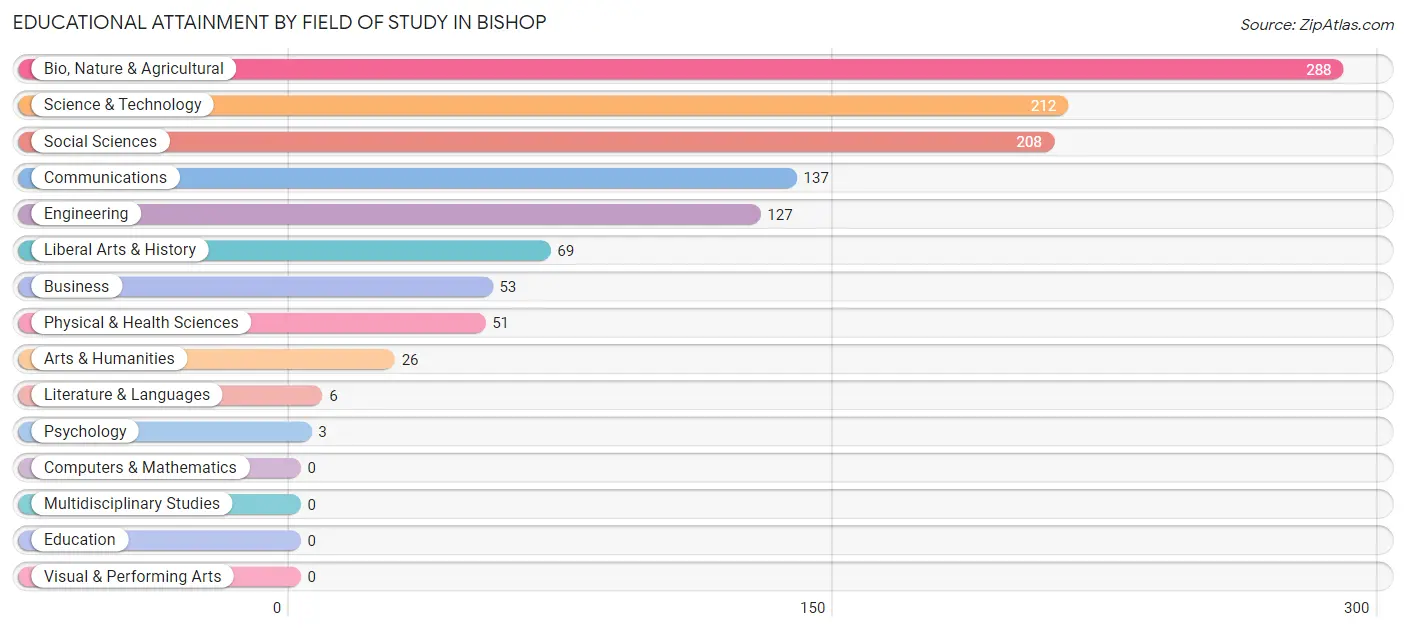
| Field of Study | # Graduates | % Graduates |
| Computers & Mathematics | 0 | 0.0% |
| Bio, Nature & Agricultural | 288 | 24.4% |
| Physical & Health Sciences | 51 | 4.3% |
| Psychology | 3 | 0.3% |
| Social Sciences | 208 | 17.6% |
| Engineering | 127 | 10.8% |
| Multidisciplinary Studies | 0 | 0.0% |
| Science & Technology | 212 | 18.0% |
| Business | 53 | 4.5% |
| Education | 0 | 0.0% |
| Literature & Languages | 6 | 0.5% |
| Liberal Arts & History | 69 | 5.9% |
| Visual & Performing Arts | 0 | 0.0% |
| Communications | 137 | 11.6% |
| Arts & Humanities | 26 | 2.2% |
| Total | 1,180 | 100.0% |
Transportation & Commute in Bishop
Vehicle Availability by Sex in Bishop
The most prevalent vehicle ownership categories in Bishop are males with 2 vehicles (354, accounting for 40.6%) and females with 2 vehicles (236, making up 27.7%).
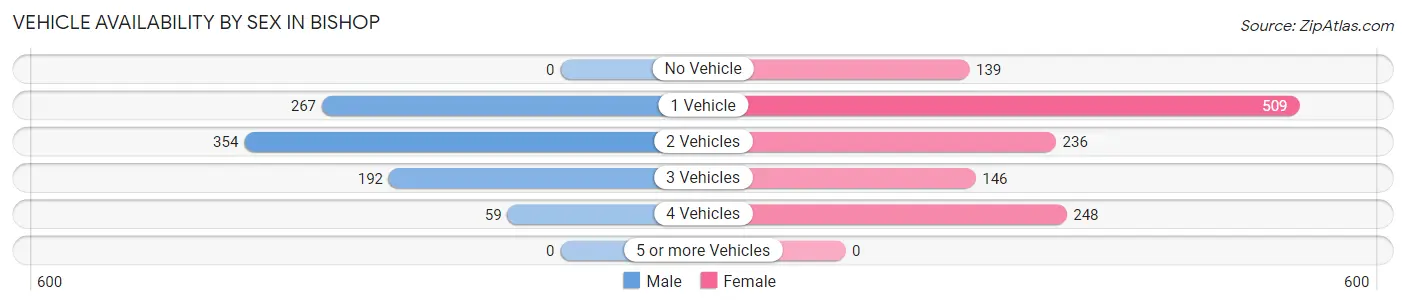
| Vehicles Available | Male | Female |
| No Vehicle | 0 (0.0%) | 139 (10.9%) |
| 1 Vehicle | 267 (30.6%) | 509 (39.8%) |
| 2 Vehicles | 354 (40.6%) | 236 (18.5%) |
| 3 Vehicles | 192 (22.0%) | 146 (11.4%) |
| 4 Vehicles | 59 (6.8%) | 248 (19.4%) |
| 5 or more Vehicles | 0 (0.0%) | 0 (0.0%) |
| Total | 872 (100.0%) | 1,278 (100.0%) |
Commute Time in Bishop
The most frequently occuring commute durations in Bishop are 5 to 9 minutes (705 commuters, 35.2%), 10 to 14 minutes (345 commuters, 17.2%), and less than 5 minutes (313 commuters, 15.6%).
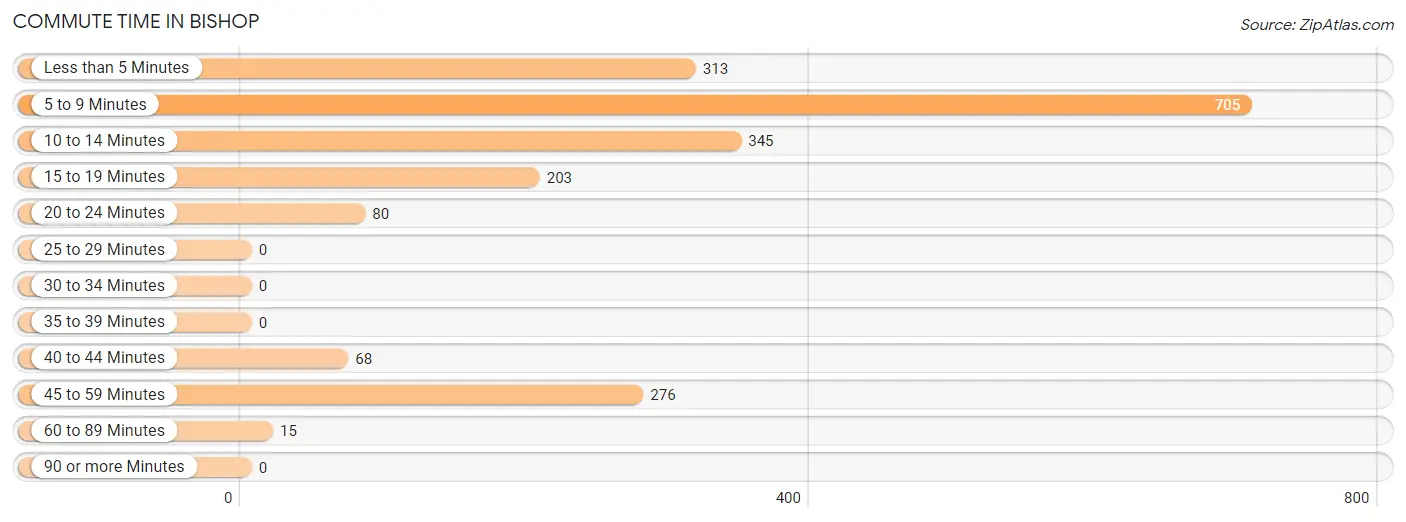
| Commute Time | # Commuters | % Commuters |
| Less than 5 Minutes | 313 | 15.6% |
| 5 to 9 Minutes | 705 | 35.2% |
| 10 to 14 Minutes | 345 | 17.2% |
| 15 to 19 Minutes | 203 | 10.1% |
| 20 to 24 Minutes | 80 | 4.0% |
| 25 to 29 Minutes | 0 | 0.0% |
| 30 to 34 Minutes | 0 | 0.0% |
| 35 to 39 Minutes | 0 | 0.0% |
| 40 to 44 Minutes | 68 | 3.4% |
| 45 to 59 Minutes | 276 | 13.8% |
| 60 to 89 Minutes | 15 | 0.7% |
| 90 or more Minutes | 0 | 0.0% |
Commute Time by Sex in Bishop
The most common commute times in Bishop are 5 to 9 minutes (335 commuters, 38.5%) for males and 5 to 9 minutes (370 commuters, 32.6%) for females.
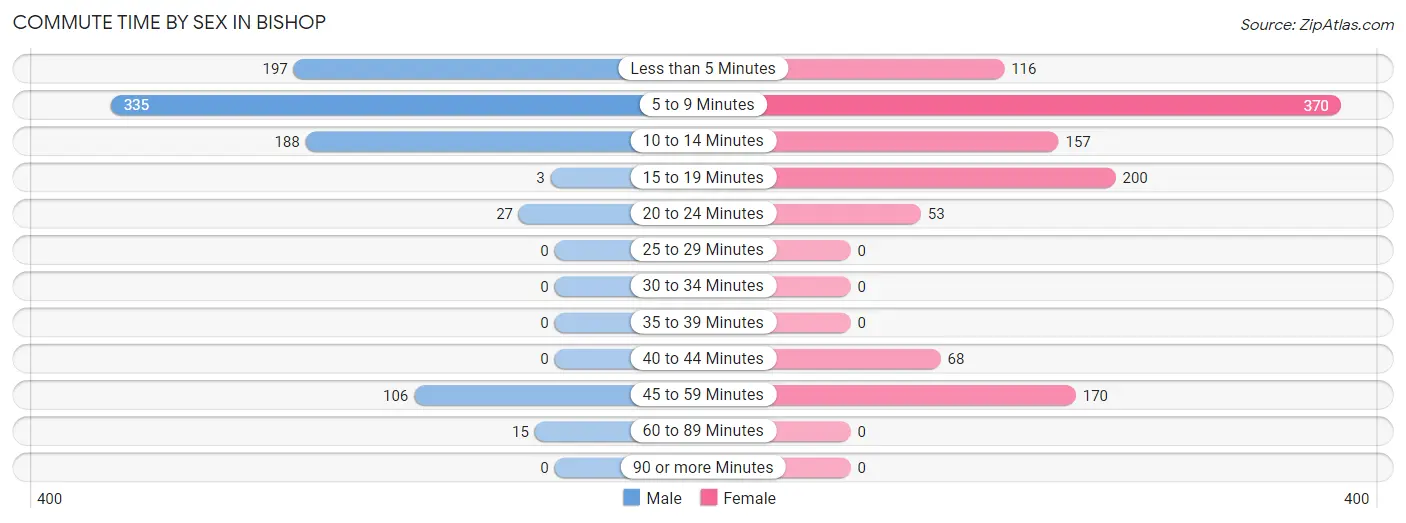
| Commute Time | Male | Female |
| Less than 5 Minutes | 197 (22.6%) | 116 (10.2%) |
| 5 to 9 Minutes | 335 (38.5%) | 370 (32.6%) |
| 10 to 14 Minutes | 188 (21.6%) | 157 (13.8%) |
| 15 to 19 Minutes | 3 (0.3%) | 200 (17.6%) |
| 20 to 24 Minutes | 27 (3.1%) | 53 (4.7%) |
| 25 to 29 Minutes | 0 (0.0%) | 0 (0.0%) |
| 30 to 34 Minutes | 0 (0.0%) | 0 (0.0%) |
| 35 to 39 Minutes | 0 (0.0%) | 0 (0.0%) |
| 40 to 44 Minutes | 0 (0.0%) | 68 (6.0%) |
| 45 to 59 Minutes | 106 (12.2%) | 170 (15.0%) |
| 60 to 89 Minutes | 15 (1.7%) | 0 (0.0%) |
| 90 or more Minutes | 0 (0.0%) | 0 (0.0%) |
Time of Departure to Work by Sex in Bishop
The most frequent times of departure to work in Bishop are 5:30 AM to 5:59 AM (152, 17.4%) for males and 7:30 AM to 7:59 AM (332, 29.3%) for females.
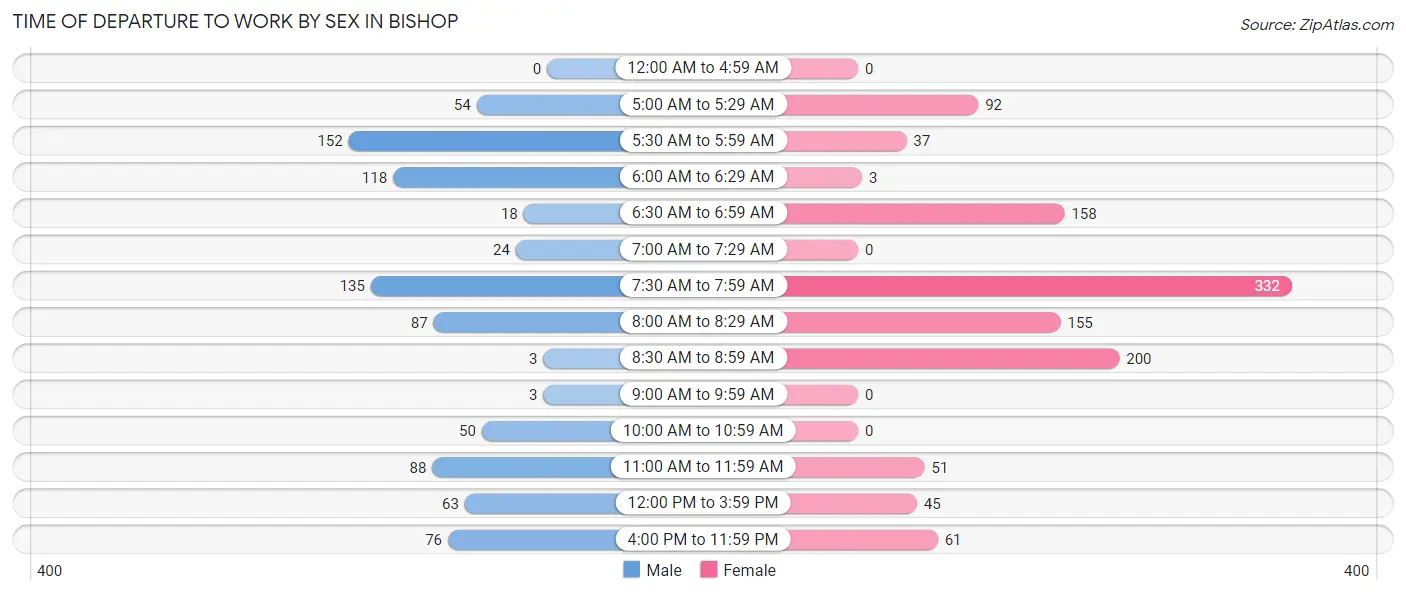
| Time of Departure | Male | Female |
| 12:00 AM to 4:59 AM | 0 (0.0%) | 0 (0.0%) |
| 5:00 AM to 5:29 AM | 54 (6.2%) | 92 (8.1%) |
| 5:30 AM to 5:59 AM | 152 (17.4%) | 37 (3.3%) |
| 6:00 AM to 6:29 AM | 118 (13.6%) | 3 (0.3%) |
| 6:30 AM to 6:59 AM | 18 (2.1%) | 158 (13.9%) |
| 7:00 AM to 7:29 AM | 24 (2.8%) | 0 (0.0%) |
| 7:30 AM to 7:59 AM | 135 (15.5%) | 332 (29.3%) |
| 8:00 AM to 8:29 AM | 87 (10.0%) | 155 (13.7%) |
| 8:30 AM to 8:59 AM | 3 (0.3%) | 200 (17.6%) |
| 9:00 AM to 9:59 AM | 3 (0.3%) | 0 (0.0%) |
| 10:00 AM to 10:59 AM | 50 (5.7%) | 0 (0.0%) |
| 11:00 AM to 11:59 AM | 88 (10.1%) | 51 (4.5%) |
| 12:00 PM to 3:59 PM | 63 (7.2%) | 45 (4.0%) |
| 4:00 PM to 11:59 PM | 76 (8.7%) | 61 (5.4%) |
| Total | 871 (100.0%) | 1,134 (100.0%) |
Housing Occupancy in Bishop
Occupancy by Ownership in Bishop
Of the total 2,035 dwellings in Bishop, owner-occupied units account for 1,122 (55.1%), while renter-occupied units make up 913 (44.9%).
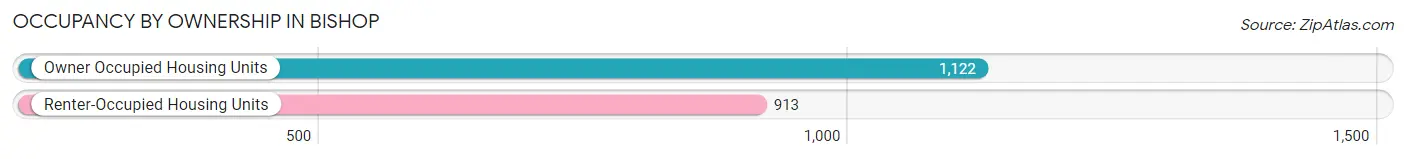
| Occupancy | # Housing Units | % Housing Units |
| Owner Occupied Housing Units | 1,122 | 55.1% |
| Renter-Occupied Housing Units | 913 | 44.9% |
| Total Occupied Housing Units | 2,035 | 100.0% |
Occupancy by Household Size in Bishop
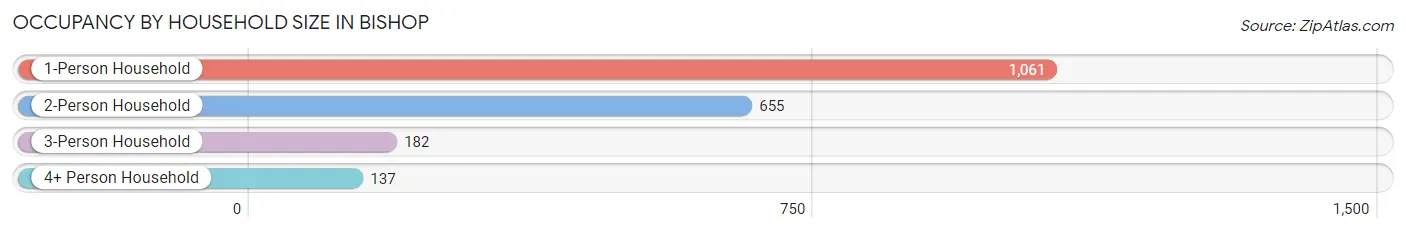
| Household Size | # Housing Units | % Housing Units |
| 1-Person Household | 1,061 | 52.1% |
| 2-Person Household | 655 | 32.2% |
| 3-Person Household | 182 | 8.9% |
| 4+ Person Household | 137 | 6.7% |
| Total Housing Units | 2,035 | 100.0% |
Occupancy by Ownership by Household Size in Bishop
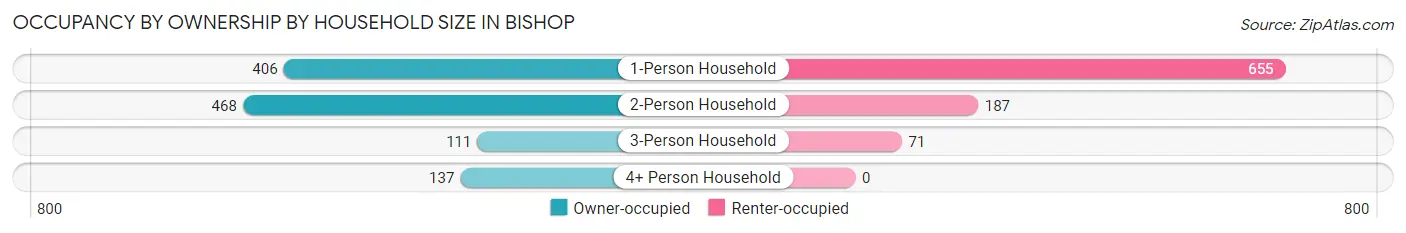
| Household Size | Owner-occupied | Renter-occupied |
| 1-Person Household | 406 (38.3%) | 655 (61.7%) |
| 2-Person Household | 468 (71.5%) | 187 (28.5%) |
| 3-Person Household | 111 (61.0%) | 71 (39.0%) |
| 4+ Person Household | 137 (100.0%) | 0 (0.0%) |
| Total Housing Units | 1,122 (55.1%) | 913 (44.9%) |
Occupancy by Educational Attainment in Bishop
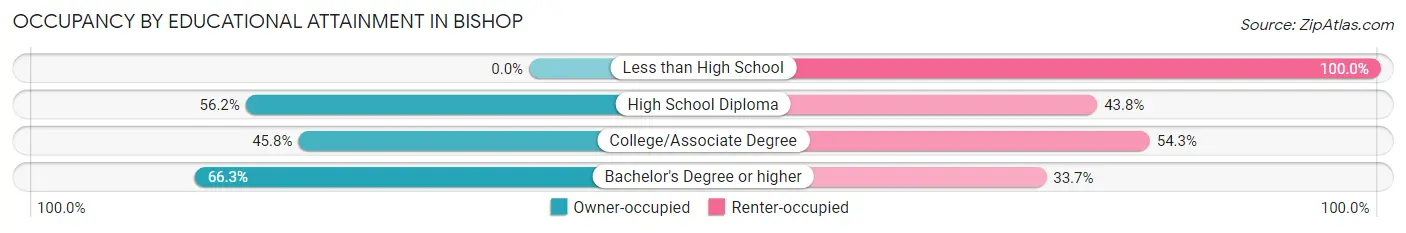
| Household Size | Owner-occupied | Renter-occupied |
| Less than High School | 0 (0.0%) | 18 (100.0%) |
| High School Diploma | 241 (56.2%) | 188 (43.8%) |
| College/Associate Degree | 382 (45.8%) | 453 (54.2%) |
| Bachelor's Degree or higher | 499 (66.3%) | 254 (33.7%) |
Occupancy by Age of Householder in Bishop
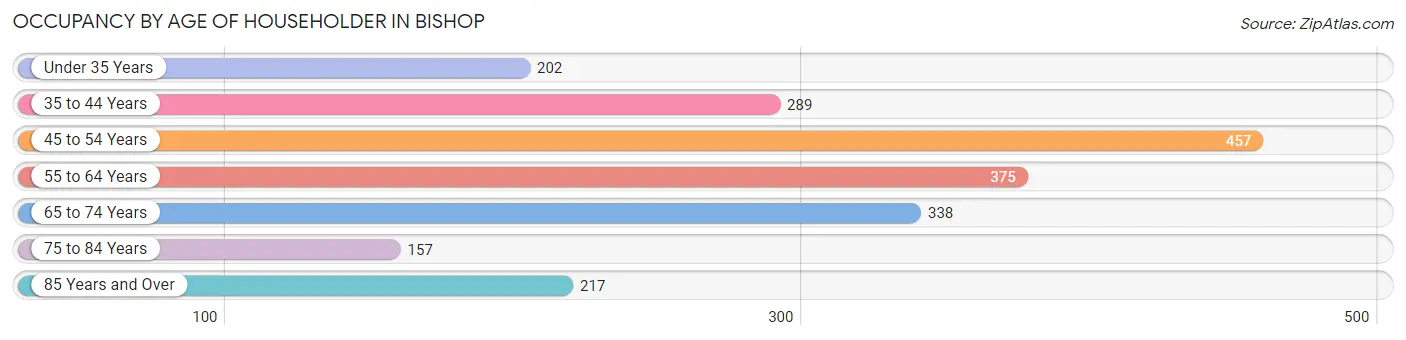
| Age Bracket | # Households | % Households |
| Under 35 Years | 202 | 9.9% |
| 35 to 44 Years | 289 | 14.2% |
| 45 to 54 Years | 457 | 22.5% |
| 55 to 64 Years | 375 | 18.4% |
| 65 to 74 Years | 338 | 16.6% |
| 75 to 84 Years | 157 | 7.7% |
| 85 Years and Over | 217 | 10.7% |
| Total | 2,035 | 100.0% |
Housing Finances in Bishop
Median Income by Occupancy in Bishop
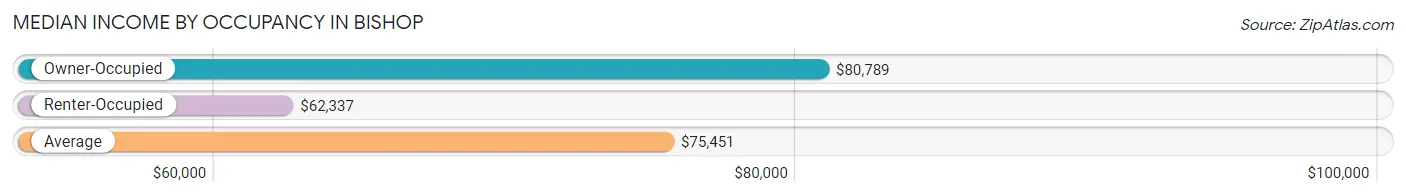
| Occupancy Type | # Households | Median Income |
| Owner-Occupied | 1,122 (55.1%) | $80,789 |
| Renter-Occupied | 913 (44.9%) | $62,337 |
| Average | 2,035 (100.0%) | $75,451 |
Occupancy by Householder Income Bracket in Bishop
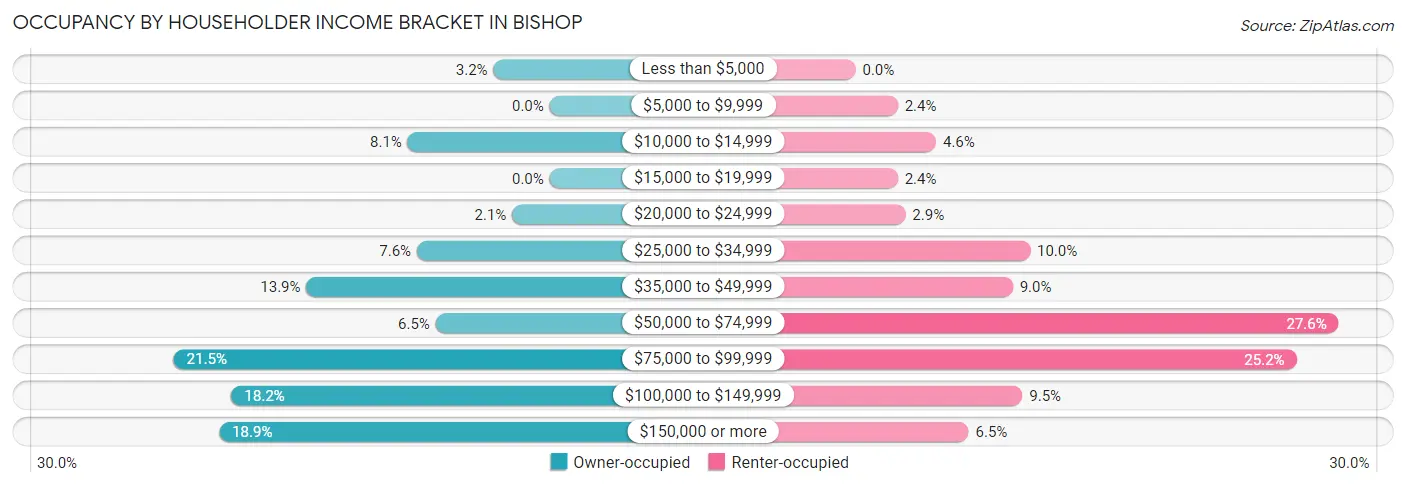
| Income Bracket | Owner-occupied | Renter-occupied |
| Less than $5,000 | 36 (3.2%) | 0 (0.0%) |
| $5,000 to $9,999 | 0 (0.0%) | 22 (2.4%) |
| $10,000 to $14,999 | 91 (8.1%) | 42 (4.6%) |
| $15,000 to $19,999 | 0 (0.0%) | 22 (2.4%) |
| $20,000 to $24,999 | 24 (2.1%) | 26 (2.9%) |
| $25,000 to $34,999 | 85 (7.6%) | 91 (10.0%) |
| $35,000 to $49,999 | 156 (13.9%) | 82 (9.0%) |
| $50,000 to $74,999 | 73 (6.5%) | 252 (27.6%) |
| $75,000 to $99,999 | 241 (21.5%) | 230 (25.2%) |
| $100,000 to $149,999 | 204 (18.2%) | 87 (9.5%) |
| $150,000 or more | 212 (18.9%) | 59 (6.5%) |
| Total | 1,122 (100.0%) | 913 (100.0%) |
Monthly Housing Cost Tiers in Bishop
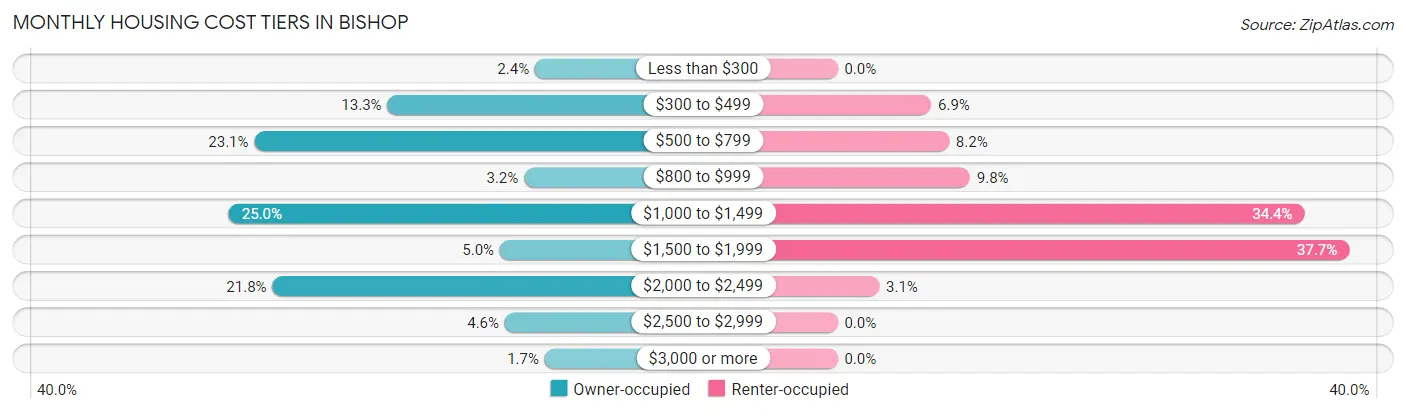
| Monthly Cost | Owner-occupied | Renter-occupied |
| Less than $300 | 27 (2.4%) | 0 (0.0%) |
| $300 to $499 | 149 (13.3%) | 63 (6.9%) |
| $500 to $799 | 259 (23.1%) | 75 (8.2%) |
| $800 to $999 | 36 (3.2%) | 89 (9.8%) |
| $1,000 to $1,499 | 280 (25.0%) | 314 (34.4%) |
| $1,500 to $1,999 | 56 (5.0%) | 344 (37.7%) |
| $2,000 to $2,499 | 244 (21.7%) | 28 (3.1%) |
| $2,500 to $2,999 | 52 (4.6%) | 0 (0.0%) |
| $3,000 or more | 19 (1.7%) | 0 (0.0%) |
| Total | 1,122 (100.0%) | 913 (100.0%) |
Physical Housing Characteristics in Bishop
Housing Structures in Bishop
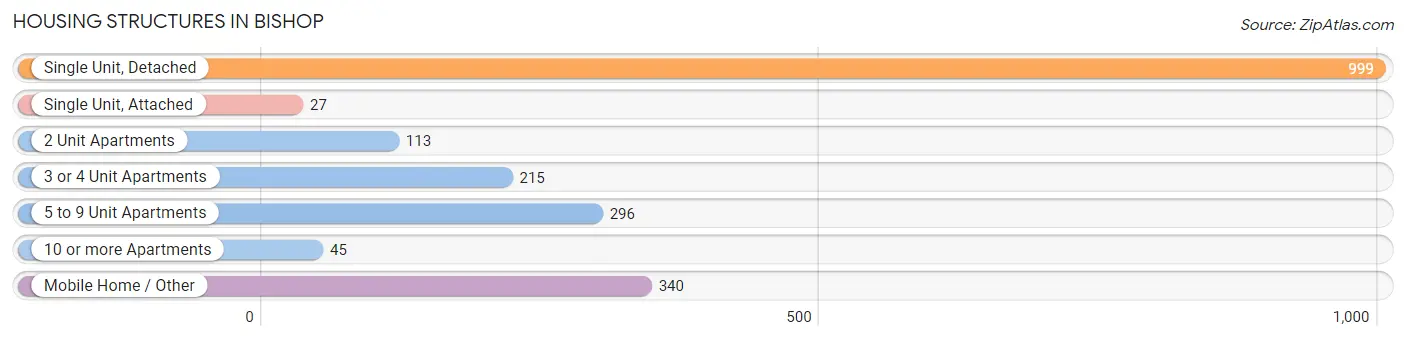
| Structure Type | # Housing Units | % Housing Units |
| Single Unit, Detached | 999 | 49.1% |
| Single Unit, Attached | 27 | 1.3% |
| 2 Unit Apartments | 113 | 5.6% |
| 3 or 4 Unit Apartments | 215 | 10.6% |
| 5 to 9 Unit Apartments | 296 | 14.5% |
| 10 or more Apartments | 45 | 2.2% |
| Mobile Home / Other | 340 | 16.7% |
| Total | 2,035 | 100.0% |
Housing Structures by Occupancy in Bishop
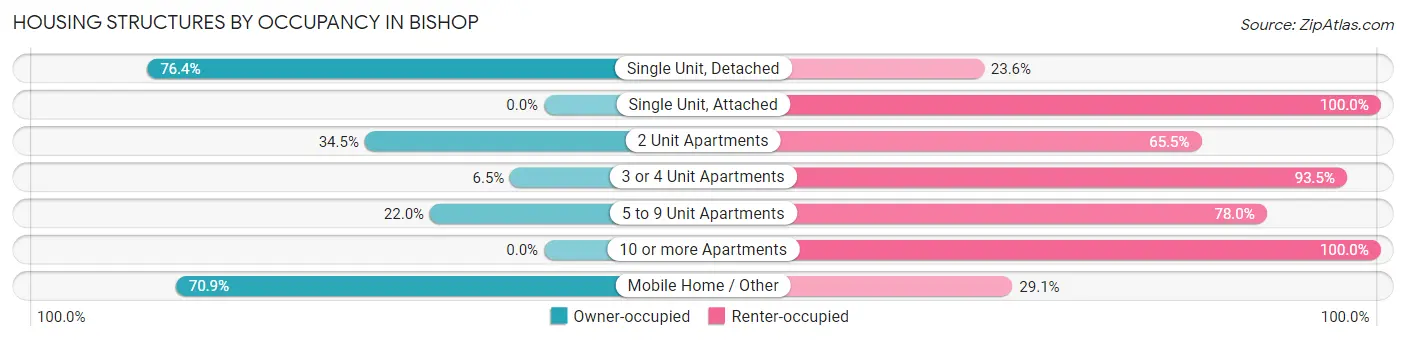
| Structure Type | Owner-occupied | Renter-occupied |
| Single Unit, Detached | 763 (76.4%) | 236 (23.6%) |
| Single Unit, Attached | 0 (0.0%) | 27 (100.0%) |
| 2 Unit Apartments | 39 (34.5%) | 74 (65.5%) |
| 3 or 4 Unit Apartments | 14 (6.5%) | 201 (93.5%) |
| 5 to 9 Unit Apartments | 65 (22.0%) | 231 (78.0%) |
| 10 or more Apartments | 0 (0.0%) | 45 (100.0%) |
| Mobile Home / Other | 241 (70.9%) | 99 (29.1%) |
| Total | 1,122 (55.1%) | 913 (44.9%) |
Housing Structures by Number of Rooms in Bishop
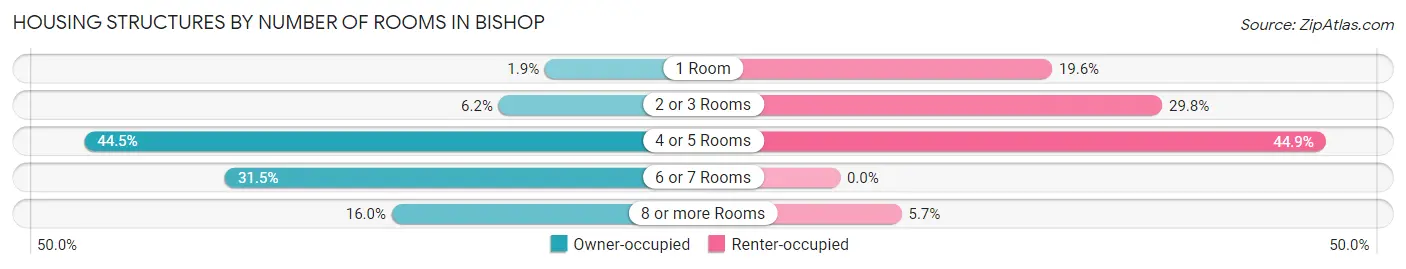
| Number of Rooms | Owner-occupied | Renter-occupied |
| 1 Room | 21 (1.9%) | 179 (19.6%) |
| 2 or 3 Rooms | 69 (6.1%) | 272 (29.8%) |
| 4 or 5 Rooms | 499 (44.5%) | 410 (44.9%) |
| 6 or 7 Rooms | 353 (31.5%) | 0 (0.0%) |
| 8 or more Rooms | 180 (16.0%) | 52 (5.7%) |
| Total | 1,122 (100.0%) | 913 (100.0%) |
Housing Structure by Heating Type in Bishop
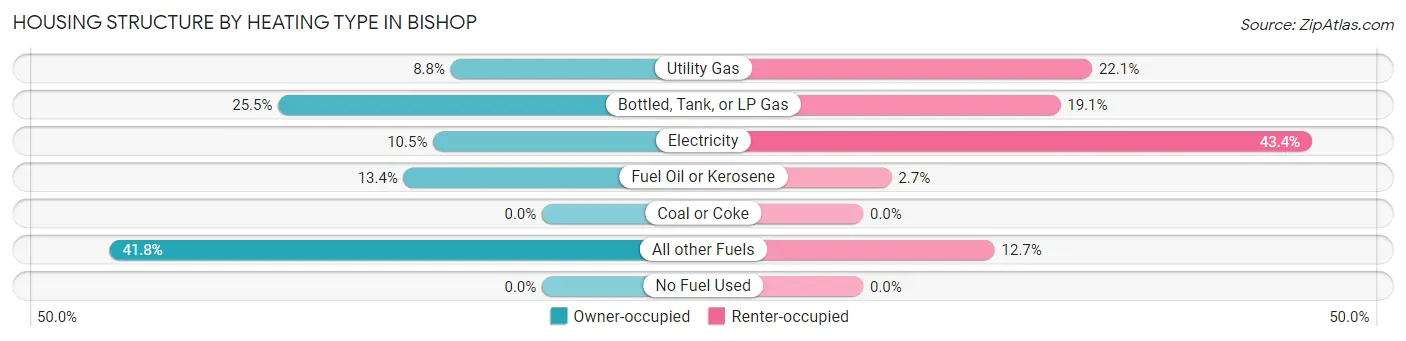
| Heating Type | Owner-occupied | Renter-occupied |
| Utility Gas | 99 (8.8%) | 202 (22.1%) |
| Bottled, Tank, or LP Gas | 286 (25.5%) | 174 (19.1%) |
| Electricity | 118 (10.5%) | 396 (43.4%) |
| Fuel Oil or Kerosene | 150 (13.4%) | 25 (2.7%) |
| Coal or Coke | 0 (0.0%) | 0 (0.0%) |
| All other Fuels | 469 (41.8%) | 116 (12.7%) |
| No Fuel Used | 0 (0.0%) | 0 (0.0%) |
| Total | 1,122 (100.0%) | 913 (100.0%) |
Household Vehicle Usage in Bishop
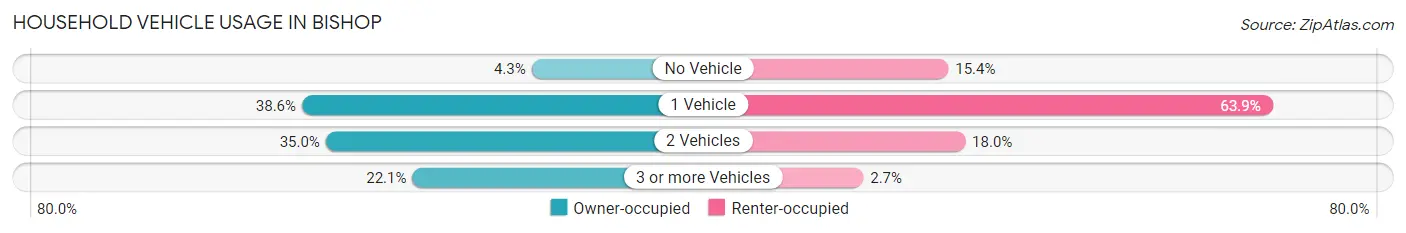
| Vehicles per Household | Owner-occupied | Renter-occupied |
| No Vehicle | 48 (4.3%) | 141 (15.4%) |
| 1 Vehicle | 433 (38.6%) | 583 (63.9%) |
| 2 Vehicles | 393 (35.0%) | 164 (18.0%) |
| 3 or more Vehicles | 248 (22.1%) | 25 (2.7%) |
| Total | 1,122 (100.0%) | 913 (100.0%) |
Real Estate & Mortgages in Bishop
Real Estate and Mortgage Overview in Bishop
| Characteristic | Without Mortgage | With Mortgage |
| Housing Units | 624 | 498 |
| Median Property Value | $221,700 | $450,000 |
| Median Household Income | $73,182 | $180 |
| Monthly Housing Costs | $600 | $19 |
| Real Estate Taxes | $1,956 | $39 |
Property Value by Mortgage Status in Bishop
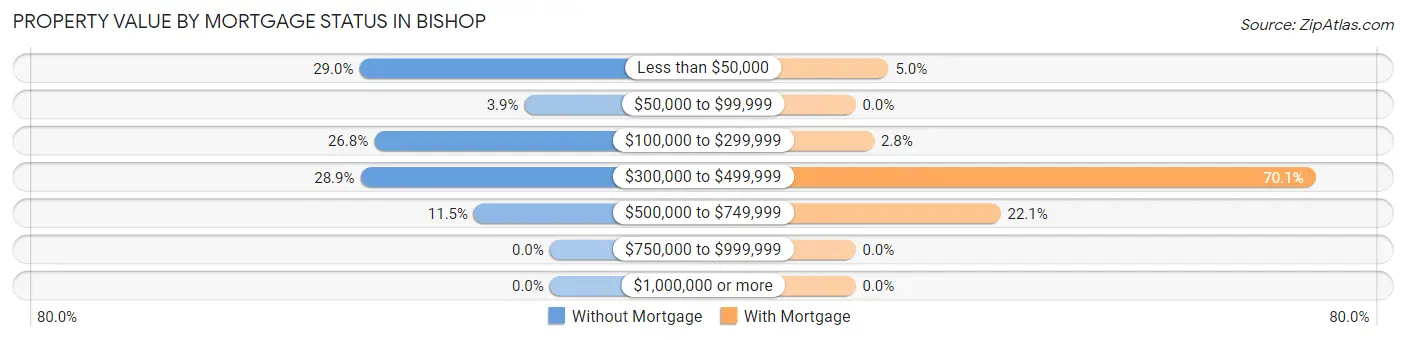
| Property Value | Without Mortgage | With Mortgage |
| Less than $50,000 | 181 (29.0%) | 25 (5.0%) |
| $50,000 to $99,999 | 24 (3.8%) | 0 (0.0%) |
| $100,000 to $299,999 | 167 (26.8%) | 14 (2.8%) |
| $300,000 to $499,999 | 180 (28.8%) | 349 (70.1%) |
| $500,000 to $749,999 | 72 (11.5%) | 110 (22.1%) |
| $750,000 to $999,999 | 0 (0.0%) | 0 (0.0%) |
| $1,000,000 or more | 0 (0.0%) | 0 (0.0%) |
| Total | 624 (100.0%) | 498 (100.0%) |
Household Income by Mortgage Status in Bishop
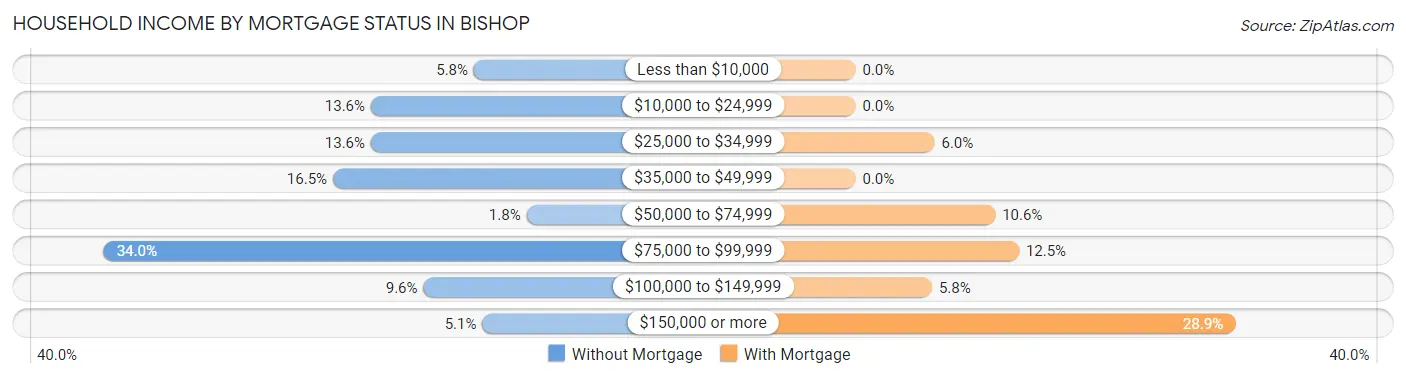
| Household Income | Without Mortgage | With Mortgage |
| Less than $10,000 | 36 (5.8%) | 0 (0.0%) |
| $10,000 to $24,999 | 85 (13.6%) | 0 (0.0%) |
| $25,000 to $34,999 | 85 (13.6%) | 30 (6.0%) |
| $35,000 to $49,999 | 103 (16.5%) | 0 (0.0%) |
| $50,000 to $74,999 | 11 (1.8%) | 53 (10.6%) |
| $75,000 to $99,999 | 212 (34.0%) | 62 (12.4%) |
| $100,000 to $149,999 | 60 (9.6%) | 29 (5.8%) |
| $150,000 or more | 32 (5.1%) | 144 (28.9%) |
| Total | 624 (100.0%) | 498 (100.0%) |
Property Value to Household Income Ratio in Bishop
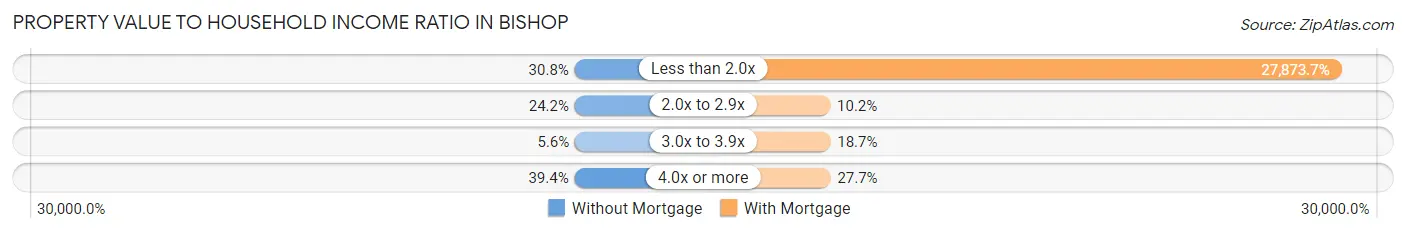
| Value-to-Income Ratio | Without Mortgage | With Mortgage |
| Less than 2.0x | 192 (30.8%) | 138,811 (27,873.7%) |
| 2.0x to 2.9x | 151 (24.2%) | 51 (10.2%) |
| 3.0x to 3.9x | 35 (5.6%) | 93 (18.7%) |
| 4.0x or more | 246 (39.4%) | 138 (27.7%) |
| Total | 624 (100.0%) | 498 (100.0%) |
Real Estate Taxes by Mortgage Status in Bishop
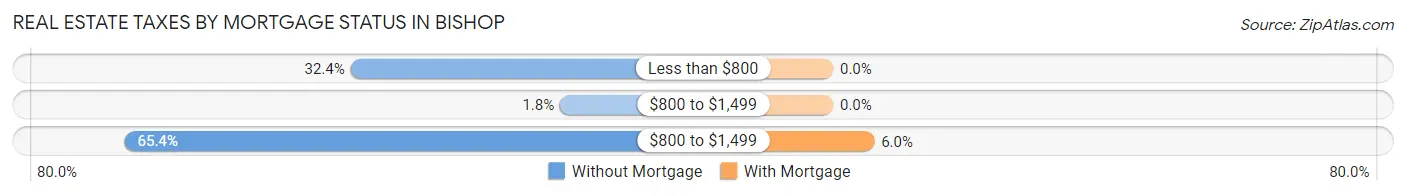
| Property Taxes | Without Mortgage | With Mortgage |
| Less than $800 | 202 (32.4%) | 0 (0.0%) |
| $800 to $1,499 | 11 (1.8%) | 0 (0.0%) |
| $800 to $1,499 | 408 (65.4%) | 30 (6.0%) |
| Total | 624 (100.0%) | 498 (100.0%) |
Health & Disability in Bishop
Health Insurance Coverage by Age in Bishop
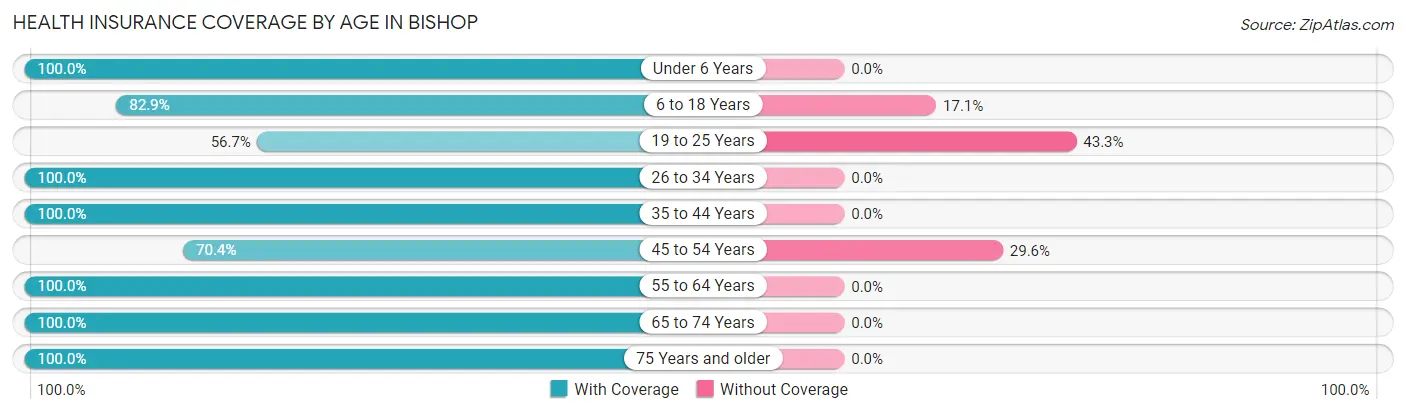
| Age Bracket | With Coverage | Without Coverage |
| Under 6 Years | 109 (100.0%) | 0 (0.0%) |
| 6 to 18 Years | 305 (82.9%) | 63 (17.1%) |
| 19 to 25 Years | 114 (56.7%) | 87 (43.3%) |
| 26 to 34 Years | 519 (100.0%) | 0 (0.0%) |
| 35 to 44 Years | 454 (100.0%) | 0 (0.0%) |
| 45 to 54 Years | 362 (70.4%) | 152 (29.6%) |
| 55 to 64 Years | 668 (100.0%) | 0 (0.0%) |
| 65 to 74 Years | 412 (100.0%) | 0 (0.0%) |
| 75 Years and older | 483 (100.0%) | 0 (0.0%) |
| Total | 3,426 (91.9%) | 302 (8.1%) |
Health Insurance Coverage by Citizenship Status in Bishop
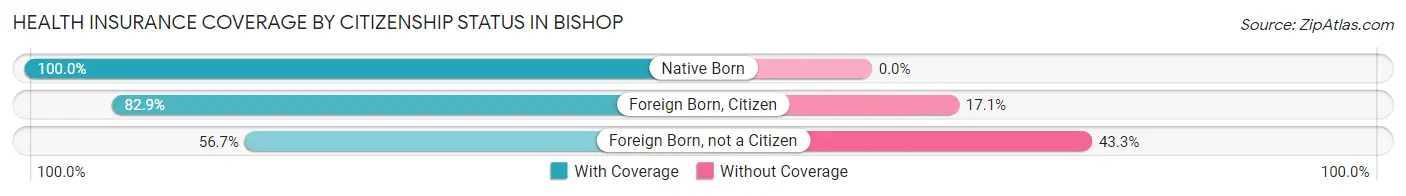
| Citizenship Status | With Coverage | Without Coverage |
| Native Born | 109 (100.0%) | 0 (0.0%) |
| Foreign Born, Citizen | 305 (82.9%) | 63 (17.1%) |
| Foreign Born, not a Citizen | 114 (56.7%) | 87 (43.3%) |
Health Insurance Coverage by Household Income in Bishop
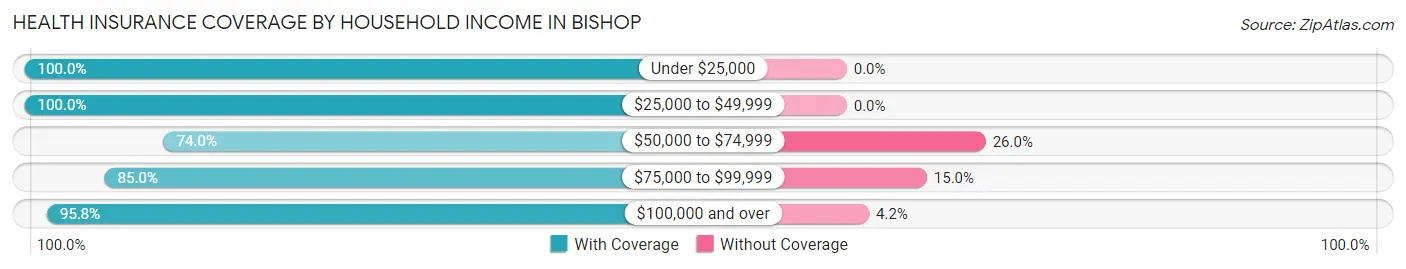
| Household Income | With Coverage | Without Coverage |
| Under $25,000 | 292 (100.0%) | 0 (0.0%) |
| $25,000 to $49,999 | 579 (100.0%) | 0 (0.0%) |
| $50,000 to $74,999 | 287 (74.0%) | 101 (26.0%) |
| $75,000 to $99,999 | 782 (85.0%) | 138 (15.0%) |
| $100,000 and over | 1,444 (95.8%) | 63 (4.2%) |
Public vs Private Health Insurance Coverage by Age in Bishop
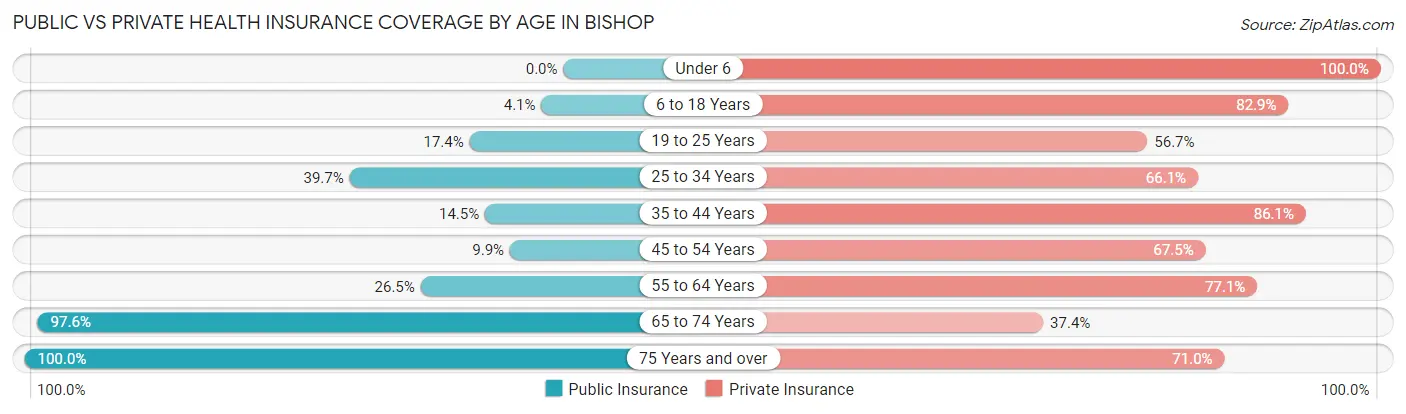
| Age Bracket | Public Insurance | Private Insurance |
| Under 6 | 0 (0.0%) | 109 (100.0%) |
| 6 to 18 Years | 15 (4.1%) | 305 (82.9%) |
| 19 to 25 Years | 35 (17.4%) | 114 (56.7%) |
| 25 to 34 Years | 206 (39.7%) | 343 (66.1%) |
| 35 to 44 Years | 66 (14.5%) | 391 (86.1%) |
| 45 to 54 Years | 51 (9.9%) | 347 (67.5%) |
| 55 to 64 Years | 177 (26.5%) | 515 (77.1%) |
| 65 to 74 Years | 402 (97.6%) | 154 (37.4%) |
| 75 Years and over | 483 (100.0%) | 343 (71.0%) |
| Total | 1,435 (38.5%) | 2,621 (70.3%) |
Disability Status by Sex by Age in Bishop
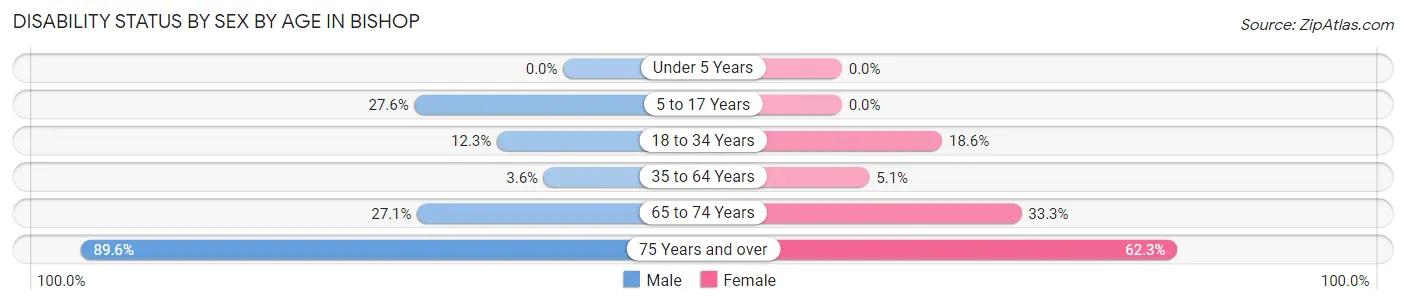
| Age Bracket | Male | Female |
| Under 5 Years | 0 (0.0%) | 0 (0.0%) |
| 5 to 17 Years | 29 (27.6%) | 0 (0.0%) |
| 18 to 34 Years | 22 (12.3%) | 107 (18.6%) |
| 35 to 64 Years | 28 (3.6%) | 44 (5.1%) |
| 65 to 74 Years | 71 (27.1%) | 50 (33.3%) |
| 75 Years and over | 181 (89.6%) | 175 (62.3%) |
Disability Class by Sex by Age in Bishop
Disability Class: Hearing Difficulty
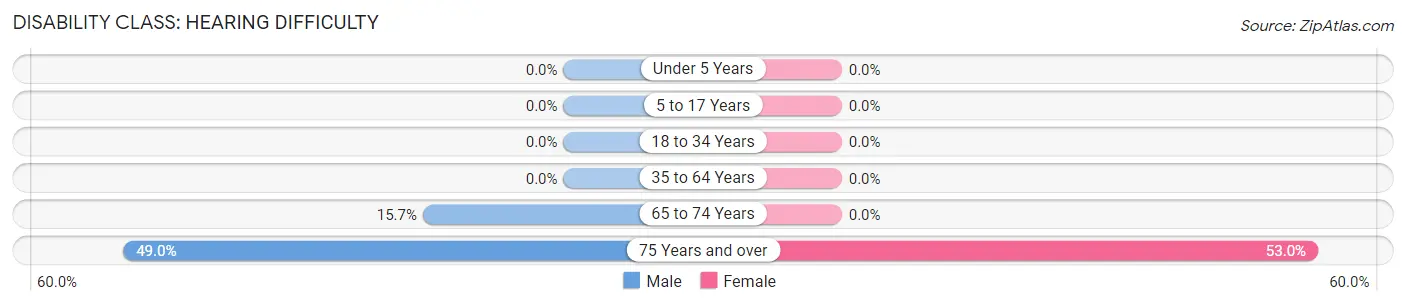
| Age Bracket | Male | Female |
| Under 5 Years | 0 (0.0%) | 0 (0.0%) |
| 5 to 17 Years | 0 (0.0%) | 0 (0.0%) |
| 18 to 34 Years | 0 (0.0%) | 0 (0.0%) |
| 35 to 64 Years | 0 (0.0%) | 0 (0.0%) |
| 65 to 74 Years | 41 (15.7%) | 0 (0.0%) |
| 75 Years and over | 99 (49.0%) | 149 (53.0%) |
Disability Class: Vision Difficulty
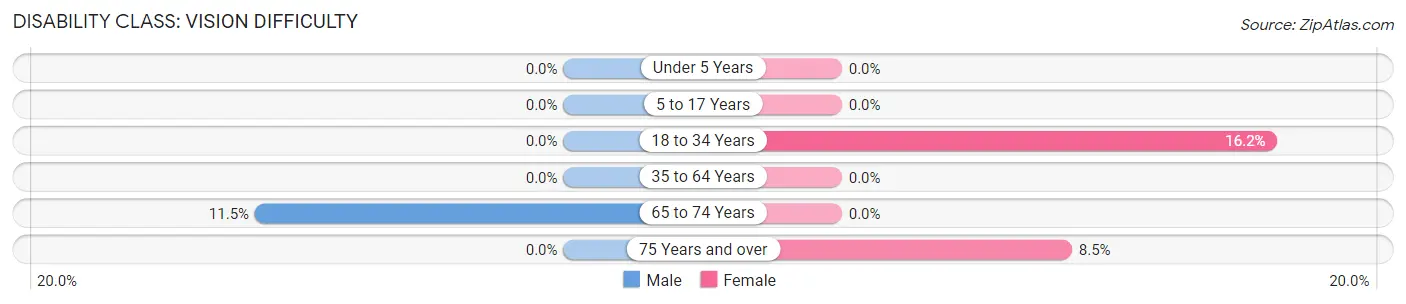
| Age Bracket | Male | Female |
| Under 5 Years | 0 (0.0%) | 0 (0.0%) |
| 5 to 17 Years | 0 (0.0%) | 0 (0.0%) |
| 18 to 34 Years | 0 (0.0%) | 93 (16.2%) |
| 35 to 64 Years | 0 (0.0%) | 0 (0.0%) |
| 65 to 74 Years | 30 (11.5%) | 0 (0.0%) |
| 75 Years and over | 0 (0.0%) | 24 (8.5%) |
Disability Class: Cognitive Difficulty
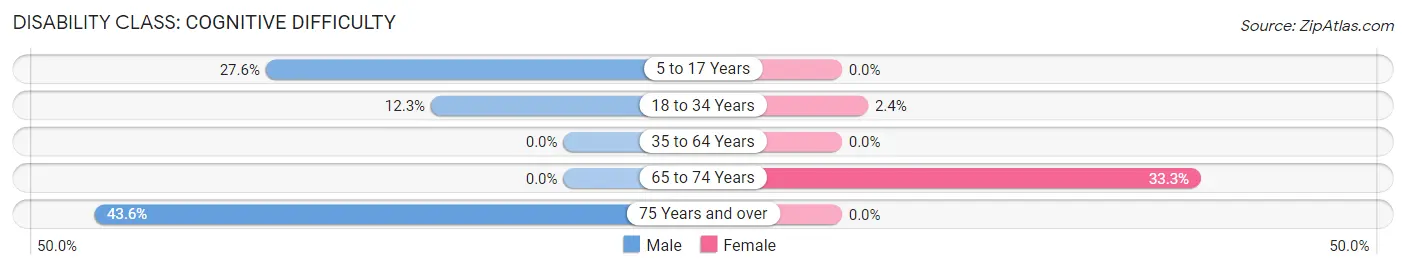
| Age Bracket | Male | Female |
| 5 to 17 Years | 29 (27.6%) | 0 (0.0%) |
| 18 to 34 Years | 22 (12.3%) | 14 (2.4%) |
| 35 to 64 Years | 0 (0.0%) | 0 (0.0%) |
| 65 to 74 Years | 0 (0.0%) | 50 (33.3%) |
| 75 Years and over | 88 (43.6%) | 0 (0.0%) |
Disability Class: Ambulatory Difficulty
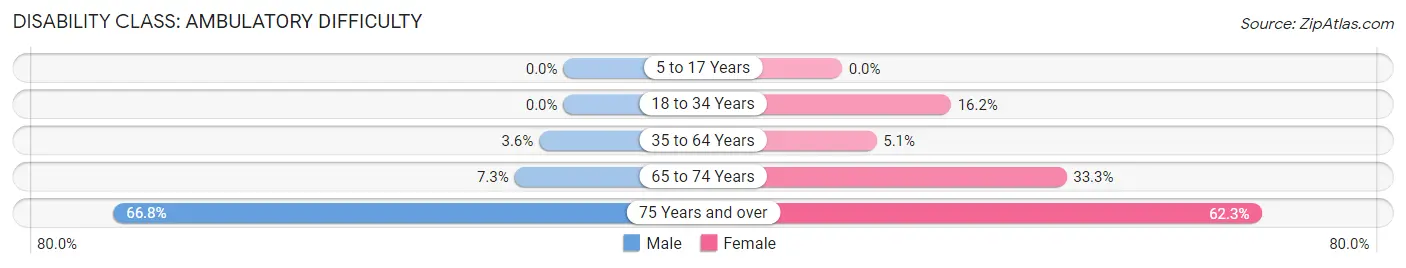
| Age Bracket | Male | Female |
| 5 to 17 Years | 0 (0.0%) | 0 (0.0%) |
| 18 to 34 Years | 0 (0.0%) | 93 (16.2%) |
| 35 to 64 Years | 28 (3.6%) | 44 (5.1%) |
| 65 to 74 Years | 19 (7.2%) | 50 (33.3%) |
| 75 Years and over | 135 (66.8%) | 175 (62.3%) |
Disability Class: Self-Care Difficulty
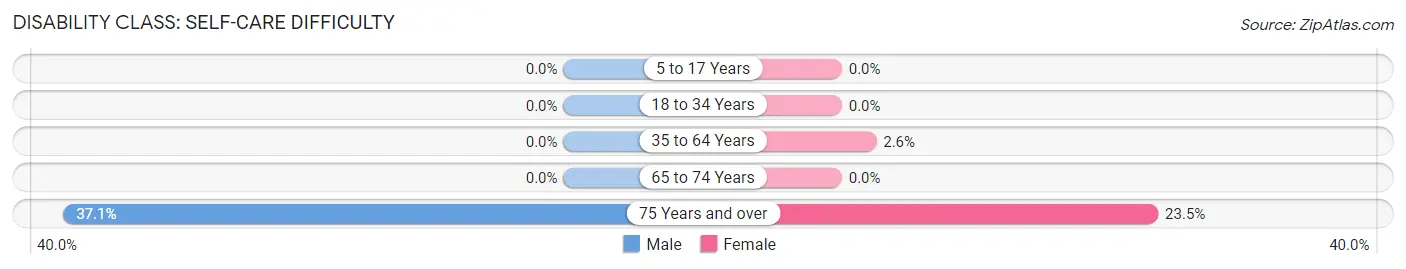
| Age Bracket | Male | Female |
| 5 to 17 Years | 0 (0.0%) | 0 (0.0%) |
| 18 to 34 Years | 0 (0.0%) | 0 (0.0%) |
| 35 to 64 Years | 0 (0.0%) | 22 (2.6%) |
| 65 to 74 Years | 0 (0.0%) | 0 (0.0%) |
| 75 Years and over | 75 (37.1%) | 66 (23.5%) |
Technology Access in Bishop
Computing Device Access in Bishop
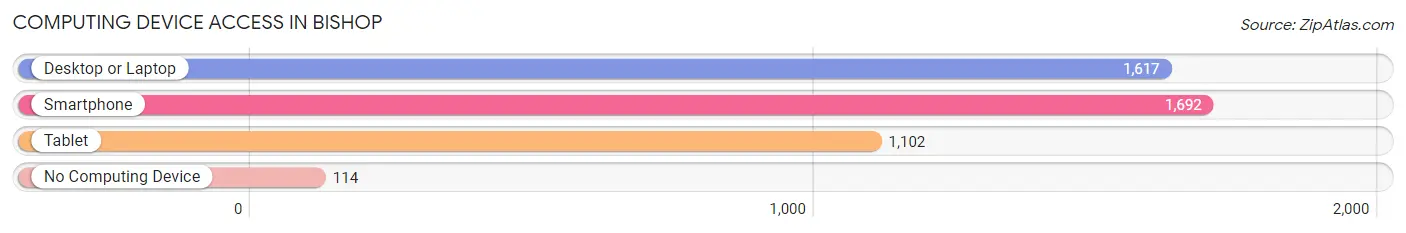
| Device Type | # Households | % Households |
| Desktop or Laptop | 1,617 | 79.5% |
| Smartphone | 1,692 | 83.1% |
| Tablet | 1,102 | 54.1% |
| No Computing Device | 114 | 5.6% |
| Total | 2,035 | 100.0% |
Internet Access in Bishop
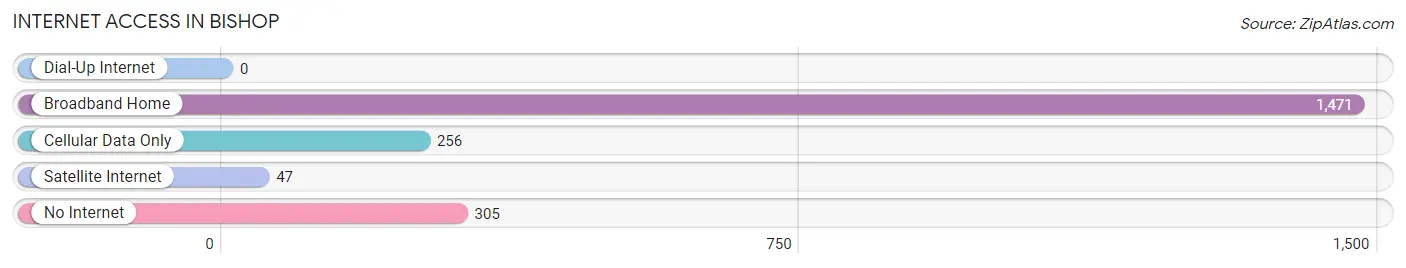
| Internet Type | # Households | % Households |
| Dial-Up Internet | 0 | 0.0% |
| Broadband Home | 1,471 | 72.3% |
| Cellular Data Only | 256 | 12.6% |
| Satellite Internet | 47 | 2.3% |
| No Internet | 305 | 15.0% |
| Total | 2,035 | 100.0% |
Bishop Summary
Bishop, California is a small city located in the Eastern Sierra Nevada Mountains of Inyo County, California. It is the county seat of Inyo County and is situated at the northern end of the Owens Valley, approximately 150 miles north of Los Angeles. Bishop is a popular destination for outdoor recreation, including fishing, camping, hiking, and skiing. The city is also known for its vibrant art and music scene, and its proximity to the nearby Mammoth Lakes ski resort.
History
The area that is now Bishop was originally inhabited by the Paiute and Mono Native American tribes. The first European settlers arrived in the area in the mid-1800s, and the town of Bishop was founded in 1864. The town was named after Samuel Addison Bishop, a former California state senator and one of the first settlers in the area.
In the late 1800s, Bishop became an important stop on the Butterfield Overland Mail route, which connected St. Louis, Missouri to San Francisco, California. The town also served as a supply center for nearby mining operations.
In the early 1900s, Bishop became a popular tourist destination due to its proximity to the nearby Mammoth Lakes ski resort. The town also became a center for the local agricultural industry, with many local farmers growing alfalfa, hay, and other crops.
Geography
Bishop is located in the Eastern Sierra Nevada Mountains of Inyo County, California. The city is situated at the northern end of the Owens Valley, approximately 150 miles north of Los Angeles. The city is surrounded by the Sierra Nevada mountain range to the west, the White Mountains to the east, and the Inyo National Forest to the south.
The city has a total area of 8.3 square miles, of which 8.2 square miles is land and 0.1 square miles is water. The elevation of Bishop is 4,150 feet above sea level.
Economy
Bishop’s economy is largely based on tourism, agriculture, and retail. The city is a popular destination for outdoor recreation, including fishing, camping, hiking, and skiing. The nearby Mammoth Lakes ski resort is a major draw for tourists, and the city is also home to several art galleries and music venues.
Agriculture is also an important part of the local economy, with many local farmers growing alfalfa, hay, and other crops. The city is also home to several retail stores, including grocery stores, clothing stores, and hardware stores.
Demographics
As of the 2010 census, Bishop had a population of 3,879. The racial makeup of the city was 79.2% White, 0.7% African American, 1.3% Native American, 0.7% Asian, 0.1% Pacific Islander, 15.2% from other races, and 3.0% from two or more races. Hispanic or Latino of any race were 28.2% of the population.
The median household income in Bishop was $41,944, and the median family income was $48,958. The per capita income for the city was $20,945. About 17.2% of families and 21.3% of the population were below the poverty line, including 28.2% of those under age 18 and 8.2% of those age 65 or over.
Common Questions
What is Per Capita Income in Bishop?
Per Capita income in Bishop is $47,064.
What is the Median Family Income in Bishop?
Median Family Income in Bishop is $102,982.
What is the Median Household income in Bishop?
Median Household Income in Bishop is $75,451.
What is Income or Wage Gap in Bishop?
Income or Wage Gap in Bishop is 14.9%.
Women in Bishop earn 85.1 cents for every dollar earned by a man.
What is Inequality or Gini Index in Bishop?
Inequality or Gini Index in Bishop is 0.38.
What is the Total Population of Bishop?
Total Population of Bishop is 3,802.
What is the Total Male Population of Bishop?
Total Male Population of Bishop is 1,560.
What is the Total Female Population of Bishop?
Total Female Population of Bishop is 2,242.
What is the Ratio of Males per 100 Females in Bishop?
There are 69.58 Males per 100 Females in Bishop.
What is the Ratio of Females per 100 Males in Bishop?
There are 143.72 Females per 100 Males in Bishop.
What is the Median Population Age in Bishop?
Median Population Age in Bishop is 48.6 Years.
What is the Average Family Size in Bishop
Average Family Size in Bishop is 2.7 People.
What is the Average Household Size in Bishop
Average Household Size in Bishop is 1.8 People.
How Large is the Labor Force in Bishop?
There are 2,281 People in the Labor Forcein in Bishop.
What is the Percentage of People in the Labor Force in Bishop?
67.9% of People are in the Labor Force in Bishop.
What is the Unemployment Rate in Bishop?
Unemployment Rate in Bishop is 2.7%.