Highgrove, CA Map & Demographics
Highgrove Map
Highgrove Overview
$34,491
PER CAPITA INCOME
$100,682
AVG FAMILY INCOME
$100,540
AVG HOUSEHOLD INCOME
10.7%
WAGE / INCOME GAP [ % ]
89.3¢/ $1
WAGE / INCOME GAP [ $ ]
0.36
INEQUALITY / GINI INDEX
7,069
TOTAL POPULATION
3,484
MALE POPULATION
3,585
FEMALE POPULATION
97.18
MALES / 100 FEMALES
102.90
FEMALES / 100 MALES
30.3
MEDIAN AGE
3.8
AVG FAMILY SIZE
3.5
AVG HOUSEHOLD SIZE
3,797
LABOR FORCE [ PEOPLE ]
72.9%
PERCENT IN LABOR FORCE
4.4%
UNEMPLOYMENT RATE
Income in Highgrove
Income Overview in Highgrove
Per Capita Income in Highgrove is $34,491, while median incomes of families and households are $100,682 and $100,540 respectively.
| Characteristic | Number | Measure |
| Per Capita Income | 7,069 | $34,491 |
| Median Family Income | 1,620 | $100,682 |
| Mean Family Income | 1,620 | $119,192 |
| Median Household Income | 2,015 | $100,540 |
| Mean Household Income | 2,015 | $116,379 |
| Income Deficit | 1,620 | $0 |
| Wage / Income Gap (%) | 7,069 | 10.75% |
| Wage / Income Gap ($) | 7,069 | 89.25¢ per $1 |
| Gini / Inequality Index | 7,069 | 0.36 |
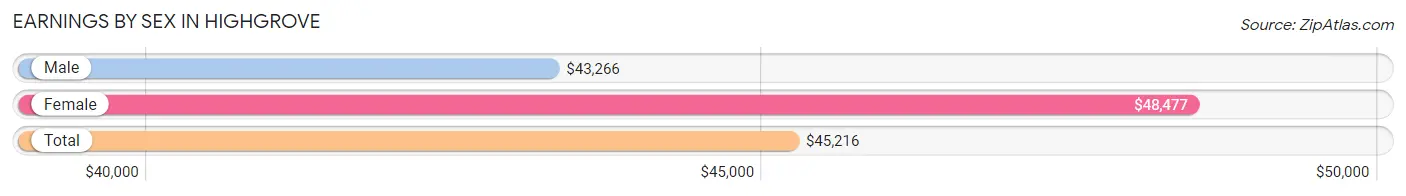
Earnings by Sex in Highgrove
Average Earnings in Highgrove are $45,216, $43,266 for men and $48,477 for women, a difference of 10.7%.
| Sex | Number | Average Earnings |
| Male | 2,025 (52.9%) | $43,266 |
| Female | 1,806 (47.1%) | $48,477 |
| Total | 3,831 (100.0%) | $45,216 |
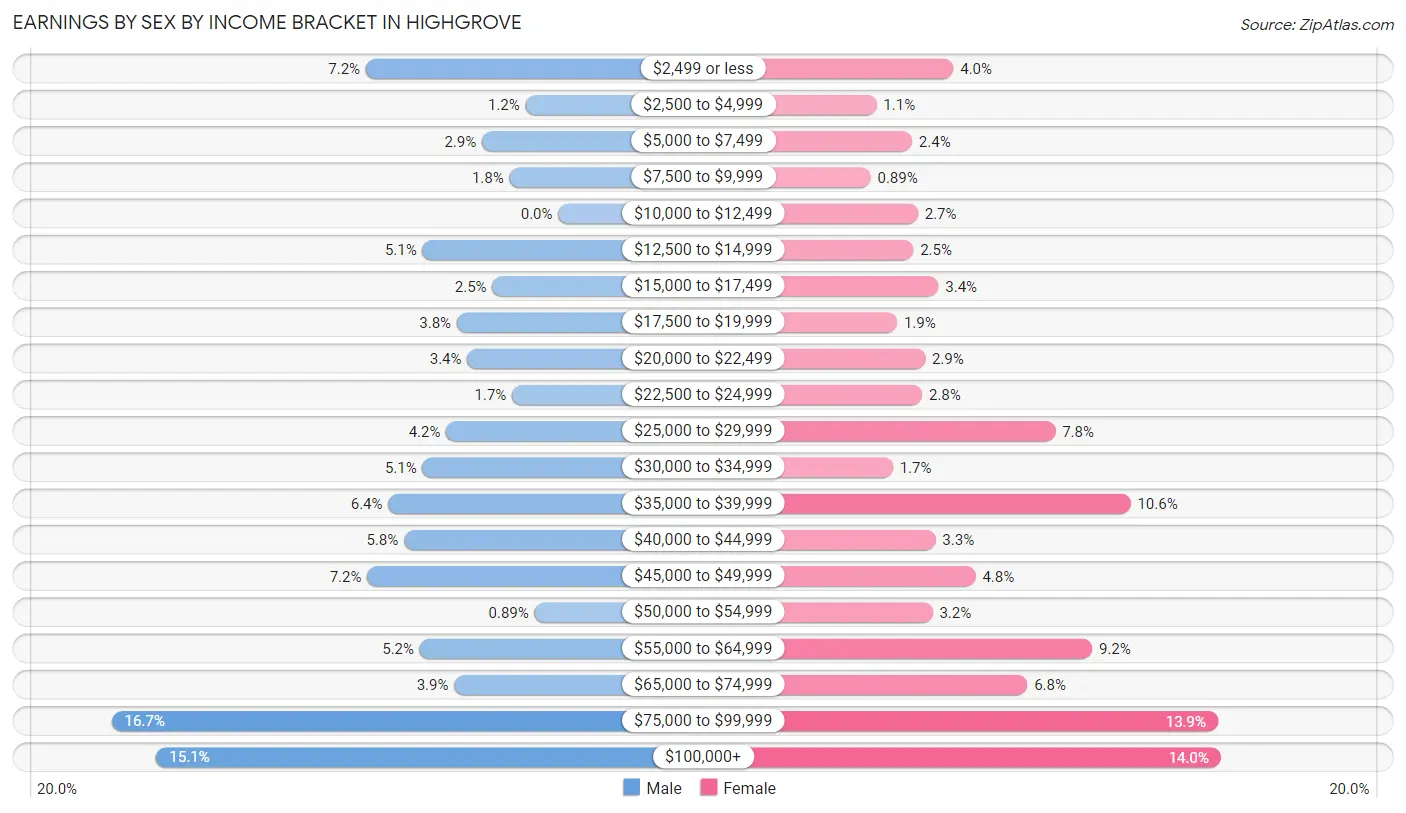
Earnings by Sex by Income Bracket in Highgrove
The most common earnings brackets in Highgrove are $75,000 to $99,999 for men (339 | 16.7%) and $100,000+ for women (253 | 14.0%).
| Income | Male | Female |
| $2,499 or less | 146 (7.2%) | 72 (4.0%) |
| $2,500 to $4,999 | 25 (1.2%) | 20 (1.1%) |
| $5,000 to $7,499 | 58 (2.9%) | 44 (2.4%) |
| $7,500 to $9,999 | 37 (1.8%) | 16 (0.9%) |
| $10,000 to $12,499 | 0 (0.0%) | 48 (2.7%) |
| $12,500 to $14,999 | 103 (5.1%) | 45 (2.5%) |
| $15,000 to $17,499 | 50 (2.5%) | 62 (3.4%) |
| $17,500 to $19,999 | 77 (3.8%) | 34 (1.9%) |
| $20,000 to $22,499 | 69 (3.4%) | 53 (2.9%) |
| $22,500 to $24,999 | 35 (1.7%) | 51 (2.8%) |
| $25,000 to $29,999 | 85 (4.2%) | 141 (7.8%) |
| $30,000 to $34,999 | 103 (5.1%) | 31 (1.7%) |
| $35,000 to $39,999 | 129 (6.4%) | 192 (10.6%) |
| $40,000 to $44,999 | 117 (5.8%) | 60 (3.3%) |
| $45,000 to $49,999 | 145 (7.2%) | 87 (4.8%) |
| $50,000 to $54,999 | 18 (0.9%) | 58 (3.2%) |
| $55,000 to $64,999 | 105 (5.2%) | 166 (9.2%) |
| $65,000 to $74,999 | 79 (3.9%) | 122 (6.8%) |
| $75,000 to $99,999 | 339 (16.7%) | 251 (13.9%) |
| $100,000+ | 305 (15.1%) | 253 (14.0%) |
| Total | 2,025 (100.0%) | 1,806 (100.0%) |
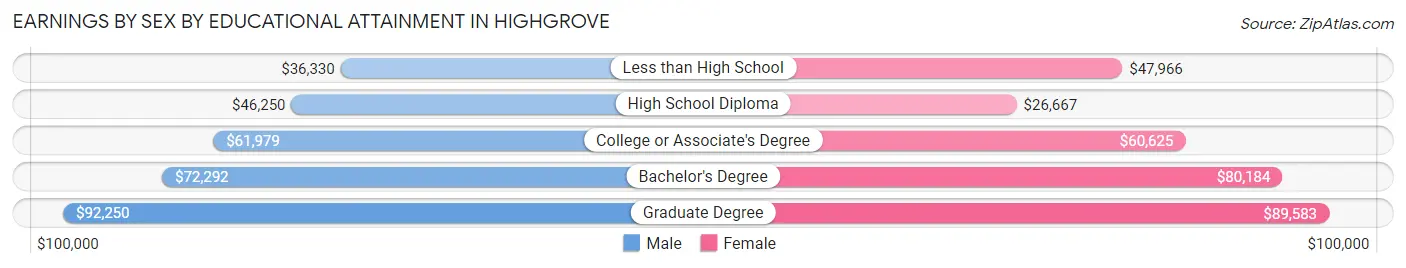
Earnings by Sex by Educational Attainment in Highgrove
Average earnings in Highgrove are $52,639 for men and $60,453 for women, a difference of 12.9%. Men with an educational attainment of graduate degree enjoy the highest average annual earnings of $92,250, while those with less than high school education earn the least with $36,330. Women with an educational attainment of graduate degree earn the most with the average annual earnings of $89,583, while those with high school diploma education have the smallest earnings of $26,667.
| Educational Attainment | Male Income | Female Income |
| Less than High School | $36,330 | $47,966 |
| High School Diploma | $46,250 | $26,667 |
| College or Associate's Degree | $61,979 | $60,625 |
| Bachelor's Degree | $72,292 | $80,184 |
| Graduate Degree | $92,250 | $89,583 |
| Total | $52,639 | $60,453 |
Family Income in Highgrove
Family Income Brackets in Highgrove
According to the Highgrove family income data, there are 387 families falling into the $50,000 to $74,999 income range, which is the most common income bracket and makes up 23.9% of all families.
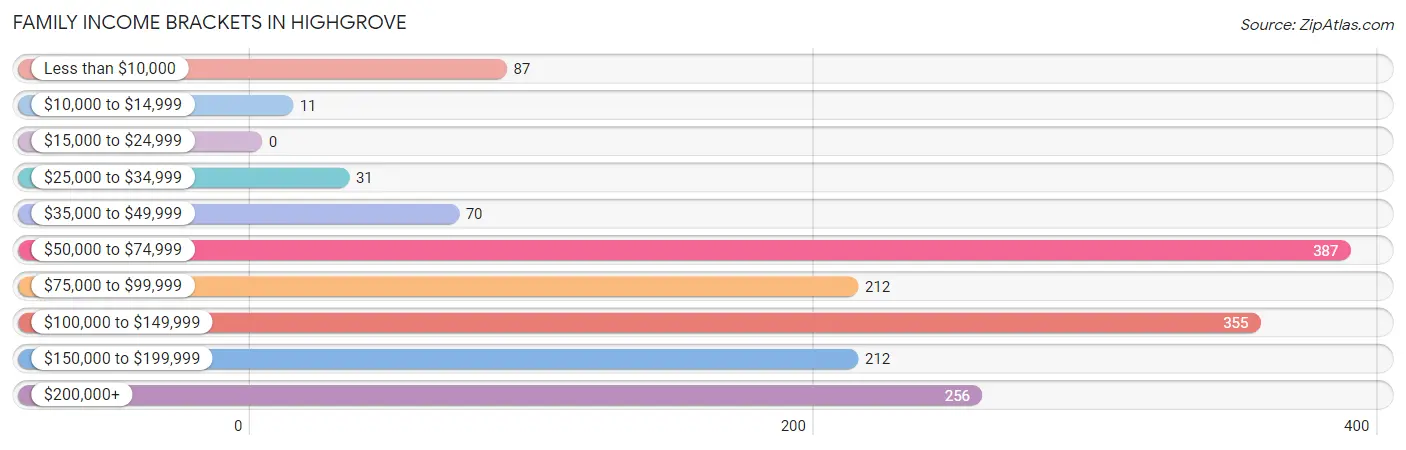
| Income Bracket | # Families | % Families |
| Less than $10,000 | 87 | 5.4% |
| $10,000 to $14,999 | 11 | 0.7% |
| $15,000 to $24,999 | 0 | 0.0% |
| $25,000 to $34,999 | 31 | 1.9% |
| $35,000 to $49,999 | 70 | 4.3% |
| $50,000 to $74,999 | 387 | 23.9% |
| $75,000 to $99,999 | 212 | 13.1% |
| $100,000 to $149,999 | 355 | 21.9% |
| $150,000 to $199,999 | 212 | 13.1% |
| $200,000+ | 256 | 15.8% |
Family Income by Famaliy Size in Highgrove
6-person families (149 | 9.2%) account for the highest median family income in Highgrove with $147,477 per family, while 2-person families (542 | 33.5%) have the highest median income of $49,250 per family member.
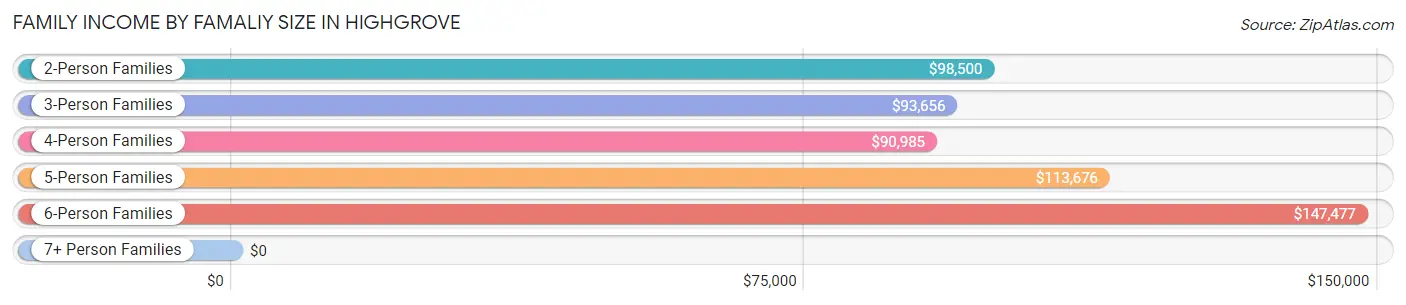
| Income Bracket | # Families | Median Income |
| 2-Person Families | 542 (33.5%) | $98,500 |
| 3-Person Families | 377 (23.3%) | $93,656 |
| 4-Person Families | 340 (21.0%) | $90,985 |
| 5-Person Families | 98 (6.0%) | $113,676 |
| 6-Person Families | 149 (9.2%) | $147,477 |
| 7+ Person Families | 114 (7.0%) | $0 |
| Total | 1,620 (100.0%) | $100,682 |
Family Income by Number of Earners in Highgrove
The median family income in Highgrove is $100,682, with families comprising 3+ earners (209) having the highest median family income of $160,750, while families with no earners (146) have the lowest median family income of $42,941, accounting for 12.9% and 9.0% of families, respectively.
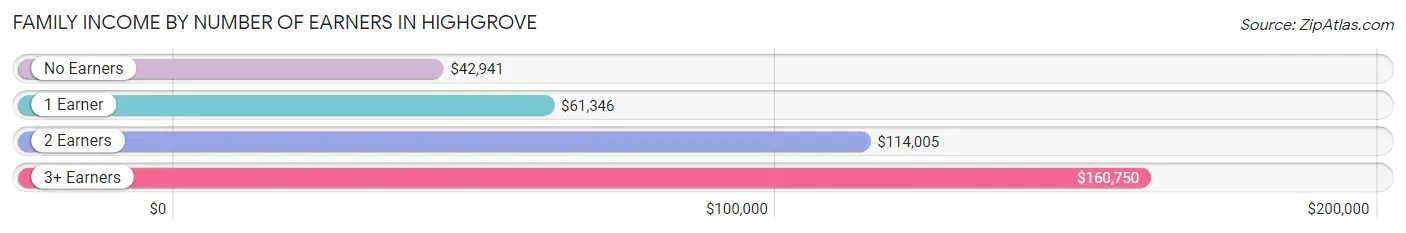
| Number of Earners | # Families | Median Income |
| No Earners | 146 (9.0%) | $42,941 |
| 1 Earner | 356 (22.0%) | $61,346 |
| 2 Earners | 909 (56.1%) | $114,005 |
| 3+ Earners | 209 (12.9%) | $160,750 |
| Total | 1,620 (100.0%) | $100,682 |
Household Income in Highgrove
Household Income Brackets in Highgrove
With 492 households falling in the category, the $100,000 to $149,999 income range is the most frequent in Highgrove, accounting for 24.4% of all households. In contrast, only 10 households (0.5%) fall into the $10,000 to $14,999 income bracket, making it the least populous group.
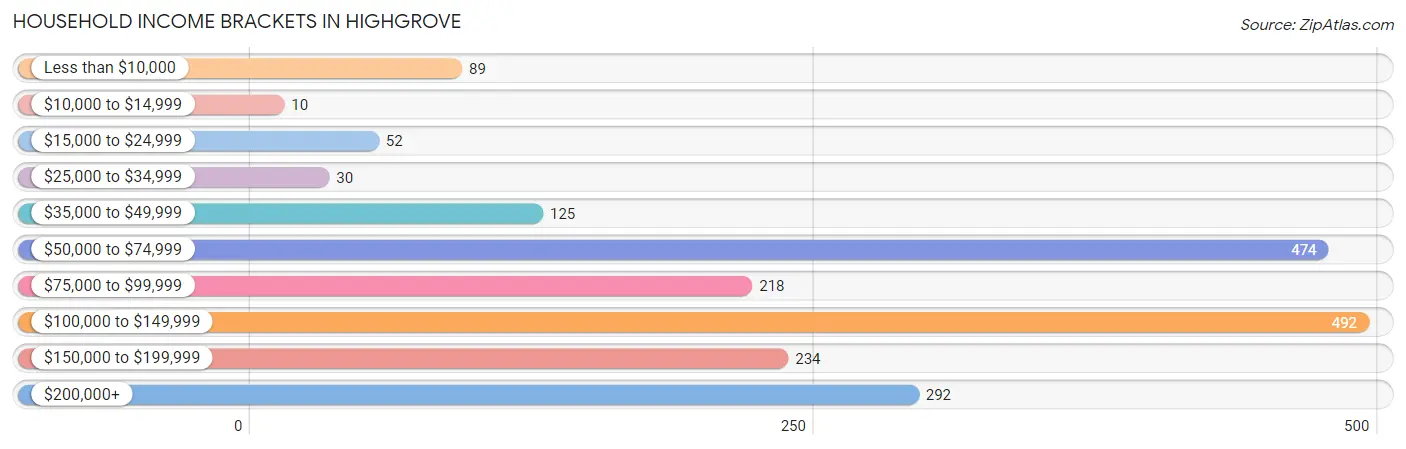
| Income Bracket | # Households | % Households |
| Less than $10,000 | 89 | 4.4% |
| $10,000 to $14,999 | 10 | 0.5% |
| $15,000 to $24,999 | 52 | 2.6% |
| $25,000 to $34,999 | 30 | 1.5% |
| $35,000 to $49,999 | 125 | 6.2% |
| $50,000 to $74,999 | 474 | 23.5% |
| $75,000 to $99,999 | 218 | 10.8% |
| $100,000 to $149,999 | 492 | 24.4% |
| $150,000 to $199,999 | 234 | 11.6% |
| $200,000+ | 292 | 14.5% |
Household Income by Householder Age in Highgrove
The median household income in Highgrove is $100,540, with the highest median household income of $109,583 found in the 45 to 64 years age bracket for the primary householder. A total of 925 households (45.9%) fall into this category. Meanwhile, the 15 to 24 years age bracket for the primary householder has the lowest median household income of $0, with 11 households (0.5%) in this group.
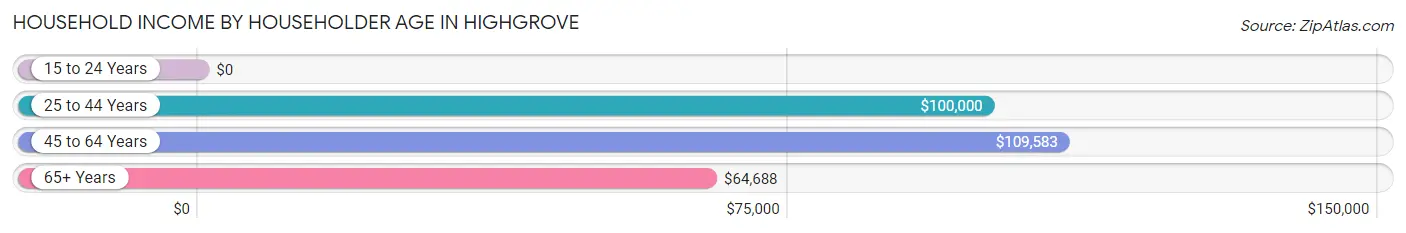
| Income Bracket | # Households | Median Income |
| 15 to 24 Years | 11 (0.5%) | $0 |
| 25 to 44 Years | 932 (46.3%) | $100,000 |
| 45 to 64 Years | 925 (45.9%) | $109,583 |
| 65+ Years | 147 (7.3%) | $64,688 |
| Total | 2,015 (100.0%) | $100,540 |
Poverty in Highgrove
Income Below Poverty by Sex and Age in Highgrove
With 5.9% poverty level for males and 7.1% for females among the residents of Highgrove, 5 year old males and 35 to 44 year old females are the most vulnerable to poverty, with 13 males (29.5%) and 97 females (19.1%) in their respective age groups living below the poverty level.
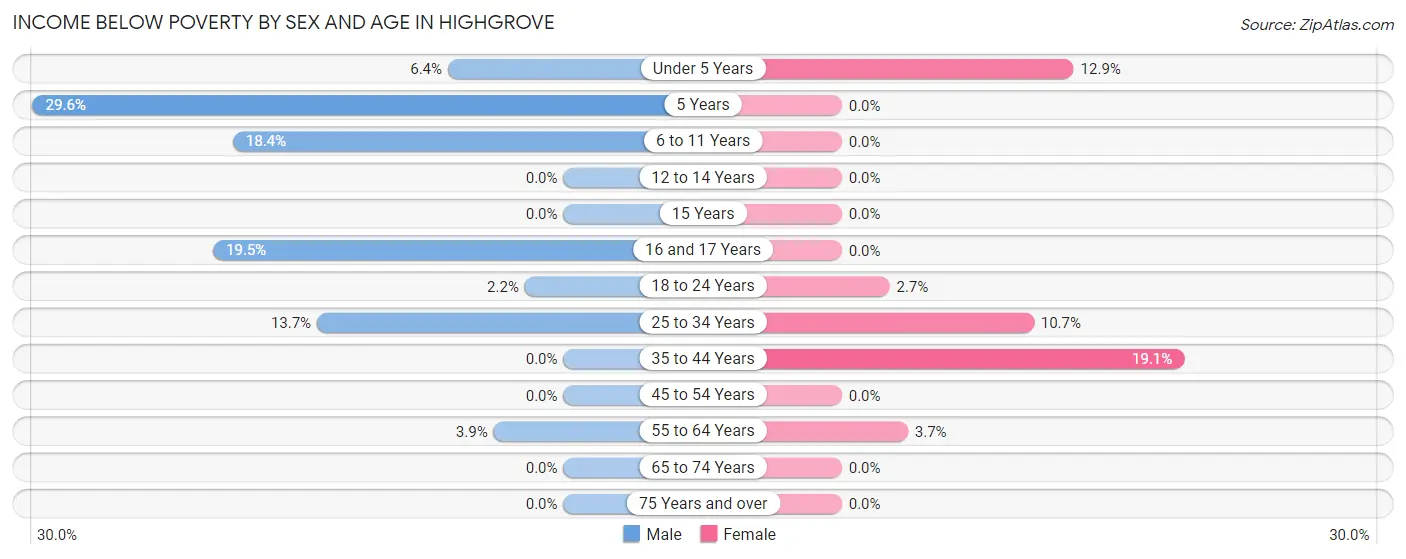
| Age Bracket | Male | Female |
| Under 5 Years | 16 (6.4%) | 55 (12.9%) |
| 5 Years | 13 (29.5%) | 0 (0.0%) |
| 6 to 11 Years | 53 (18.4%) | 0 (0.0%) |
| 12 to 14 Years | 0 (0.0%) | 0 (0.0%) |
| 15 Years | 0 (0.0%) | 0 (0.0%) |
| 16 and 17 Years | 16 (19.5%) | 0 (0.0%) |
| 18 to 24 Years | 11 (2.1%) | 11 (2.7%) |
| 25 to 34 Years | 80 (13.7%) | 76 (10.7%) |
| 35 to 44 Years | 0 (0.0%) | 97 (19.1%) |
| 45 to 54 Years | 0 (0.0%) | 0 (0.0%) |
| 55 to 64 Years | 16 (3.9%) | 14 (3.7%) |
| 65 to 74 Years | 0 (0.0%) | 0 (0.0%) |
| 75 Years and over | 0 (0.0%) | 0 (0.0%) |
| Total | 205 (5.9%) | 253 (7.1%) |
Income Above Poverty by Sex and Age in Highgrove
According to the poverty statistics in Highgrove, males aged 12 to 14 years and females aged 5 years are the age groups that are most secure financially, with 100.0% of males and 100.0% of females in these age groups living above the poverty line.
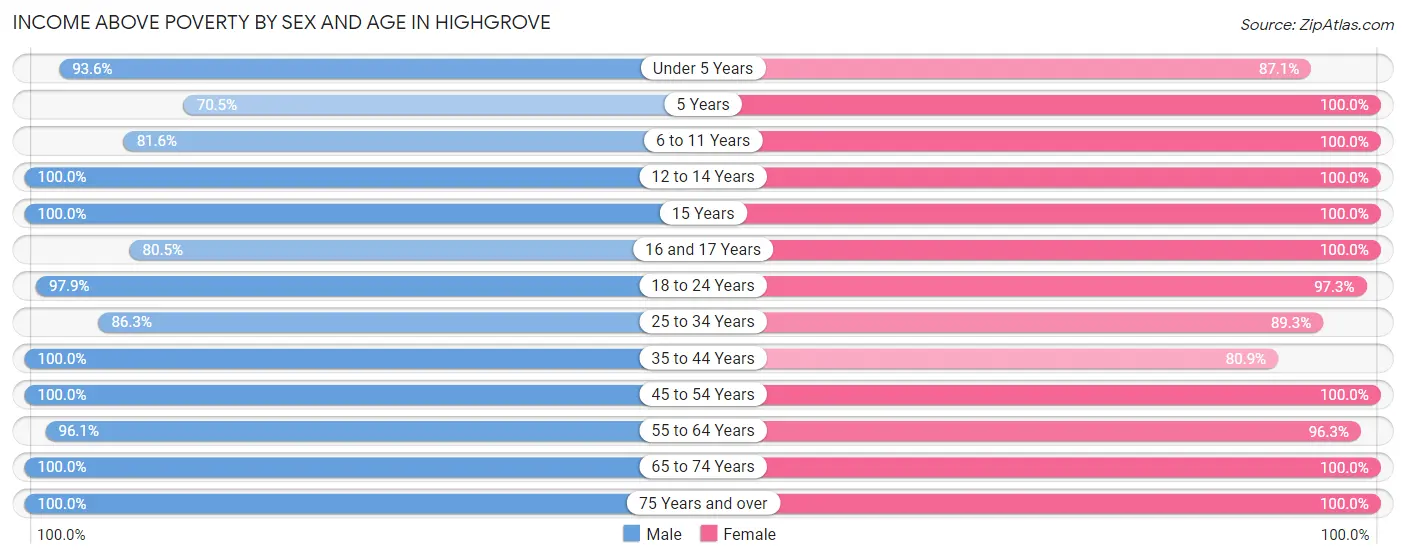
| Age Bracket | Male | Female |
| Under 5 Years | 233 (93.6%) | 371 (87.1%) |
| 5 Years | 31 (70.5%) | 36 (100.0%) |
| 6 to 11 Years | 235 (81.6%) | 211 (100.0%) |
| 12 to 14 Years | 141 (100.0%) | 271 (100.0%) |
| 15 Years | 132 (100.0%) | 29 (100.0%) |
| 16 and 17 Years | 66 (80.5%) | 52 (100.0%) |
| 18 to 24 Years | 500 (97.9%) | 402 (97.3%) |
| 25 to 34 Years | 503 (86.3%) | 635 (89.3%) |
| 35 to 44 Years | 347 (100.0%) | 412 (80.9%) |
| 45 to 54 Years | 430 (100.0%) | 339 (100.0%) |
| 55 to 64 Years | 395 (96.1%) | 366 (96.3%) |
| 65 to 74 Years | 129 (100.0%) | 112 (100.0%) |
| 75 Years and over | 103 (100.0%) | 96 (100.0%) |
| Total | 3,245 (94.1%) | 3,332 (92.9%) |
Income Below Poverty Among Married-Couple Families in Highgrove
The poverty statistics for married-couple families in Highgrove show that 3.6% or 45 of the total 1,244 families live below the poverty line. Families with no children have the highest poverty rate of 5.5%, comprising of 34 families. On the other hand, families with 3 or 4 children have the lowest poverty rate of 0.0%, which includes 0 families.
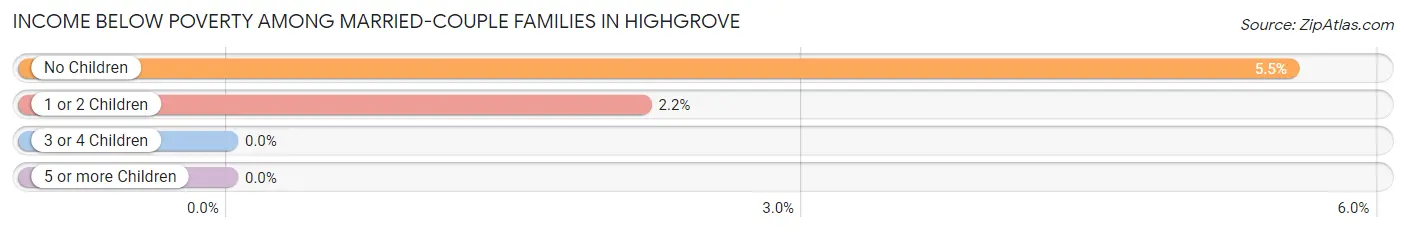
| Children | Above Poverty | Below Poverty |
| No Children | 580 (94.5%) | 34 (5.5%) |
| 1 or 2 Children | 498 (97.8%) | 11 (2.2%) |
| 3 or 4 Children | 121 (100.0%) | 0 (0.0%) |
| 5 or more Children | 0 (0.0%) | 0 (0.0%) |
| Total | 1,199 (96.4%) | 45 (3.6%) |
Income Below Poverty Among Single-Parent Households in Highgrove
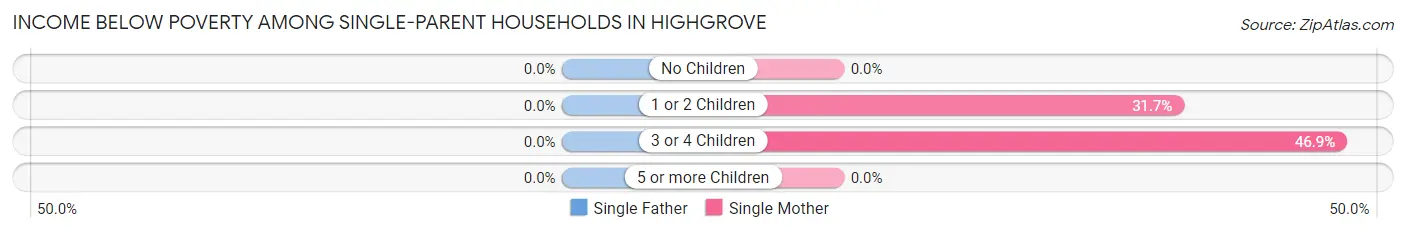
| Children | Single Father | Single Mother |
| No Children | 0 (0.0%) | 0 (0.0%) |
| 1 or 2 Children | 0 (0.0%) | 39 (31.7%) |
| 3 or 4 Children | 0 (0.0%) | 15 (46.9%) |
| 5 or more Children | 0 (0.0%) | 0 (0.0%) |
| Total | 0 (0.0%) | 54 (24.1%) |
Income Below Poverty Among Married-Couple vs Single-Parent Households in Highgrove
The poverty data for Highgrove shows that 45 of the married-couple family households (3.6%) and 54 of the single-parent households (14.4%) are living below the poverty level. Within the married-couple family households, those with no children have the highest poverty rate, with 34 households (5.5%) falling below the poverty line. Among the single-parent households, those with 3 or 4 children have the highest poverty rate, with 15 household (46.9%) living below poverty.
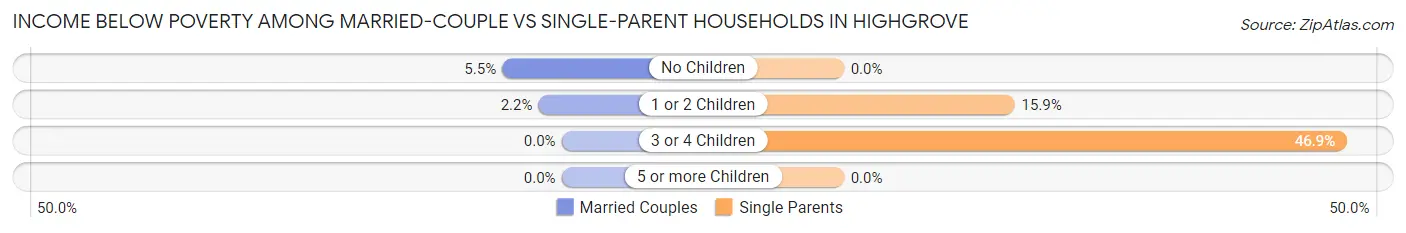
| Children | Married-Couple Families | Single-Parent Households |
| No Children | 34 (5.5%) | 0 (0.0%) |
| 1 or 2 Children | 11 (2.2%) | 39 (15.9%) |
| 3 or 4 Children | 0 (0.0%) | 15 (46.9%) |
| 5 or more Children | 0 (0.0%) | 0 (0.0%) |
| Total | 45 (3.6%) | 54 (14.4%) |
Race in Highgrove
The most populous races in Highgrove are Hispanic or Latino (4,076 | 57.7%), Some other Race (2,515 | 35.6%), and White / Caucasian (2,312 | 32.7%).
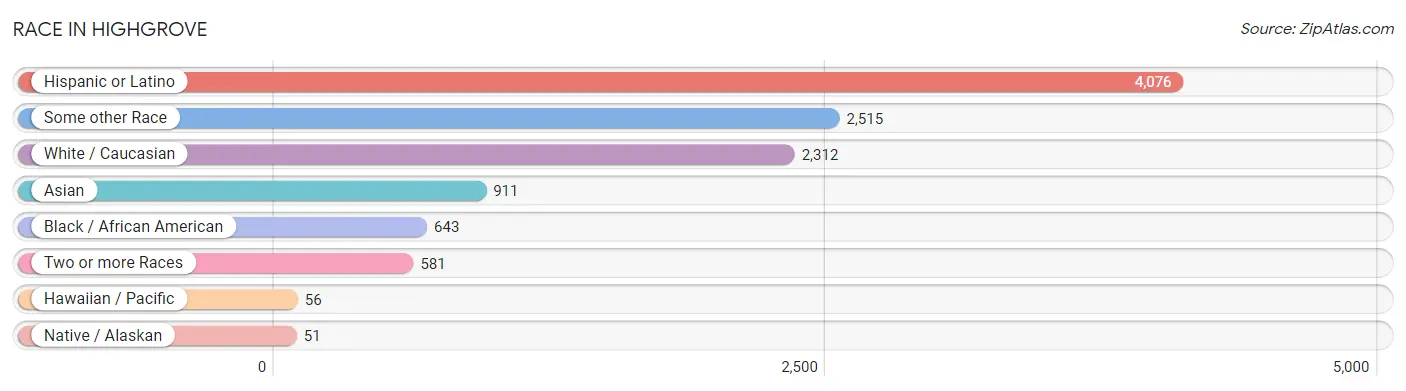
| Race | # Population | % Population |
| Asian | 911 | 12.9% |
| Black / African American | 643 | 9.1% |
| Hawaiian / Pacific | 56 | 0.8% |
| Hispanic or Latino | 4,076 | 57.7% |
| Native / Alaskan | 51 | 0.7% |
| White / Caucasian | 2,312 | 32.7% |
| Two or more Races | 581 | 8.2% |
| Some other Race | 2,515 | 35.6% |
| Total | 7,069 | 100.0% |
Ancestry in Highgrove
The most populous ancestries reported in Highgrove are Mexican (3,630 | 51.3%), English (319 | 4.5%), Central American (313 | 4.4%), Korean (269 | 3.8%), and Italian (198 | 2.8%), together accounting for 66.9% of all Highgrove residents.
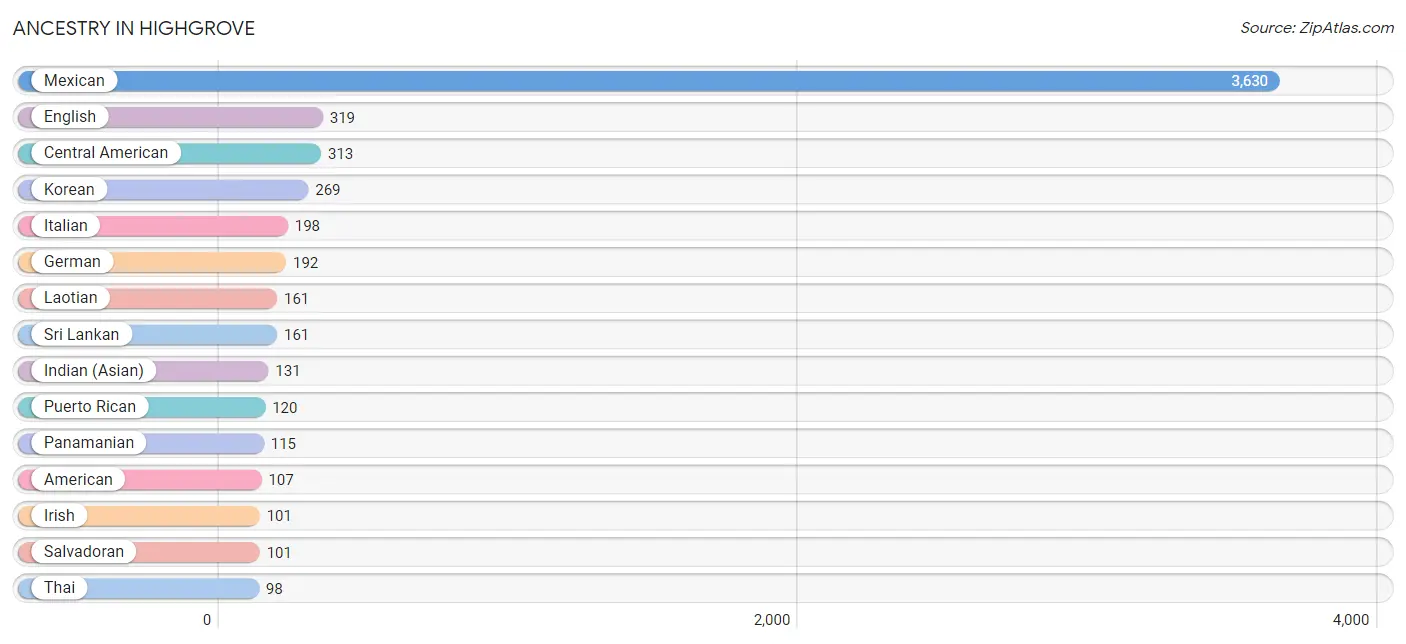
| Ancestry | # Population | % Population |
| African | 41 | 0.6% |
| American | 107 | 1.5% |
| Blackfeet | 56 | 0.8% |
| Central American | 313 | 4.4% |
| Central American Indian | 67 | 0.9% |
| Cherokee | 20 | 0.3% |
| Costa Rican | 97 | 1.4% |
| Czech | 18 | 0.3% |
| Danish | 20 | 0.3% |
| Dutch | 21 | 0.3% |
| English | 319 | 4.5% |
| French | 54 | 0.8% |
| German | 192 | 2.7% |
| Greek | 16 | 0.2% |
| Guamanian / Chamorro | 56 | 0.8% |
| Indian (Asian) | 131 | 1.8% |
| Irish | 101 | 1.4% |
| Italian | 198 | 2.8% |
| Japanese | 57 | 0.8% |
| Korean | 269 | 3.8% |
| Laotian | 161 | 2.3% |
| Mexican | 3,630 | 51.3% |
| Mexican American Indian | 34 | 0.5% |
| Nigerian | 40 | 0.6% |
| Norwegian | 19 | 0.3% |
| Panamanian | 115 | 1.6% |
| Portuguese | 83 | 1.2% |
| Puerto Rican | 120 | 1.7% |
| Salvadoran | 101 | 1.4% |
| Scotch-Irish | 20 | 0.3% |
| Scottish | 21 | 0.3% |
| Sri Lankan | 161 | 2.3% |
| Subsaharan African | 81 | 1.1% |
| Swiss | 18 | 0.3% |
| Thai | 98 | 1.4% |
| Turkish | 14 | 0.2% |
| Yaqui | 16 | 0.2% | View All 37 Rows |
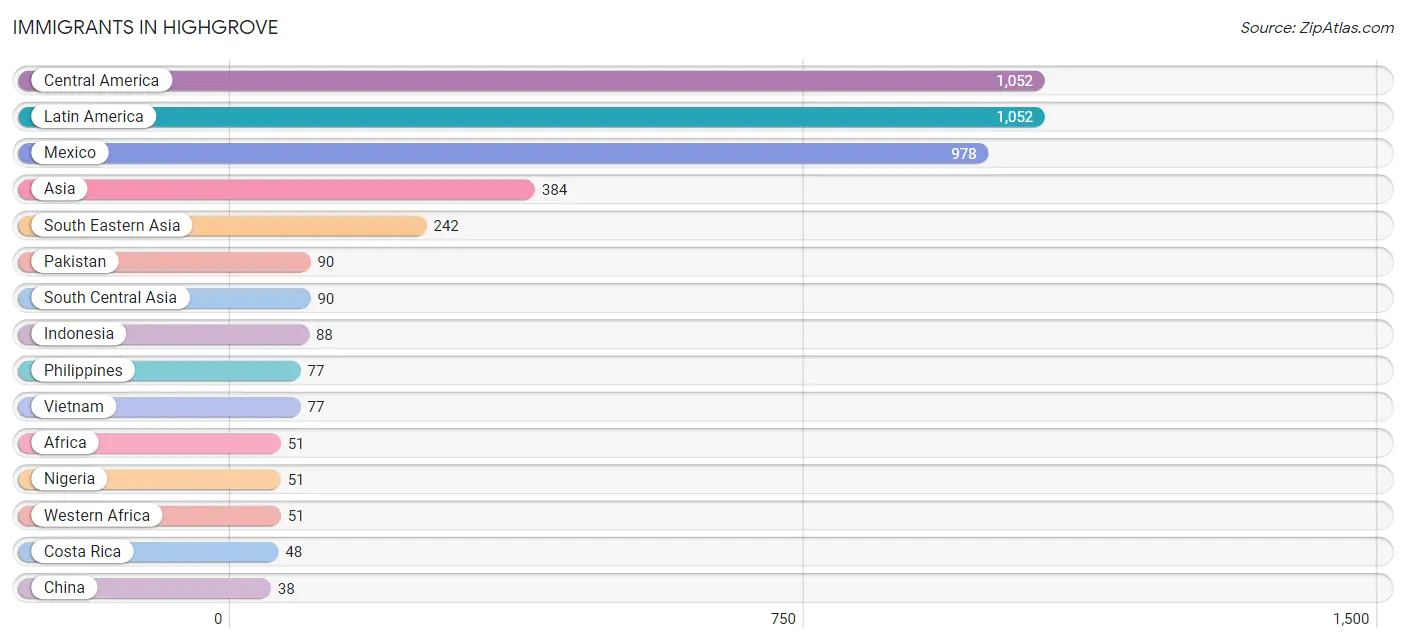
Immigrants in Highgrove
The most numerous immigrant groups reported in Highgrove came from Central America (1,052 | 14.9%), Latin America (1,052 | 14.9%), Mexico (978 | 13.8%), Asia (384 | 5.4%), and South Eastern Asia (242 | 3.4%), together accounting for 52.4% of all Highgrove residents.
| Immigration Origin | # Population | % Population |
| Africa | 51 | 0.7% |
| Asia | 384 | 5.4% |
| Central America | 1,052 | 14.9% |
| China | 38 | 0.5% |
| Costa Rica | 48 | 0.7% |
| Eastern Asia | 38 | 0.5% |
| El Salvador | 26 | 0.4% |
| Europe | 20 | 0.3% |
| Indonesia | 88 | 1.2% |
| Latin America | 1,052 | 14.9% |
| Mexico | 978 | 13.8% |
| Nigeria | 51 | 0.7% |
| Northern Europe | 20 | 0.3% |
| Pakistan | 90 | 1.3% |
| Philippines | 77 | 1.1% |
| South Central Asia | 90 | 1.3% |
| South Eastern Asia | 242 | 3.4% |
| Turkey | 14 | 0.2% |
| Vietnam | 77 | 1.1% |
| Western Africa | 51 | 0.7% |
| Western Asia | 14 | 0.2% | View All 21 Rows |
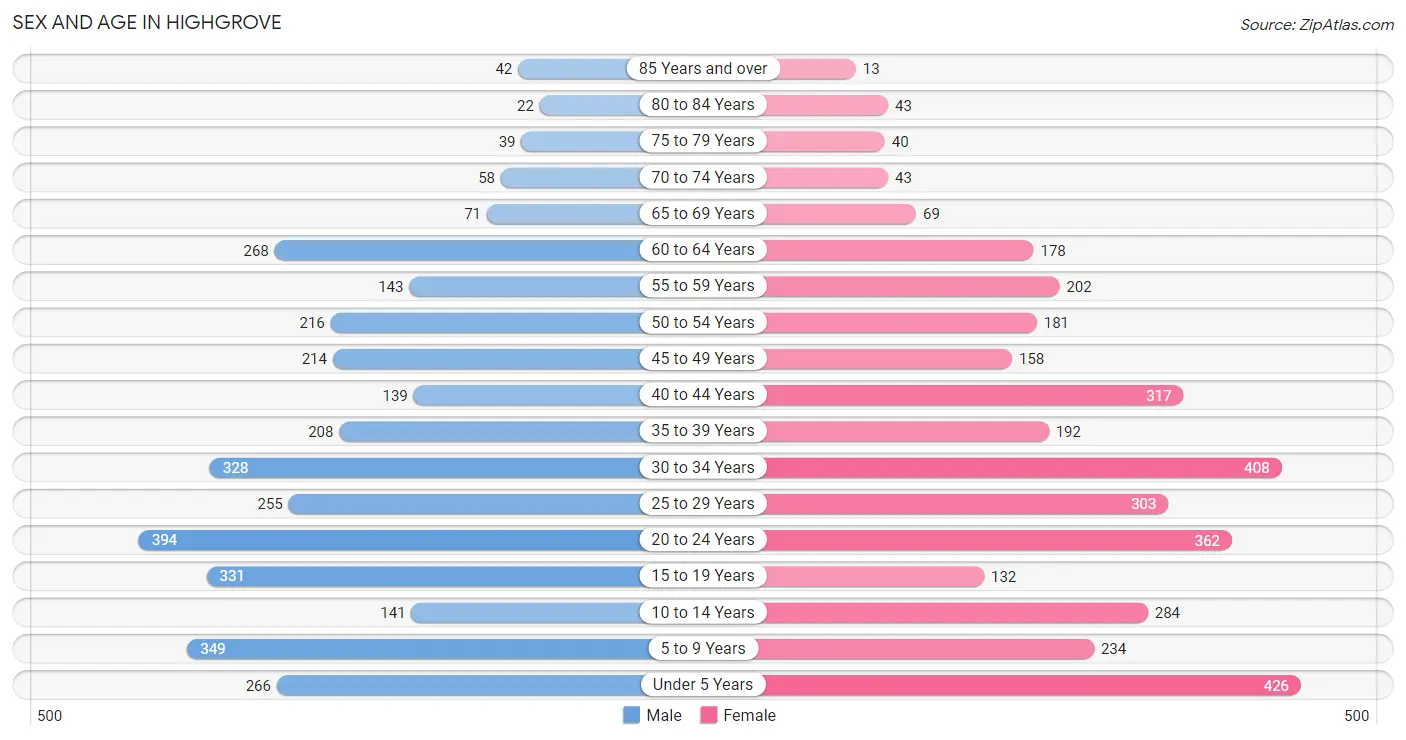
Sex and Age in Highgrove
Sex and Age in Highgrove
The most populous age groups in Highgrove are 20 to 24 Years (394 | 11.3%) for men and Under 5 Years (426 | 11.9%) for women.
| Age Bracket | Male | Female |
| Under 5 Years | 266 (7.6%) | 426 (11.9%) |
| 5 to 9 Years | 349 (10.0%) | 234 (6.5%) |
| 10 to 14 Years | 141 (4.1%) | 284 (7.9%) |
| 15 to 19 Years | 331 (9.5%) | 132 (3.7%) |
| 20 to 24 Years | 394 (11.3%) | 362 (10.1%) |
| 25 to 29 Years | 255 (7.3%) | 303 (8.5%) |
| 30 to 34 Years | 328 (9.4%) | 408 (11.4%) |
| 35 to 39 Years | 208 (6.0%) | 192 (5.4%) |
| 40 to 44 Years | 139 (4.0%) | 317 (8.8%) |
| 45 to 49 Years | 214 (6.1%) | 158 (4.4%) |
| 50 to 54 Years | 216 (6.2%) | 181 (5.1%) |
| 55 to 59 Years | 143 (4.1%) | 202 (5.6%) |
| 60 to 64 Years | 268 (7.7%) | 178 (5.0%) |
| 65 to 69 Years | 71 (2.0%) | 69 (1.9%) |
| 70 to 74 Years | 58 (1.7%) | 43 (1.2%) |
| 75 to 79 Years | 39 (1.1%) | 40 (1.1%) |
| 80 to 84 Years | 22 (0.6%) | 43 (1.2%) |
| 85 Years and over | 42 (1.2%) | 13 (0.4%) |
| Total | 3,484 (100.0%) | 3,585 (100.0%) |
Families and Households in Highgrove
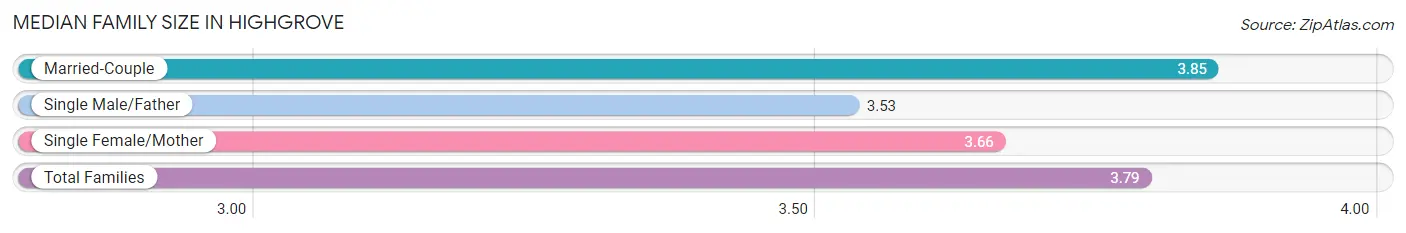
Median Family Size in Highgrove
The median family size in Highgrove is 3.79 persons per family, with married-couple families (1,244 | 76.8%) accounting for the largest median family size of 3.85 persons per family. On the other hand, single male/father families (152 | 9.4%) represent the smallest median family size with 3.53 persons per family.
| Family Type | # Families | Family Size |
| Married-Couple | 1,244 (76.8%) | 3.85 |
| Single Male/Father | 152 (9.4%) | 3.53 |
| Single Female/Mother | 224 (13.8%) | 3.66 |
| Total Families | 1,620 (100.0%) | 3.79 |
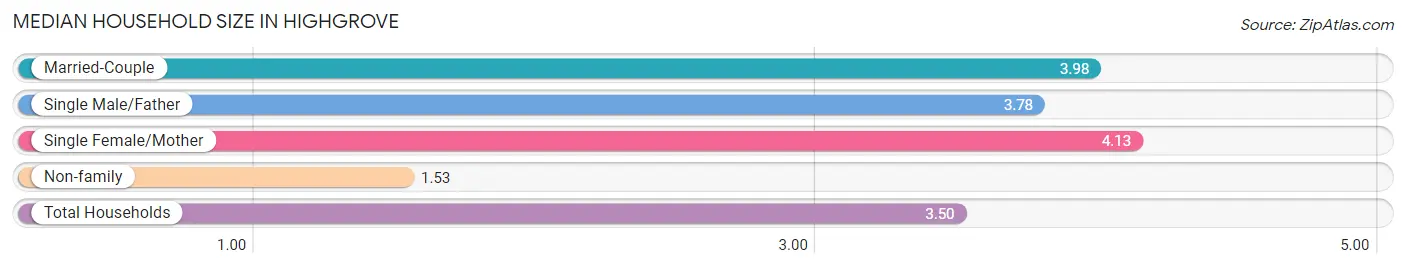
Median Household Size in Highgrove
The median household size in Highgrove is 3.50 persons per household, with single female/mother households (224 | 11.1%) accounting for the largest median household size of 4.13 persons per household. non-family households (395 | 19.6%) represent the smallest median household size with 1.53 persons per household.
| Household Type | # Households | Household Size |
| Married-Couple | 1,244 (61.7%) | 3.98 |
| Single Male/Father | 152 (7.5%) | 3.78 |
| Single Female/Mother | 224 (11.1%) | 4.13 |
| Non-family | 395 (19.6%) | 1.53 |
| Total Households | 2,015 (100.0%) | 3.50 |
Household Size by Marriage Status in Highgrove
Out of a total of 2,015 households in Highgrove, 1,620 (80.4%) are family households, while 395 (19.6%) are nonfamily households. The most numerous type of family households are 2-person households, comprising 513, and the most common type of nonfamily households are 1-person households, comprising 280.
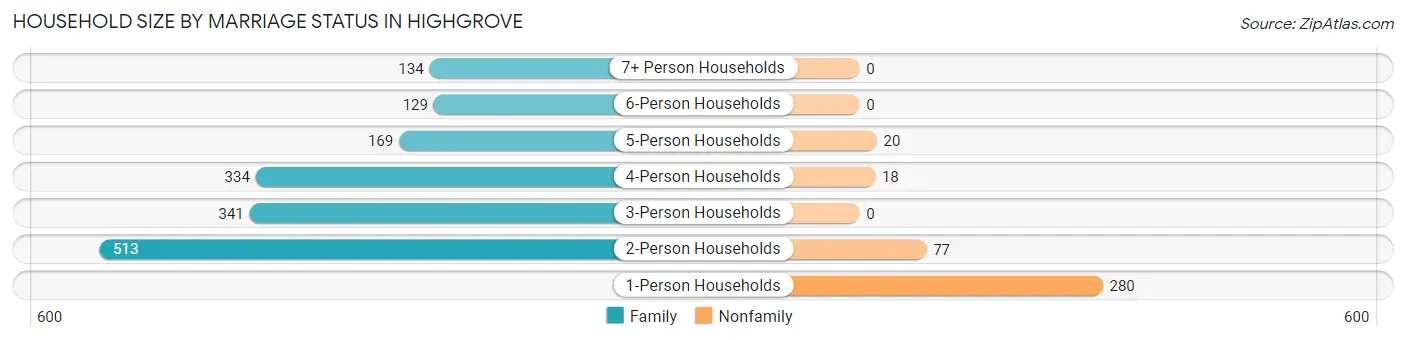
| Household Size | Family Households | Nonfamily Households |
| 1-Person Households | - | 280 (13.9%) |
| 2-Person Households | 513 (25.5%) | 77 (3.8%) |
| 3-Person Households | 341 (16.9%) | 0 (0.0%) |
| 4-Person Households | 334 (16.6%) | 18 (0.9%) |
| 5-Person Households | 169 (8.4%) | 20 (1.0%) |
| 6-Person Households | 129 (6.4%) | 0 (0.0%) |
| 7+ Person Households | 134 (6.7%) | 0 (0.0%) |
| Total | 1,620 (80.4%) | 395 (19.6%) |
Female Fertility in Highgrove
Fertility by Age in Highgrove
Average fertility rate in Highgrove is 34.0 births per 1,000 women. Women in the age bracket of 20 to 34 years have the highest fertility rate with 52.0 births per 1,000 women. Women in the age bracket of 20 to 34 years acount for 83.6% of all women with births.
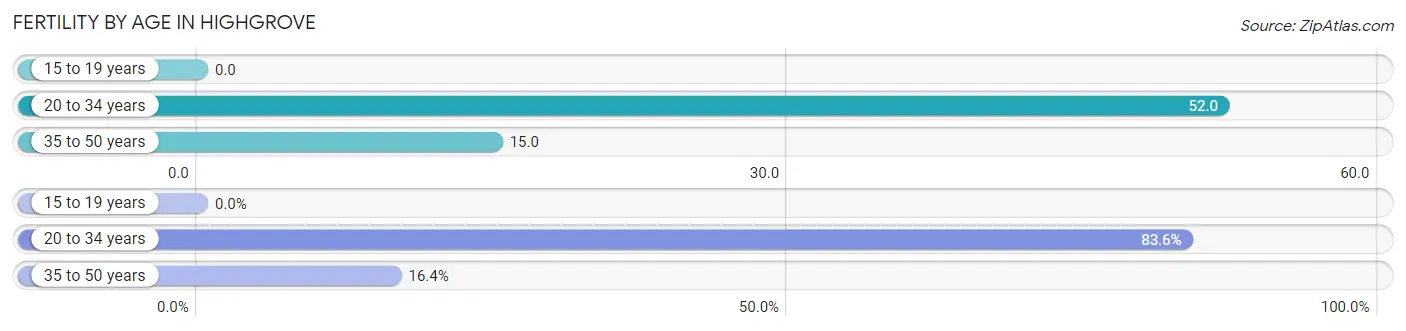
| Age Bracket | Women with Births | Births / 1,000 Women |
| 15 to 19 years | 0 (0.0%) | 0.0 |
| 20 to 34 years | 56 (83.6%) | 52.0 |
| 35 to 50 years | 11 (16.4%) | 15.0 |
| Total | 67 (100.0%) | 34.0 |
Fertility by Age by Marriage Status in Highgrove
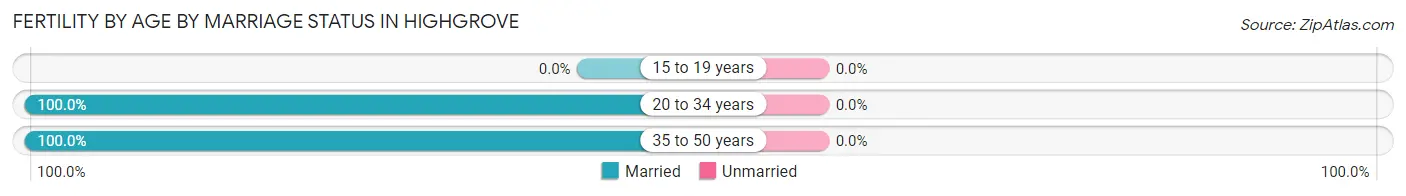
| Age Bracket | Married | Unmarried |
| 15 to 19 years | 0 (0.0%) | 0 (0.0%) |
| 20 to 34 years | 56 (100.0%) | 0 (0.0%) |
| 35 to 50 years | 11 (100.0%) | 0 (0.0%) |
| Total | 67 (100.0%) | 0 (0.0%) |
Fertility by Education in Highgrove
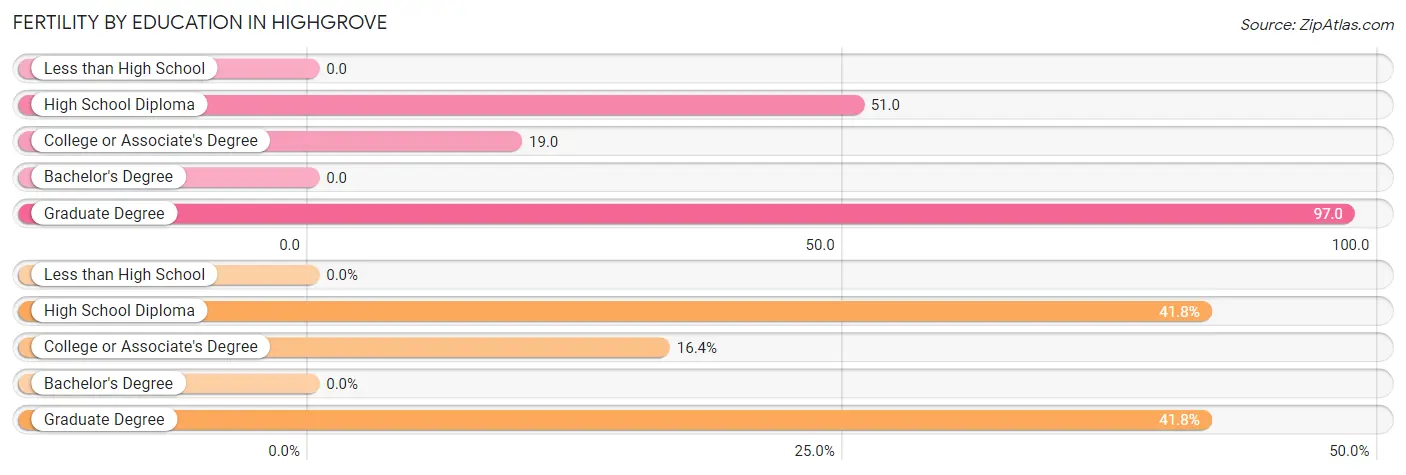
| Educational Attainment | Women with Births | Births / 1,000 Women |
| Less than High School | 0 (0.0%) | 0.0 |
| High School Diploma | 28 (41.8%) | 51.0 |
| College or Associate's Degree | 11 (16.4%) | 19.0 |
| Bachelor's Degree | 0 (0.0%) | 0.0 |
| Graduate Degree | 28 (41.8%) | 97.0 |
| Total | 67 (100.0%) | 34.0 |
Fertility by Education by Marriage Status in Highgrove
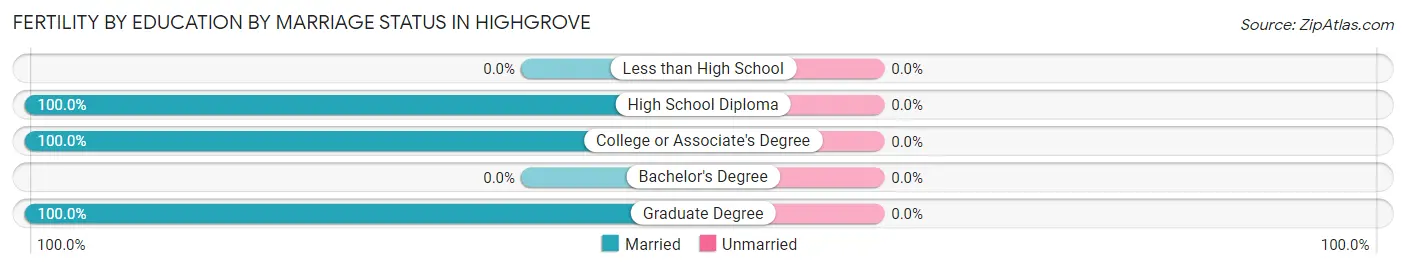
| Educational Attainment | Married | Unmarried |
| Less than High School | 0 (0.0%) | 0 (0.0%) |
| High School Diploma | 28 (100.0%) | 0 (0.0%) |
| College or Associate's Degree | 11 (100.0%) | 0 (0.0%) |
| Bachelor's Degree | 0 (0.0%) | 0 (0.0%) |
| Graduate Degree | 28 (100.0%) | 0 (0.0%) |
| Total | 67 (100.0%) | 0 (0.0%) |
Employment Characteristics in Highgrove
Employment by Class of Employer in Highgrove
Among the 3,303 employed individuals in Highgrove, private company employees (2,013 | 60.9%), not-for-profit organizations (416 | 12.6%), and local government employees (302 | 9.1%) make up the most common classes of employment.
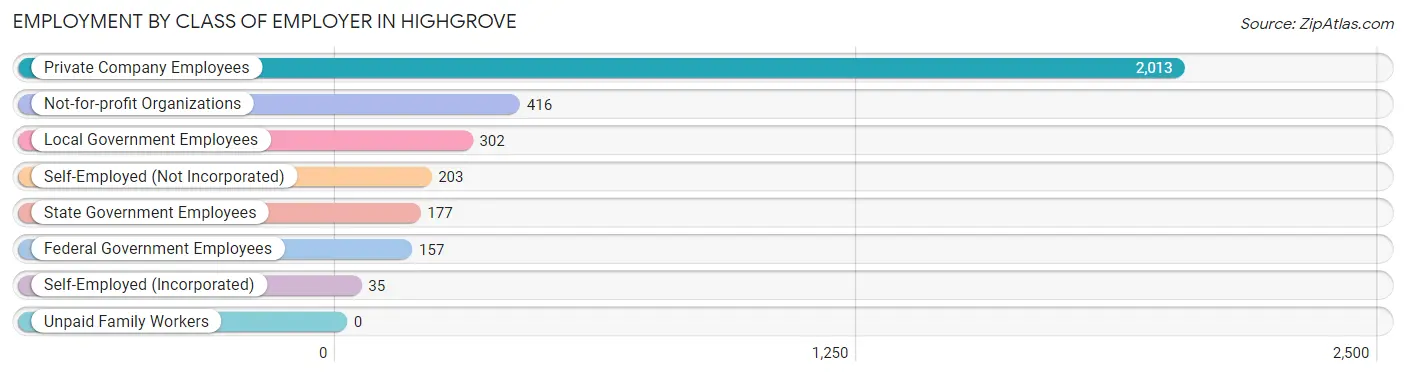
| Employer Class | # Employees | % Employees |
| Private Company Employees | 2,013 | 60.9% |
| Self-Employed (Incorporated) | 35 | 1.1% |
| Self-Employed (Not Incorporated) | 203 | 6.1% |
| Not-for-profit Organizations | 416 | 12.6% |
| Local Government Employees | 302 | 9.1% |
| State Government Employees | 177 | 5.4% |
| Federal Government Employees | 157 | 4.8% |
| Unpaid Family Workers | 0 | 0.0% |
| Total | 3,303 | 100.0% |
Employment Status by Age in Highgrove
According to the labor force statistics for Highgrove, out of the total population over 16 years of age (5,208), 72.9% or 3,797 individuals are in the labor force, with 4.4% or 167 of them unemployed. The age group with the highest labor force participation rate is 30 to 34 years, with 90.1% or 663 individuals in the labor force. Within the labor force, the 60 to 64 years age range has the highest percentage of unemployed individuals, with 11.8% or 34 of them being unemployed.
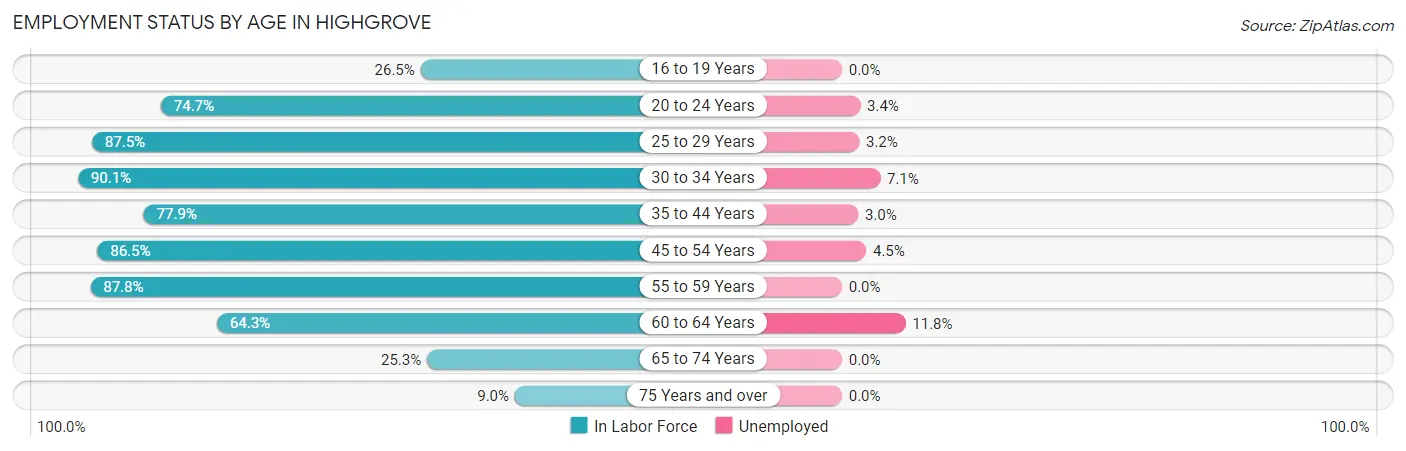
| Age Bracket | In Labor Force | Unemployed |
| 16 to 19 Years | 80 (26.5%) | 0 (0.0%) |
| 20 to 24 Years | 565 (74.7%) | 19 (3.4%) |
| 25 to 29 Years | 488 (87.5%) | 16 (3.2%) |
| 30 to 34 Years | 663 (90.1%) | 47 (7.1%) |
| 35 to 44 Years | 667 (77.9%) | 20 (3.0%) |
| 45 to 54 Years | 665 (86.5%) | 30 (4.5%) |
| 55 to 59 Years | 303 (87.8%) | 0 (0.0%) |
| 60 to 64 Years | 287 (64.3%) | 34 (11.8%) |
| 65 to 74 Years | 61 (25.3%) | 0 (0.0%) |
| 75 Years and over | 18 (9.0%) | 0 (0.0%) |
| Total | 3,797 (72.9%) | 167 (4.4%) |
Employment Status by Educational Attainment in Highgrove
According to labor force statistics for Highgrove, 82.8% of individuals (3,072) out of the total population between 25 and 64 years of age (3,710) are in the labor force, with 4.8% or 147 of them being unemployed. The group with the highest labor force participation rate are those with the educational attainment of bachelor's degree or higher, with 93.3% or 1,075 individuals in the labor force. Within the labor force, individuals with less than high school education have the highest percentage of unemployment, with 10.9% or 36 of them being unemployed.
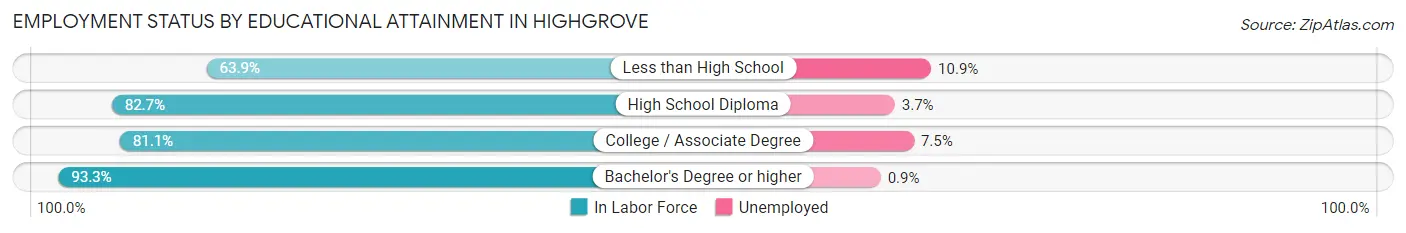
| Educational Attainment | In Labor Force | Unemployed |
| Less than High School | 331 (63.9%) | 56 (10.9%) |
| High School Diploma | 654 (82.7%) | 29 (3.7%) |
| College / Associate Degree | 1,013 (81.1%) | 94 (7.5%) |
| Bachelor's Degree or higher | 1,075 (93.3%) | 10 (0.9%) |
| Total | 3,072 (82.8%) | 178 (4.8%) |
Employment Occupations by Sex in Highgrove
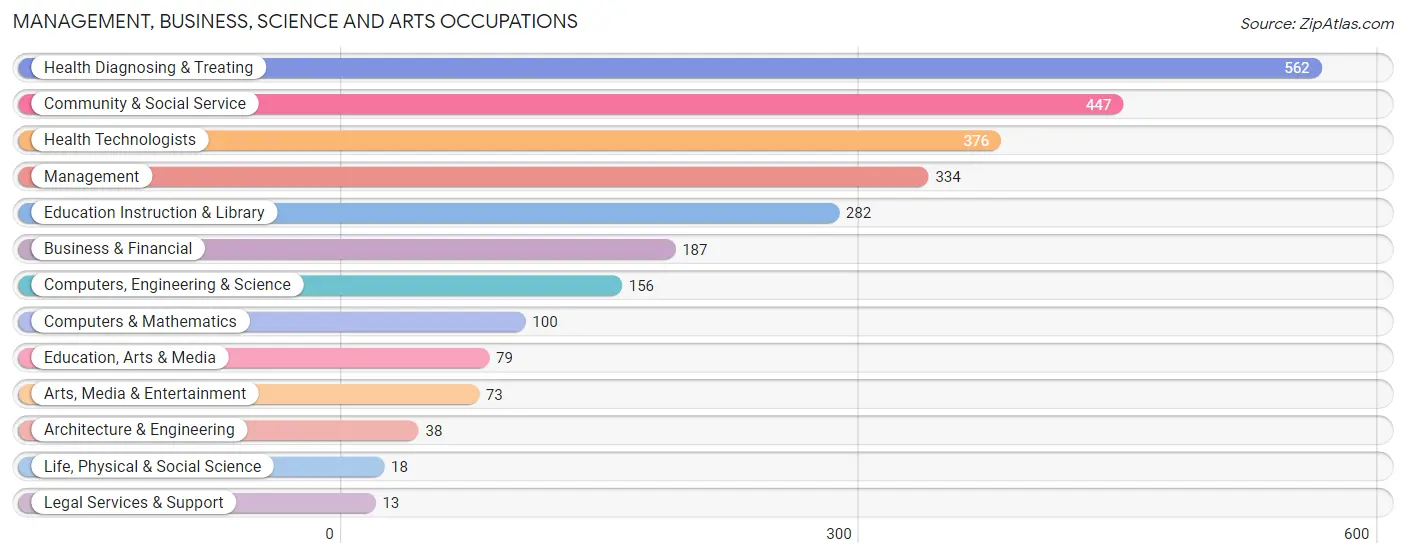
Management, Business, Science and Arts Occupations
The most common Management, Business, Science and Arts occupations in Highgrove are Health Diagnosing & Treating (562 | 15.6%), Community & Social Service (447 | 12.4%), Health Technologists (376 | 10.4%), Management (334 | 9.3%), and Education Instruction & Library (282 | 7.8%).
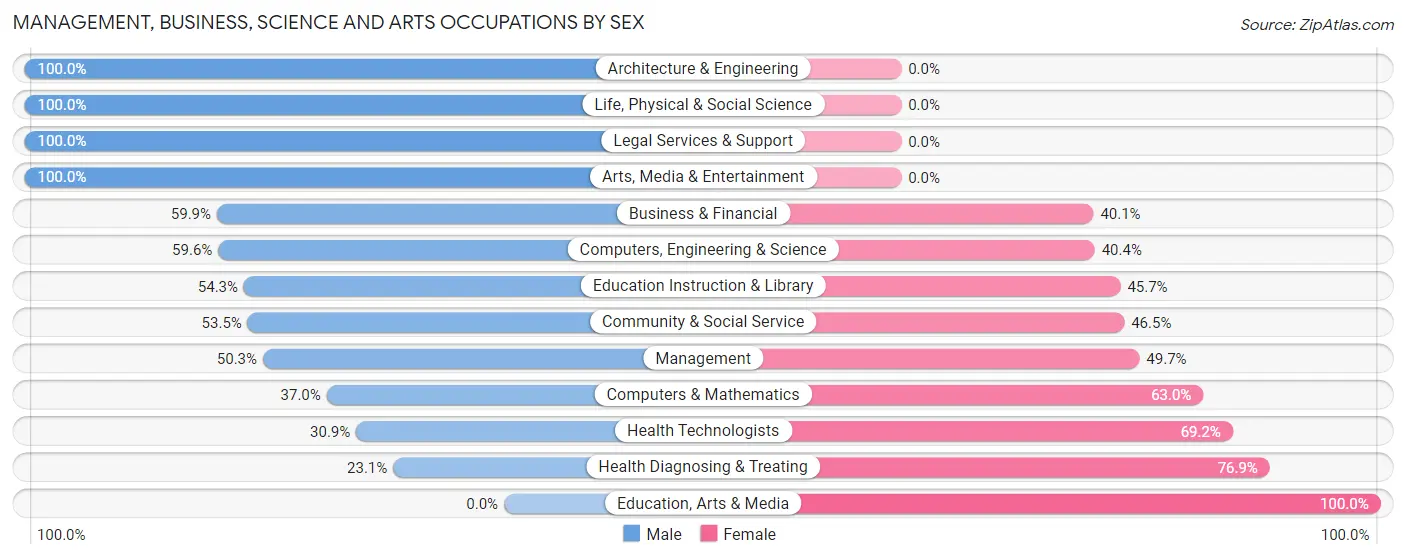
Management, Business, Science and Arts Occupations by Sex
Within the Management, Business, Science and Arts occupations in Highgrove, the most male-oriented occupations are Architecture & Engineering (100.0%), Life, Physical & Social Science (100.0%), and Legal Services & Support (100.0%), while the most female-oriented occupations are Education, Arts & Media (100.0%), Health Diagnosing & Treating (76.9%), and Health Technologists (69.2%).
| Occupation | Male | Female |
| Management | 168 (50.3%) | 166 (49.7%) |
| Business & Financial | 112 (59.9%) | 75 (40.1%) |
| Computers, Engineering & Science | 93 (59.6%) | 63 (40.4%) |
| Computers & Mathematics | 37 (37.0%) | 63 (63.0%) |
| Architecture & Engineering | 38 (100.0%) | 0 (0.0%) |
| Life, Physical & Social Science | 18 (100.0%) | 0 (0.0%) |
| Community & Social Service | 239 (53.5%) | 208 (46.5%) |
| Education, Arts & Media | 0 (0.0%) | 79 (100.0%) |
| Legal Services & Support | 13 (100.0%) | 0 (0.0%) |
| Education Instruction & Library | 153 (54.3%) | 129 (45.7%) |
| Arts, Media & Entertainment | 73 (100.0%) | 0 (0.0%) |
| Health Diagnosing & Treating | 130 (23.1%) | 432 (76.9%) |
| Health Technologists | 116 (30.8%) | 260 (69.2%) |
| Total (Category) | 742 (44.0%) | 944 (56.0%) |
| Total (Overall) | 1,861 (51.6%) | 1,742 (48.3%) |
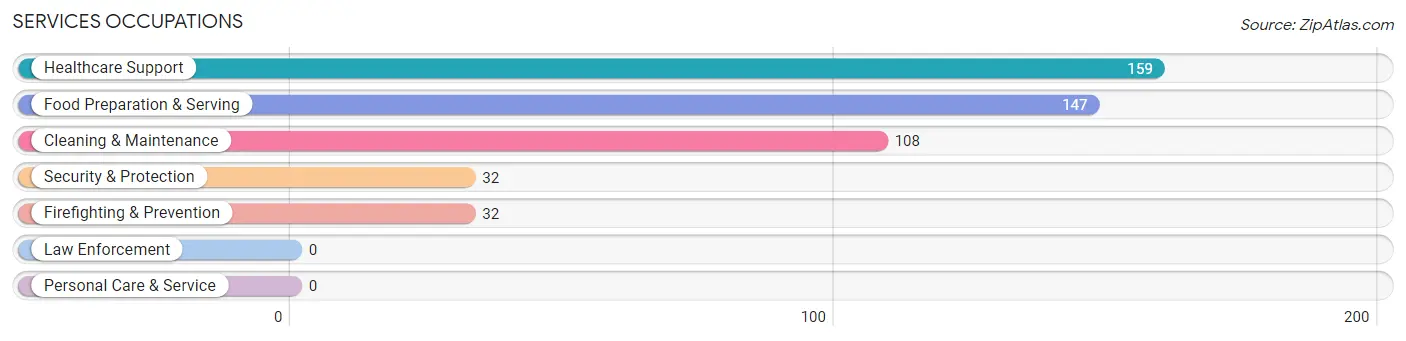
Services Occupations
The most common Services occupations in Highgrove are Healthcare Support (159 | 4.4%), Food Preparation & Serving (147 | 4.1%), Cleaning & Maintenance (108 | 3.0%), Security & Protection (32 | 0.9%), and Firefighting & Prevention (32 | 0.9%).
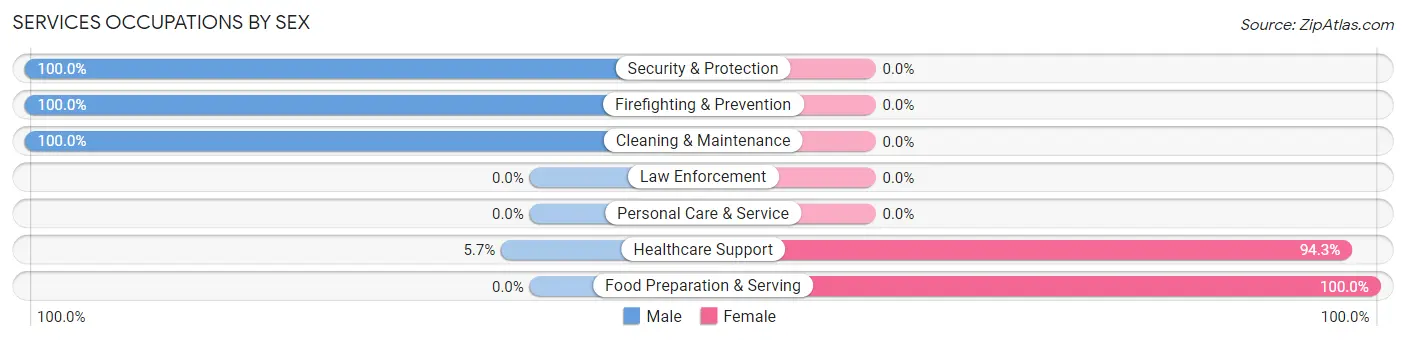
Services Occupations by Sex
Within the Services occupations in Highgrove, the most male-oriented occupations are Security & Protection (100.0%), Firefighting & Prevention (100.0%), and Cleaning & Maintenance (100.0%), while the most female-oriented occupations are Food Preparation & Serving (100.0%), and Healthcare Support (94.3%).
| Occupation | Male | Female |
| Healthcare Support | 9 (5.7%) | 150 (94.3%) |
| Security & Protection | 32 (100.0%) | 0 (0.0%) |
| Firefighting & Prevention | 32 (100.0%) | 0 (0.0%) |
| Law Enforcement | 0 (0.0%) | 0 (0.0%) |
| Food Preparation & Serving | 0 (0.0%) | 147 (100.0%) |
| Cleaning & Maintenance | 108 (100.0%) | 0 (0.0%) |
| Personal Care & Service | 0 (0.0%) | 0 (0.0%) |
| Total (Category) | 149 (33.4%) | 297 (66.6%) |
| Total (Overall) | 1,861 (51.6%) | 1,742 (48.3%) |
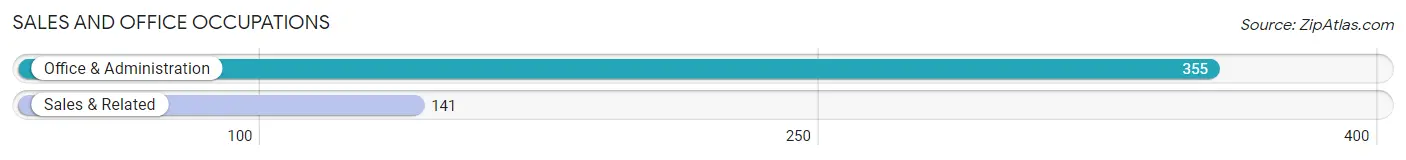
Sales and Office Occupations
The most common Sales and Office occupations in Highgrove are Office & Administration (355 | 9.9%), and Sales & Related (141 | 3.9%).
Sales and Office Occupations by Sex
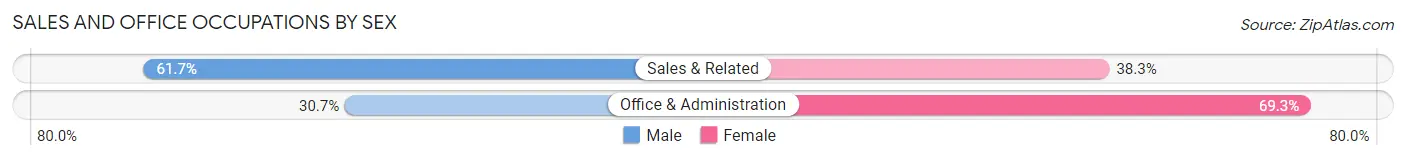
| Occupation | Male | Female |
| Sales & Related | 87 (61.7%) | 54 (38.3%) |
| Office & Administration | 109 (30.7%) | 246 (69.3%) |
| Total (Category) | 196 (39.5%) | 300 (60.5%) |
| Total (Overall) | 1,861 (51.6%) | 1,742 (48.3%) |
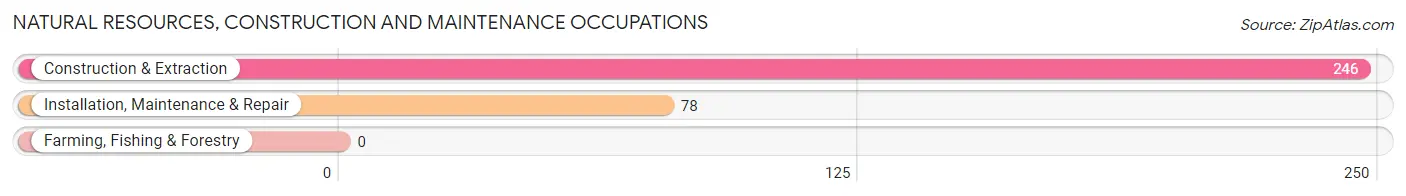
Natural Resources, Construction and Maintenance Occupations
The most common Natural Resources, Construction and Maintenance occupations in Highgrove are Construction & Extraction (246 | 6.8%), and Installation, Maintenance & Repair (78 | 2.2%).
Natural Resources, Construction and Maintenance Occupations by Sex
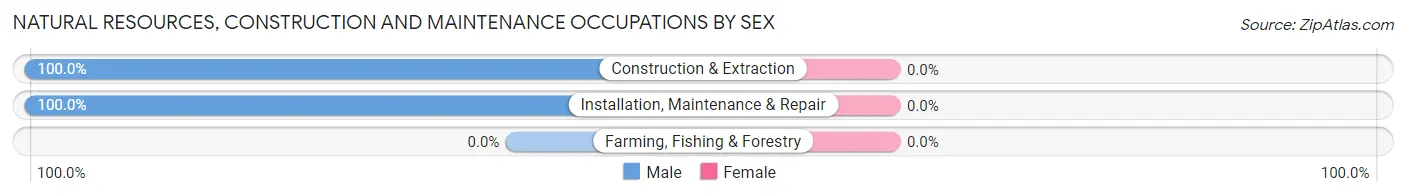
| Occupation | Male | Female |
| Farming, Fishing & Forestry | 0 (0.0%) | 0 (0.0%) |
| Construction & Extraction | 246 (100.0%) | 0 (0.0%) |
| Installation, Maintenance & Repair | 78 (100.0%) | 0 (0.0%) |
| Total (Category) | 324 (100.0%) | 0 (0.0%) |
| Total (Overall) | 1,861 (51.6%) | 1,742 (48.3%) |
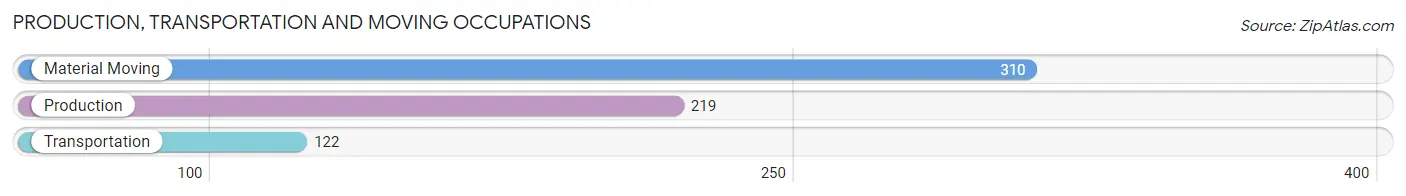
Production, Transportation and Moving Occupations
The most common Production, Transportation and Moving occupations in Highgrove are Material Moving (310 | 8.6%), Production (219 | 6.1%), and Transportation (122 | 3.4%).
Production, Transportation and Moving Occupations by Sex
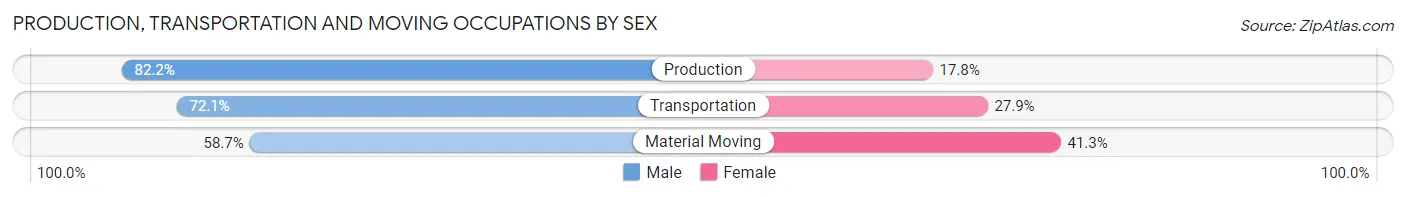
| Occupation | Male | Female |
| Production | 180 (82.2%) | 39 (17.8%) |
| Transportation | 88 (72.1%) | 34 (27.9%) |
| Material Moving | 182 (58.7%) | 128 (41.3%) |
| Total (Category) | 450 (69.1%) | 201 (30.9%) |
| Total (Overall) | 1,861 (51.6%) | 1,742 (48.3%) |
Employment Industries by Sex in Highgrove
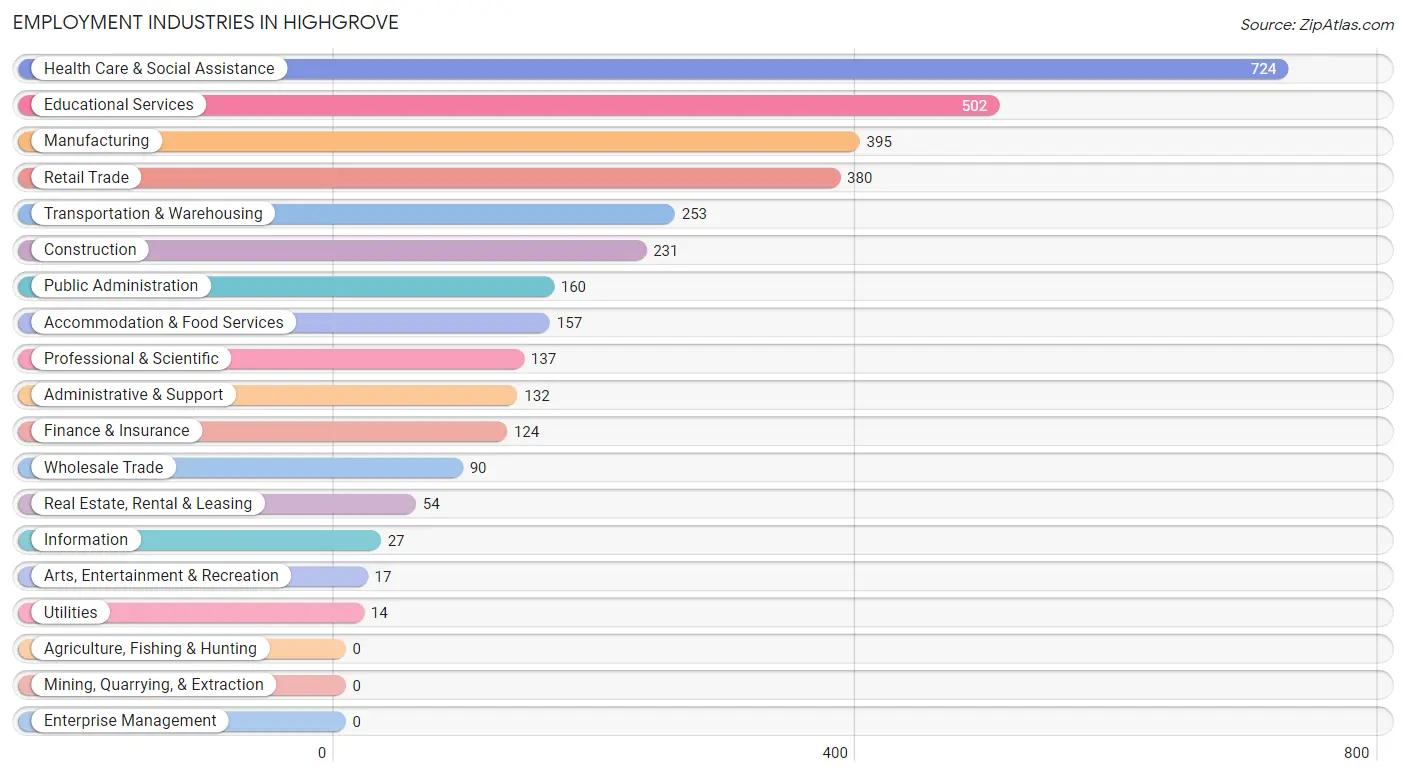
Employment Industries in Highgrove
The major employment industries in Highgrove include Health Care & Social Assistance (724 | 20.1%), Educational Services (502 | 13.9%), Manufacturing (395 | 11.0%), Retail Trade (380 | 10.5%), and Transportation & Warehousing (253 | 7.0%).
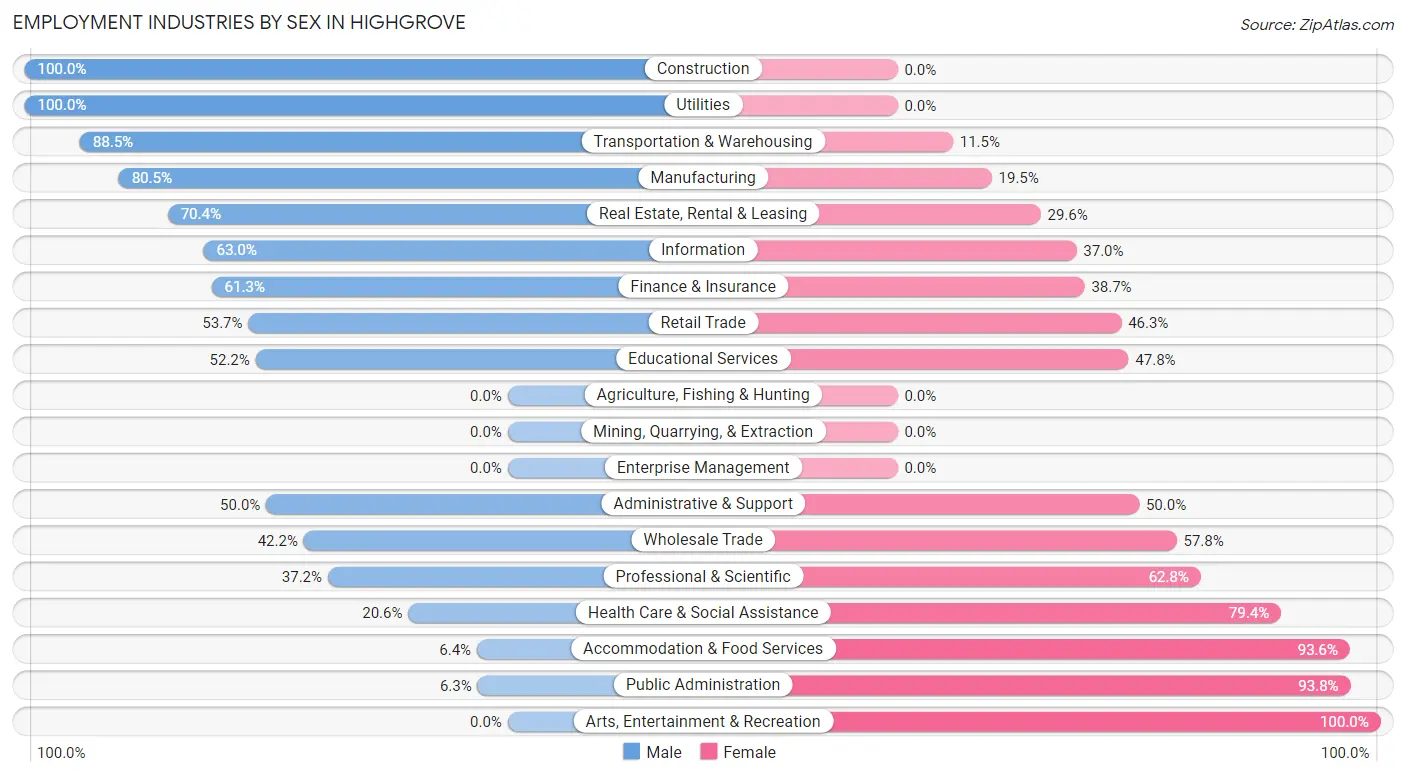
Employment Industries by Sex in Highgrove
The Highgrove industries that see more men than women are Construction (100.0%), Utilities (100.0%), and Transportation & Warehousing (88.5%), whereas the industries that tend to have a higher number of women are Arts, Entertainment & Recreation (100.0%), Public Administration (93.8%), and Accommodation & Food Services (93.6%).
| Industry | Male | Female |
| Agriculture, Fishing & Hunting | 0 (0.0%) | 0 (0.0%) |
| Mining, Quarrying, & Extraction | 0 (0.0%) | 0 (0.0%) |
| Construction | 231 (100.0%) | 0 (0.0%) |
| Manufacturing | 318 (80.5%) | 77 (19.5%) |
| Wholesale Trade | 38 (42.2%) | 52 (57.8%) |
| Retail Trade | 204 (53.7%) | 176 (46.3%) |
| Transportation & Warehousing | 224 (88.5%) | 29 (11.5%) |
| Utilities | 14 (100.0%) | 0 (0.0%) |
| Information | 17 (63.0%) | 10 (37.0%) |
| Finance & Insurance | 76 (61.3%) | 48 (38.7%) |
| Real Estate, Rental & Leasing | 38 (70.4%) | 16 (29.6%) |
| Professional & Scientific | 51 (37.2%) | 86 (62.8%) |
| Enterprise Management | 0 (0.0%) | 0 (0.0%) |
| Administrative & Support | 66 (50.0%) | 66 (50.0%) |
| Educational Services | 262 (52.2%) | 240 (47.8%) |
| Health Care & Social Assistance | 149 (20.6%) | 575 (79.4%) |
| Arts, Entertainment & Recreation | 0 (0.0%) | 17 (100.0%) |
| Accommodation & Food Services | 10 (6.4%) | 147 (93.6%) |
| Public Administration | 10 (6.2%) | 150 (93.8%) |
| Total | 1,861 (51.6%) | 1,742 (48.3%) |
Education in Highgrove
School Enrollment in Highgrove
The most common levels of schooling among the 2,000 students in Highgrove are elementary school (459 | 23.0%), college / undergraduate (437 | 21.8%), and middle school (386 | 19.3%).
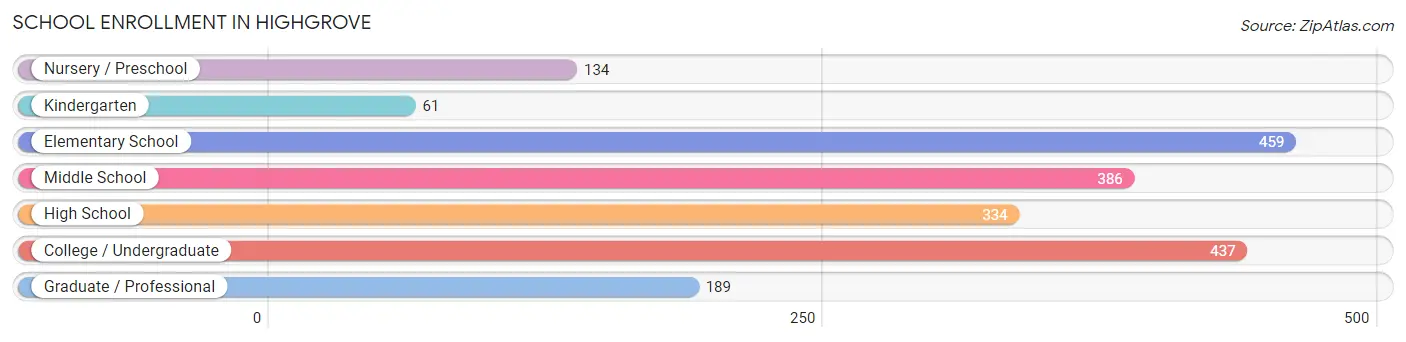
| School Level | # Students | % Students |
| Nursery / Preschool | 134 | 6.7% |
| Kindergarten | 61 | 3.0% |
| Elementary School | 459 | 23.0% |
| Middle School | 386 | 19.3% |
| High School | 334 | 16.7% |
| College / Undergraduate | 437 | 21.8% |
| Graduate / Professional | 189 | 9.5% |
| Total | 2,000 | 100.0% |
School Enrollment by Age by Funding Source in Highgrove
Out of a total of 2,000 students who are enrolled in schools in Highgrove, 280 (14.0%) attend a private institution, while the remaining 1,720 (86.0%) are enrolled in public schools. The age group of 35 years and over has the highest likelihood of being enrolled in private schools, with 51 (51.5% in the age bracket) enrolled. Conversely, the age group of 18 to 19 year olds has the lowest likelihood of being enrolled in a private school, with 70 (100.0% in the age bracket) attending a public institution.
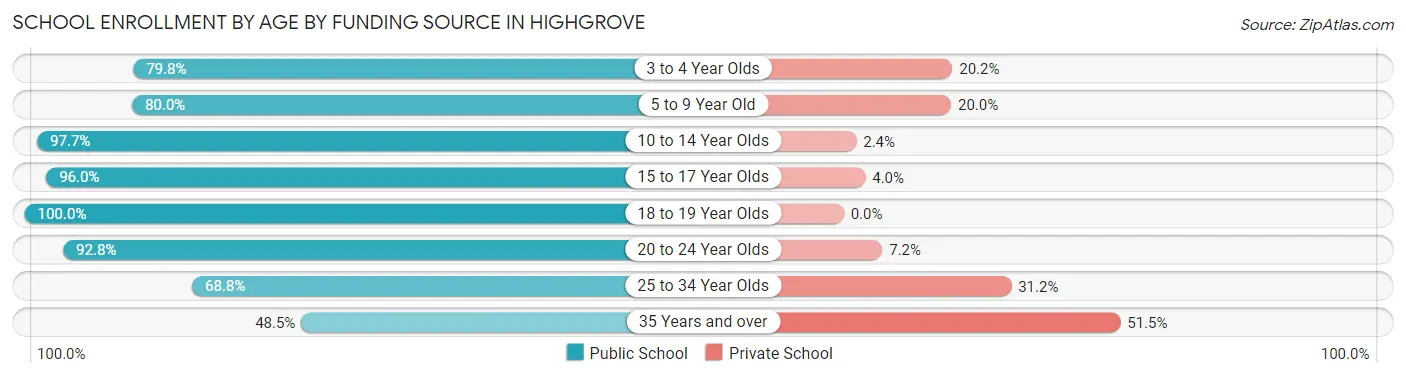
| Age Bracket | Public School | Private School |
| 3 to 4 Year Olds | 67 (79.8%) | 17 (20.2%) |
| 5 to 9 Year Old | 456 (80.0%) | 114 (20.0%) |
| 10 to 14 Year Olds | 415 (97.7%) | 10 (2.4%) |
| 15 to 17 Year Olds | 262 (96.0%) | 11 (4.0%) |
| 18 to 19 Year Olds | 70 (100.0%) | 0 (0.0%) |
| 20 to 24 Year Olds | 284 (92.8%) | 22 (7.2%) |
| 25 to 34 Year Olds | 119 (68.8%) | 54 (31.2%) |
| 35 Years and over | 48 (48.5%) | 51 (51.5%) |
| Total | 1,722 (86.1%) | 280 (14.0%) |
Educational Attainment by Field of Study in Highgrove
Business (301 | 21.6%), science & technology (248 | 17.8%), bio, nature & agricultural (180 | 12.9%), social sciences (133 | 9.5%), and arts & humanities (116 | 8.3%) are the most common fields of study among 1,396 individuals in Highgrove who have obtained a bachelor's degree or higher.
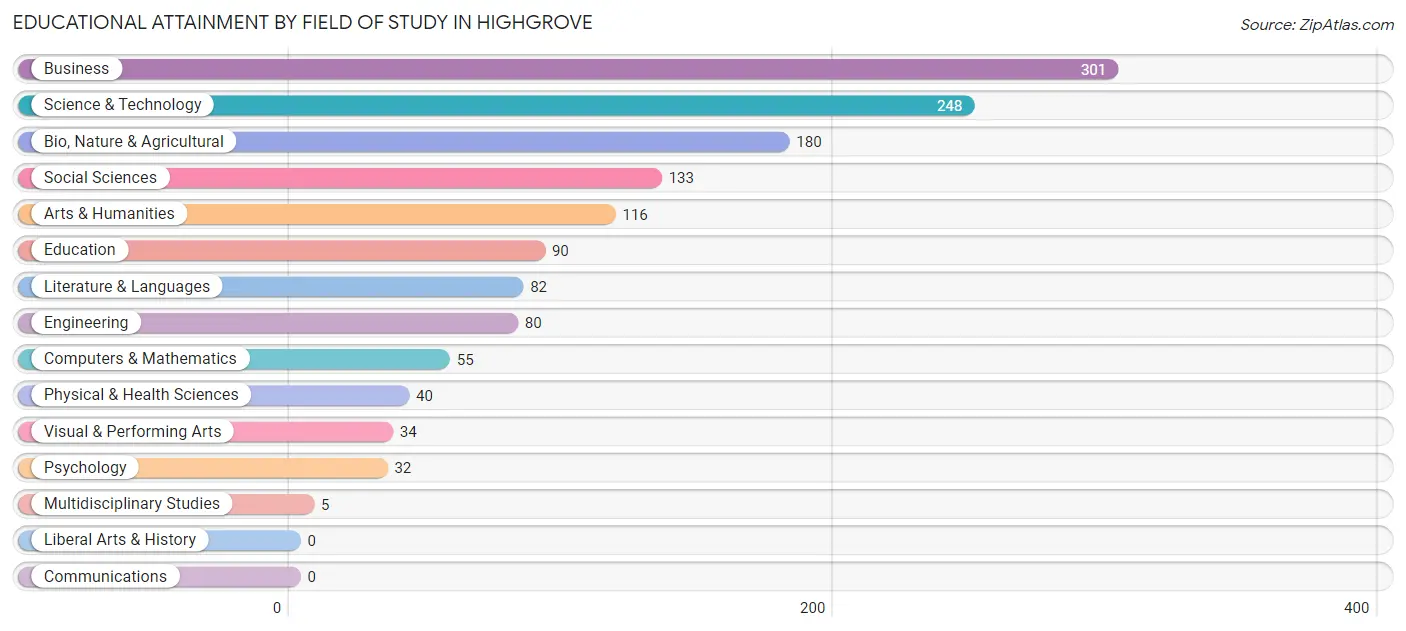
| Field of Study | # Graduates | % Graduates |
| Computers & Mathematics | 55 | 3.9% |
| Bio, Nature & Agricultural | 180 | 12.9% |
| Physical & Health Sciences | 40 | 2.9% |
| Psychology | 32 | 2.3% |
| Social Sciences | 133 | 9.5% |
| Engineering | 80 | 5.7% |
| Multidisciplinary Studies | 5 | 0.4% |
| Science & Technology | 248 | 17.8% |
| Business | 301 | 21.6% |
| Education | 90 | 6.5% |
| Literature & Languages | 82 | 5.9% |
| Liberal Arts & History | 0 | 0.0% |
| Visual & Performing Arts | 34 | 2.4% |
| Communications | 0 | 0.0% |
| Arts & Humanities | 116 | 8.3% |
| Total | 1,396 | 100.0% |
Transportation & Commute in Highgrove
Vehicle Availability by Sex in Highgrove
The most prevalent vehicle ownership categories in Highgrove are males with 3 vehicles (688, accounting for 40.0%) and females with 3 vehicles (490, making up 43.6%).
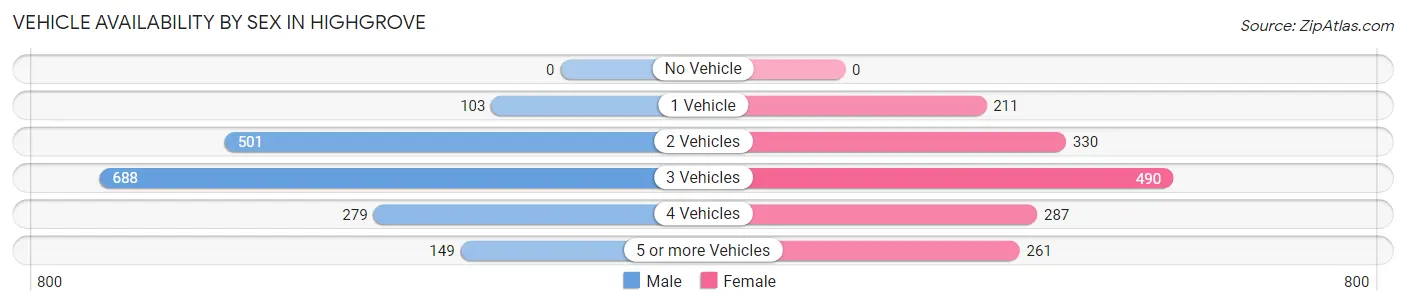
| Vehicles Available | Male | Female |
| No Vehicle | 0 (0.0%) | 0 (0.0%) |
| 1 Vehicle | 103 (6.0%) | 211 (13.4%) |
| 2 Vehicles | 501 (29.1%) | 330 (20.9%) |
| 3 Vehicles | 688 (40.0%) | 490 (31.0%) |
| 4 Vehicles | 279 (16.2%) | 287 (18.2%) |
| 5 or more Vehicles | 149 (8.7%) | 261 (16.5%) |
| Total | 1,720 (100.0%) | 1,579 (100.0%) |
Commute Time in Highgrove
The most frequently occuring commute durations in Highgrove are 20 to 24 minutes (684 commuters, 21.9%), 30 to 34 minutes (538 commuters, 17.2%), and 15 to 19 minutes (401 commuters, 12.8%).
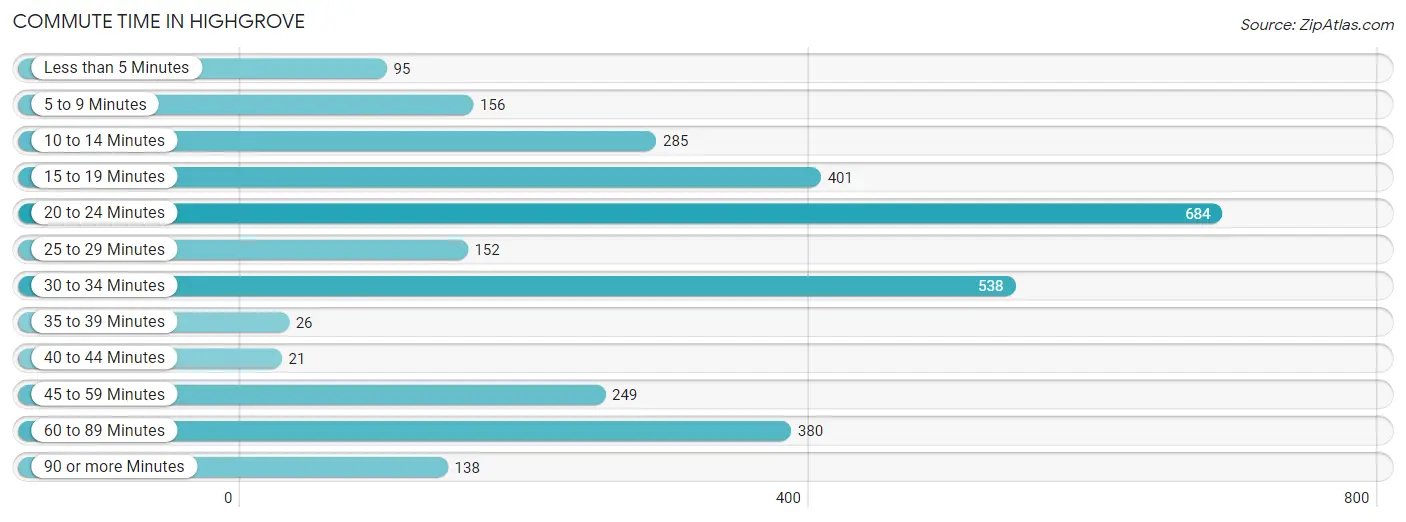
| Commute Time | # Commuters | % Commuters |
| Less than 5 Minutes | 95 | 3.0% |
| 5 to 9 Minutes | 156 | 5.0% |
| 10 to 14 Minutes | 285 | 9.1% |
| 15 to 19 Minutes | 401 | 12.8% |
| 20 to 24 Minutes | 684 | 21.9% |
| 25 to 29 Minutes | 152 | 4.9% |
| 30 to 34 Minutes | 538 | 17.2% |
| 35 to 39 Minutes | 26 | 0.8% |
| 40 to 44 Minutes | 21 | 0.7% |
| 45 to 59 Minutes | 249 | 8.0% |
| 60 to 89 Minutes | 380 | 12.2% |
| 90 or more Minutes | 138 | 4.4% |
Commute Time by Sex in Highgrove
The most common commute times in Highgrove are 30 to 34 minutes (397 commuters, 24.5%) for males and 20 to 24 minutes (489 commuters, 32.6%) for females.
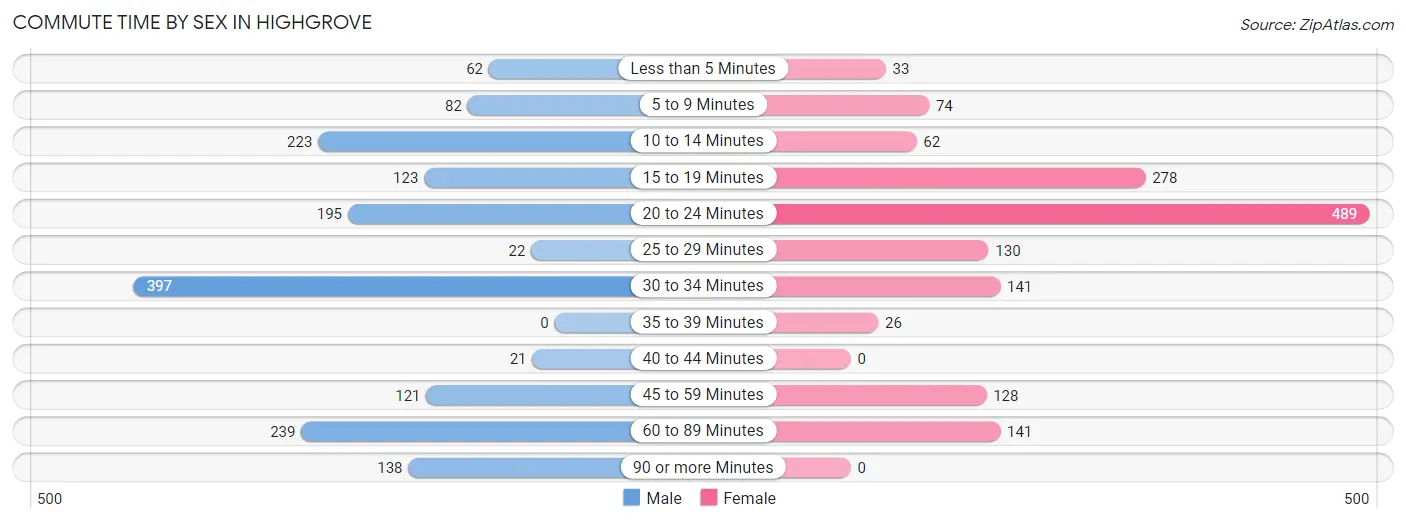
| Commute Time | Male | Female |
| Less than 5 Minutes | 62 (3.8%) | 33 (2.2%) |
| 5 to 9 Minutes | 82 (5.1%) | 74 (4.9%) |
| 10 to 14 Minutes | 223 (13.7%) | 62 (4.1%) |
| 15 to 19 Minutes | 123 (7.6%) | 278 (18.5%) |
| 20 to 24 Minutes | 195 (12.0%) | 489 (32.6%) |
| 25 to 29 Minutes | 22 (1.4%) | 130 (8.7%) |
| 30 to 34 Minutes | 397 (24.5%) | 141 (9.4%) |
| 35 to 39 Minutes | 0 (0.0%) | 26 (1.7%) |
| 40 to 44 Minutes | 21 (1.3%) | 0 (0.0%) |
| 45 to 59 Minutes | 121 (7.5%) | 128 (8.5%) |
| 60 to 89 Minutes | 239 (14.7%) | 141 (9.4%) |
| 90 or more Minutes | 138 (8.5%) | 0 (0.0%) |
Time of Departure to Work by Sex in Highgrove
The most frequent times of departure to work in Highgrove are 5:00 AM to 5:29 AM (337, 20.8%) for males and 12:00 PM to 3:59 PM (186, 12.4%) for females.
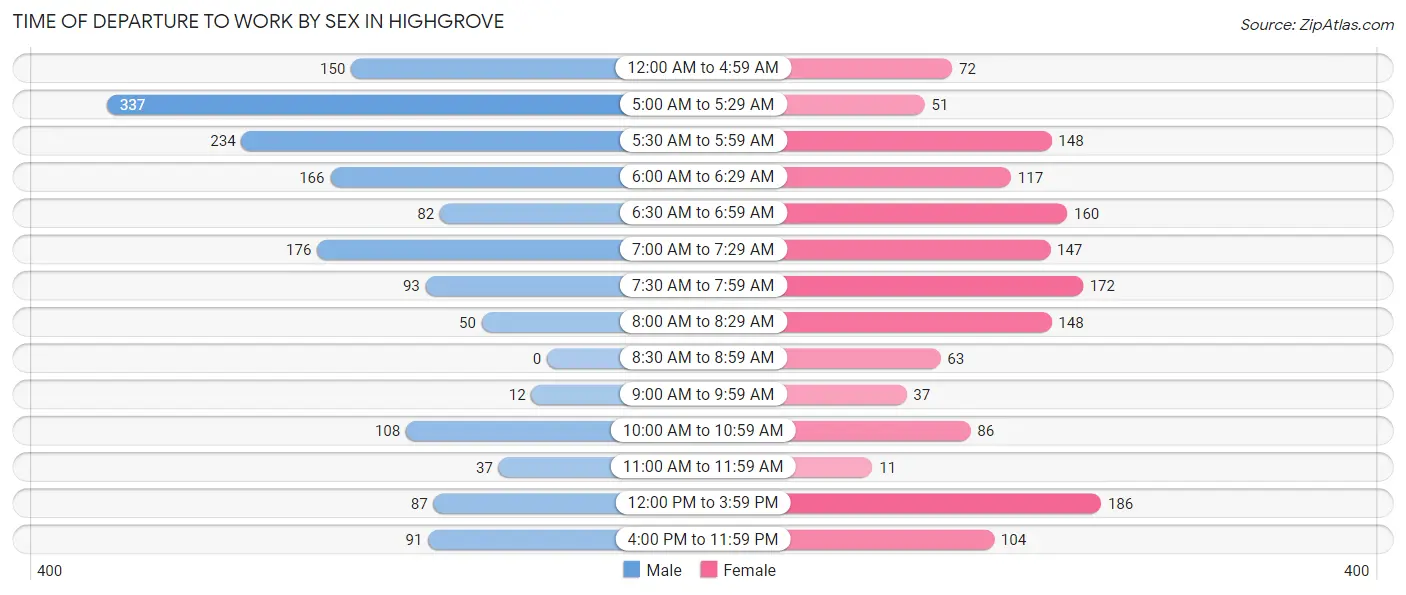
| Time of Departure | Male | Female |
| 12:00 AM to 4:59 AM | 150 (9.2%) | 72 (4.8%) |
| 5:00 AM to 5:29 AM | 337 (20.8%) | 51 (3.4%) |
| 5:30 AM to 5:59 AM | 234 (14.4%) | 148 (9.9%) |
| 6:00 AM to 6:29 AM | 166 (10.2%) | 117 (7.8%) |
| 6:30 AM to 6:59 AM | 82 (5.1%) | 160 (10.6%) |
| 7:00 AM to 7:29 AM | 176 (10.8%) | 147 (9.8%) |
| 7:30 AM to 7:59 AM | 93 (5.7%) | 172 (11.5%) |
| 8:00 AM to 8:29 AM | 50 (3.1%) | 148 (9.9%) |
| 8:30 AM to 8:59 AM | 0 (0.0%) | 63 (4.2%) |
| 9:00 AM to 9:59 AM | 12 (0.7%) | 37 (2.5%) |
| 10:00 AM to 10:59 AM | 108 (6.7%) | 86 (5.7%) |
| 11:00 AM to 11:59 AM | 37 (2.3%) | 11 (0.7%) |
| 12:00 PM to 3:59 PM | 87 (5.4%) | 186 (12.4%) |
| 4:00 PM to 11:59 PM | 91 (5.6%) | 104 (6.9%) |
| Total | 1,623 (100.0%) | 1,502 (100.0%) |
Housing Occupancy in Highgrove
Occupancy by Ownership in Highgrove
Of the total 2,015 dwellings in Highgrove, owner-occupied units account for 1,350 (67.0%), while renter-occupied units make up 665 (33.0%).
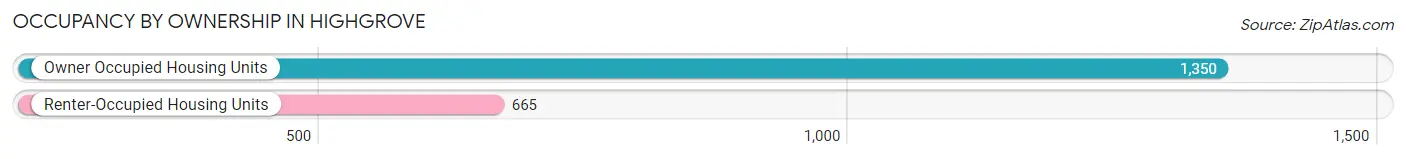
| Occupancy | # Housing Units | % Housing Units |
| Owner Occupied Housing Units | 1,350 | 67.0% |
| Renter-Occupied Housing Units | 665 | 33.0% |
| Total Occupied Housing Units | 2,015 | 100.0% |
Occupancy by Household Size in Highgrove
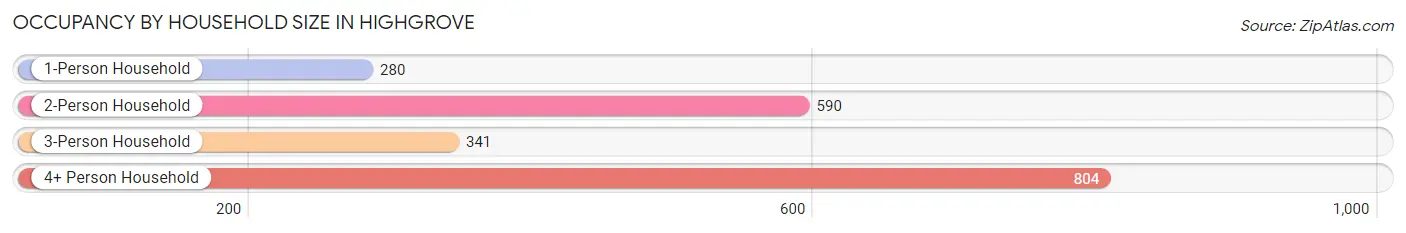
| Household Size | # Housing Units | % Housing Units |
| 1-Person Household | 280 | 13.9% |
| 2-Person Household | 590 | 29.3% |
| 3-Person Household | 341 | 16.9% |
| 4+ Person Household | 804 | 39.9% |
| Total Housing Units | 2,015 | 100.0% |
Occupancy by Ownership by Household Size in Highgrove
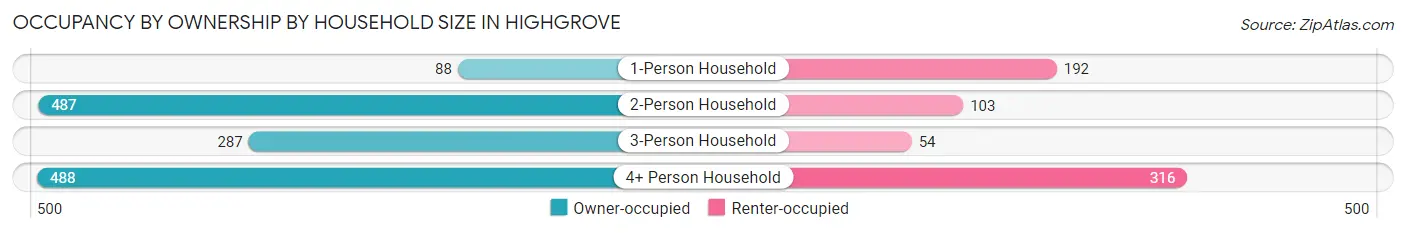
| Household Size | Owner-occupied | Renter-occupied |
| 1-Person Household | 88 (31.4%) | 192 (68.6%) |
| 2-Person Household | 487 (82.5%) | 103 (17.5%) |
| 3-Person Household | 287 (84.2%) | 54 (15.8%) |
| 4+ Person Household | 488 (60.7%) | 316 (39.3%) |
| Total Housing Units | 1,350 (67.0%) | 665 (33.0%) |
Occupancy by Educational Attainment in Highgrove
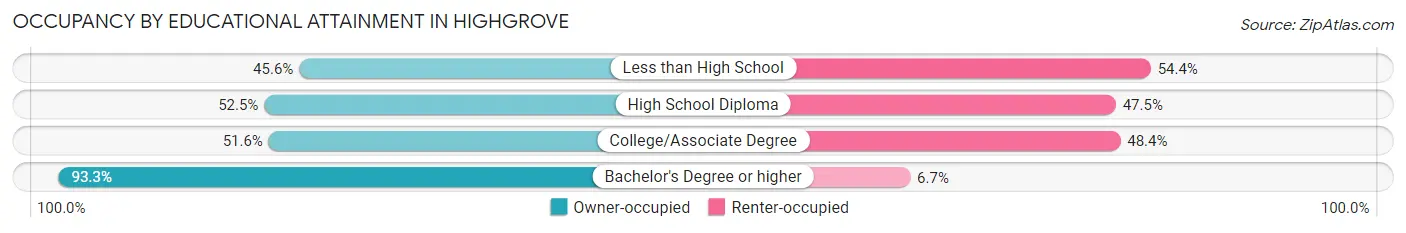
| Household Size | Owner-occupied | Renter-occupied |
| Less than High School | 108 (45.6%) | 129 (54.4%) |
| High School Diploma | 168 (52.5%) | 152 (47.5%) |
| College/Associate Degree | 354 (51.6%) | 332 (48.4%) |
| Bachelor's Degree or higher | 720 (93.3%) | 52 (6.7%) |
Occupancy by Age of Householder in Highgrove
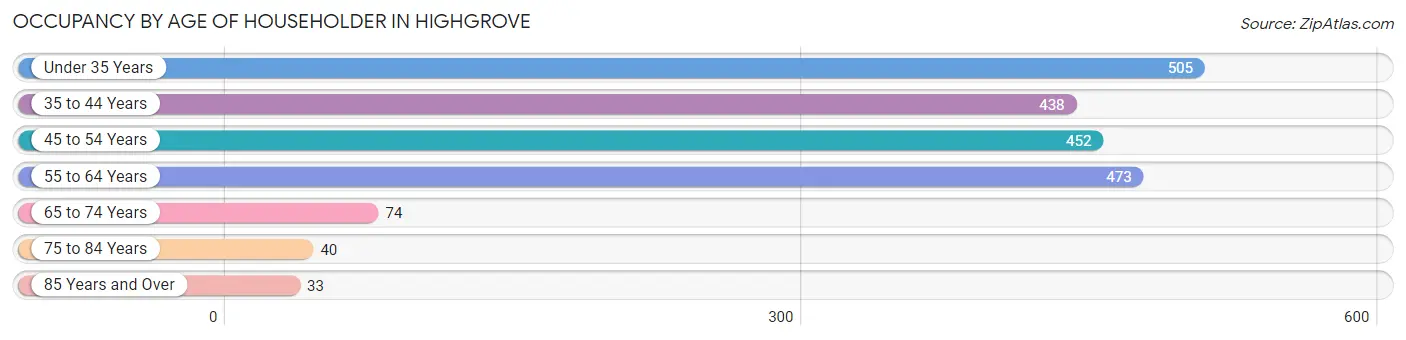
| Age Bracket | # Households | % Households |
| Under 35 Years | 505 | 25.1% |
| 35 to 44 Years | 438 | 21.7% |
| 45 to 54 Years | 452 | 22.4% |
| 55 to 64 Years | 473 | 23.5% |
| 65 to 74 Years | 74 | 3.7% |
| 75 to 84 Years | 40 | 2.0% |
| 85 Years and Over | 33 | 1.6% |
| Total | 2,015 | 100.0% |
Housing Finances in Highgrove
Median Income by Occupancy in Highgrove
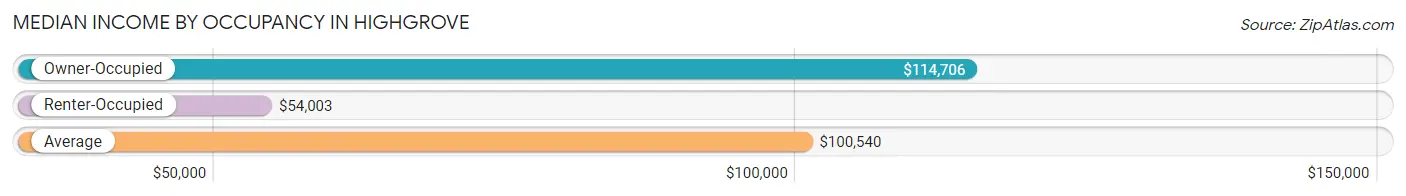
| Occupancy Type | # Households | Median Income |
| Owner-Occupied | 1,350 (67.0%) | $114,706 |
| Renter-Occupied | 665 (33.0%) | $54,003 |
| Average | 2,015 (100.0%) | $100,540 |
Occupancy by Householder Income Bracket in Highgrove
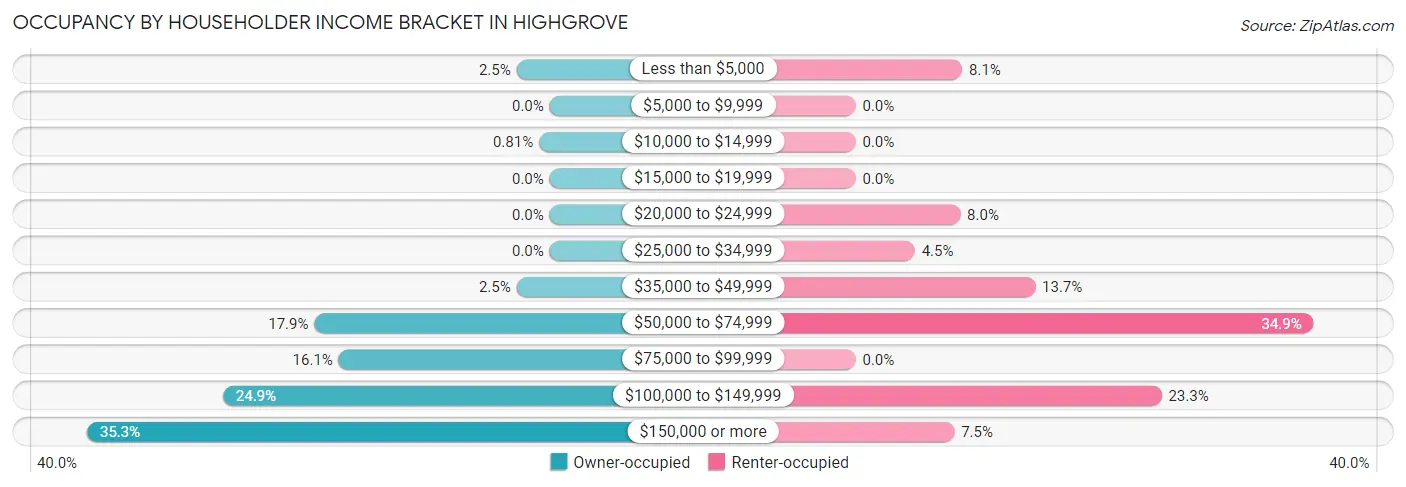
| Income Bracket | Owner-occupied | Renter-occupied |
| Less than $5,000 | 34 (2.5%) | 54 (8.1%) |
| $5,000 to $9,999 | 0 (0.0%) | 0 (0.0%) |
| $10,000 to $14,999 | 11 (0.8%) | 0 (0.0%) |
| $15,000 to $19,999 | 0 (0.0%) | 0 (0.0%) |
| $20,000 to $24,999 | 0 (0.0%) | 53 (8.0%) |
| $25,000 to $34,999 | 0 (0.0%) | 30 (4.5%) |
| $35,000 to $49,999 | 34 (2.5%) | 91 (13.7%) |
| $50,000 to $74,999 | 242 (17.9%) | 232 (34.9%) |
| $75,000 to $99,999 | 217 (16.1%) | 0 (0.0%) |
| $100,000 to $149,999 | 336 (24.9%) | 155 (23.3%) |
| $150,000 or more | 476 (35.3%) | 50 (7.5%) |
| Total | 1,350 (100.0%) | 665 (100.0%) |
Monthly Housing Cost Tiers in Highgrove
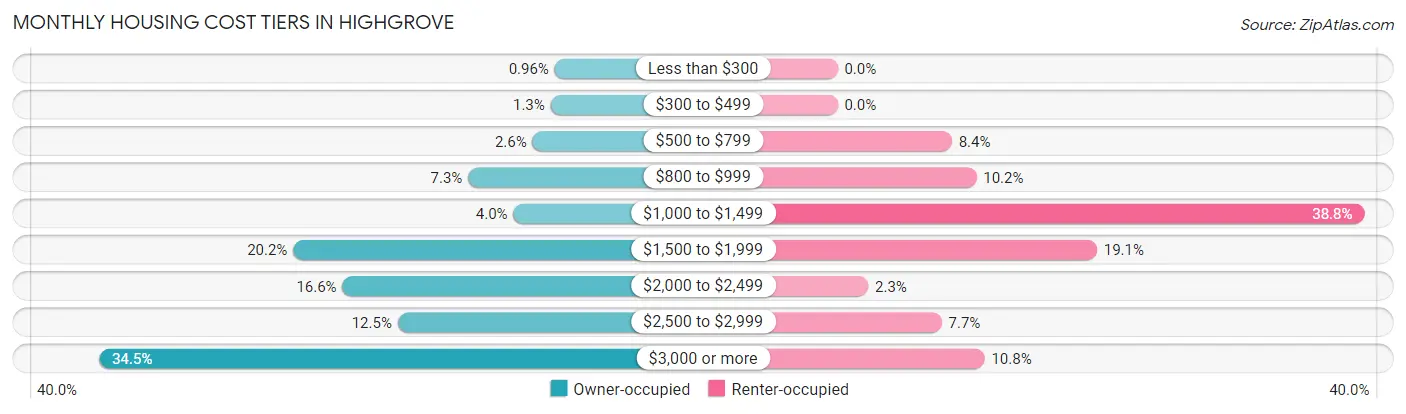
| Monthly Cost | Owner-occupied | Renter-occupied |
| Less than $300 | 13 (1.0%) | 0 (0.0%) |
| $300 to $499 | 17 (1.3%) | 0 (0.0%) |
| $500 to $799 | 35 (2.6%) | 56 (8.4%) |
| $800 to $999 | 99 (7.3%) | 68 (10.2%) |
| $1,000 to $1,499 | 54 (4.0%) | 258 (38.8%) |
| $1,500 to $1,999 | 273 (20.2%) | 127 (19.1%) |
| $2,000 to $2,499 | 224 (16.6%) | 15 (2.3%) |
| $2,500 to $2,999 | 169 (12.5%) | 51 (7.7%) |
| $3,000 or more | 466 (34.5%) | 72 (10.8%) |
| Total | 1,350 (100.0%) | 665 (100.0%) |
Physical Housing Characteristics in Highgrove
Housing Structures in Highgrove
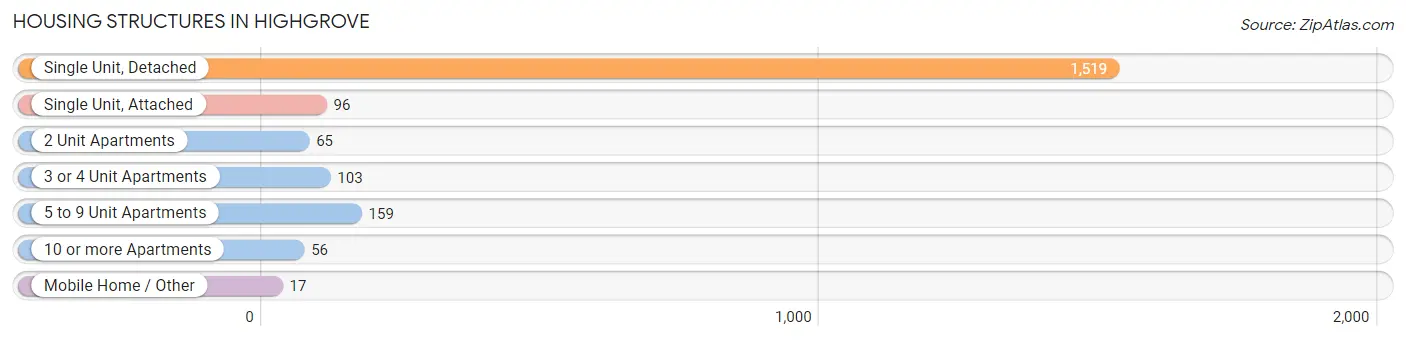
| Structure Type | # Housing Units | % Housing Units |
| Single Unit, Detached | 1,519 | 75.4% |
| Single Unit, Attached | 96 | 4.8% |
| 2 Unit Apartments | 65 | 3.2% |
| 3 or 4 Unit Apartments | 103 | 5.1% |
| 5 to 9 Unit Apartments | 159 | 7.9% |
| 10 or more Apartments | 56 | 2.8% |
| Mobile Home / Other | 17 | 0.8% |
| Total | 2,015 | 100.0% |
Housing Structures by Occupancy in Highgrove
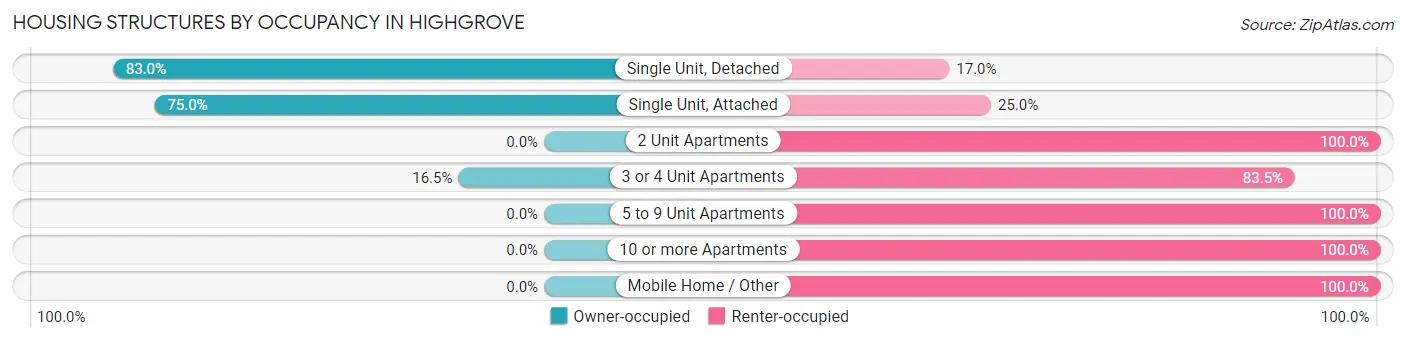
| Structure Type | Owner-occupied | Renter-occupied |
| Single Unit, Detached | 1,261 (83.0%) | 258 (17.0%) |
| Single Unit, Attached | 72 (75.0%) | 24 (25.0%) |
| 2 Unit Apartments | 0 (0.0%) | 65 (100.0%) |
| 3 or 4 Unit Apartments | 17 (16.5%) | 86 (83.5%) |
| 5 to 9 Unit Apartments | 0 (0.0%) | 159 (100.0%) |
| 10 or more Apartments | 0 (0.0%) | 56 (100.0%) |
| Mobile Home / Other | 0 (0.0%) | 17 (100.0%) |
| Total | 1,350 (67.0%) | 665 (33.0%) |
Housing Structures by Number of Rooms in Highgrove
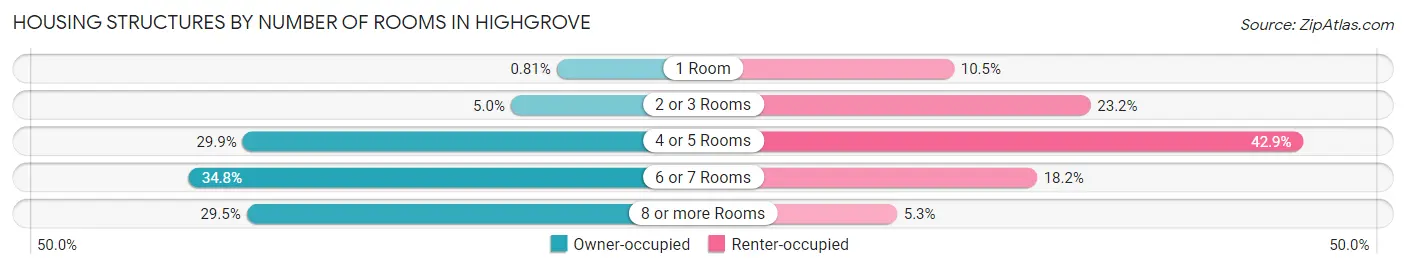
| Number of Rooms | Owner-occupied | Renter-occupied |
| 1 Room | 11 (0.8%) | 70 (10.5%) |
| 2 or 3 Rooms | 68 (5.0%) | 154 (23.2%) |
| 4 or 5 Rooms | 403 (29.8%) | 285 (42.9%) |
| 6 or 7 Rooms | 470 (34.8%) | 121 (18.2%) |
| 8 or more Rooms | 398 (29.5%) | 35 (5.3%) |
| Total | 1,350 (100.0%) | 665 (100.0%) |
Housing Structure by Heating Type in Highgrove
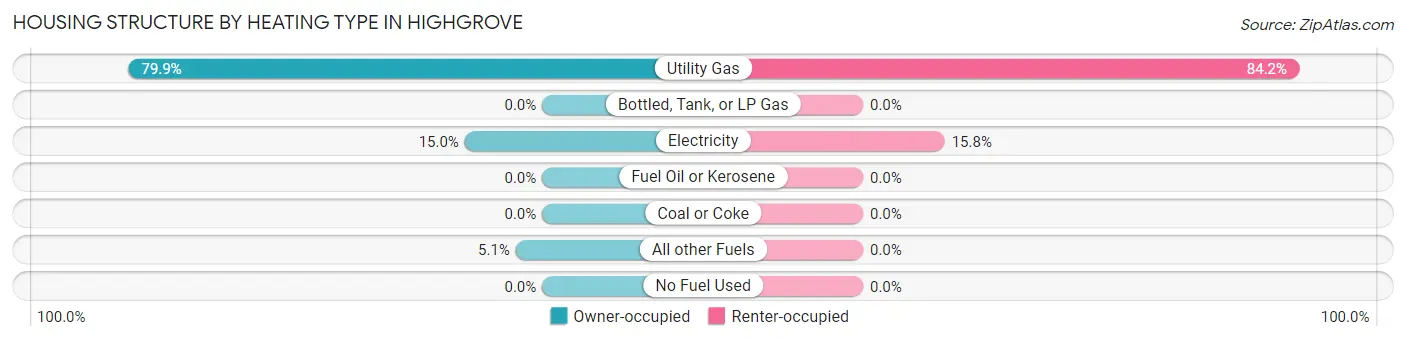
| Heating Type | Owner-occupied | Renter-occupied |
| Utility Gas | 1,079 (79.9%) | 560 (84.2%) |
| Bottled, Tank, or LP Gas | 0 (0.0%) | 0 (0.0%) |
| Electricity | 202 (15.0%) | 105 (15.8%) |
| Fuel Oil or Kerosene | 0 (0.0%) | 0 (0.0%) |
| Coal or Coke | 0 (0.0%) | 0 (0.0%) |
| All other Fuels | 69 (5.1%) | 0 (0.0%) |
| No Fuel Used | 0 (0.0%) | 0 (0.0%) |
| Total | 1,350 (100.0%) | 665 (100.0%) |
Household Vehicle Usage in Highgrove
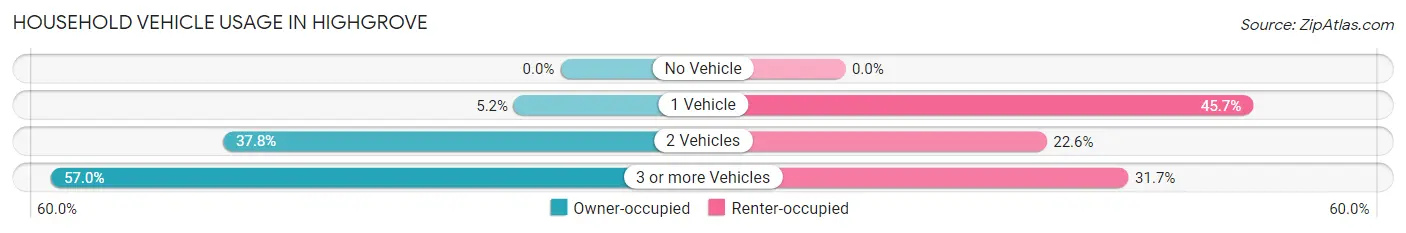
| Vehicles per Household | Owner-occupied | Renter-occupied |
| No Vehicle | 0 (0.0%) | 0 (0.0%) |
| 1 Vehicle | 70 (5.2%) | 304 (45.7%) |
| 2 Vehicles | 510 (37.8%) | 150 (22.6%) |
| 3 or more Vehicles | 770 (57.0%) | 211 (31.7%) |
| Total | 1,350 (100.0%) | 665 (100.0%) |
Real Estate & Mortgages in Highgrove
Real Estate and Mortgage Overview in Highgrove
| Characteristic | Without Mortgage | With Mortgage |
| Housing Units | 218 | 1,132 |
| Median Property Value | $612,600 | $564,100 |
| Median Household Income | $105,667 | $402 |
| Monthly Housing Costs | $877 | $466 |
| Real Estate Taxes | $4,115 | $0 |
Property Value by Mortgage Status in Highgrove
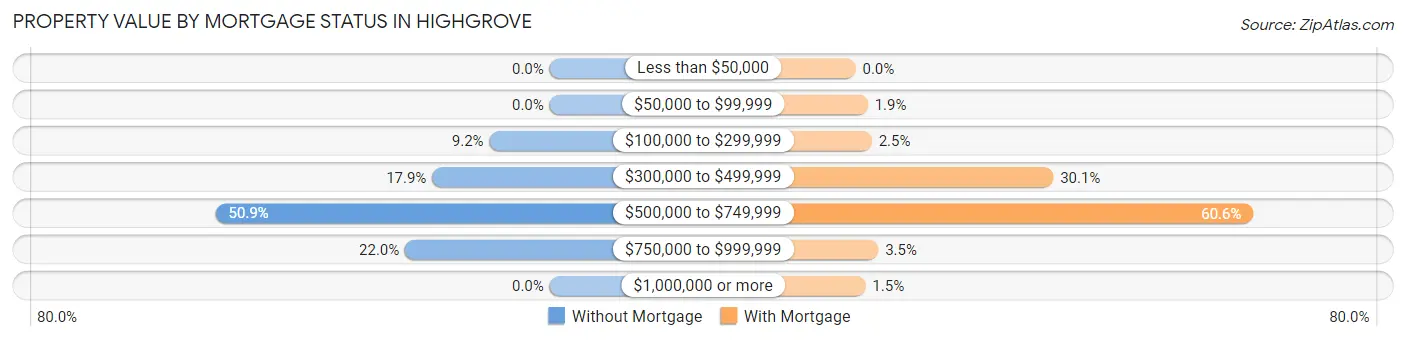
| Property Value | Without Mortgage | With Mortgage |
| Less than $50,000 | 0 (0.0%) | 0 (0.0%) |
| $50,000 to $99,999 | 0 (0.0%) | 21 (1.9%) |
| $100,000 to $299,999 | 20 (9.2%) | 28 (2.5%) |
| $300,000 to $499,999 | 39 (17.9%) | 341 (30.1%) |
| $500,000 to $749,999 | 111 (50.9%) | 686 (60.6%) |
| $750,000 to $999,999 | 48 (22.0%) | 39 (3.5%) |
| $1,000,000 or more | 0 (0.0%) | 17 (1.5%) |
| Total | 218 (100.0%) | 1,132 (100.0%) |
Household Income by Mortgage Status in Highgrove
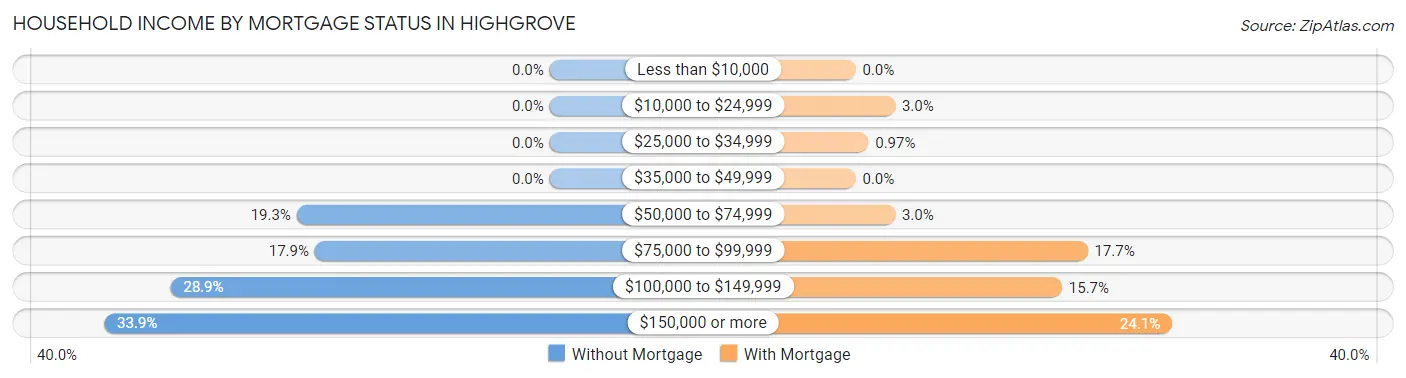
| Household Income | Without Mortgage | With Mortgage |
| Less than $10,000 | 0 (0.0%) | 0 (0.0%) |
| $10,000 to $24,999 | 0 (0.0%) | 34 (3.0%) |
| $25,000 to $34,999 | 0 (0.0%) | 11 (1.0%) |
| $35,000 to $49,999 | 0 (0.0%) | 0 (0.0%) |
| $50,000 to $74,999 | 42 (19.3%) | 34 (3.0%) |
| $75,000 to $99,999 | 39 (17.9%) | 200 (17.7%) |
| $100,000 to $149,999 | 63 (28.9%) | 178 (15.7%) |
| $150,000 or more | 74 (33.9%) | 273 (24.1%) |
| Total | 218 (100.0%) | 1,132 (100.0%) |
Property Value to Household Income Ratio in Highgrove
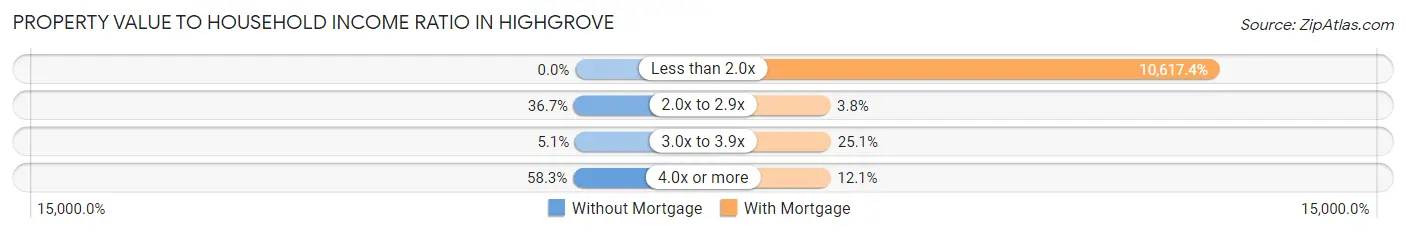
| Value-to-Income Ratio | Without Mortgage | With Mortgage |
| Less than 2.0x | 0 (0.0%) | 120,189 (10,617.4%) |
| 2.0x to 2.9x | 80 (36.7%) | 43 (3.8%) |
| 3.0x to 3.9x | 11 (5.1%) | 284 (25.1%) |
| 4.0x or more | 127 (58.3%) | 137 (12.1%) |
| Total | 218 (100.0%) | 1,132 (100.0%) |
Real Estate Taxes by Mortgage Status in Highgrove
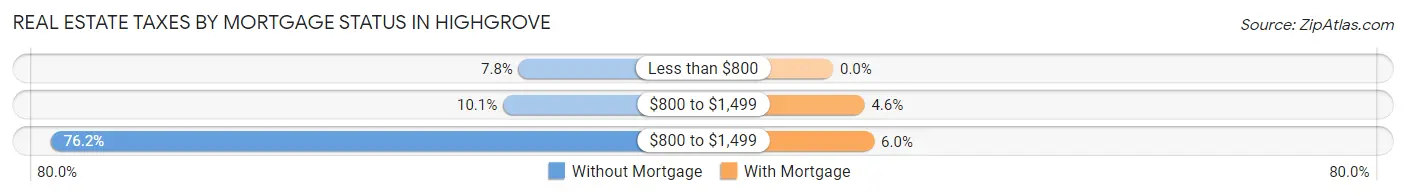
| Property Taxes | Without Mortgage | With Mortgage |
| Less than $800 | 17 (7.8%) | 0 (0.0%) |
| $800 to $1,499 | 22 (10.1%) | 52 (4.6%) |
| $800 to $1,499 | 166 (76.1%) | 68 (6.0%) |
| Total | 218 (100.0%) | 1,132 (100.0%) |
Health & Disability in Highgrove
Health Insurance Coverage by Age in Highgrove
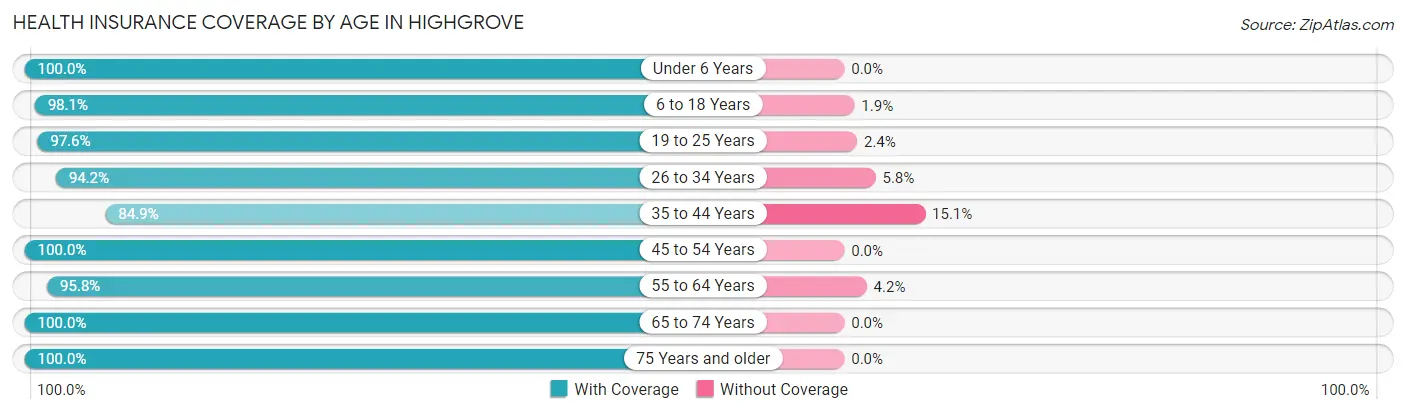
| Age Bracket | With Coverage | Without Coverage |
| Under 6 Years | 772 (100.0%) | 0 (0.0%) |
| 6 to 18 Years | 1,296 (98.1%) | 25 (1.9%) |
| 19 to 25 Years | 986 (97.6%) | 24 (2.4%) |
| 26 to 34 Years | 1,018 (94.2%) | 63 (5.8%) |
| 35 to 44 Years | 727 (84.9%) | 129 (15.1%) |
| 45 to 54 Years | 769 (100.0%) | 0 (0.0%) |
| 55 to 64 Years | 758 (95.8%) | 33 (4.2%) |
| 65 to 74 Years | 241 (100.0%) | 0 (0.0%) |
| 75 Years and older | 199 (100.0%) | 0 (0.0%) |
| Total | 6,766 (96.1%) | 274 (3.9%) |
Health Insurance Coverage by Citizenship Status in Highgrove
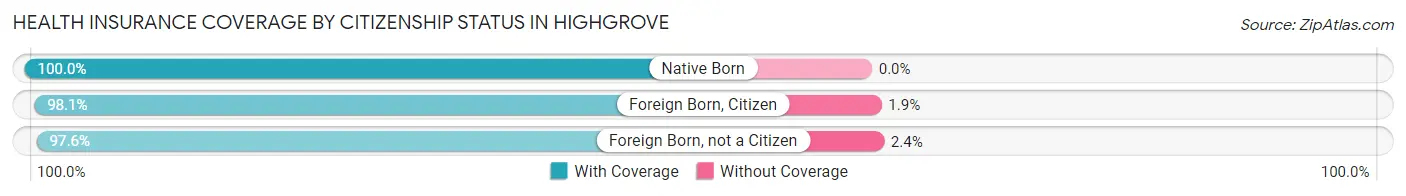
| Citizenship Status | With Coverage | Without Coverage |
| Native Born | 772 (100.0%) | 0 (0.0%) |
| Foreign Born, Citizen | 1,296 (98.1%) | 25 (1.9%) |
| Foreign Born, not a Citizen | 986 (97.6%) | 24 (2.4%) |
Health Insurance Coverage by Household Income in Highgrove
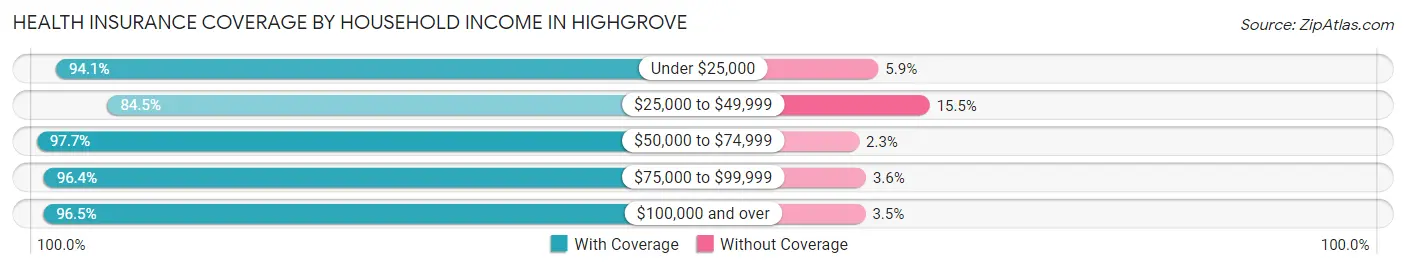
| Household Income | With Coverage | Without Coverage |
| Under $25,000 | 318 (94.1%) | 20 (5.9%) |
| $25,000 to $49,999 | 261 (84.5%) | 48 (15.5%) |
| $50,000 to $74,999 | 1,480 (97.7%) | 35 (2.3%) |
| $75,000 to $99,999 | 643 (96.4%) | 24 (3.6%) |
| $100,000 and over | 4,056 (96.5%) | 147 (3.5%) |
Public vs Private Health Insurance Coverage by Age in Highgrove
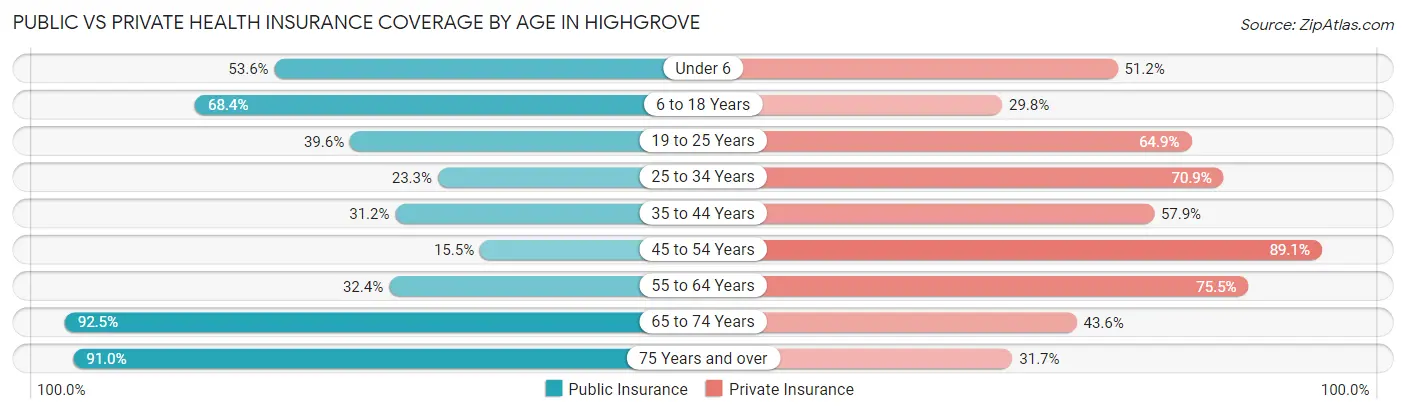
| Age Bracket | Public Insurance | Private Insurance |
| Under 6 | 414 (53.6%) | 395 (51.2%) |
| 6 to 18 Years | 903 (68.4%) | 393 (29.7%) |
| 19 to 25 Years | 400 (39.6%) | 655 (64.8%) |
| 25 to 34 Years | 252 (23.3%) | 766 (70.9%) |
| 35 to 44 Years | 267 (31.2%) | 496 (57.9%) |
| 45 to 54 Years | 119 (15.5%) | 685 (89.1%) |
| 55 to 64 Years | 256 (32.4%) | 597 (75.5%) |
| 65 to 74 Years | 223 (92.5%) | 105 (43.6%) |
| 75 Years and over | 181 (90.9%) | 63 (31.7%) |
| Total | 3,015 (42.8%) | 4,155 (59.0%) |
Disability Status by Sex by Age in Highgrove
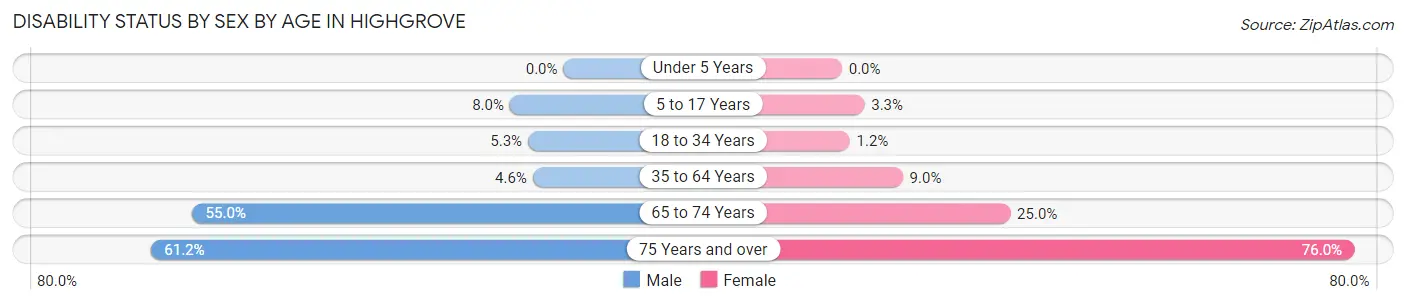
| Age Bracket | Male | Female |
| Under 5 Years | 0 (0.0%) | 0 (0.0%) |
| 5 to 17 Years | 56 (8.0%) | 20 (3.3%) |
| 18 to 34 Years | 56 (5.3%) | 13 (1.2%) |
| 35 to 64 Years | 54 (4.5%) | 111 (9.0%) |
| 65 to 74 Years | 71 (55.0%) | 28 (25.0%) |
| 75 Years and over | 63 (61.2%) | 73 (76.0%) |
Disability Class by Sex by Age in Highgrove
Disability Class: Hearing Difficulty
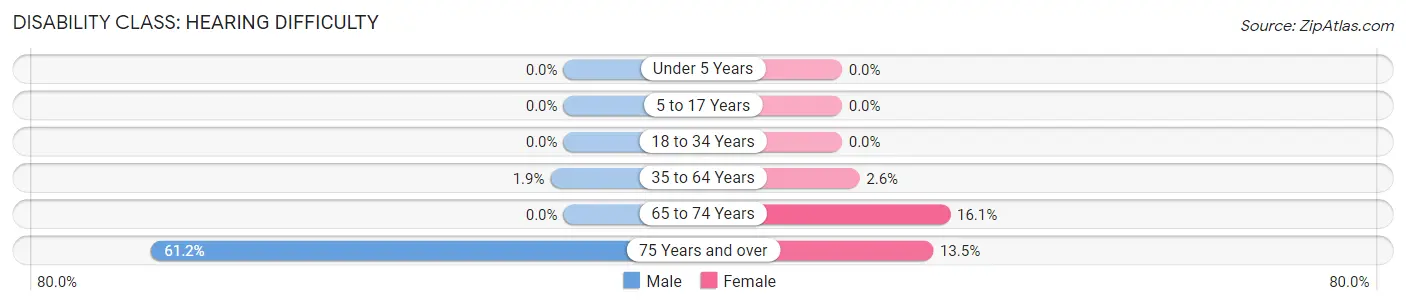
| Age Bracket | Male | Female |
| Under 5 Years | 0 (0.0%) | 0 (0.0%) |
| 5 to 17 Years | 0 (0.0%) | 0 (0.0%) |
| 18 to 34 Years | 0 (0.0%) | 0 (0.0%) |
| 35 to 64 Years | 23 (1.9%) | 32 (2.6%) |
| 65 to 74 Years | 0 (0.0%) | 18 (16.1%) |
| 75 Years and over | 63 (61.2%) | 13 (13.5%) |
Disability Class: Vision Difficulty
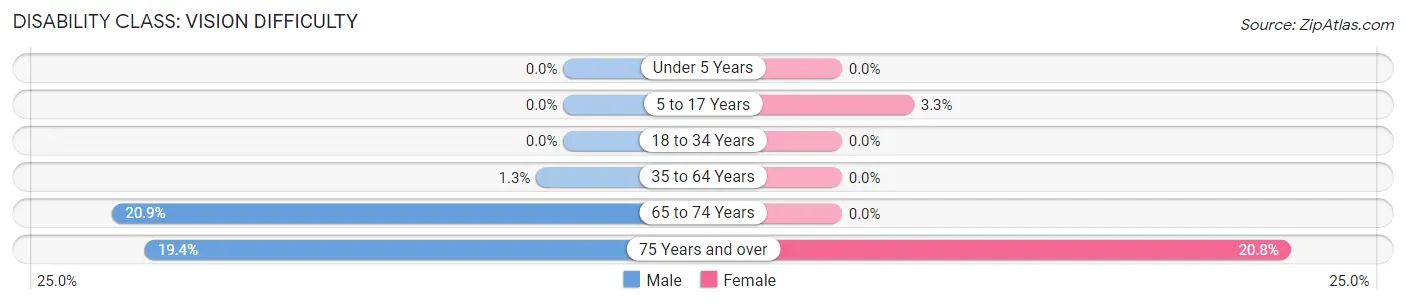
| Age Bracket | Male | Female |
| Under 5 Years | 0 (0.0%) | 0 (0.0%) |
| 5 to 17 Years | 0 (0.0%) | 20 (3.3%) |
| 18 to 34 Years | 0 (0.0%) | 0 (0.0%) |
| 35 to 64 Years | 15 (1.3%) | 0 (0.0%) |
| 65 to 74 Years | 27 (20.9%) | 0 (0.0%) |
| 75 Years and over | 20 (19.4%) | 20 (20.8%) |
Disability Class: Cognitive Difficulty
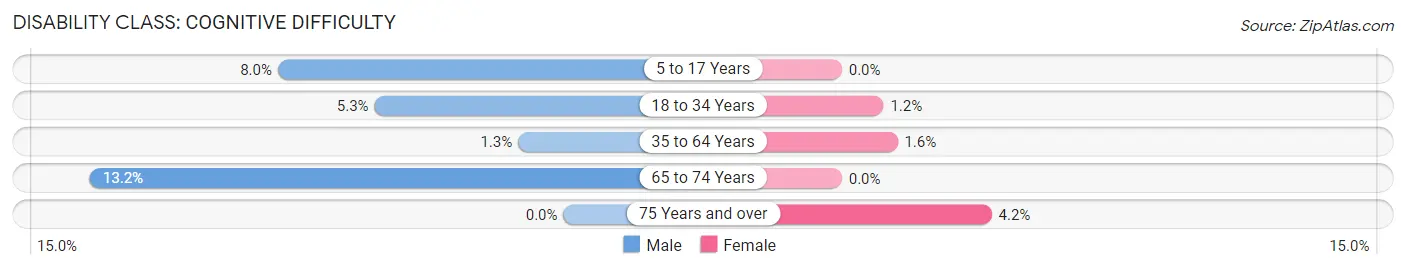
| Age Bracket | Male | Female |
| 5 to 17 Years | 56 (8.0%) | 0 (0.0%) |
| 18 to 34 Years | 56 (5.3%) | 13 (1.2%) |
| 35 to 64 Years | 15 (1.3%) | 19 (1.5%) |
| 65 to 74 Years | 17 (13.2%) | 0 (0.0%) |
| 75 Years and over | 0 (0.0%) | 4 (4.2%) |
Disability Class: Ambulatory Difficulty
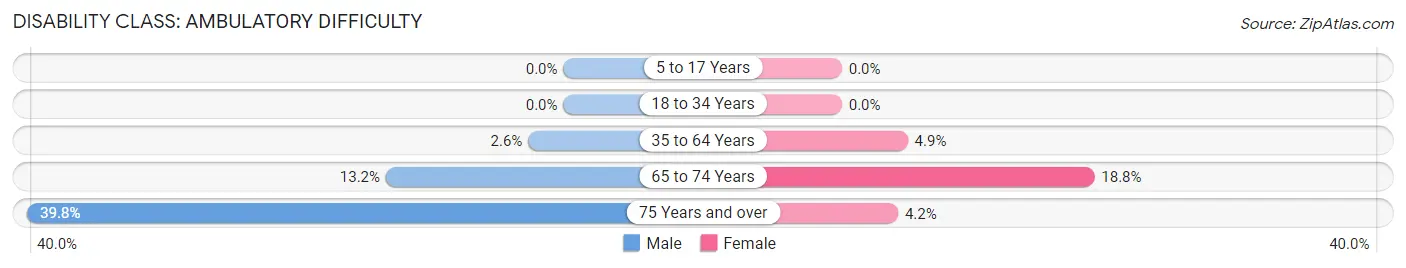
| Age Bracket | Male | Female |
| 5 to 17 Years | 0 (0.0%) | 0 (0.0%) |
| 18 to 34 Years | 0 (0.0%) | 0 (0.0%) |
| 35 to 64 Years | 31 (2.6%) | 60 (4.9%) |
| 65 to 74 Years | 17 (13.2%) | 21 (18.8%) |
| 75 Years and over | 41 (39.8%) | 4 (4.2%) |
Disability Class: Self-Care Difficulty
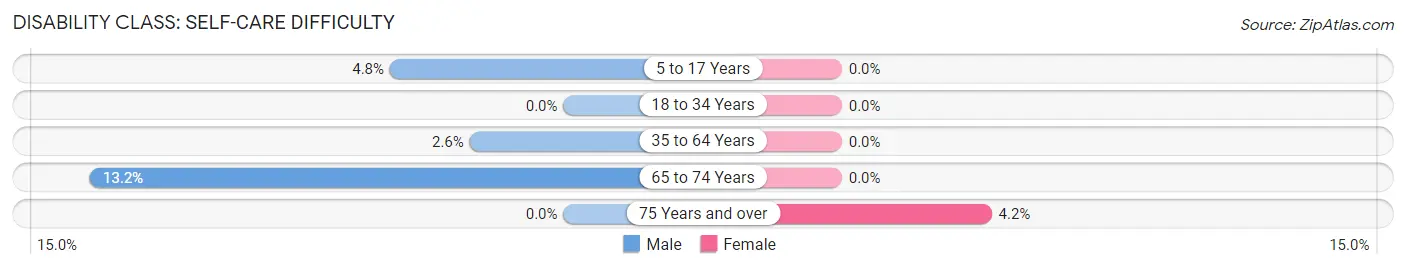
| Age Bracket | Male | Female |
| 5 to 17 Years | 34 (4.8%) | 0 (0.0%) |
| 18 to 34 Years | 0 (0.0%) | 0 (0.0%) |
| 35 to 64 Years | 31 (2.6%) | 0 (0.0%) |
| 65 to 74 Years | 17 (13.2%) | 0 (0.0%) |
| 75 Years and over | 0 (0.0%) | 4 (4.2%) |
Technology Access in Highgrove
Computing Device Access in Highgrove
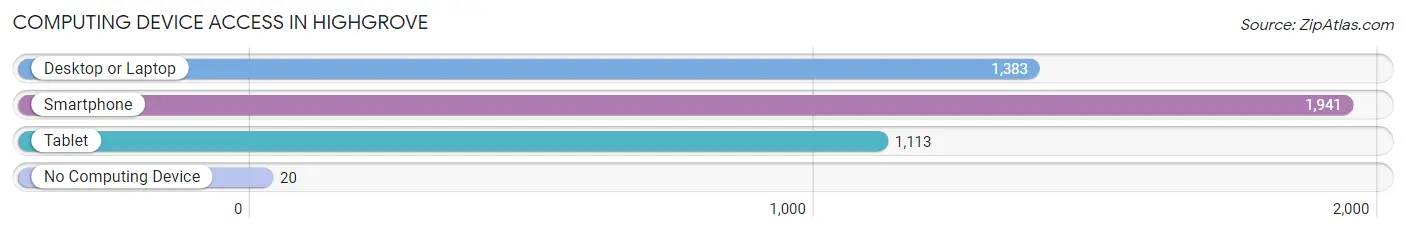
| Device Type | # Households | % Households |
| Desktop or Laptop | 1,383 | 68.6% |
| Smartphone | 1,941 | 96.3% |
| Tablet | 1,113 | 55.2% |
| No Computing Device | 20 | 1.0% |
| Total | 2,015 | 100.0% |
Internet Access in Highgrove
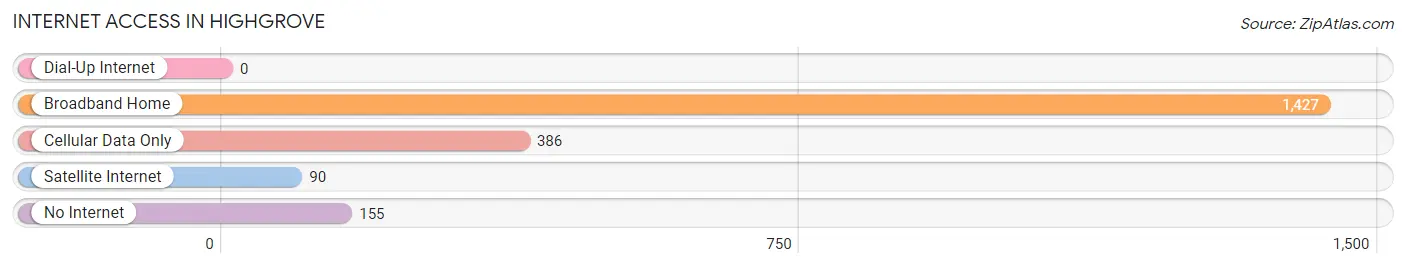
| Internet Type | # Households | % Households |
| Dial-Up Internet | 0 | 0.0% |
| Broadband Home | 1,427 | 70.8% |
| Cellular Data Only | 386 | 19.2% |
| Satellite Internet | 90 | 4.5% |
| No Internet | 155 | 7.7% |
| Total | 2,015 | 100.0% |
Highgrove Summary
Highgrove is a small unincorporated community located in Riverside County, California. It is situated in the San Gorgonio Pass, between the cities of Riverside and San Bernardino. The population of Highgrove was estimated to be 1,845 in 2019.
History
Highgrove was founded in 1887 by the Southern Pacific Railroad. The town was named after the nearby Highgrove Ranch, which was owned by the railroad. The ranch was used to raise cattle and horses, and the town was established to provide services to the ranch.
Highgrove was originally a small farming community, but it began to grow in the early 1900s when the citrus industry began to take off in the area. The town was home to several citrus packing houses, and the citrus industry was the main source of employment for the residents.
In the 1950s, the citrus industry began to decline, and the town began to decline as well. The population of Highgrove decreased from 1,500 in 1950 to just over 1,000 in 1970.
Geography
Highgrove is located in the San Gorgonio Pass, which is a mountain pass located between the San Bernardino Mountains and the San Jacinto Mountains. The pass is located at an elevation of 1,845 feet (562 m).
The town is located on the north side of the pass, and it is bordered by the cities of Riverside and San Bernardino. The town is located near the intersection of Interstate 10 and State Route 60.
Economy
Highgrove is primarily a residential community, and the main source of employment is in the service sector. The town is home to several small businesses, including restaurants, convenience stores, and auto repair shops.
The town is also home to a few light industrial businesses, including a metal fabrication shop and a printing company.
Demographics
As of the 2010 census, the population of Highgrove was 1,845. The racial makeup of the town was 63.3% White, 0.7% African American, 0.3% Native American, 0.7% Asian, 0.1% Pacific Islander, 32.2% from other races, and 2.9% from two or more races. Hispanic or Latino of any race were 57.3% of the population.
The median household income in Highgrove was $45,938, and the median family income was $50,938. The per capita income for the town was $19,938. About 17.3% of families and 20.3% of the population were below the poverty line, including 28.3% of those under age 18 and 8.3% of those age 65 or over.
Common Questions
What is Per Capita Income in Highgrove?
Per Capita income in Highgrove is $34,491.
What is the Median Family Income in Highgrove?
Median Family Income in Highgrove is $100,682.
What is the Median Household income in Highgrove?
Median Household Income in Highgrove is $100,540.
What is Income or Wage Gap in Highgrove?
Income or Wage Gap in Highgrove is 10.7%.
Women in Highgrove earn 89.3 cents for every dollar earned by a man.
What is Inequality or Gini Index in Highgrove?
Inequality or Gini Index in Highgrove is 0.36.
What is the Total Population of Highgrove?
Total Population of Highgrove is 7,069.
What is the Total Male Population of Highgrove?
Total Male Population of Highgrove is 3,484.
What is the Total Female Population of Highgrove?
Total Female Population of Highgrove is 3,585.
What is the Ratio of Males per 100 Females in Highgrove?
There are 97.18 Males per 100 Females in Highgrove.
What is the Ratio of Females per 100 Males in Highgrove?
There are 102.90 Females per 100 Males in Highgrove.
What is the Median Population Age in Highgrove?
Median Population Age in Highgrove is 30.3 Years.
What is the Average Family Size in Highgrove
Average Family Size in Highgrove is 3.8 People.
What is the Average Household Size in Highgrove
Average Household Size in Highgrove is 3.5 People.
How Large is the Labor Force in Highgrove?
There are 3,797 People in the Labor Forcein in Highgrove.
What is the Percentage of People in the Labor Force in Highgrove?
72.9% of People are in the Labor Force in Highgrove.
What is the Unemployment Rate in Highgrove?
Unemployment Rate in Highgrove is 4.4%.