Weldon, CA Map & Demographics
Weldon Map
Weldon Overview
$26,157
PER CAPITA INCOME
$45,107
AVG FAMILY INCOME
$27,377
AVG HOUSEHOLD INCOME
0.50
INEQUALITY / GINI INDEX
2,602
TOTAL POPULATION
1,377
MALE POPULATION
1,225
FEMALE POPULATION
112.41
MALES / 100 FEMALES
88.96
FEMALES / 100 MALES
59.4
MEDIAN AGE
2.3
AVG FAMILY SIZE
2.0
AVG HOUSEHOLD SIZE
837
LABOR FORCE [ PEOPLE ]
37.8%
PERCENT IN LABOR FORCE
6.1%
UNEMPLOYMENT RATE
Weldon Zip Codes
Weldon Area Codes
Income in Weldon
Income Overview in Weldon
Per Capita Income in Weldon is $26,157, while median incomes of families and households are $45,107 and $27,377 respectively.
| Characteristic | Number | Measure |
| Per Capita Income | 2,602 | $26,157 |
| Median Family Income | 873 | $45,107 |
| Mean Family Income | 873 | $58,049 |
| Median Household Income | 1,305 | $27,377 |
| Mean Household Income | 1,305 | $50,759 |
| Income Deficit | 873 | $0 |
| Wage / Income Gap (%) | 2,602 | 0.00% |
| Wage / Income Gap ($) | 2,602 | 100.00¢ per $1 |
| Gini / Inequality Index | 2,602 | 0.50 |
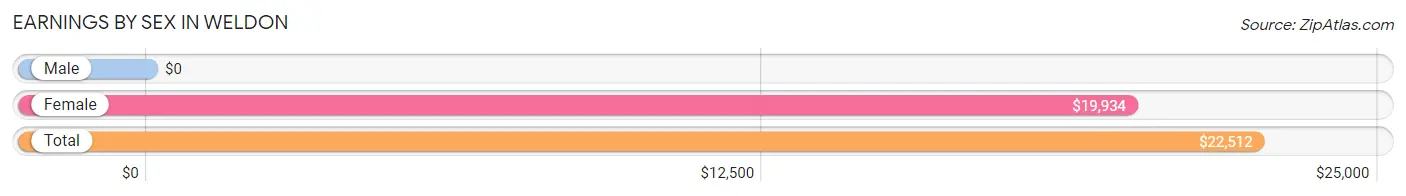
Earnings by Sex in Weldon
| Sex | Number | Average Earnings |
| Male | 408 (49.4%) | $0 |
| Female | 417 (50.5%) | $19,934 |
| Total | 825 (100.0%) | $22,512 |
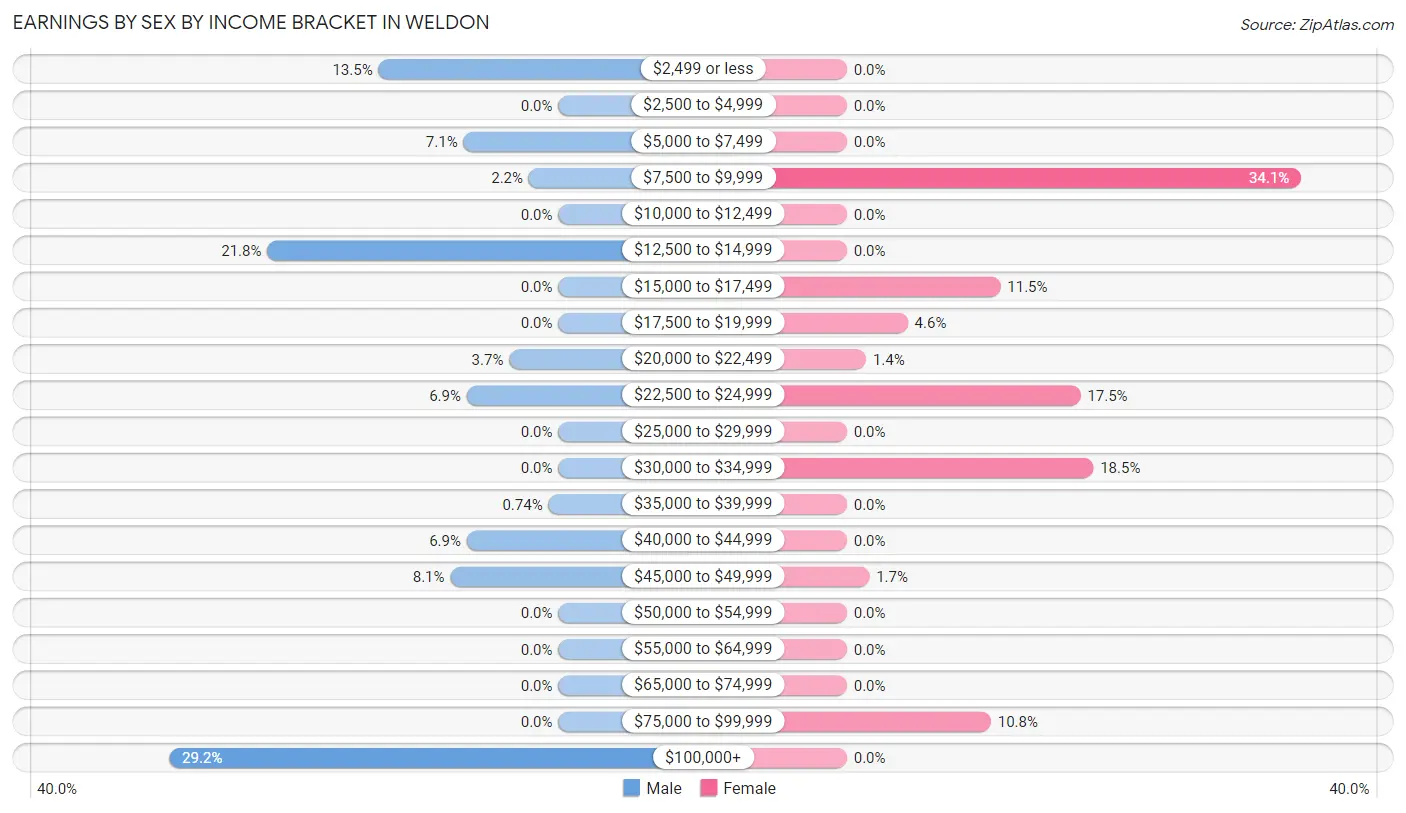
Earnings by Sex by Income Bracket in Weldon
The most common earnings brackets in Weldon are $100,000+ for men (119 | 29.2%) and $7,500 to $9,999 for women (142 | 34.1%).
| Income | Male | Female |
| $2,499 or less | 55 (13.5%) | 0 (0.0%) |
| $2,500 to $4,999 | 0 (0.0%) | 0 (0.0%) |
| $5,000 to $7,499 | 29 (7.1%) | 0 (0.0%) |
| $7,500 to $9,999 | 9 (2.2%) | 142 (34.1%) |
| $10,000 to $12,499 | 0 (0.0%) | 0 (0.0%) |
| $12,500 to $14,999 | 89 (21.8%) | 0 (0.0%) |
| $15,000 to $17,499 | 0 (0.0%) | 48 (11.5%) |
| $17,500 to $19,999 | 0 (0.0%) | 19 (4.6%) |
| $20,000 to $22,499 | 15 (3.7%) | 6 (1.4%) |
| $22,500 to $24,999 | 28 (6.9%) | 73 (17.5%) |
| $25,000 to $29,999 | 0 (0.0%) | 0 (0.0%) |
| $30,000 to $34,999 | 0 (0.0%) | 77 (18.5%) |
| $35,000 to $39,999 | 3 (0.7%) | 0 (0.0%) |
| $40,000 to $44,999 | 28 (6.9%) | 0 (0.0%) |
| $45,000 to $49,999 | 33 (8.1%) | 7 (1.7%) |
| $50,000 to $54,999 | 0 (0.0%) | 0 (0.0%) |
| $55,000 to $64,999 | 0 (0.0%) | 0 (0.0%) |
| $65,000 to $74,999 | 0 (0.0%) | 0 (0.0%) |
| $75,000 to $99,999 | 0 (0.0%) | 45 (10.8%) |
| $100,000+ | 119 (29.2%) | 0 (0.0%) |
| Total | 408 (100.0%) | 417 (100.0%) |
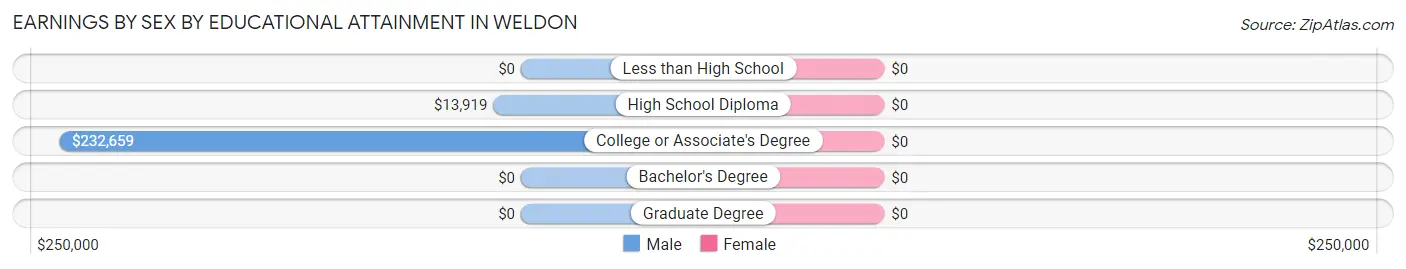
Earnings by Sex by Educational Attainment in Weldon
| Educational Attainment | Male Income | Female Income |
| Less than High School | - | - |
| High School Diploma | $13,919 | $0 |
| College or Associate's Degree | $232,659 | $0 |
| Bachelor's Degree | - | - |
| Graduate Degree | - | - |
| Total | - | - |
Family Income in Weldon
Family Income Brackets in Weldon
According to the Weldon family income data, there are 154 families falling into the $10,000 to $14,999 income range, which is the most common income bracket and makes up 17.6% of all families. Conversely, the $75,000 to $99,999 income bracket is the least frequent group with only 17 families (1.9%) belonging to this category.
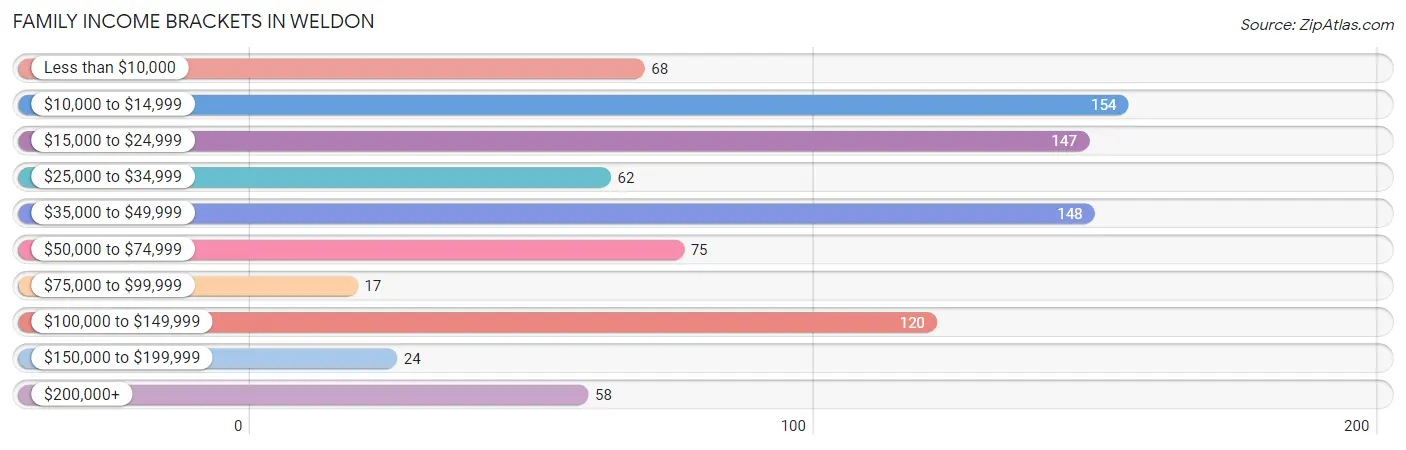
| Income Bracket | # Families | % Families |
| Less than $10,000 | 68 | 7.8% |
| $10,000 to $14,999 | 154 | 17.6% |
| $15,000 to $24,999 | 147 | 16.8% |
| $25,000 to $34,999 | 62 | 7.1% |
| $35,000 to $49,999 | 148 | 17.0% |
| $50,000 to $74,999 | 75 | 8.6% |
| $75,000 to $99,999 | 17 | 1.9% |
| $100,000 to $149,999 | 120 | 13.7% |
| $150,000 to $199,999 | 24 | 2.7% |
| $200,000+ | 58 | 6.6% |
Family Income by Famaliy Size in Weldon
2-person families (768 | 88.0%) account for the highest median family income in Weldon with $45,581 per family, while 2-person families (768 | 88.0%) have the highest median income of $22,790 per family member.
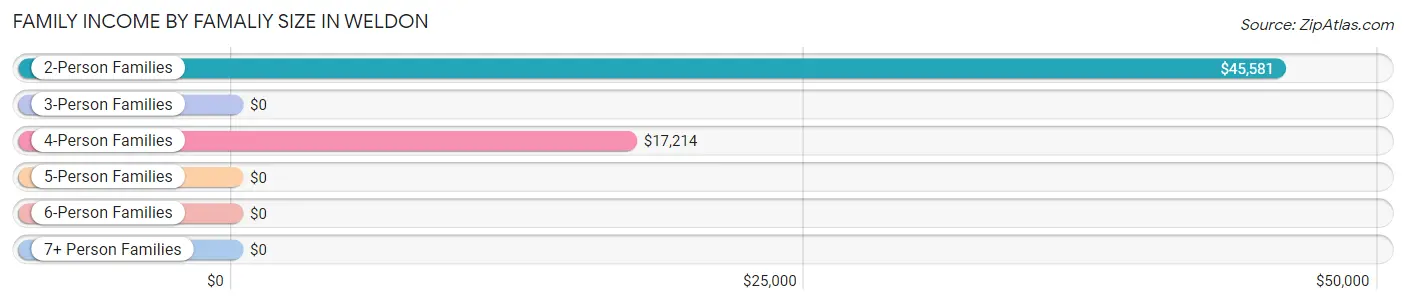
| Income Bracket | # Families | Median Income |
| 2-Person Families | 768 (88.0%) | $45,581 |
| 3-Person Families | 43 (4.9%) | $0 |
| 4-Person Families | 62 (7.1%) | $17,214 |
| 5-Person Families | 0 (0.0%) | $0 |
| 6-Person Families | 0 (0.0%) | $0 |
| 7+ Person Families | 0 (0.0%) | $0 |
| Total | 873 (100.0%) | $45,107 |
Family Income by Number of Earners in Weldon
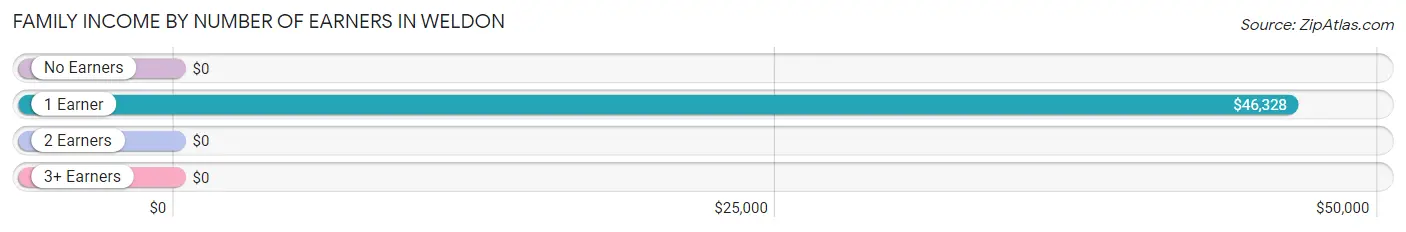
| Number of Earners | # Families | Median Income |
| No Earners | 315 (36.1%) | $0 |
| 1 Earner | 463 (53.0%) | $46,328 |
| 2 Earners | 95 (10.9%) | $0 |
| 3+ Earners | 0 (0.0%) | $0 |
| Total | 873 (100.0%) | $45,107 |
Household Income in Weldon
Household Income Brackets in Weldon
With 292 households falling in the category, the $15,000 to $24,999 income range is the most frequent in Weldon, accounting for 22.4% of all households. In contrast, only 23 households (1.8%) fall into the $150,000 to $199,999 income bracket, making it the least populous group.
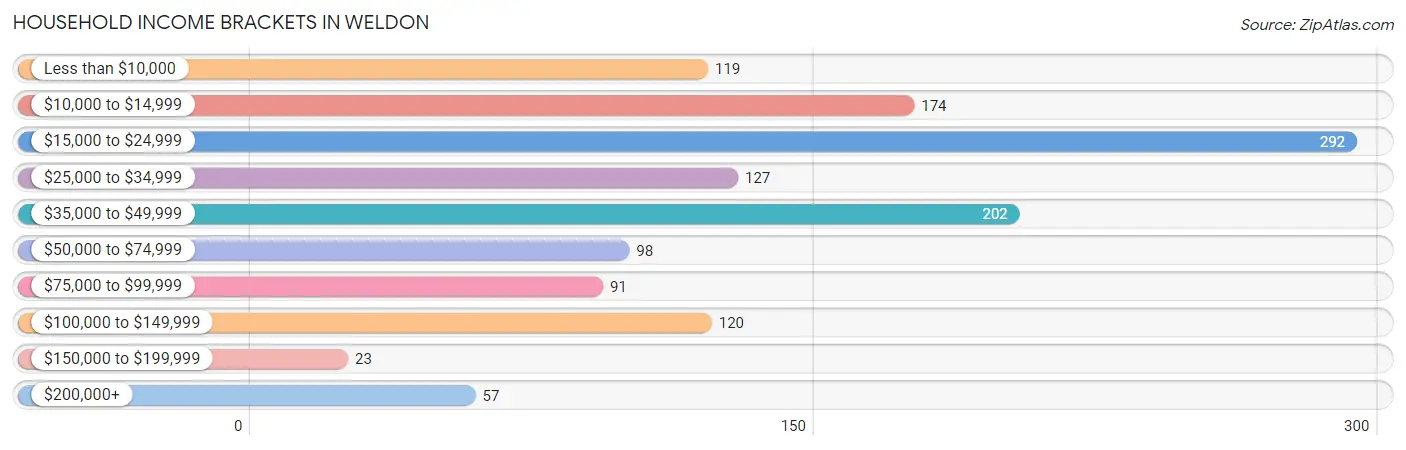
| Income Bracket | # Households | % Households |
| Less than $10,000 | 119 | 9.1% |
| $10,000 to $14,999 | 174 | 13.3% |
| $15,000 to $24,999 | 292 | 22.4% |
| $25,000 to $34,999 | 127 | 9.7% |
| $35,000 to $49,999 | 202 | 15.5% |
| $50,000 to $74,999 | 98 | 7.5% |
| $75,000 to $99,999 | 91 | 7.0% |
| $100,000 to $149,999 | 120 | 9.2% |
| $150,000 to $199,999 | 23 | 1.8% |
| $200,000+ | 57 | 4.4% |
Household Income by Householder Age in Weldon
The median household income in Weldon is $27,377, with the highest median household income of $45,233 found in the 65+ years age bracket for the primary householder. A total of 674 households (51.6%) fall into this category.
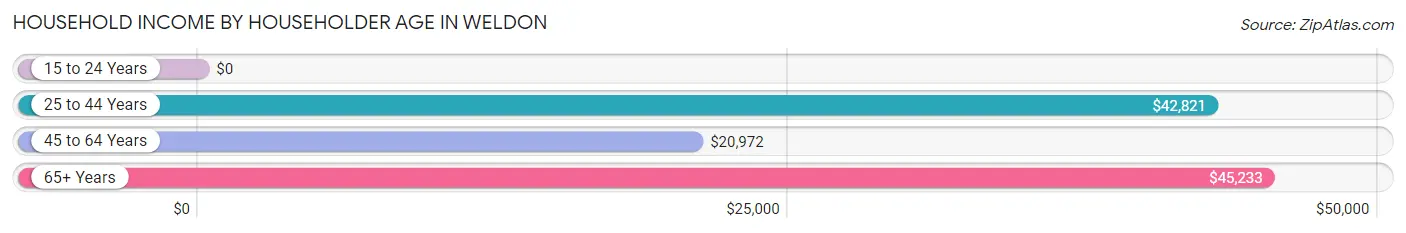
| Income Bracket | # Households | Median Income |
| 15 to 24 Years | 0 (0.0%) | $0 |
| 25 to 44 Years | 173 (13.3%) | $42,821 |
| 45 to 64 Years | 458 (35.1%) | $20,972 |
| 65+ Years | 674 (51.6%) | $45,233 |
| Total | 1,305 (100.0%) | $27,377 |
Poverty in Weldon
Income Below Poverty by Sex and Age in Weldon
With 47.7% poverty level for males and 22.3% for females among the residents of Weldon, 12 to 14 year old males and 12 to 14 year old females are the most vulnerable to poverty, with 53 males (100.0%) and 36 females (100.0%) in their respective age groups living below the poverty level.
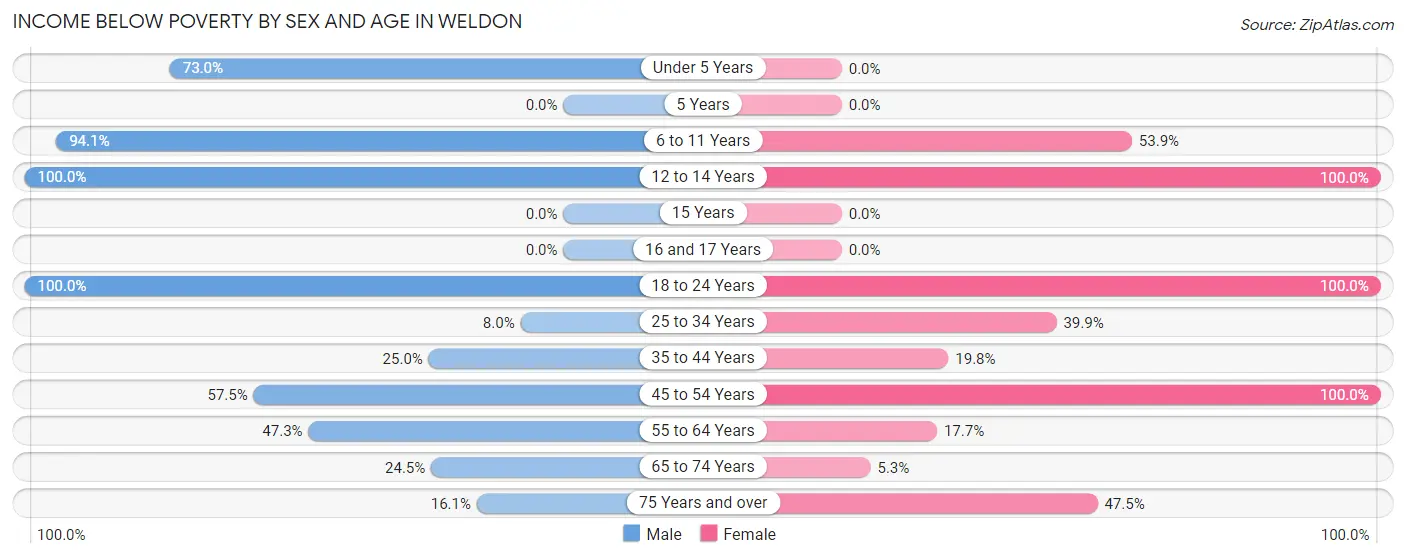
| Age Bracket | Male | Female |
| Under 5 Years | 84 (73.0%) | 0 (0.0%) |
| 5 Years | 0 (0.0%) | 0 (0.0%) |
| 6 to 11 Years | 112 (94.1%) | 35 (53.8%) |
| 12 to 14 Years | 53 (100.0%) | 36 (100.0%) |
| 15 Years | 0 (0.0%) | 0 (0.0%) |
| 16 and 17 Years | 0 (0.0%) | 0 (0.0%) |
| 18 to 24 Years | 69 (100.0%) | 19 (100.0%) |
| 25 to 34 Years | 9 (8.0%) | 53 (39.9%) |
| 35 to 44 Years | 8 (25.0%) | 18 (19.8%) |
| 45 to 54 Years | 69 (57.5%) | 10 (100.0%) |
| 55 to 64 Years | 150 (47.3%) | 44 (17.7%) |
| 65 to 74 Years | 94 (24.5%) | 30 (5.3%) |
| 75 Years and over | 9 (16.1%) | 28 (47.5%) |
| Total | 657 (47.7%) | 273 (22.3%) |
Income Above Poverty by Sex and Age in Weldon
According to the poverty statistics in Weldon, males aged 25 to 34 years and females aged 65 to 74 years are the age groups that are most secure financially, with 92.0% of males and 94.7% of females in these age groups living above the poverty line.
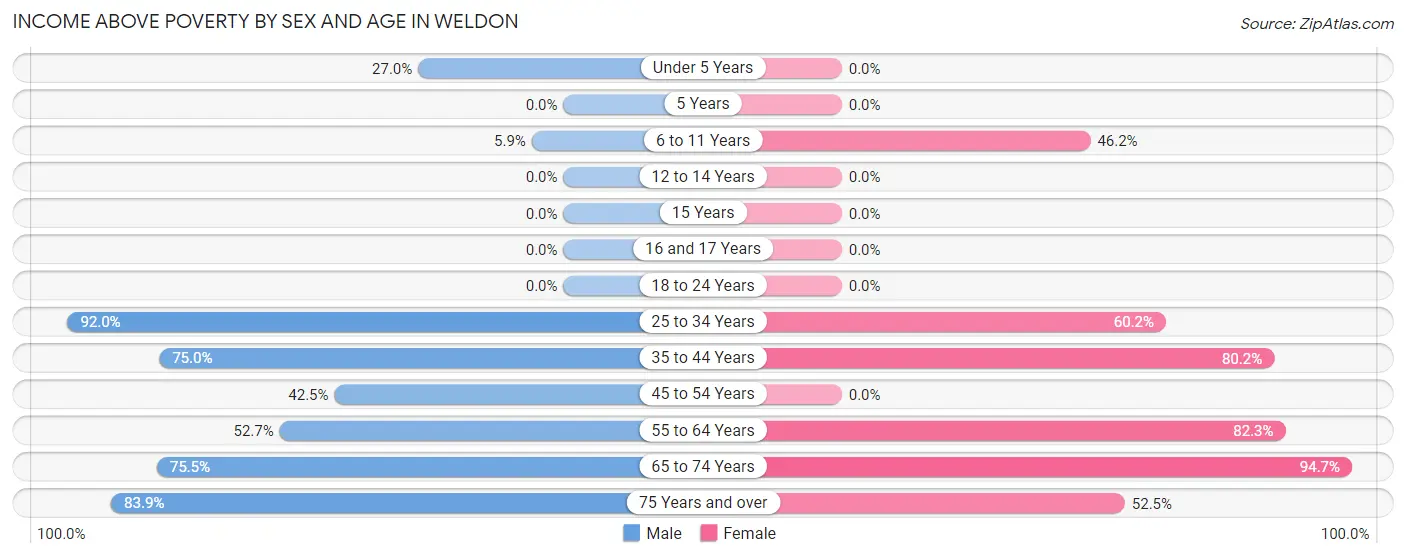
| Age Bracket | Male | Female |
| Under 5 Years | 31 (27.0%) | 0 (0.0%) |
| 5 Years | 0 (0.0%) | 0 (0.0%) |
| 6 to 11 Years | 7 (5.9%) | 30 (46.2%) |
| 12 to 14 Years | 0 (0.0%) | 0 (0.0%) |
| 15 Years | 0 (0.0%) | 0 (0.0%) |
| 16 and 17 Years | 0 (0.0%) | 0 (0.0%) |
| 18 to 24 Years | 0 (0.0%) | 0 (0.0%) |
| 25 to 34 Years | 104 (92.0%) | 80 (60.2%) |
| 35 to 44 Years | 24 (75.0%) | 73 (80.2%) |
| 45 to 54 Years | 51 (42.5%) | 0 (0.0%) |
| 55 to 64 Years | 167 (52.7%) | 205 (82.3%) |
| 65 to 74 Years | 289 (75.5%) | 533 (94.7%) |
| 75 Years and over | 47 (83.9%) | 31 (52.5%) |
| Total | 720 (52.3%) | 952 (77.7%) |
Income Below Poverty Among Married-Couple Families in Weldon
The poverty statistics for married-couple families in Weldon show that 8.7% or 31 of the total 358 families live below the poverty line. Families with no children have the highest poverty rate of 8.9%, comprising of 31 families. On the other hand, families with 1 or 2 children have the lowest poverty rate of 0.0%, which includes 0 families.
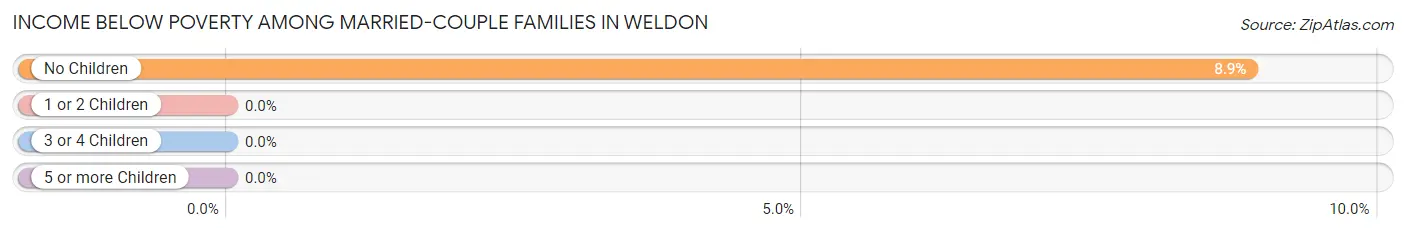
| Children | Above Poverty | Below Poverty |
| No Children | 318 (91.1%) | 31 (8.9%) |
| 1 or 2 Children | 9 (100.0%) | 0 (0.0%) |
| 3 or 4 Children | 0 (0.0%) | 0 (0.0%) |
| 5 or more Children | 0 (0.0%) | 0 (0.0%) |
| Total | 327 (91.3%) | 31 (8.7%) |
Income Below Poverty Among Single-Parent Households in Weldon
According to the poverty data in Weldon, 61.9% or 167 single-father households and 38.8% or 95 single-mother households are living below the poverty line. Among single-father households, those with 1 or 2 children have the highest poverty rate, with 121 households (71.6%) experiencing poverty. Likewise, among single-mother households, those with 1 or 2 children have the highest poverty rate, with 42 households (100.0%) falling below the poverty line.
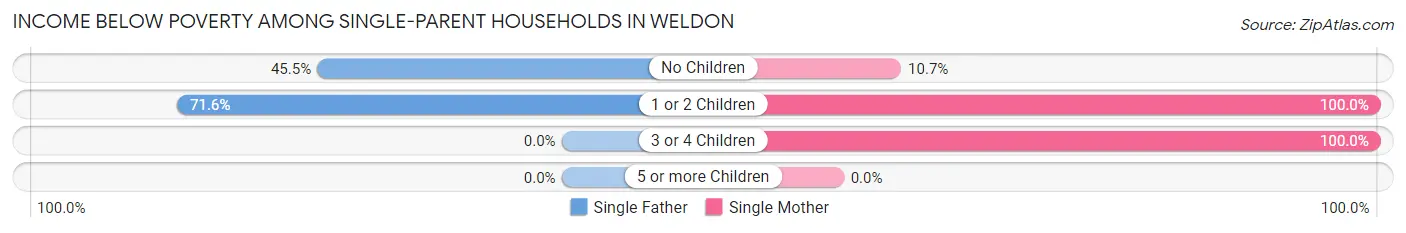
| Children | Single Father | Single Mother |
| No Children | 46 (45.5%) | 18 (10.7%) |
| 1 or 2 Children | 121 (71.6%) | 42 (100.0%) |
| 3 or 4 Children | 0 (0.0%) | 35 (100.0%) |
| 5 or more Children | 0 (0.0%) | 0 (0.0%) |
| Total | 167 (61.9%) | 95 (38.8%) |
Income Below Poverty Among Married-Couple vs Single-Parent Households in Weldon
The poverty data for Weldon shows that 31 of the married-couple family households (8.7%) and 262 of the single-parent households (50.9%) are living below the poverty level. Within the married-couple family households, those with no children have the highest poverty rate, with 31 households (8.9%) falling below the poverty line. Among the single-parent households, those with 3 or 4 children have the highest poverty rate, with 35 household (100.0%) living below poverty.
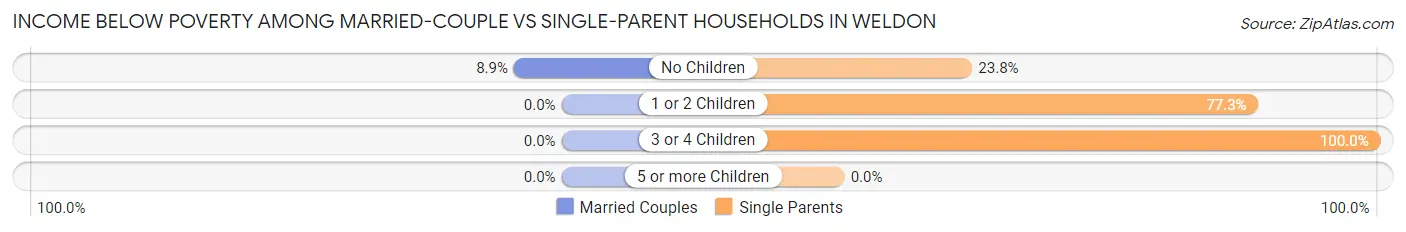
| Children | Married-Couple Families | Single-Parent Households |
| No Children | 31 (8.9%) | 64 (23.8%) |
| 1 or 2 Children | 0 (0.0%) | 163 (77.2%) |
| 3 or 4 Children | 0 (0.0%) | 35 (100.0%) |
| 5 or more Children | 0 (0.0%) | 0 (0.0%) |
| Total | 31 (8.7%) | 262 (50.9%) |
Race in Weldon
The most populous races in Weldon are White / Caucasian (2,285 | 87.8%), Hispanic or Latino (174 | 6.7%), and Some other Race (118 | 4.5%).

| Race | # Population | % Population |
| Asian | 23 | 0.9% |
| Black / African American | 0 | 0.0% |
| Hawaiian / Pacific | 0 | 0.0% |
| Hispanic or Latino | 174 | 6.7% |
| Native / Alaskan | 94 | 3.6% |
| White / Caucasian | 2,285 | 87.8% |
| Two or more Races | 82 | 3.2% |
| Some other Race | 118 | 4.5% |
| Total | 2,602 | 100.0% |
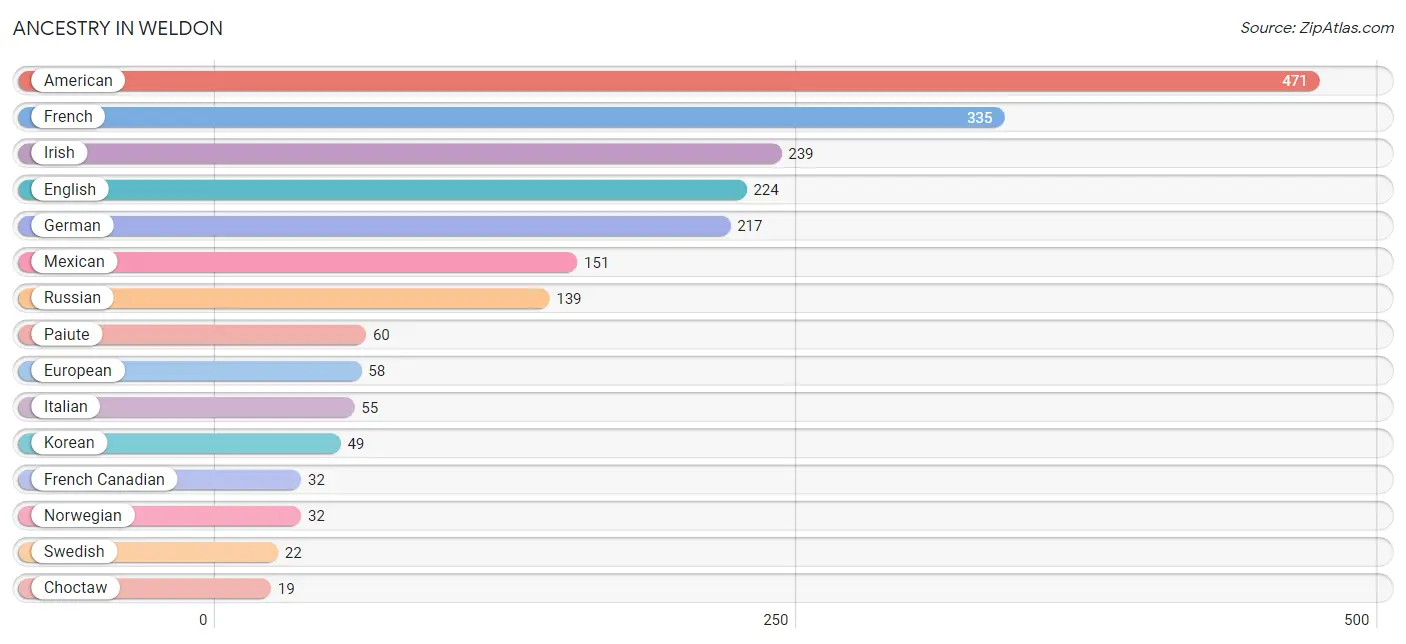
Ancestry in Weldon
The most populous ancestries reported in Weldon are American (471 | 18.1%), French (335 | 12.9%), Irish (239 | 9.2%), English (224 | 8.6%), and German (217 | 8.3%), together accounting for 57.1% of all Weldon residents.
| Ancestry | # Population | % Population |
| American | 471 | 18.1% |
| Bangladeshi | 6 | 0.2% |
| Burmese | 14 | 0.5% |
| Central American | 13 | 0.5% |
| Cherokee | 10 | 0.4% |
| Choctaw | 19 | 0.7% |
| Dutch | 17 | 0.6% |
| English | 224 | 8.6% |
| European | 58 | 2.2% |
| French | 335 | 12.9% |
| French Canadian | 32 | 1.2% |
| German | 217 | 8.3% |
| Guatemalan | 13 | 0.5% |
| Irish | 239 | 9.2% |
| Italian | 55 | 2.1% |
| Korean | 49 | 1.9% |
| Mexican | 151 | 5.8% |
| Nepalese | 3 | 0.1% |
| Norwegian | 32 | 1.2% |
| Paiute | 60 | 2.3% |
| Russian | 139 | 5.3% |
| Spanish | 10 | 0.4% |
| Swedish | 22 | 0.9% | View All 23 Rows |
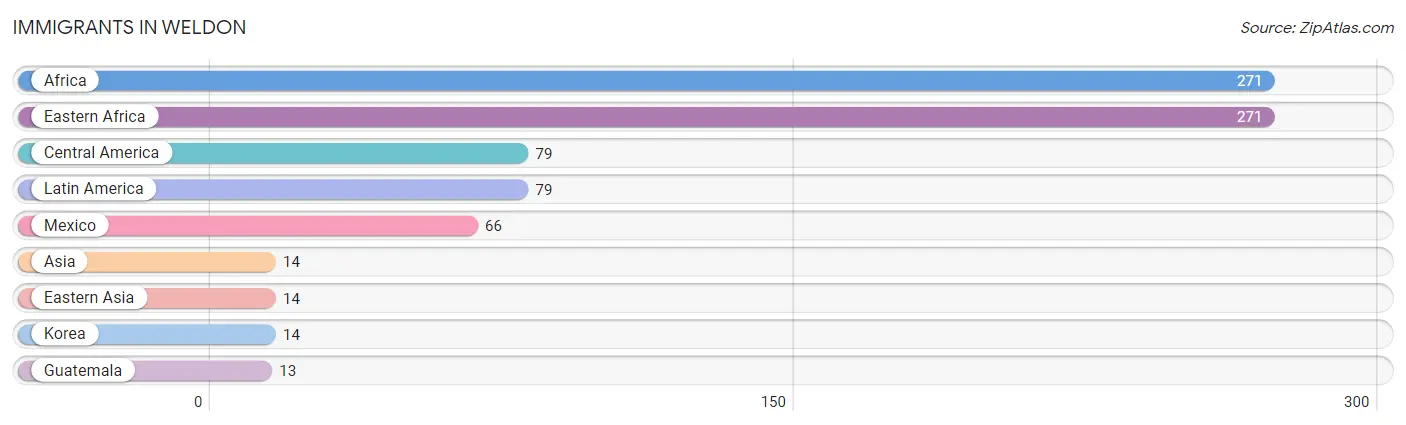
Immigrants in Weldon
The most numerous immigrant groups reported in Weldon came from Africa (271 | 10.4%), Eastern Africa (271 | 10.4%), Central America (79 | 3.0%), Latin America (79 | 3.0%), and Mexico (66 | 2.5%), together accounting for 29.5% of all Weldon residents.
| Immigration Origin | # Population | % Population |
| Africa | 271 | 10.4% |
| Asia | 14 | 0.5% |
| Central America | 79 | 3.0% |
| Eastern Africa | 271 | 10.4% |
| Eastern Asia | 14 | 0.5% |
| Guatemala | 13 | 0.5% |
| Korea | 14 | 0.5% |
| Latin America | 79 | 3.0% |
| Mexico | 66 | 2.5% | View All 9 Rows |
Sex and Age in Weldon
Sex and Age in Weldon
The most populous age groups in Weldon are 55 to 59 Years (259 | 18.8%) for men and 65 to 69 Years (432 | 35.3%) for women.
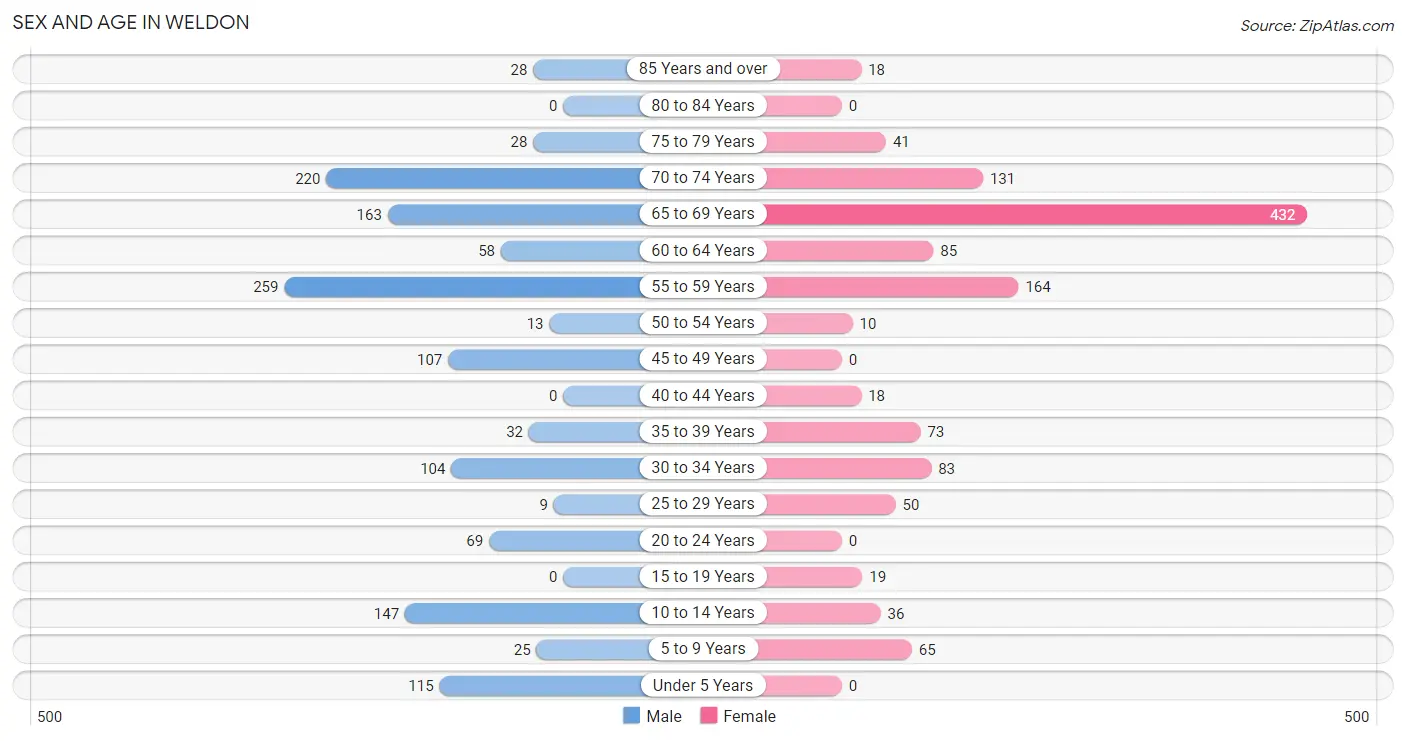
| Age Bracket | Male | Female |
| Under 5 Years | 115 (8.4%) | 0 (0.0%) |
| 5 to 9 Years | 25 (1.8%) | 65 (5.3%) |
| 10 to 14 Years | 147 (10.7%) | 36 (2.9%) |
| 15 to 19 Years | 0 (0.0%) | 19 (1.5%) |
| 20 to 24 Years | 69 (5.0%) | 0 (0.0%) |
| 25 to 29 Years | 9 (0.6%) | 50 (4.1%) |
| 30 to 34 Years | 104 (7.5%) | 83 (6.8%) |
| 35 to 39 Years | 32 (2.3%) | 73 (6.0%) |
| 40 to 44 Years | 0 (0.0%) | 18 (1.5%) |
| 45 to 49 Years | 107 (7.8%) | 0 (0.0%) |
| 50 to 54 Years | 13 (0.9%) | 10 (0.8%) |
| 55 to 59 Years | 259 (18.8%) | 164 (13.4%) |
| 60 to 64 Years | 58 (4.2%) | 85 (6.9%) |
| 65 to 69 Years | 163 (11.8%) | 432 (35.3%) |
| 70 to 74 Years | 220 (16.0%) | 131 (10.7%) |
| 75 to 79 Years | 28 (2.0%) | 41 (3.4%) |
| 80 to 84 Years | 0 (0.0%) | 0 (0.0%) |
| 85 Years and over | 28 (2.0%) | 18 (1.5%) |
| Total | 1,377 (100.0%) | 1,225 (100.0%) |
Families and Households in Weldon
Median Family Size in Weldon
The median family size in Weldon is 2.33 persons per family, with single female/mother families (245 | 28.1%) accounting for the largest median family size of 2.64 persons per family. On the other hand, married-couple families (358 | 41.0%) represent the smallest median family size with 2.14 persons per family.
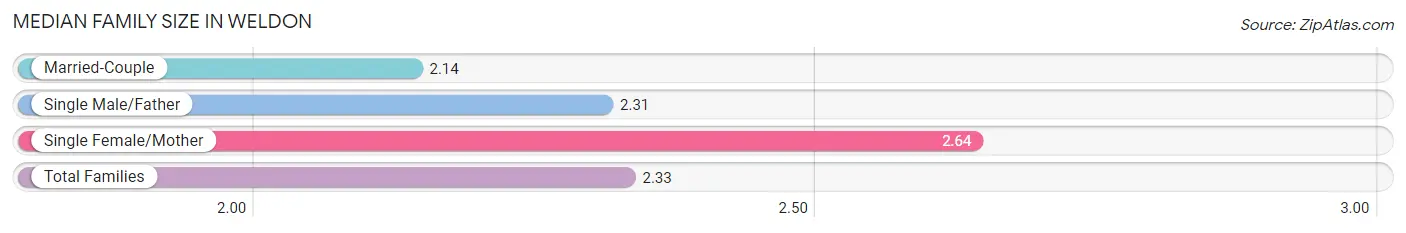
| Family Type | # Families | Family Size |
| Married-Couple | 358 (41.0%) | 2.14 |
| Single Male/Father | 270 (30.9%) | 2.31 |
| Single Female/Mother | 245 (28.1%) | 2.64 |
| Total Families | 873 (100.0%) | 2.33 |
Median Household Size in Weldon
The median household size in Weldon is 1.99 persons per household, with single female/mother households (245 | 18.8%) accounting for the largest median household size of 2.8 persons per household. non-family households (432 | 33.1%) represent the smallest median household size with 1.22 persons per household.
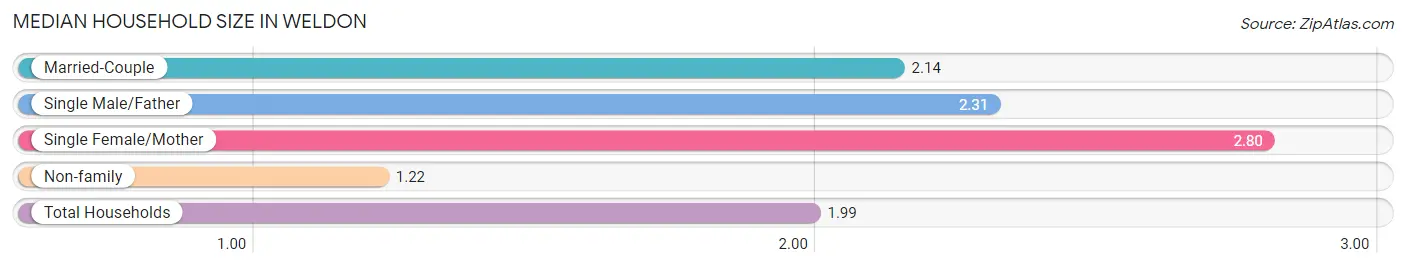
| Household Type | # Households | Household Size |
| Married-Couple | 358 (27.4%) | 2.14 |
| Single Male/Father | 270 (20.7%) | 2.31 |
| Single Female/Mother | 245 (18.8%) | 2.80 |
| Non-family | 432 (33.1%) | 1.22 |
| Total Households | 1,305 (100.0%) | 1.99 |
Household Size by Marriage Status in Weldon
Out of a total of 1,305 households in Weldon, 873 (66.9%) are family households, while 432 (33.1%) are nonfamily households. The most numerous type of family households are 2-person households, comprising 768, and the most common type of nonfamily households are 1-person households, comprising 336.
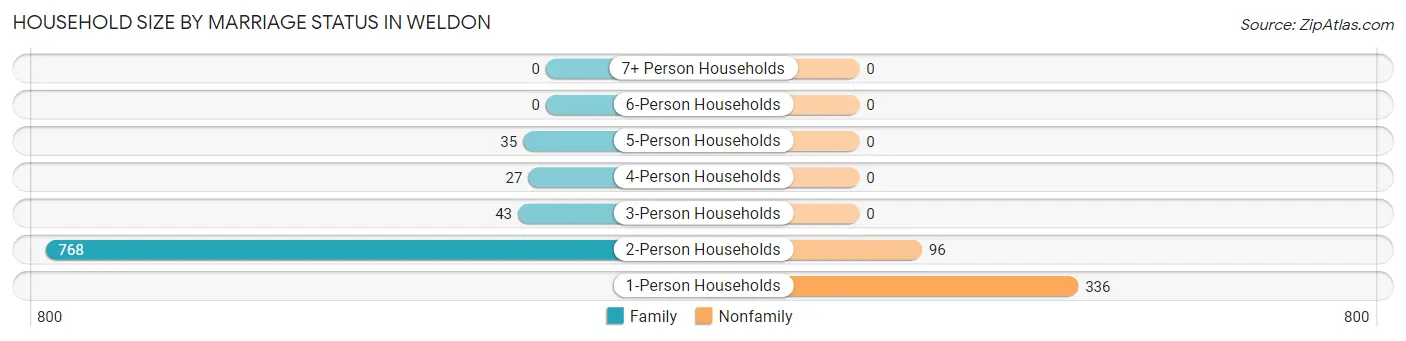
| Household Size | Family Households | Nonfamily Households |
| 1-Person Households | - | 336 (25.8%) |
| 2-Person Households | 768 (58.9%) | 96 (7.4%) |
| 3-Person Households | 43 (3.3%) | 0 (0.0%) |
| 4-Person Households | 27 (2.1%) | 0 (0.0%) |
| 5-Person Households | 35 (2.7%) | 0 (0.0%) |
| 6-Person Households | 0 (0.0%) | 0 (0.0%) |
| 7+ Person Households | 0 (0.0%) | 0 (0.0%) |
| Total | 873 (66.9%) | 432 (33.1%) |
Female Fertility in Weldon
Fertility by Age in Weldon
Average fertility rate in Weldon is 138.0 births per 1,000 women. Women in the age bracket of 20 to 34 years have the highest fertility rate with 263.0 births per 1,000 women. Women in the age bracket of 20 to 34 years acount for 100.0% of all women with births.
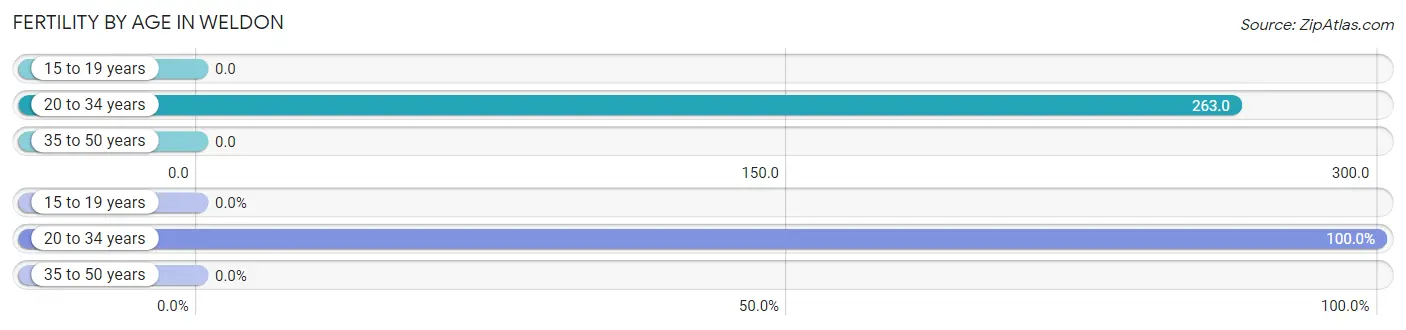
| Age Bracket | Women with Births | Births / 1,000 Women |
| 15 to 19 years | 0 (0.0%) | 0.0 |
| 20 to 34 years | 35 (100.0%) | 263.0 |
| 35 to 50 years | 0 (0.0%) | 0.0 |
| Total | 35 (100.0%) | 138.0 |
Fertility by Age by Marriage Status in Weldon
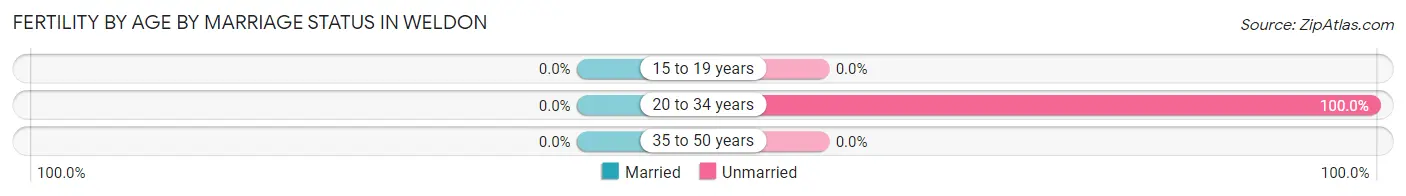
| Age Bracket | Married | Unmarried |
| 15 to 19 years | 0 (0.0%) | 0 (0.0%) |
| 20 to 34 years | 0 (0.0%) | 35 (100.0%) |
| 35 to 50 years | 0 (0.0%) | 0 (0.0%) |
| Total | 0 (0.0%) | 35 (100.0%) |
Fertility by Education in Weldon
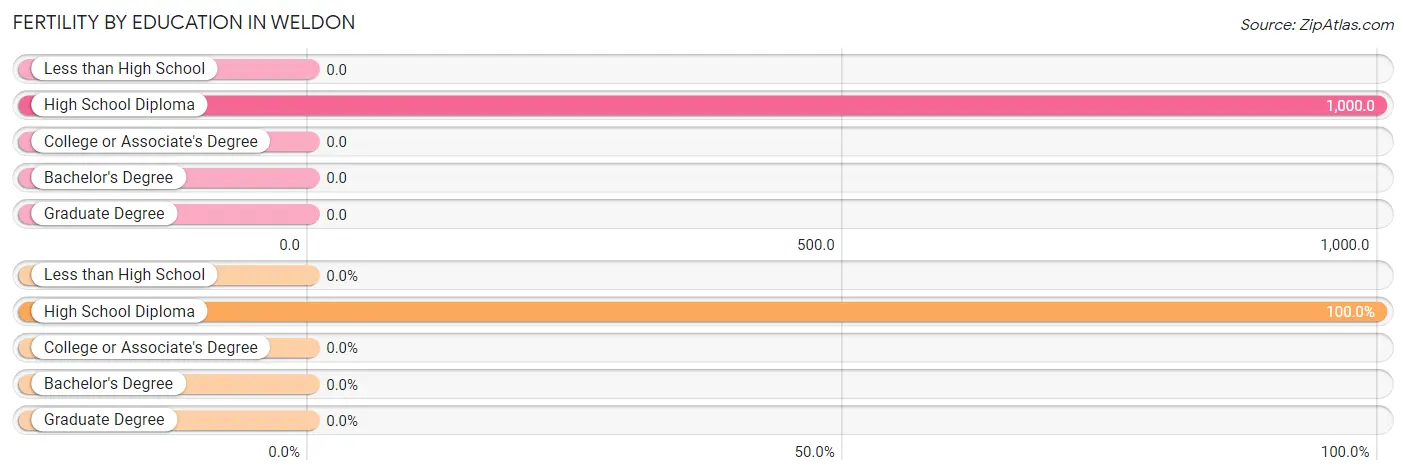
| Educational Attainment | Women with Births | Births / 1,000 Women |
| Less than High School | 0 (0.0%) | 0.0 |
| High School Diploma | 35 (100.0%) | 1,000.0 |
| College or Associate's Degree | 0 (0.0%) | 0.0 |
| Bachelor's Degree | 0 (0.0%) | 0.0 |
| Graduate Degree | 0 (0.0%) | 0.0 |
| Total | 35 (100.0%) | 138.0 |
Fertility by Education by Marriage Status in Weldon
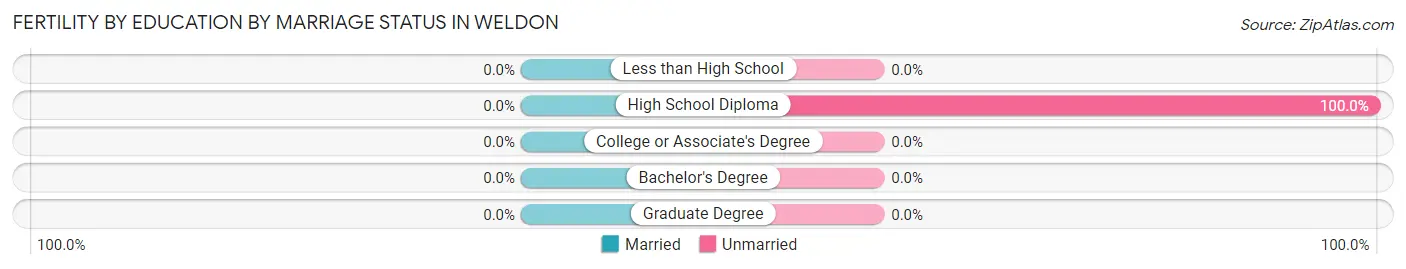
| Educational Attainment | Married | Unmarried |
| Less than High School | 0 (0.0%) | 0 (0.0%) |
| High School Diploma | 0 (0.0%) | 35 (100.0%) |
| College or Associate's Degree | 0 (0.0%) | 0 (0.0%) |
| Bachelor's Degree | 0 (0.0%) | 0 (0.0%) |
| Graduate Degree | 0 (0.0%) | 0 (0.0%) |
| Total | 0 (0.0%) | 35 (100.0%) |
Employment Characteristics in Weldon
Employment by Class of Employer in Weldon
Among the 769 employed individuals in Weldon, private company employees (378 | 49.1%), state government employees (187 | 24.3%), and not-for-profit organizations (89 | 11.6%) make up the most common classes of employment.
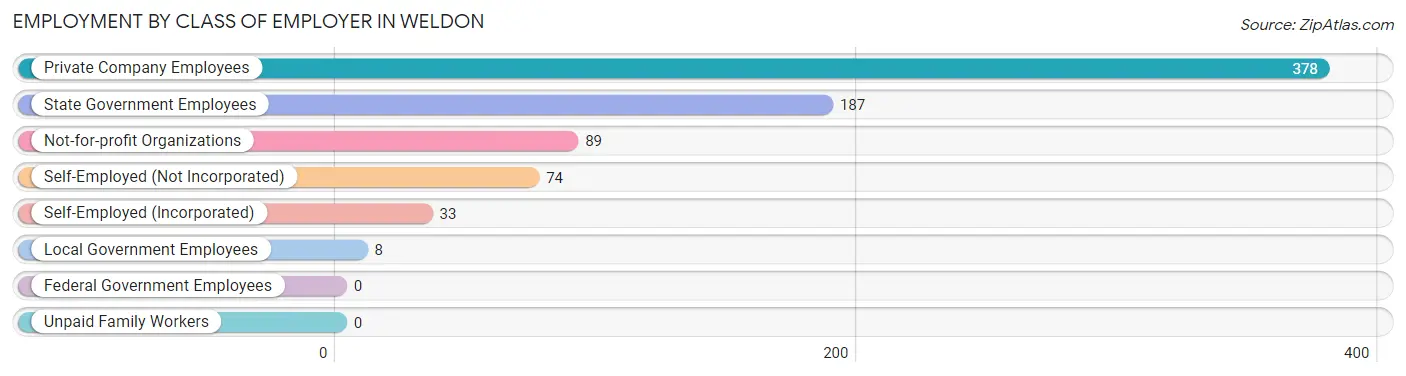
| Employer Class | # Employees | % Employees |
| Private Company Employees | 378 | 49.1% |
| Self-Employed (Incorporated) | 33 | 4.3% |
| Self-Employed (Not Incorporated) | 74 | 9.6% |
| Not-for-profit Organizations | 89 | 11.6% |
| Local Government Employees | 8 | 1.0% |
| State Government Employees | 187 | 24.3% |
| Federal Government Employees | 0 | 0.0% |
| Unpaid Family Workers | 0 | 0.0% |
| Total | 769 | 100.0% |
Employment Status by Age in Weldon
According to the labor force statistics for Weldon, out of the total population over 16 years of age (2,214), 37.8% or 837 individuals are in the labor force, with 6.1% or 51 of them unemployed. The age group with the highest labor force participation rate is 16 to 19 years, with 100.0% or 19 individuals in the labor force. Within the labor force, the 16 to 19 years age range has the highest percentage of unemployed individuals, with 100.0% or 19 of them being unemployed.
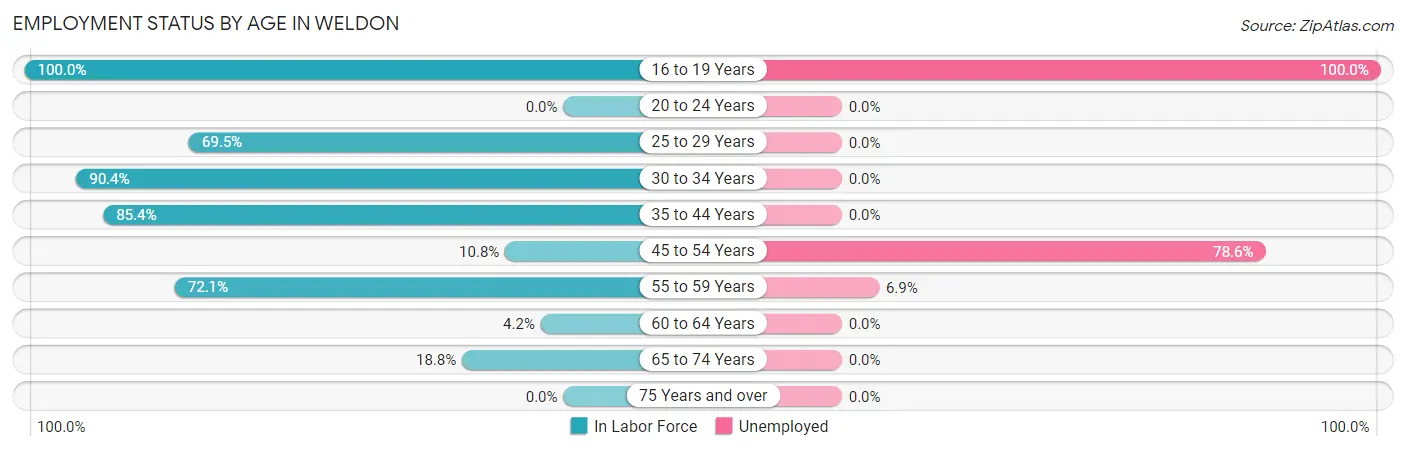
| Age Bracket | In Labor Force | Unemployed |
| 16 to 19 Years | 19 (100.0%) | 19 (100.0%) |
| 20 to 24 Years | 0 (0.0%) | 0 (0.0%) |
| 25 to 29 Years | 41 (69.5%) | 0 (0.0%) |
| 30 to 34 Years | 169 (90.4%) | 0 (0.0%) |
| 35 to 44 Years | 105 (85.4%) | 0 (0.0%) |
| 45 to 54 Years | 14 (10.8%) | 11 (78.6%) |
| 55 to 59 Years | 305 (72.1%) | 21 (6.9%) |
| 60 to 64 Years | 6 (4.2%) | 0 (0.0%) |
| 65 to 74 Years | 178 (18.8%) | 0 (0.0%) |
| 75 Years and over | 0 (0.0%) | 0 (0.0%) |
| Total | 837 (37.8%) | 51 (6.1%) |
Employment Status by Educational Attainment in Weldon
According to labor force statistics for Weldon, 60.1% of individuals (640) out of the total population between 25 and 64 years of age (1,065) are in the labor force, with 5.0% or 32 of them being unemployed. The group with the highest labor force participation rate are those with the educational attainment of bachelor's degree or higher, with 81.8% or 130 individuals in the labor force. Within the labor force, individuals with less than high school education have the highest percentage of unemployment, with 31.8% or 21 of them being unemployed.
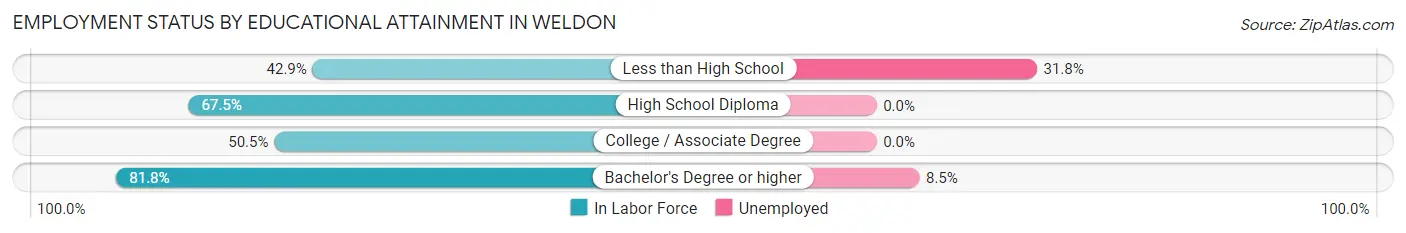
| Educational Attainment | In Labor Force | Unemployed |
| Less than High School | 66 (42.9%) | 49 (31.8%) |
| High School Diploma | 255 (67.5%) | 0 (0.0%) |
| College / Associate Degree | 189 (50.5%) | 0 (0.0%) |
| Bachelor's Degree or higher | 130 (81.8%) | 14 (8.5%) |
| Total | 640 (60.1%) | 53 (5.0%) |
Employment Occupations by Sex in Weldon
Management, Business, Science and Arts Occupations
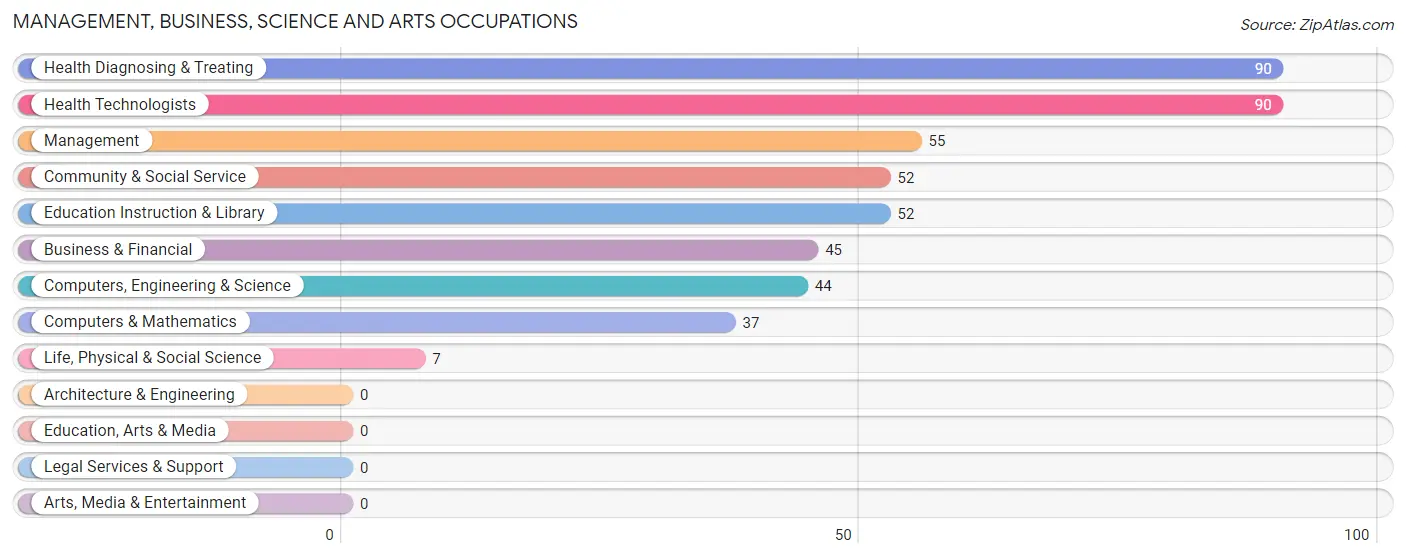
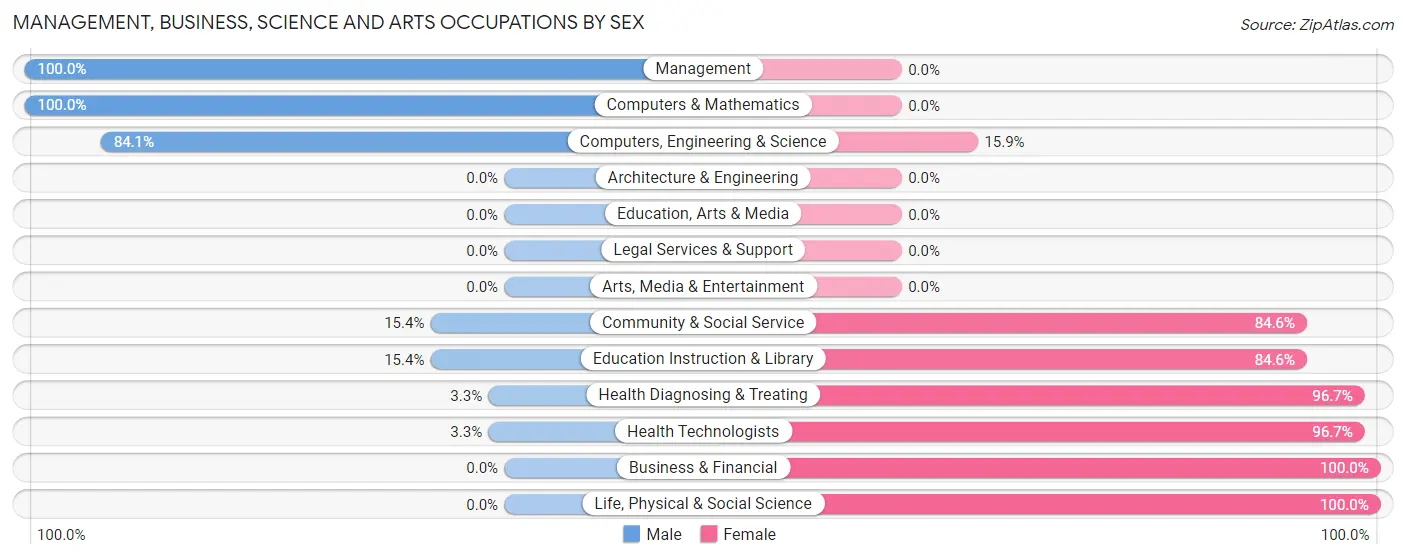
The most common Management, Business, Science and Arts occupations in Weldon are Health Diagnosing & Treating (90 | 11.5%), Health Technologists (90 | 11.5%), Management (55 | 7.0%), Community & Social Service (52 | 6.6%), and Education Instruction & Library (52 | 6.6%).
Management, Business, Science and Arts Occupations by Sex
Within the Management, Business, Science and Arts occupations in Weldon, the most male-oriented occupations are Management (100.0%), Computers & Mathematics (100.0%), and Computers, Engineering & Science (84.1%), while the most female-oriented occupations are Business & Financial (100.0%), Life, Physical & Social Science (100.0%), and Health Diagnosing & Treating (96.7%).
| Occupation | Male | Female |
| Management | 55 (100.0%) | 0 (0.0%) |
| Business & Financial | 0 (0.0%) | 45 (100.0%) |
| Computers, Engineering & Science | 37 (84.1%) | 7 (15.9%) |
| Computers & Mathematics | 37 (100.0%) | 0 (0.0%) |
| Architecture & Engineering | 0 (0.0%) | 0 (0.0%) |
| Life, Physical & Social Science | 0 (0.0%) | 7 (100.0%) |
| Community & Social Service | 8 (15.4%) | 44 (84.6%) |
| Education, Arts & Media | 0 (0.0%) | 0 (0.0%) |
| Legal Services & Support | 0 (0.0%) | 0 (0.0%) |
| Education Instruction & Library | 8 (15.4%) | 44 (84.6%) |
| Arts, Media & Entertainment | 0 (0.0%) | 0 (0.0%) |
| Health Diagnosing & Treating | 3 (3.3%) | 87 (96.7%) |
| Health Technologists | 3 (3.3%) | 87 (96.7%) |
| Total (Category) | 103 (36.0%) | 183 (64.0%) |
| Total (Overall) | 388 (49.4%) | 398 (50.6%) |
Services Occupations
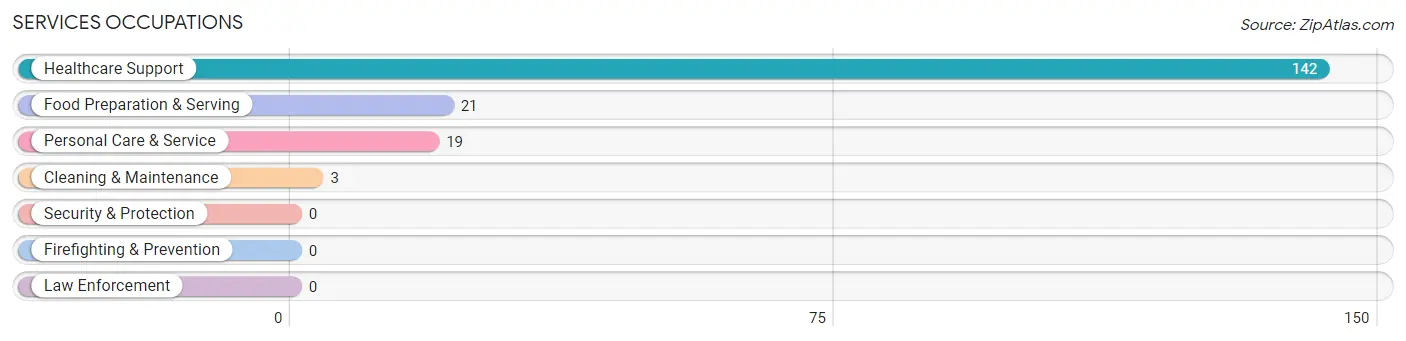
The most common Services occupations in Weldon are Healthcare Support (142 | 18.1%), Food Preparation & Serving (21 | 2.7%), Personal Care & Service (19 | 2.4%), and Cleaning & Maintenance (3 | 0.4%).
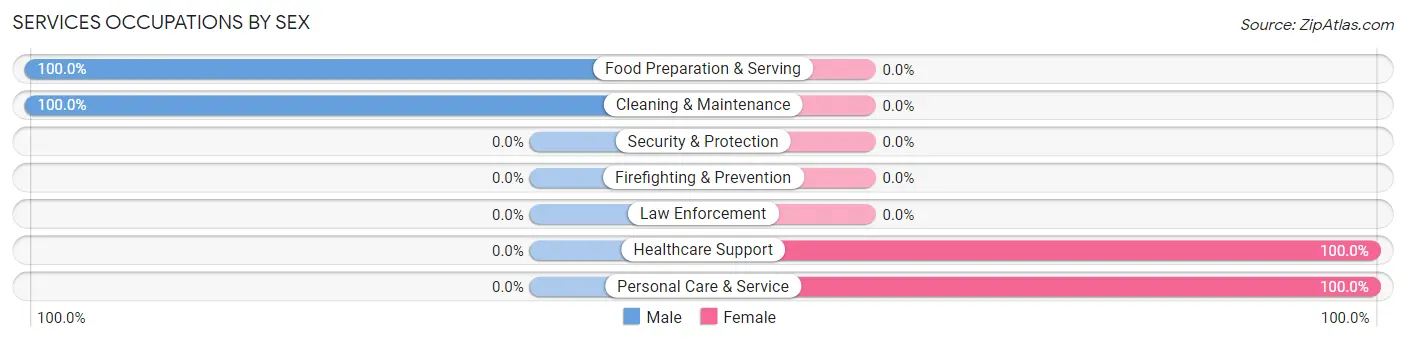
Services Occupations by Sex
Within the Services occupations in Weldon, the most male-oriented occupations are Food Preparation & Serving (100.0%), and Cleaning & Maintenance (100.0%), while the most female-oriented occupations are Healthcare Support (100.0%), and Personal Care & Service (100.0%).
| Occupation | Male | Female |
| Healthcare Support | 0 (0.0%) | 142 (100.0%) |
| Security & Protection | 0 (0.0%) | 0 (0.0%) |
| Firefighting & Prevention | 0 (0.0%) | 0 (0.0%) |
| Law Enforcement | 0 (0.0%) | 0 (0.0%) |
| Food Preparation & Serving | 21 (100.0%) | 0 (0.0%) |
| Cleaning & Maintenance | 3 (100.0%) | 0 (0.0%) |
| Personal Care & Service | 0 (0.0%) | 19 (100.0%) |
| Total (Category) | 24 (13.0%) | 161 (87.0%) |
| Total (Overall) | 388 (49.4%) | 398 (50.6%) |
Sales and Office Occupations
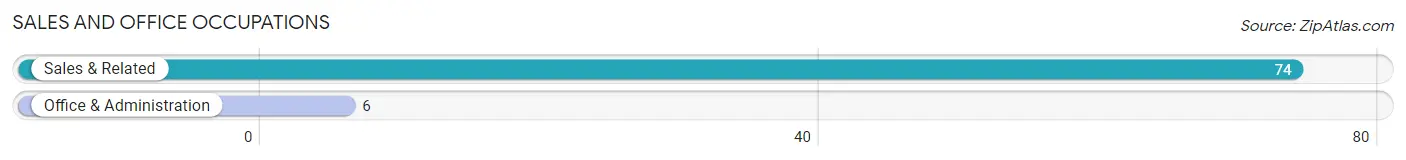
The most common Sales and Office occupations in Weldon are Sales & Related (74 | 9.4%), and Office & Administration (6 | 0.8%).
Sales and Office Occupations by Sex
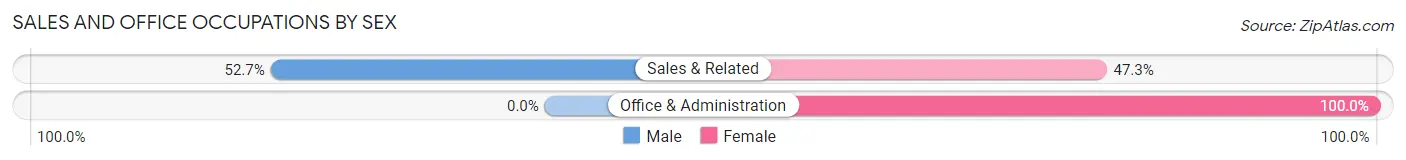
| Occupation | Male | Female |
| Sales & Related | 39 (52.7%) | 35 (47.3%) |
| Office & Administration | 0 (0.0%) | 6 (100.0%) |
| Total (Category) | 39 (48.7%) | 41 (51.2%) |
| Total (Overall) | 388 (49.4%) | 398 (50.6%) |
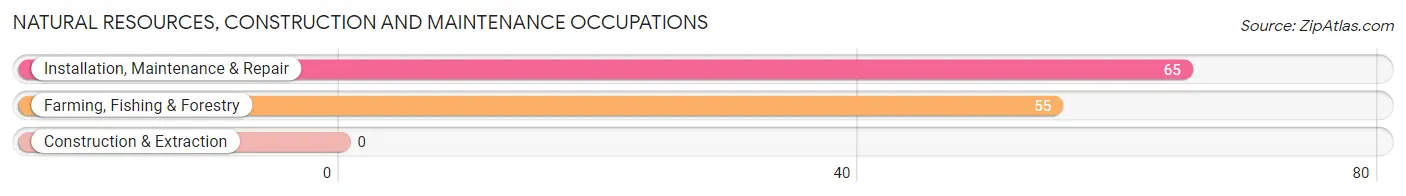
Natural Resources, Construction and Maintenance Occupations
The most common Natural Resources, Construction and Maintenance occupations in Weldon are Installation, Maintenance & Repair (65 | 8.3%), and Farming, Fishing & Forestry (55 | 7.0%).
Natural Resources, Construction and Maintenance Occupations by Sex
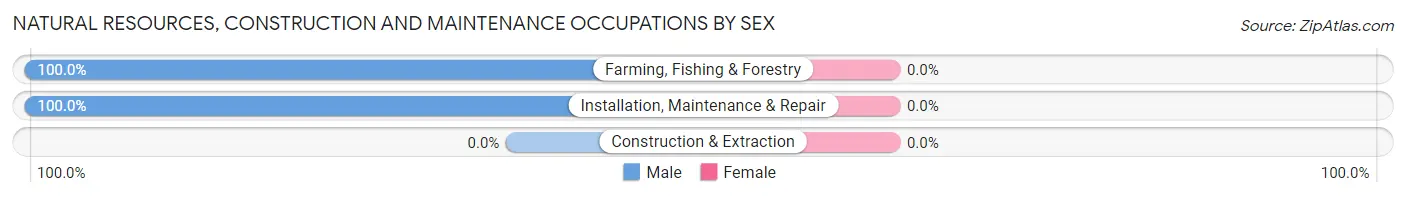
| Occupation | Male | Female |
| Farming, Fishing & Forestry | 55 (100.0%) | 0 (0.0%) |
| Construction & Extraction | 0 (0.0%) | 0 (0.0%) |
| Installation, Maintenance & Repair | 65 (100.0%) | 0 (0.0%) |
| Total (Category) | 120 (100.0%) | 0 (0.0%) |
| Total (Overall) | 388 (49.4%) | 398 (50.6%) |
Production, Transportation and Moving Occupations
The most common Production, Transportation and Moving occupations in Weldon are Production (46 | 5.9%), Transportation (45 | 5.7%), and Material Moving (24 | 3.0%).
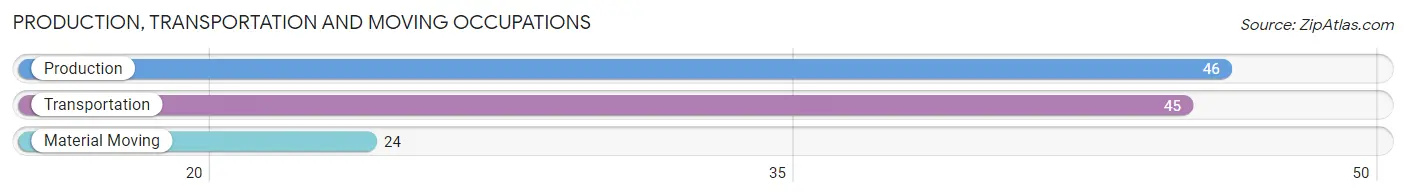
Production, Transportation and Moving Occupations by Sex
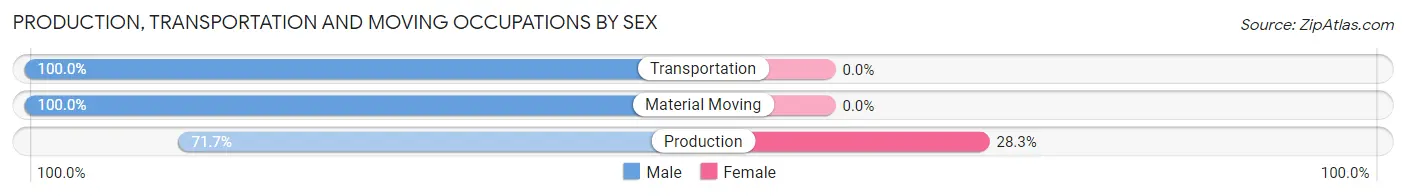
| Occupation | Male | Female |
| Production | 33 (71.7%) | 13 (28.3%) |
| Transportation | 45 (100.0%) | 0 (0.0%) |
| Material Moving | 24 (100.0%) | 0 (0.0%) |
| Total (Category) | 102 (88.7%) | 13 (11.3%) |
| Total (Overall) | 388 (49.4%) | 398 (50.6%) |
Employment Industries by Sex in Weldon
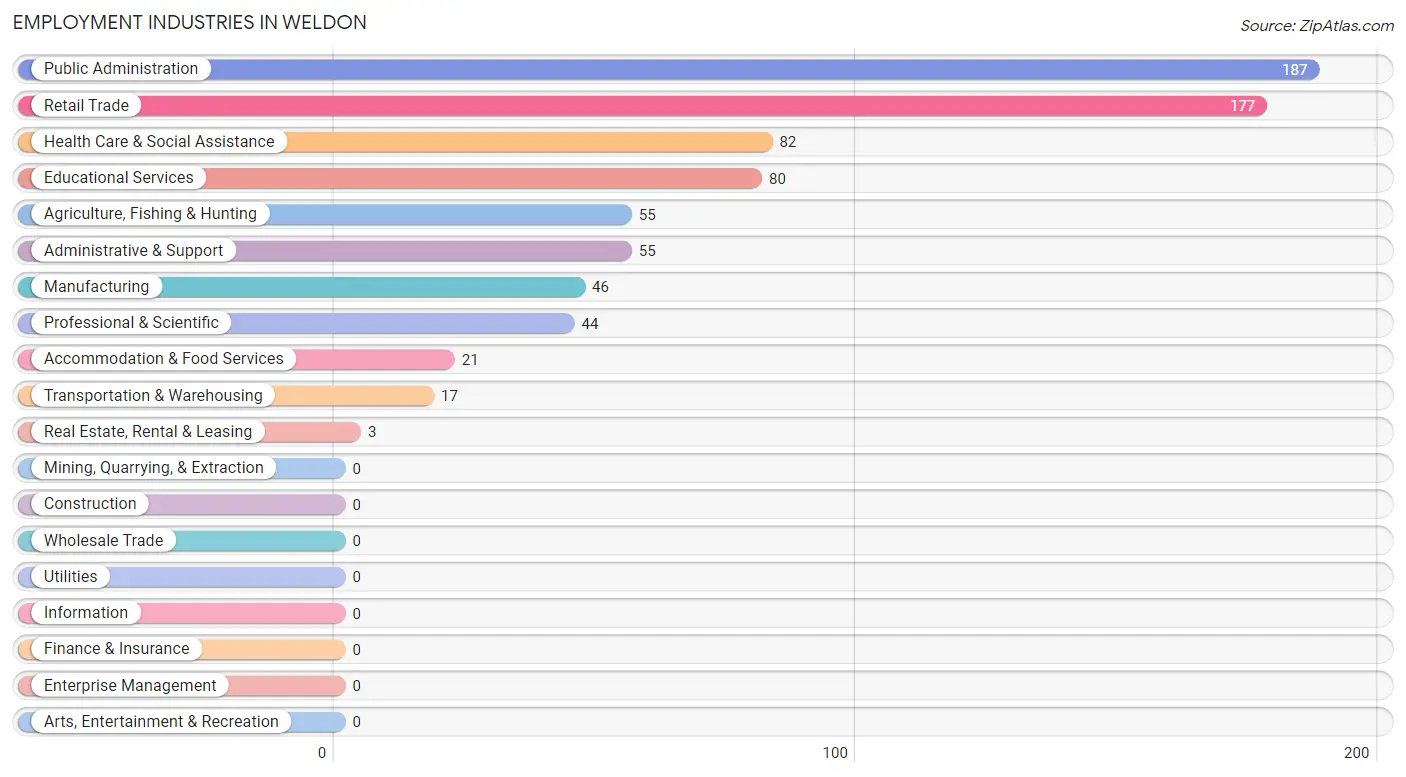
Employment Industries in Weldon
The major employment industries in Weldon include Public Administration (187 | 23.8%), Retail Trade (177 | 22.5%), Health Care & Social Assistance (82 | 10.4%), Educational Services (80 | 10.2%), and Agriculture, Fishing & Hunting (55 | 7.0%).
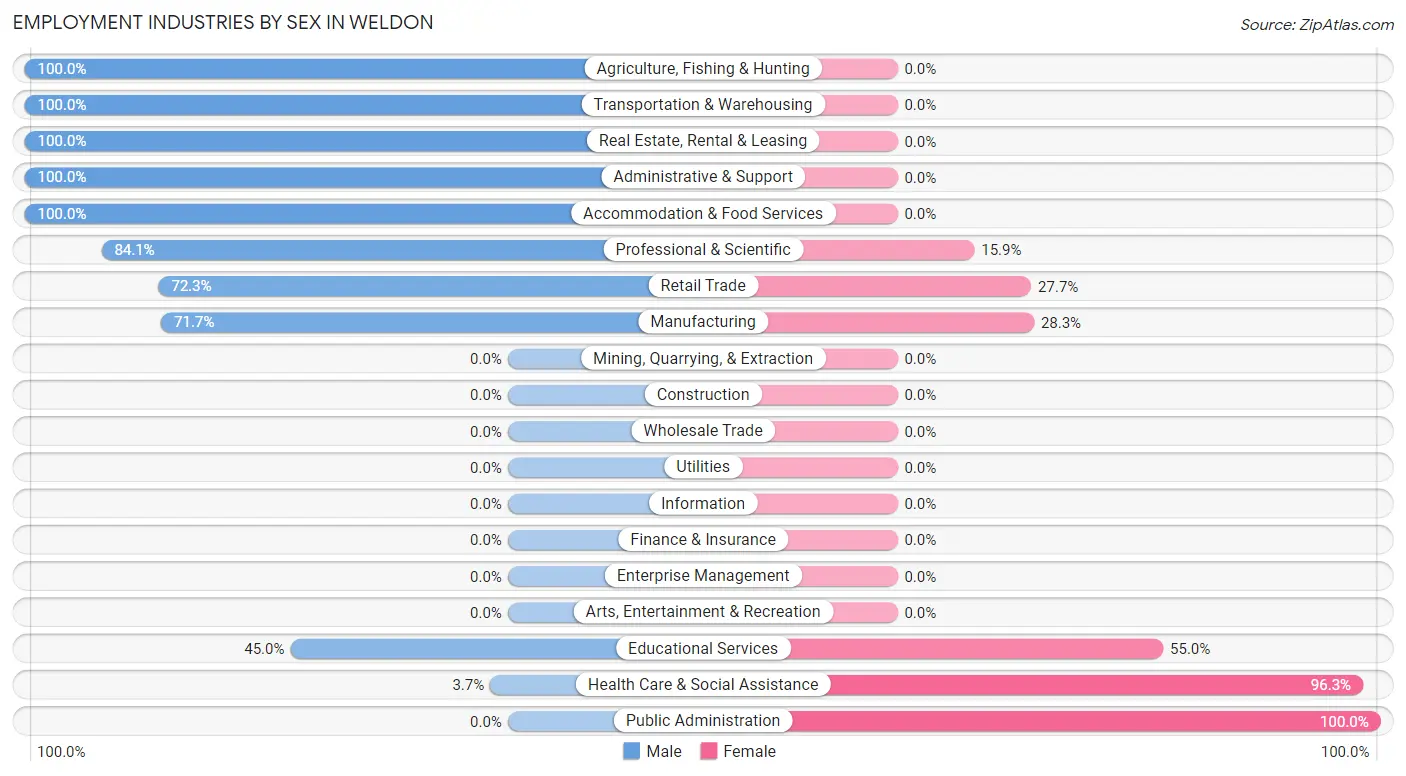
Employment Industries by Sex in Weldon
The Weldon industries that see more men than women are Agriculture, Fishing & Hunting (100.0%), Transportation & Warehousing (100.0%), and Real Estate, Rental & Leasing (100.0%), whereas the industries that tend to have a higher number of women are Public Administration (100.0%), Health Care & Social Assistance (96.3%), and Educational Services (55.0%).
| Industry | Male | Female |
| Agriculture, Fishing & Hunting | 55 (100.0%) | 0 (0.0%) |
| Mining, Quarrying, & Extraction | 0 (0.0%) | 0 (0.0%) |
| Construction | 0 (0.0%) | 0 (0.0%) |
| Manufacturing | 33 (71.7%) | 13 (28.3%) |
| Wholesale Trade | 0 (0.0%) | 0 (0.0%) |
| Retail Trade | 128 (72.3%) | 49 (27.7%) |
| Transportation & Warehousing | 17 (100.0%) | 0 (0.0%) |
| Utilities | 0 (0.0%) | 0 (0.0%) |
| Information | 0 (0.0%) | 0 (0.0%) |
| Finance & Insurance | 0 (0.0%) | 0 (0.0%) |
| Real Estate, Rental & Leasing | 3 (100.0%) | 0 (0.0%) |
| Professional & Scientific | 37 (84.1%) | 7 (15.9%) |
| Enterprise Management | 0 (0.0%) | 0 (0.0%) |
| Administrative & Support | 55 (100.0%) | 0 (0.0%) |
| Educational Services | 36 (45.0%) | 44 (55.0%) |
| Health Care & Social Assistance | 3 (3.7%) | 79 (96.3%) |
| Arts, Entertainment & Recreation | 0 (0.0%) | 0 (0.0%) |
| Accommodation & Food Services | 21 (100.0%) | 0 (0.0%) |
| Public Administration | 0 (0.0%) | 187 (100.0%) |
| Total | 388 (49.4%) | 398 (50.6%) |
Education in Weldon
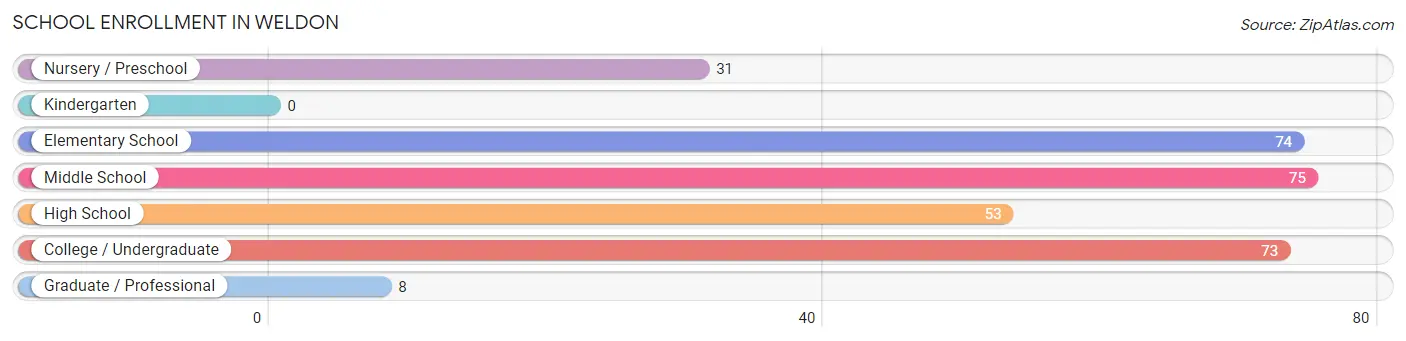
School Enrollment in Weldon
The most common levels of schooling among the 314 students in Weldon are middle school (75 | 23.9%), elementary school (74 | 23.6%), and college / undergraduate (73 | 23.3%).
| School Level | # Students | % Students |
| Nursery / Preschool | 31 | 9.9% |
| Kindergarten | 0 | 0.0% |
| Elementary School | 74 | 23.6% |
| Middle School | 75 | 23.9% |
| High School | 53 | 16.9% |
| College / Undergraduate | 73 | 23.3% |
| Graduate / Professional | 8 | 2.5% |
| Total | 314 | 100.0% |
School Enrollment by Age by Funding Source in Weldon
Out of a total of 314 students who are enrolled in schools in Weldon, 81 (25.8%) attend a private institution, while the remaining 233 (74.2%) are enrolled in public schools. The age group of 35 years and over has the highest likelihood of being enrolled in private schools, with 81 (100.0% in the age bracket) enrolled. Conversely, the age group of 3 to 4 year olds has the lowest likelihood of being enrolled in a private school, with 31 (100.0% in the age bracket) attending a public institution.
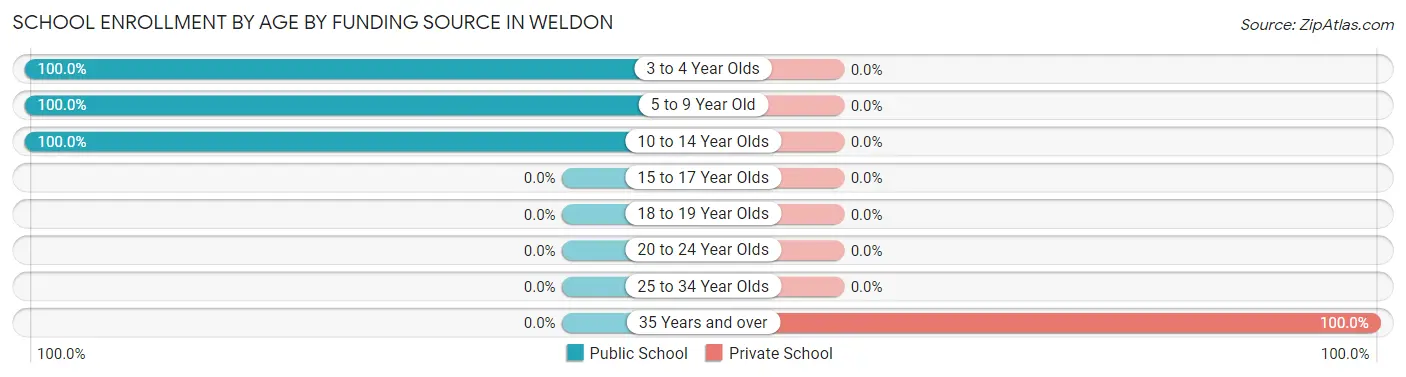
| Age Bracket | Public School | Private School |
| 3 to 4 Year Olds | 31 (100.0%) | 0 (0.0%) |
| 5 to 9 Year Old | 55 (100.0%) | 0 (0.0%) |
| 10 to 14 Year Olds | 147 (100.0%) | 0 (0.0%) |
| 15 to 17 Year Olds | 0 (0.0%) | 0 (0.0%) |
| 18 to 19 Year Olds | 0 (0.0%) | 0 (0.0%) |
| 20 to 24 Year Olds | 0 (0.0%) | 0 (0.0%) |
| 25 to 34 Year Olds | 0 (0.0%) | 0 (0.0%) |
| 35 Years and over | 0 (0.0%) | 81 (100.0%) |
| Total | 233 (74.2%) | 81 (25.8%) |
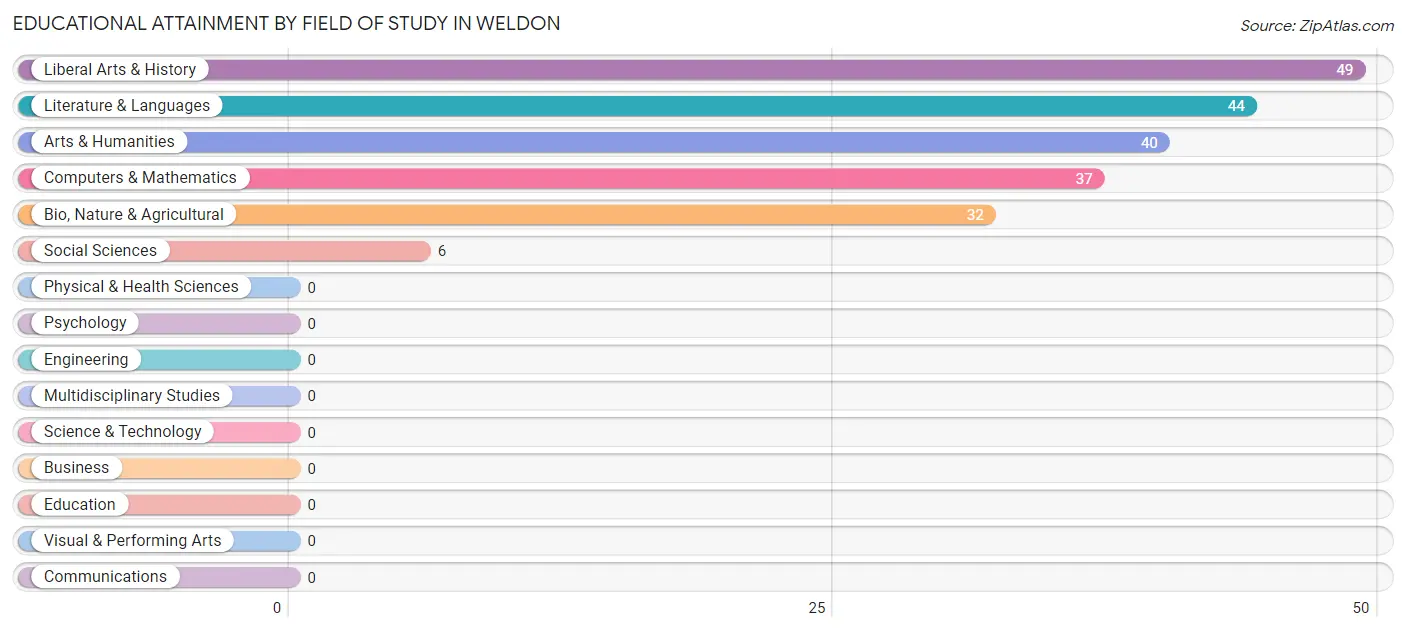
Educational Attainment by Field of Study in Weldon
Liberal arts & history (49 | 23.6%), literature & languages (44 | 21.1%), arts & humanities (40 | 19.2%), computers & mathematics (37 | 17.8%), and bio, nature & agricultural (32 | 15.4%) are the most common fields of study among 208 individuals in Weldon who have obtained a bachelor's degree or higher.
| Field of Study | # Graduates | % Graduates |
| Computers & Mathematics | 37 | 17.8% |
| Bio, Nature & Agricultural | 32 | 15.4% |
| Physical & Health Sciences | 0 | 0.0% |
| Psychology | 0 | 0.0% |
| Social Sciences | 6 | 2.9% |
| Engineering | 0 | 0.0% |
| Multidisciplinary Studies | 0 | 0.0% |
| Science & Technology | 0 | 0.0% |
| Business | 0 | 0.0% |
| Education | 0 | 0.0% |
| Literature & Languages | 44 | 21.1% |
| Liberal Arts & History | 49 | 23.6% |
| Visual & Performing Arts | 0 | 0.0% |
| Communications | 0 | 0.0% |
| Arts & Humanities | 40 | 19.2% |
| Total | 208 | 100.0% |
Transportation & Commute in Weldon
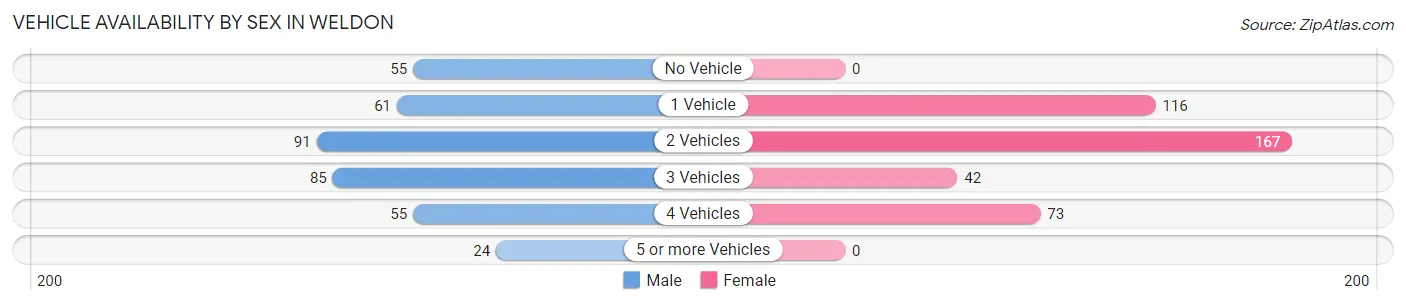
Vehicle Availability by Sex in Weldon
The most prevalent vehicle ownership categories in Weldon are males with 2 vehicles (91, accounting for 24.5%) and females with 2 vehicles (167, making up 22.9%).
| Vehicles Available | Male | Female |
| No Vehicle | 55 (14.8%) | 0 (0.0%) |
| 1 Vehicle | 61 (16.4%) | 116 (29.1%) |
| 2 Vehicles | 91 (24.5%) | 167 (42.0%) |
| 3 Vehicles | 85 (22.9%) | 42 (10.5%) |
| 4 Vehicles | 55 (14.8%) | 73 (18.3%) |
| 5 or more Vehicles | 24 (6.5%) | 0 (0.0%) |
| Total | 371 (100.0%) | 398 (100.0%) |
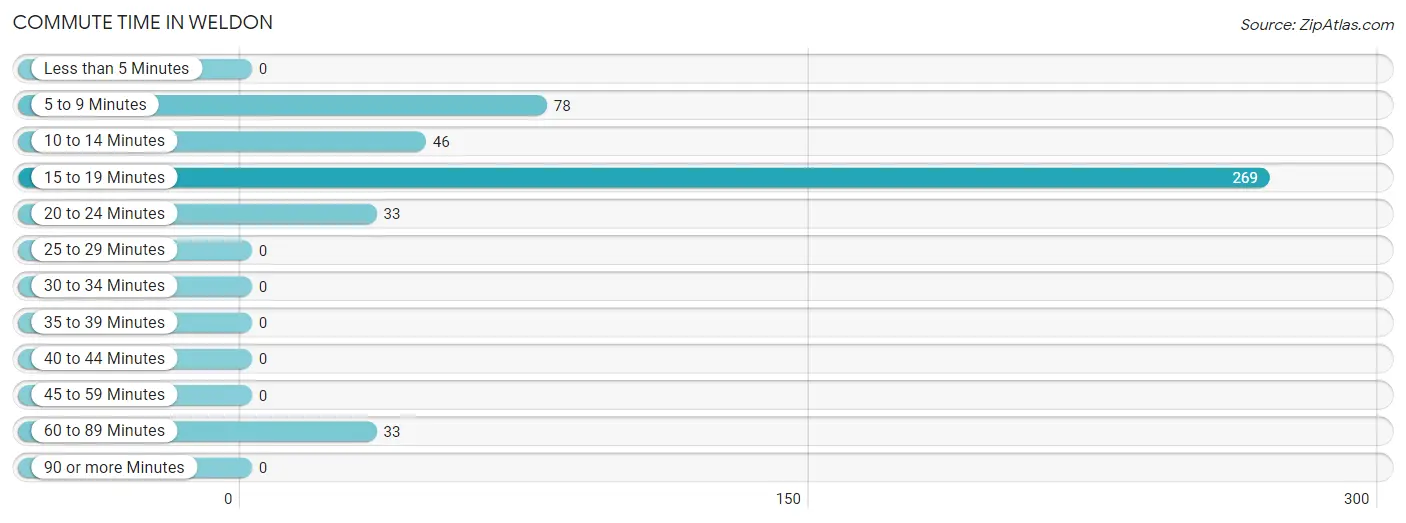
Commute Time in Weldon
The most frequently occuring commute durations in Weldon are 15 to 19 minutes (269 commuters, 58.6%), 5 to 9 minutes (78 commuters, 17.0%), and 10 to 14 minutes (46 commuters, 10.0%).
| Commute Time | # Commuters | % Commuters |
| Less than 5 Minutes | 0 | 0.0% |
| 5 to 9 Minutes | 78 | 17.0% |
| 10 to 14 Minutes | 46 | 10.0% |
| 15 to 19 Minutes | 269 | 58.6% |
| 20 to 24 Minutes | 33 | 7.2% |
| 25 to 29 Minutes | 0 | 0.0% |
| 30 to 34 Minutes | 0 | 0.0% |
| 35 to 39 Minutes | 0 | 0.0% |
| 40 to 44 Minutes | 0 | 0.0% |
| 45 to 59 Minutes | 0 | 0.0% |
| 60 to 89 Minutes | 33 | 7.2% |
| 90 or more Minutes | 0 | 0.0% |
Commute Time by Sex in Weldon
The most common commute times in Weldon are 15 to 19 minutes (196 commuters, 58.7%) for males and 15 to 19 minutes (73 commuters, 58.4%) for females.
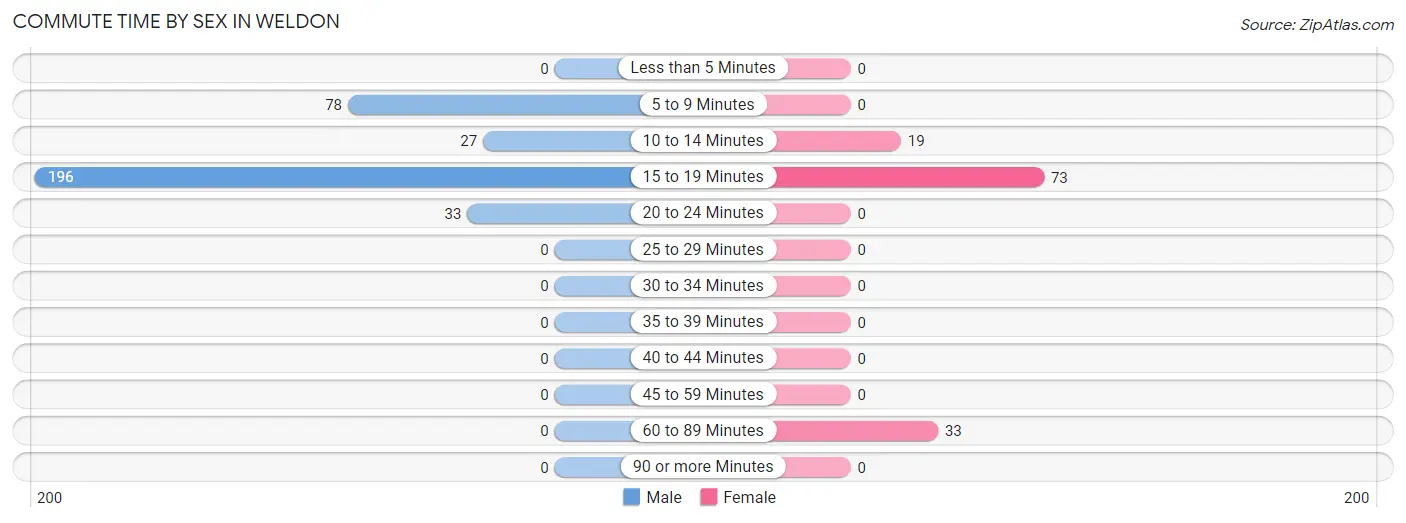
| Commute Time | Male | Female |
| Less than 5 Minutes | 0 (0.0%) | 0 (0.0%) |
| 5 to 9 Minutes | 78 (23.4%) | 0 (0.0%) |
| 10 to 14 Minutes | 27 (8.1%) | 19 (15.2%) |
| 15 to 19 Minutes | 196 (58.7%) | 73 (58.4%) |
| 20 to 24 Minutes | 33 (9.9%) | 0 (0.0%) |
| 25 to 29 Minutes | 0 (0.0%) | 0 (0.0%) |
| 30 to 34 Minutes | 0 (0.0%) | 0 (0.0%) |
| 35 to 39 Minutes | 0 (0.0%) | 0 (0.0%) |
| 40 to 44 Minutes | 0 (0.0%) | 0 (0.0%) |
| 45 to 59 Minutes | 0 (0.0%) | 0 (0.0%) |
| 60 to 89 Minutes | 0 (0.0%) | 33 (26.4%) |
| 90 or more Minutes | 0 (0.0%) | 0 (0.0%) |
Time of Departure to Work by Sex in Weldon
The most frequent times of departure to work in Weldon are 4:00 PM to 11:59 PM (94, 28.1%) for males and 7:30 AM to 7:59 AM (86, 68.8%) for females.
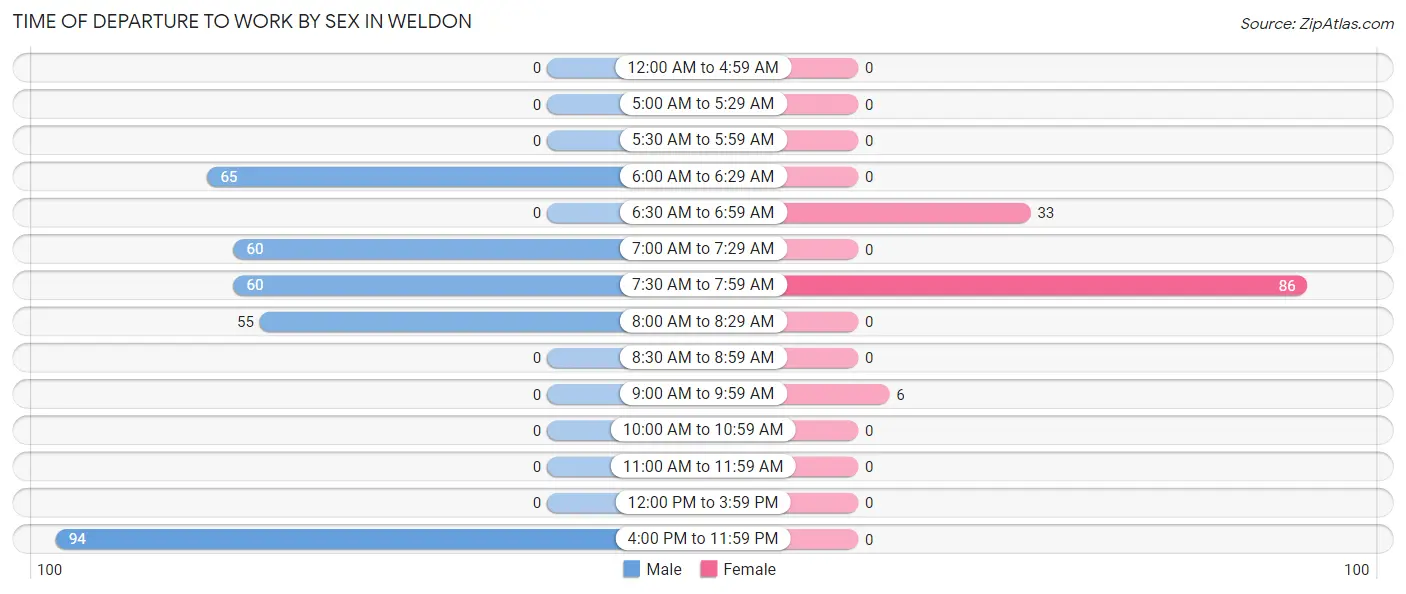
| Time of Departure | Male | Female |
| 12:00 AM to 4:59 AM | 0 (0.0%) | 0 (0.0%) |
| 5:00 AM to 5:29 AM | 0 (0.0%) | 0 (0.0%) |
| 5:30 AM to 5:59 AM | 0 (0.0%) | 0 (0.0%) |
| 6:00 AM to 6:29 AM | 65 (19.5%) | 0 (0.0%) |
| 6:30 AM to 6:59 AM | 0 (0.0%) | 33 (26.4%) |
| 7:00 AM to 7:29 AM | 60 (18.0%) | 0 (0.0%) |
| 7:30 AM to 7:59 AM | 60 (18.0%) | 86 (68.8%) |
| 8:00 AM to 8:29 AM | 55 (16.5%) | 0 (0.0%) |
| 8:30 AM to 8:59 AM | 0 (0.0%) | 0 (0.0%) |
| 9:00 AM to 9:59 AM | 0 (0.0%) | 6 (4.8%) |
| 10:00 AM to 10:59 AM | 0 (0.0%) | 0 (0.0%) |
| 11:00 AM to 11:59 AM | 0 (0.0%) | 0 (0.0%) |
| 12:00 PM to 3:59 PM | 0 (0.0%) | 0 (0.0%) |
| 4:00 PM to 11:59 PM | 94 (28.1%) | 0 (0.0%) |
| Total | 334 (100.0%) | 125 (100.0%) |
Housing Occupancy in Weldon
Occupancy by Ownership in Weldon
Of the total 1,305 dwellings in Weldon, owner-occupied units account for 1,144 (87.7%), while renter-occupied units make up 161 (12.3%).
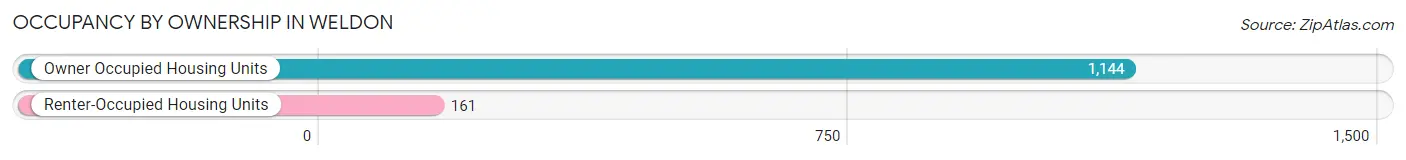
| Occupancy | # Housing Units | % Housing Units |
| Owner Occupied Housing Units | 1,144 | 87.7% |
| Renter-Occupied Housing Units | 161 | 12.3% |
| Total Occupied Housing Units | 1,305 | 100.0% |
Occupancy by Household Size in Weldon
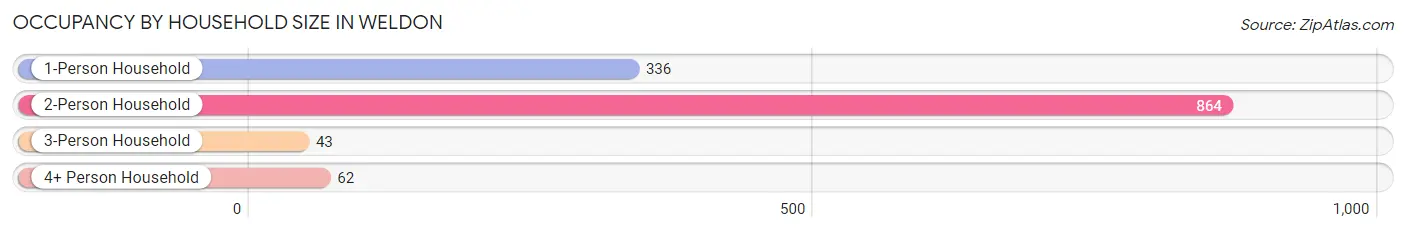
| Household Size | # Housing Units | % Housing Units |
| 1-Person Household | 336 | 25.8% |
| 2-Person Household | 864 | 66.2% |
| 3-Person Household | 43 | 3.3% |
| 4+ Person Household | 62 | 4.8% |
| Total Housing Units | 1,305 | 100.0% |
Occupancy by Ownership by Household Size in Weldon
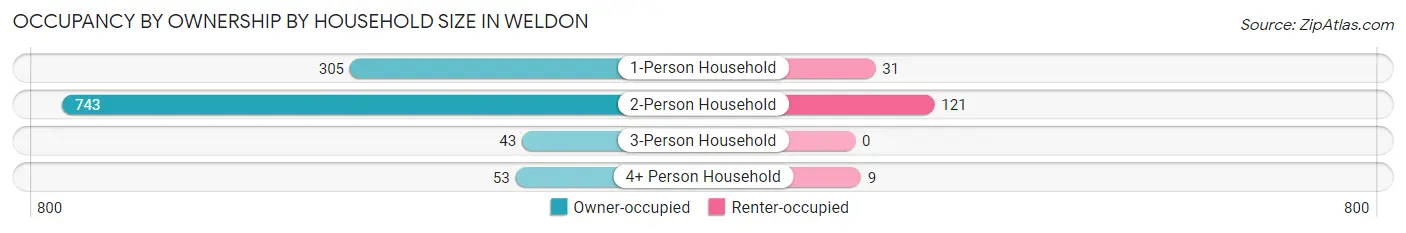
| Household Size | Owner-occupied | Renter-occupied |
| 1-Person Household | 305 (90.8%) | 31 (9.2%) |
| 2-Person Household | 743 (86.0%) | 121 (14.0%) |
| 3-Person Household | 43 (100.0%) | 0 (0.0%) |
| 4+ Person Household | 53 (85.5%) | 9 (14.5%) |
| Total Housing Units | 1,144 (87.7%) | 161 (12.3%) |
Occupancy by Educational Attainment in Weldon
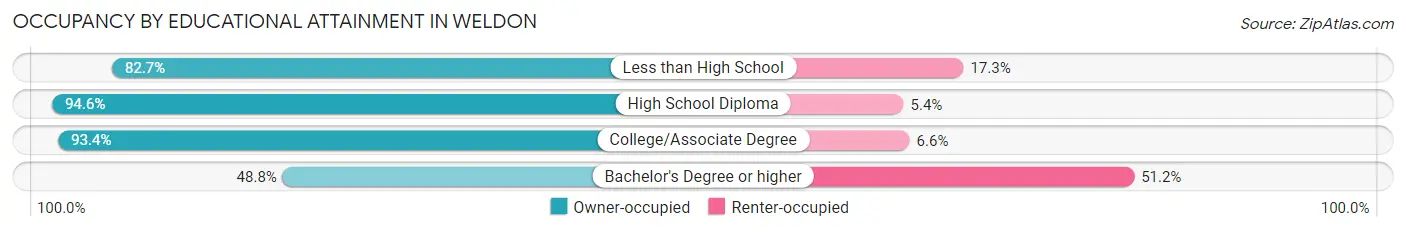
| Household Size | Owner-occupied | Renter-occupied |
| Less than High School | 172 (82.7%) | 36 (17.3%) |
| High School Diploma | 417 (94.6%) | 24 (5.4%) |
| College/Associate Degree | 492 (93.4%) | 35 (6.6%) |
| Bachelor's Degree or higher | 63 (48.8%) | 66 (51.2%) |
Occupancy by Age of Householder in Weldon
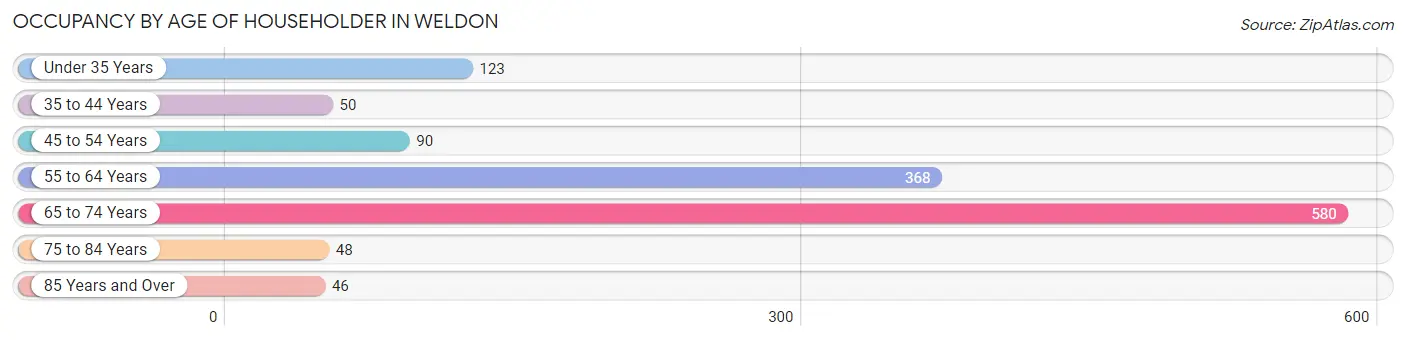
| Age Bracket | # Households | % Households |
| Under 35 Years | 123 | 9.4% |
| 35 to 44 Years | 50 | 3.8% |
| 45 to 54 Years | 90 | 6.9% |
| 55 to 64 Years | 368 | 28.2% |
| 65 to 74 Years | 580 | 44.4% |
| 75 to 84 Years | 48 | 3.7% |
| 85 Years and Over | 46 | 3.5% |
| Total | 1,305 | 100.0% |
Housing Finances in Weldon
Median Income by Occupancy in Weldon
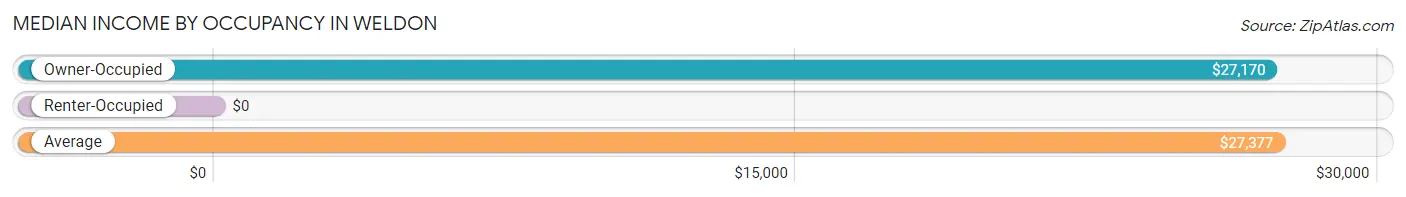
| Occupancy Type | # Households | Median Income |
| Owner-Occupied | 1,144 (87.7%) | $27,170 |
| Renter-Occupied | 161 (12.3%) | $0 |
| Average | 1,305 (100.0%) | $27,377 |
Occupancy by Householder Income Bracket in Weldon
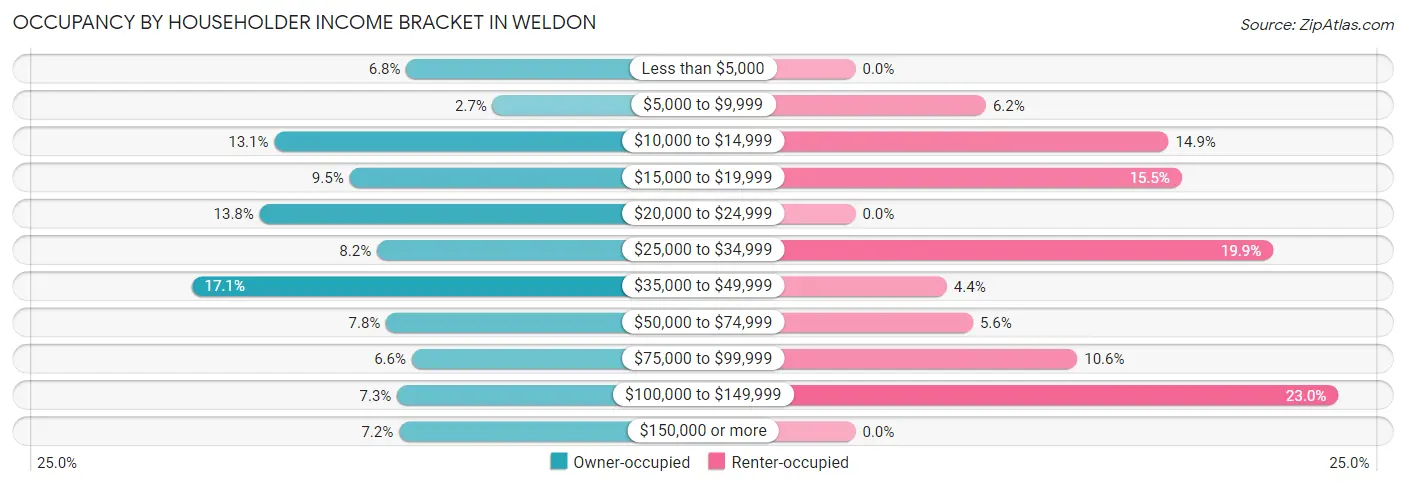
| Income Bracket | Owner-occupied | Renter-occupied |
| Less than $5,000 | 78 (6.8%) | 0 (0.0%) |
| $5,000 to $9,999 | 31 (2.7%) | 10 (6.2%) |
| $10,000 to $14,999 | 150 (13.1%) | 24 (14.9%) |
| $15,000 to $19,999 | 109 (9.5%) | 25 (15.5%) |
| $20,000 to $24,999 | 158 (13.8%) | 0 (0.0%) |
| $25,000 to $34,999 | 94 (8.2%) | 32 (19.9%) |
| $35,000 to $49,999 | 195 (17.1%) | 7 (4.3%) |
| $50,000 to $74,999 | 89 (7.8%) | 9 (5.6%) |
| $75,000 to $99,999 | 75 (6.6%) | 17 (10.6%) |
| $100,000 to $149,999 | 83 (7.3%) | 37 (23.0%) |
| $150,000 or more | 82 (7.2%) | 0 (0.0%) |
| Total | 1,144 (100.0%) | 161 (100.0%) |
Monthly Housing Cost Tiers in Weldon
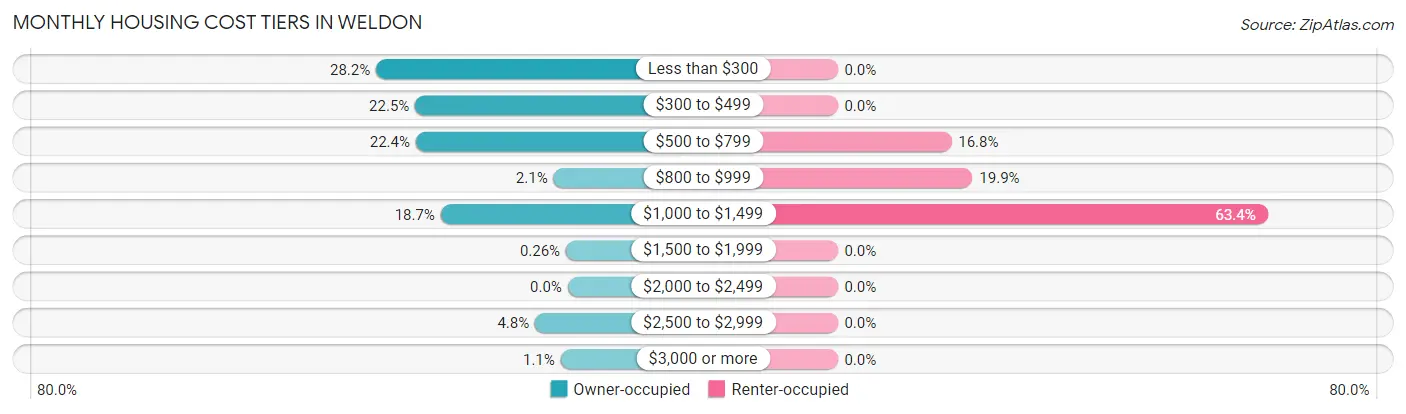
| Monthly Cost | Owner-occupied | Renter-occupied |
| Less than $300 | 323 (28.2%) | 0 (0.0%) |
| $300 to $499 | 257 (22.5%) | 0 (0.0%) |
| $500 to $799 | 256 (22.4%) | 27 (16.8%) |
| $800 to $999 | 24 (2.1%) | 32 (19.9%) |
| $1,000 to $1,499 | 214 (18.7%) | 102 (63.3%) |
| $1,500 to $1,999 | 3 (0.3%) | 0 (0.0%) |
| $2,000 to $2,499 | 0 (0.0%) | 0 (0.0%) |
| $2,500 to $2,999 | 55 (4.8%) | 0 (0.0%) |
| $3,000 or more | 12 (1.1%) | 0 (0.0%) |
| Total | 1,144 (100.0%) | 161 (100.0%) |
Physical Housing Characteristics in Weldon
Housing Structures in Weldon
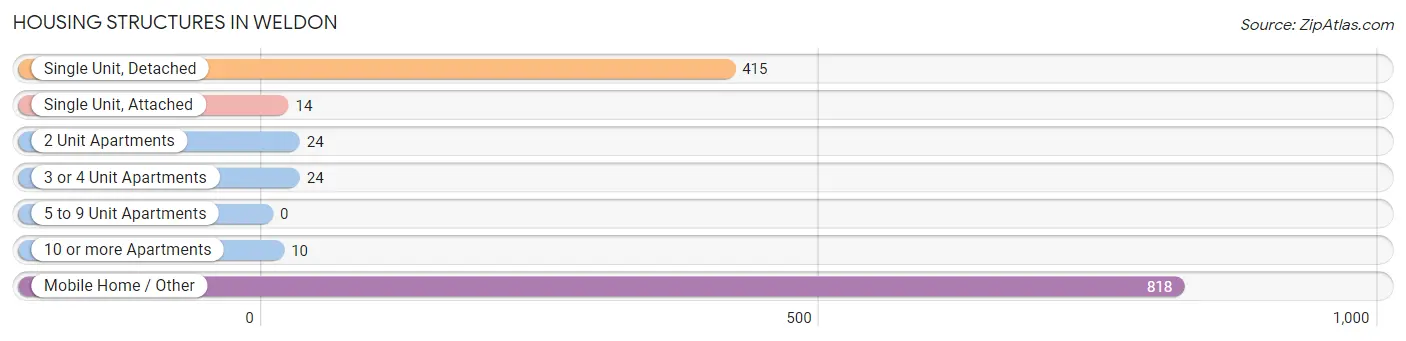
| Structure Type | # Housing Units | % Housing Units |
| Single Unit, Detached | 415 | 31.8% |
| Single Unit, Attached | 14 | 1.1% |
| 2 Unit Apartments | 24 | 1.8% |
| 3 or 4 Unit Apartments | 24 | 1.8% |
| 5 to 9 Unit Apartments | 0 | 0.0% |
| 10 or more Apartments | 10 | 0.8% |
| Mobile Home / Other | 818 | 62.7% |
| Total | 1,305 | 100.0% |
Housing Structures by Occupancy in Weldon
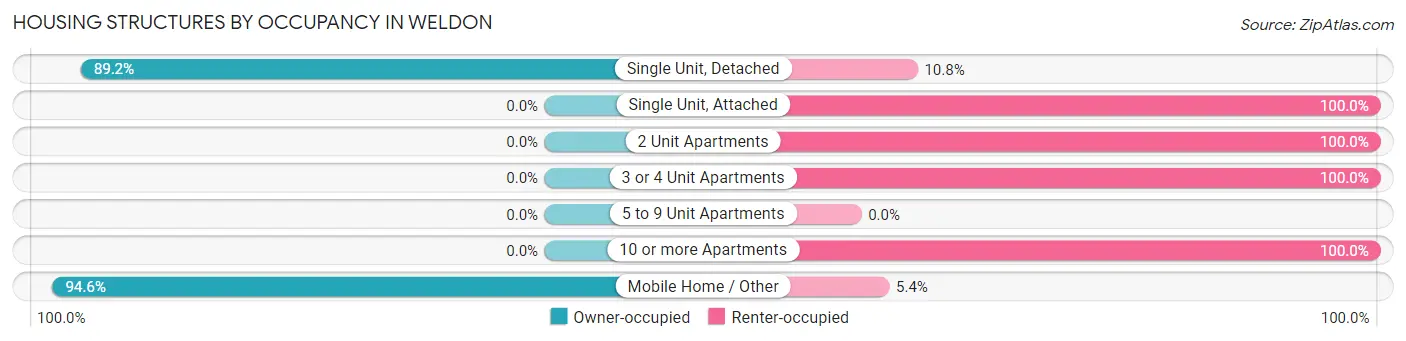
| Structure Type | Owner-occupied | Renter-occupied |
| Single Unit, Detached | 370 (89.2%) | 45 (10.8%) |
| Single Unit, Attached | 0 (0.0%) | 14 (100.0%) |
| 2 Unit Apartments | 0 (0.0%) | 24 (100.0%) |
| 3 or 4 Unit Apartments | 0 (0.0%) | 24 (100.0%) |
| 5 to 9 Unit Apartments | 0 (0.0%) | 0 (0.0%) |
| 10 or more Apartments | 0 (0.0%) | 10 (100.0%) |
| Mobile Home / Other | 774 (94.6%) | 44 (5.4%) |
| Total | 1,144 (87.7%) | 161 (12.3%) |
Housing Structures by Number of Rooms in Weldon
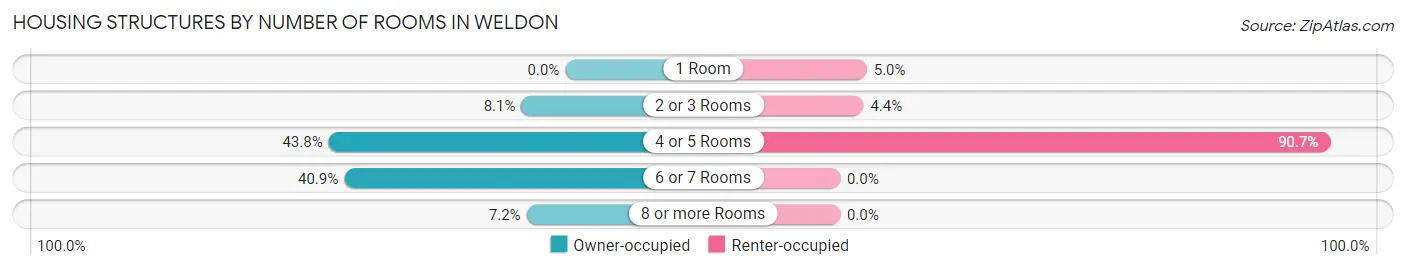
| Number of Rooms | Owner-occupied | Renter-occupied |
| 1 Room | 0 (0.0%) | 8 (5.0%) |
| 2 or 3 Rooms | 93 (8.1%) | 7 (4.3%) |
| 4 or 5 Rooms | 501 (43.8%) | 146 (90.7%) |
| 6 or 7 Rooms | 468 (40.9%) | 0 (0.0%) |
| 8 or more Rooms | 82 (7.2%) | 0 (0.0%) |
| Total | 1,144 (100.0%) | 161 (100.0%) |
Housing Structure by Heating Type in Weldon
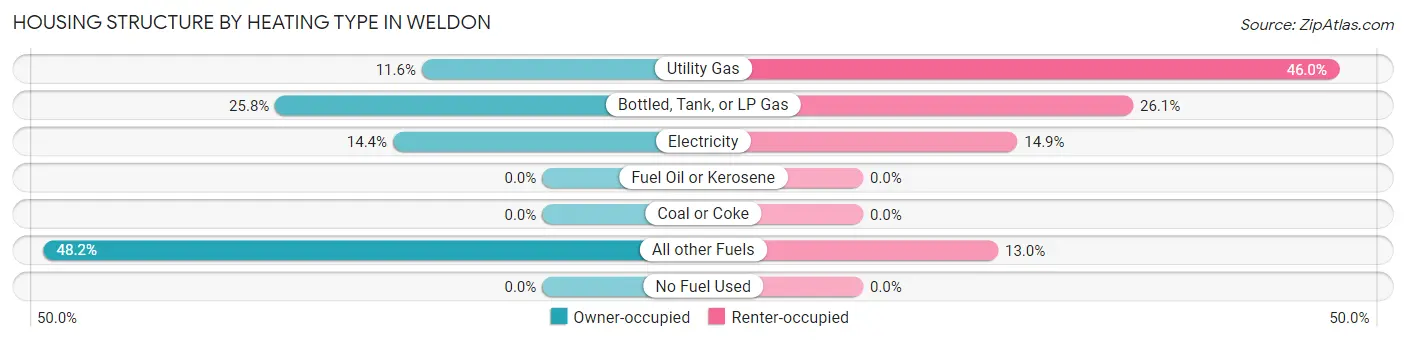
| Heating Type | Owner-occupied | Renter-occupied |
| Utility Gas | 133 (11.6%) | 74 (46.0%) |
| Bottled, Tank, or LP Gas | 295 (25.8%) | 42 (26.1%) |
| Electricity | 165 (14.4%) | 24 (14.9%) |
| Fuel Oil or Kerosene | 0 (0.0%) | 0 (0.0%) |
| Coal or Coke | 0 (0.0%) | 0 (0.0%) |
| All other Fuels | 551 (48.2%) | 21 (13.0%) |
| No Fuel Used | 0 (0.0%) | 0 (0.0%) |
| Total | 1,144 (100.0%) | 161 (100.0%) |
Household Vehicle Usage in Weldon
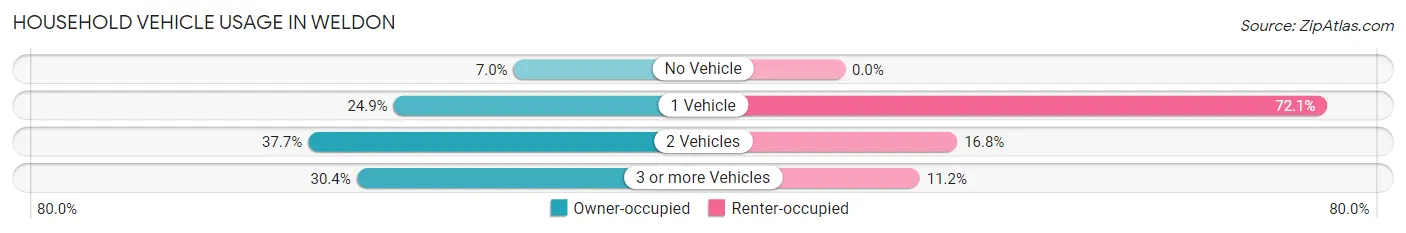
| Vehicles per Household | Owner-occupied | Renter-occupied |
| No Vehicle | 80 (7.0%) | 0 (0.0%) |
| 1 Vehicle | 285 (24.9%) | 116 (72.1%) |
| 2 Vehicles | 431 (37.7%) | 27 (16.8%) |
| 3 or more Vehicles | 348 (30.4%) | 18 (11.2%) |
| Total | 1,144 (100.0%) | 161 (100.0%) |
Real Estate & Mortgages in Weldon
Real Estate and Mortgage Overview in Weldon
| Characteristic | Without Mortgage | With Mortgage |
| Housing Units | 842 | 302 |
| Median Property Value | $83,900 | $169,200 |
| Median Household Income | $24,179 | $58 |
| Monthly Housing Costs | $415 | $12 |
| Real Estate Taxes | $829 | $0 |
Property Value by Mortgage Status in Weldon
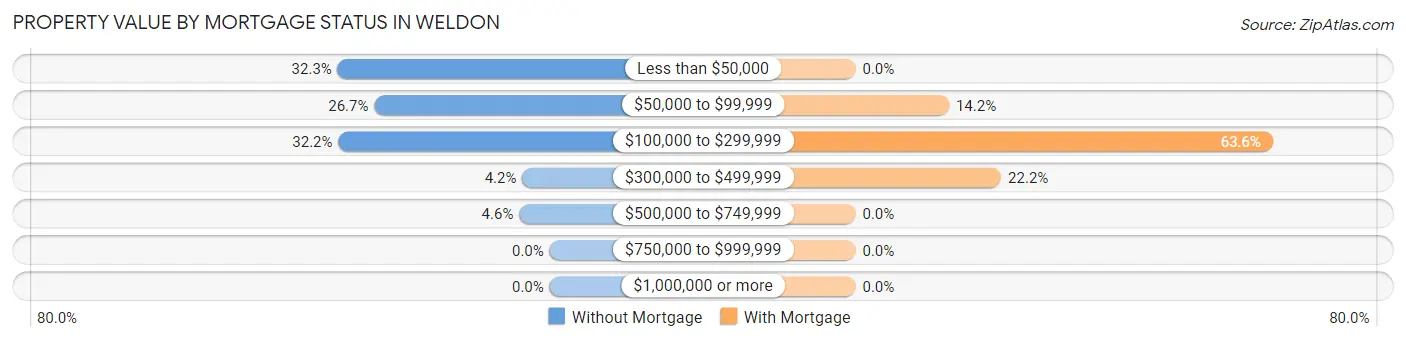
| Property Value | Without Mortgage | With Mortgage |
| Less than $50,000 | 272 (32.3%) | 0 (0.0%) |
| $50,000 to $99,999 | 225 (26.7%) | 43 (14.2%) |
| $100,000 to $299,999 | 271 (32.2%) | 192 (63.6%) |
| $300,000 to $499,999 | 35 (4.2%) | 67 (22.2%) |
| $500,000 to $749,999 | 39 (4.6%) | 0 (0.0%) |
| $750,000 to $999,999 | 0 (0.0%) | 0 (0.0%) |
| $1,000,000 or more | 0 (0.0%) | 0 (0.0%) |
| Total | 842 (100.0%) | 302 (100.0%) |
Household Income by Mortgage Status in Weldon
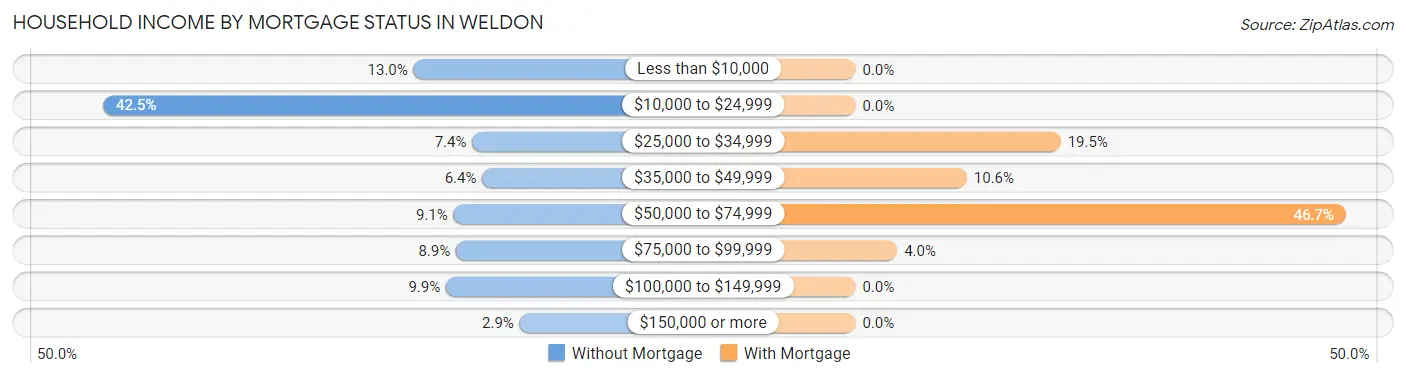
| Household Income | Without Mortgage | With Mortgage |
| Less than $10,000 | 109 (13.0%) | 0 (0.0%) |
| $10,000 to $24,999 | 358 (42.5%) | 0 (0.0%) |
| $25,000 to $34,999 | 62 (7.4%) | 59 (19.5%) |
| $35,000 to $49,999 | 54 (6.4%) | 32 (10.6%) |
| $50,000 to $74,999 | 77 (9.1%) | 141 (46.7%) |
| $75,000 to $99,999 | 75 (8.9%) | 12 (4.0%) |
| $100,000 to $149,999 | 83 (9.9%) | 0 (0.0%) |
| $150,000 or more | 24 (2.9%) | 0 (0.0%) |
| Total | 842 (100.0%) | 302 (100.0%) |
Property Value to Household Income Ratio in Weldon
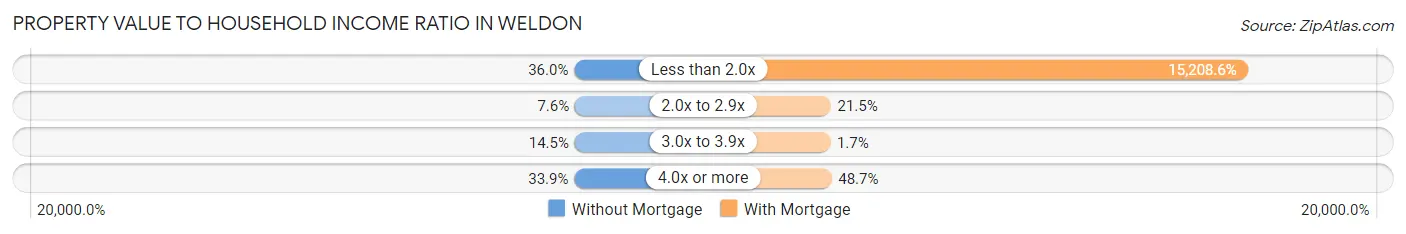
| Value-to-Income Ratio | Without Mortgage | With Mortgage |
| Less than 2.0x | 303 (36.0%) | 45,930 (15,208.6%) |
| 2.0x to 2.9x | 64 (7.6%) | 65 (21.5%) |
| 3.0x to 3.9x | 122 (14.5%) | 5 (1.7%) |
| 4.0x or more | 285 (33.9%) | 147 (48.7%) |
| Total | 842 (100.0%) | 302 (100.0%) |
Real Estate Taxes by Mortgage Status in Weldon
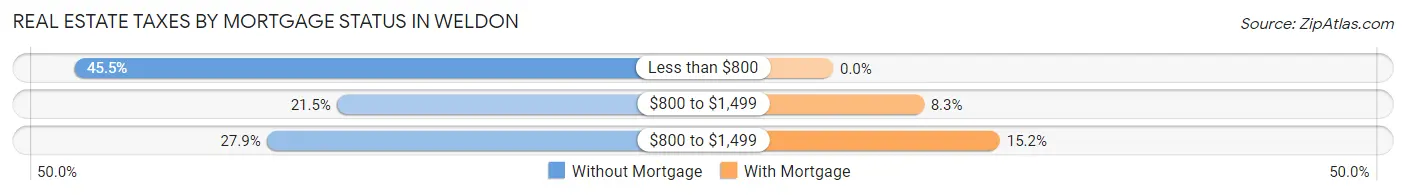
| Property Taxes | Without Mortgage | With Mortgage |
| Less than $800 | 383 (45.5%) | 0 (0.0%) |
| $800 to $1,499 | 181 (21.5%) | 25 (8.3%) |
| $800 to $1,499 | 235 (27.9%) | 46 (15.2%) |
| Total | 842 (100.0%) | 302 (100.0%) |
Health & Disability in Weldon
Health Insurance Coverage by Age in Weldon
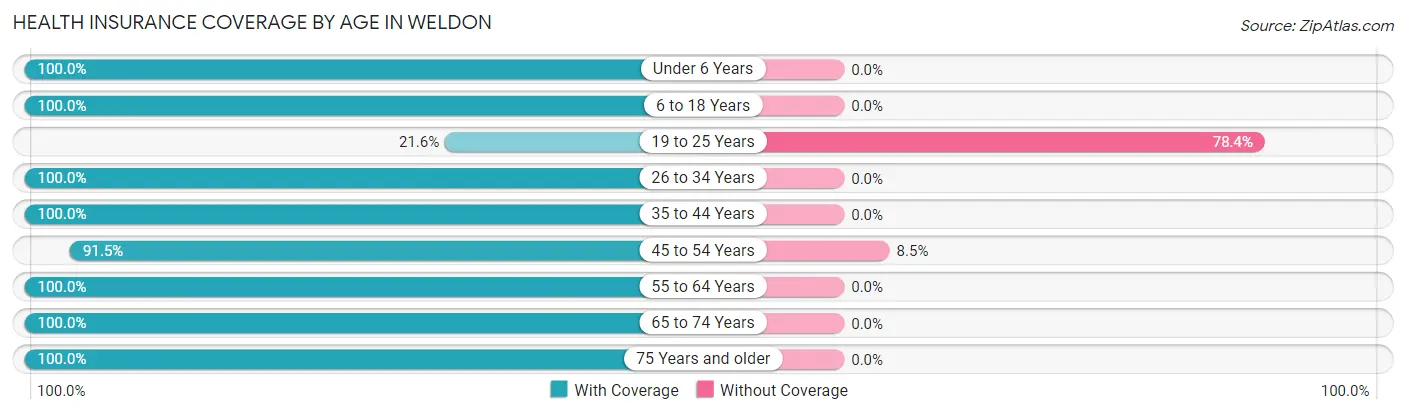
| Age Bracket | With Coverage | Without Coverage |
| Under 6 Years | 115 (100.0%) | 0 (0.0%) |
| 6 to 18 Years | 273 (100.0%) | 0 (0.0%) |
| 19 to 25 Years | 19 (21.6%) | 69 (78.4%) |
| 26 to 34 Years | 246 (100.0%) | 0 (0.0%) |
| 35 to 44 Years | 123 (100.0%) | 0 (0.0%) |
| 45 to 54 Years | 119 (91.5%) | 11 (8.5%) |
| 55 to 64 Years | 566 (100.0%) | 0 (0.0%) |
| 65 to 74 Years | 946 (100.0%) | 0 (0.0%) |
| 75 Years and older | 115 (100.0%) | 0 (0.0%) |
| Total | 2,522 (96.9%) | 80 (3.1%) |
Health Insurance Coverage by Citizenship Status in Weldon
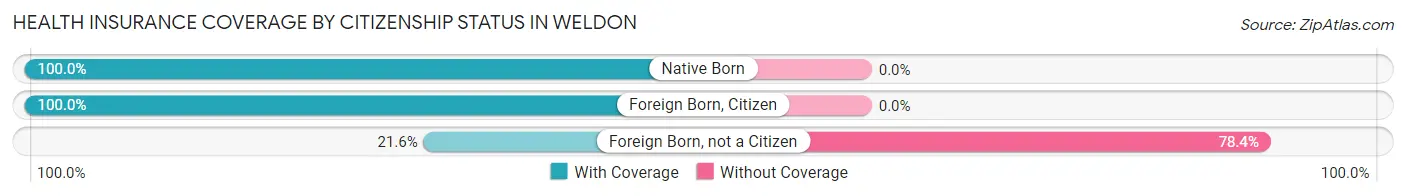
| Citizenship Status | With Coverage | Without Coverage |
| Native Born | 115 (100.0%) | 0 (0.0%) |
| Foreign Born, Citizen | 273 (100.0%) | 0 (0.0%) |
| Foreign Born, not a Citizen | 19 (21.6%) | 69 (78.4%) |
Health Insurance Coverage by Household Income in Weldon
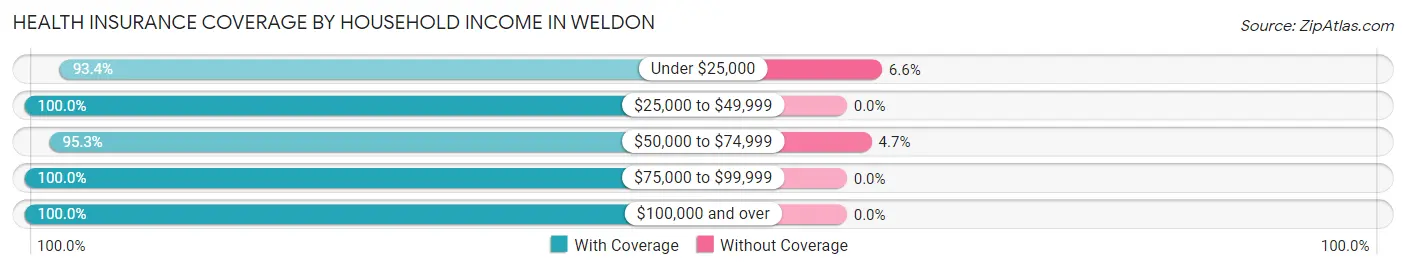
| Household Income | With Coverage | Without Coverage |
| Under $25,000 | 979 (93.4%) | 69 (6.6%) |
| $25,000 to $49,999 | 761 (100.0%) | 0 (0.0%) |
| $50,000 to $74,999 | 225 (95.3%) | 11 (4.7%) |
| $75,000 to $99,999 | 138 (100.0%) | 0 (0.0%) |
| $100,000 and over | 419 (100.0%) | 0 (0.0%) |
Public vs Private Health Insurance Coverage by Age in Weldon
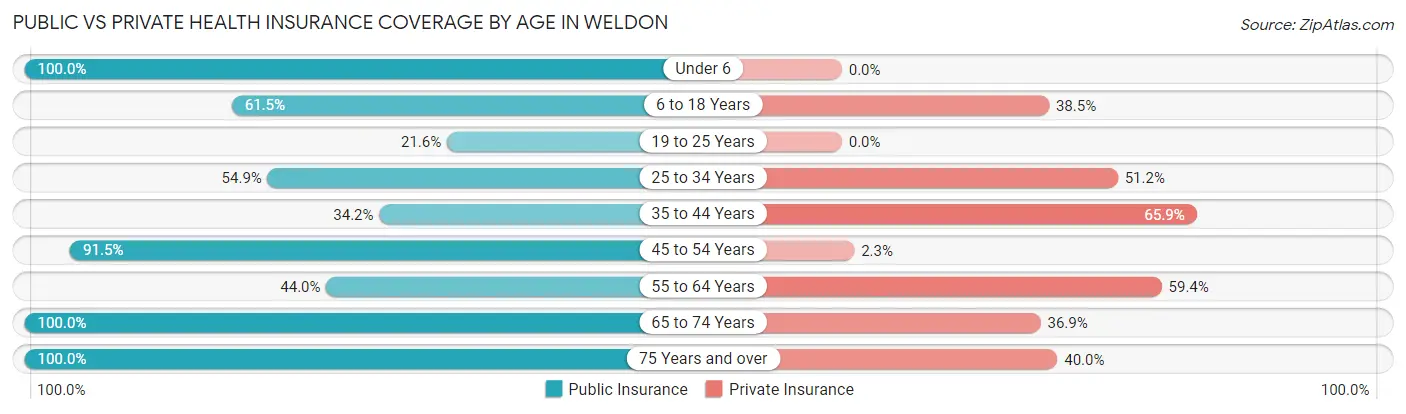
| Age Bracket | Public Insurance | Private Insurance |
| Under 6 | 115 (100.0%) | 0 (0.0%) |
| 6 to 18 Years | 168 (61.5%) | 105 (38.5%) |
| 19 to 25 Years | 19 (21.6%) | 0 (0.0%) |
| 25 to 34 Years | 135 (54.9%) | 126 (51.2%) |
| 35 to 44 Years | 42 (34.2%) | 81 (65.8%) |
| 45 to 54 Years | 119 (91.5%) | 3 (2.3%) |
| 55 to 64 Years | 249 (44.0%) | 336 (59.4%) |
| 65 to 74 Years | 946 (100.0%) | 349 (36.9%) |
| 75 Years and over | 115 (100.0%) | 46 (40.0%) |
| Total | 1,908 (73.3%) | 1,046 (40.2%) |
Disability Status by Sex by Age in Weldon
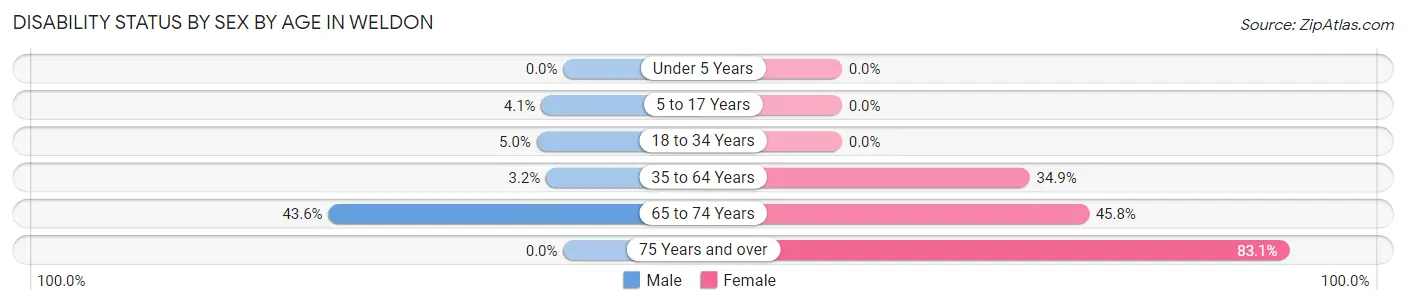
| Age Bracket | Male | Female |
| Under 5 Years | 0 (0.0%) | 0 (0.0%) |
| 5 to 17 Years | 7 (4.1%) | 0 (0.0%) |
| 18 to 34 Years | 9 (5.0%) | 0 (0.0%) |
| 35 to 64 Years | 15 (3.2%) | 122 (34.9%) |
| 65 to 74 Years | 167 (43.6%) | 258 (45.8%) |
| 75 Years and over | 0 (0.0%) | 49 (83.1%) |
Disability Class by Sex by Age in Weldon
Disability Class: Hearing Difficulty
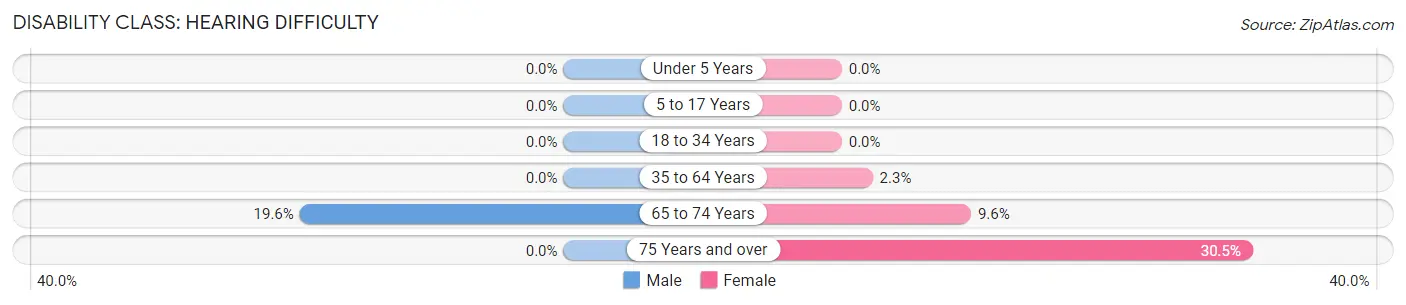
| Age Bracket | Male | Female |
| Under 5 Years | 0 (0.0%) | 0 (0.0%) |
| 5 to 17 Years | 0 (0.0%) | 0 (0.0%) |
| 18 to 34 Years | 0 (0.0%) | 0 (0.0%) |
| 35 to 64 Years | 0 (0.0%) | 8 (2.3%) |
| 65 to 74 Years | 75 (19.6%) | 54 (9.6%) |
| 75 Years and over | 0 (0.0%) | 18 (30.5%) |
Disability Class: Vision Difficulty
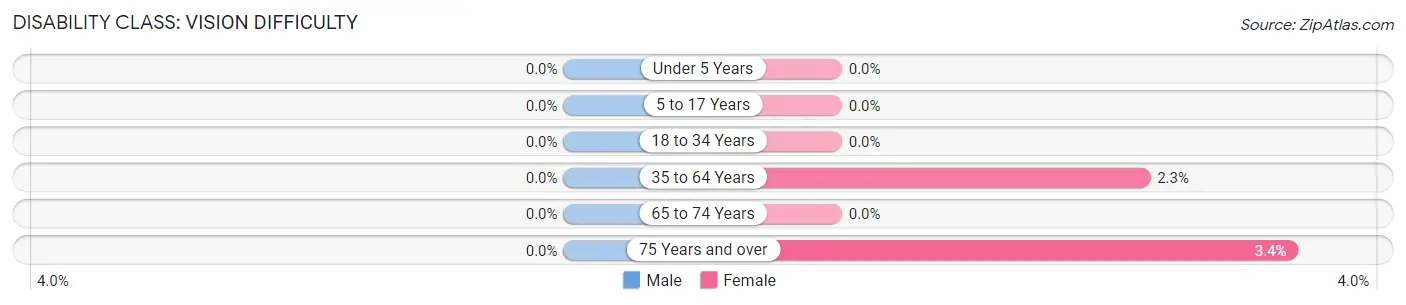
| Age Bracket | Male | Female |
| Under 5 Years | 0 (0.0%) | 0 (0.0%) |
| 5 to 17 Years | 0 (0.0%) | 0 (0.0%) |
| 18 to 34 Years | 0 (0.0%) | 0 (0.0%) |
| 35 to 64 Years | 0 (0.0%) | 8 (2.3%) |
| 65 to 74 Years | 0 (0.0%) | 0 (0.0%) |
| 75 Years and over | 0 (0.0%) | 2 (3.4%) |
Disability Class: Cognitive Difficulty
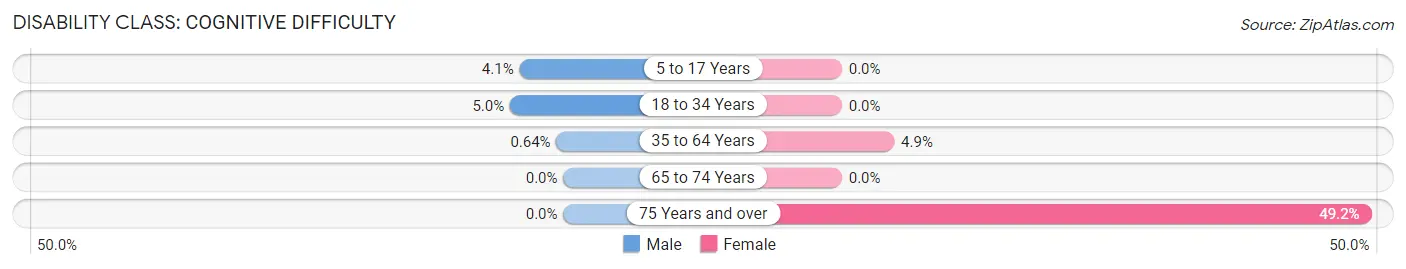
| Age Bracket | Male | Female |
| 5 to 17 Years | 7 (4.1%) | 0 (0.0%) |
| 18 to 34 Years | 9 (5.0%) | 0 (0.0%) |
| 35 to 64 Years | 3 (0.6%) | 17 (4.9%) |
| 65 to 74 Years | 0 (0.0%) | 0 (0.0%) |
| 75 Years and over | 0 (0.0%) | 29 (49.1%) |
Disability Class: Ambulatory Difficulty
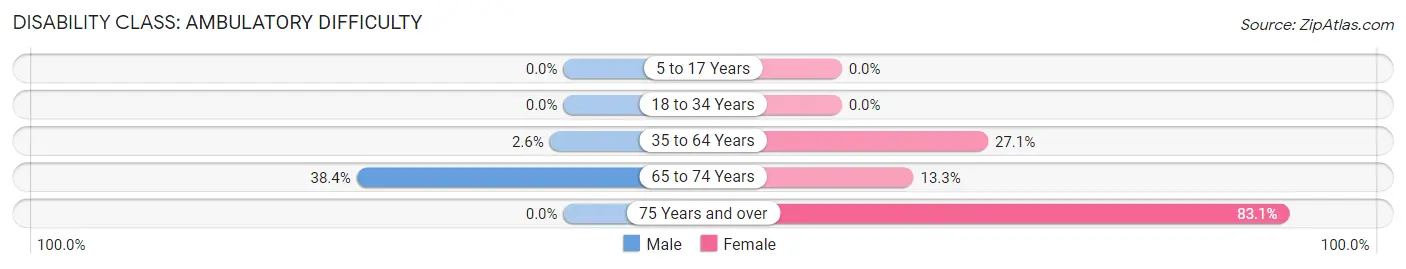
| Age Bracket | Male | Female |
| 5 to 17 Years | 0 (0.0%) | 0 (0.0%) |
| 18 to 34 Years | 0 (0.0%) | 0 (0.0%) |
| 35 to 64 Years | 12 (2.6%) | 95 (27.1%) |
| 65 to 74 Years | 147 (38.4%) | 75 (13.3%) |
| 75 Years and over | 0 (0.0%) | 49 (83.1%) |
Disability Class: Self-Care Difficulty
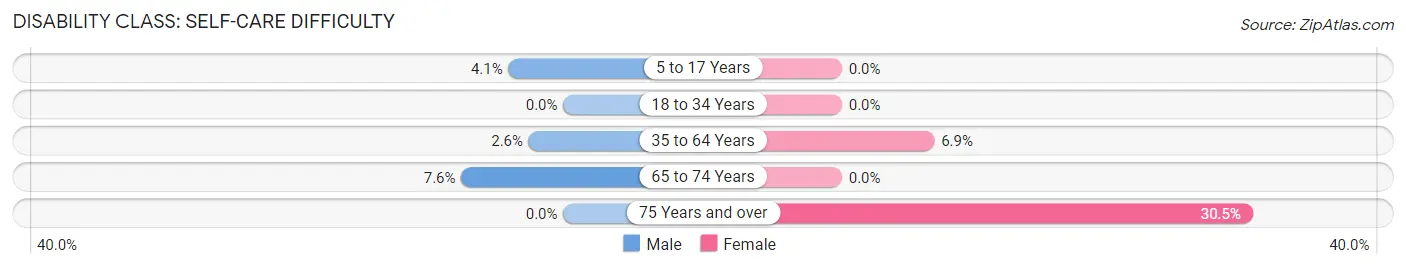
| Age Bracket | Male | Female |
| 5 to 17 Years | 7 (4.1%) | 0 (0.0%) |
| 18 to 34 Years | 0 (0.0%) | 0 (0.0%) |
| 35 to 64 Years | 12 (2.6%) | 24 (6.9%) |
| 65 to 74 Years | 29 (7.6%) | 0 (0.0%) |
| 75 Years and over | 0 (0.0%) | 18 (30.5%) |
Technology Access in Weldon
Computing Device Access in Weldon
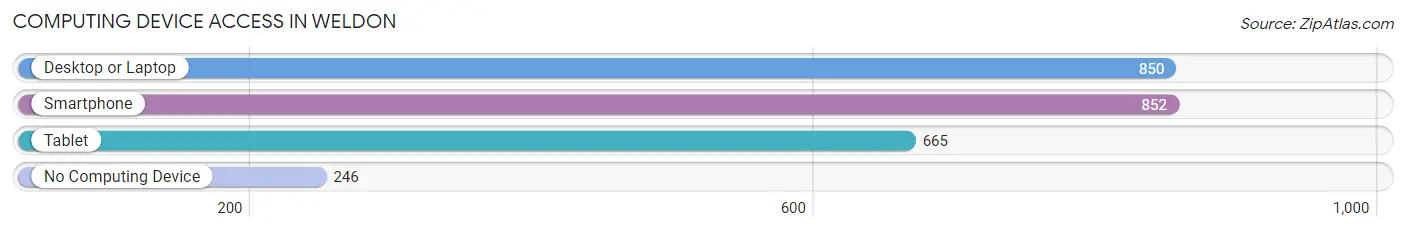
| Device Type | # Households | % Households |
| Desktop or Laptop | 850 | 65.1% |
| Smartphone | 852 | 65.3% |
| Tablet | 665 | 51.0% |
| No Computing Device | 246 | 18.9% |
| Total | 1,305 | 100.0% |
Internet Access in Weldon
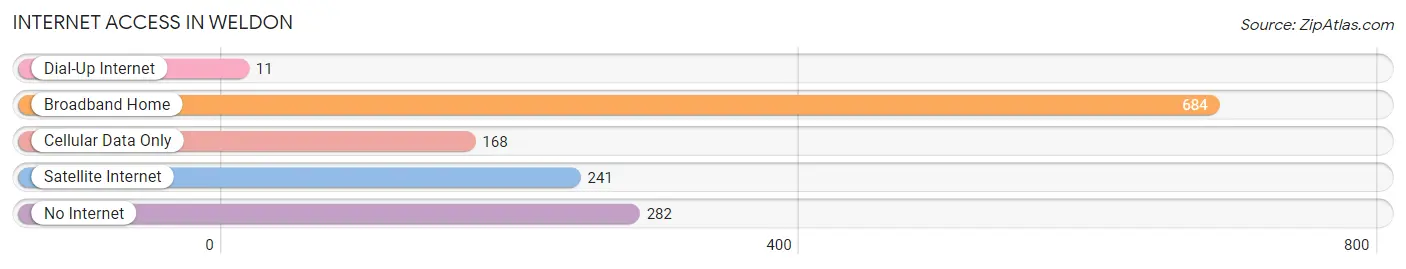
| Internet Type | # Households | % Households |
| Dial-Up Internet | 11 | 0.8% |
| Broadband Home | 684 | 52.4% |
| Cellular Data Only | 168 | 12.9% |
| Satellite Internet | 241 | 18.5% |
| No Internet | 282 | 21.6% |
| Total | 1,305 | 100.0% |
Weldon Summary
Weldon is a small unincorporated community located in Kern County, California. It is situated in the foothills of the Sierra Nevada Mountains, approximately 25 miles east of Bakersfield. The population of Weldon was estimated to be 1,845 in 2019.
History
Weldon was founded in 1876 by a group of settlers from the Midwest. The town was named after a local rancher, William Weldon, who owned a large ranch in the area. The town was originally a farming community, but it soon became a hub for the local mining industry. In the late 19th century, Weldon was home to several gold and silver mines, as well as a few coal mines.
The town experienced a period of growth in the early 20th century, when the Southern Pacific Railroad built a line through the area. This allowed for the transportation of goods and people to and from Weldon. The town also became a popular destination for tourists, who came to enjoy the area’s natural beauty.
Geography
Weldon is located in the foothills of the Sierra Nevada Mountains, at an elevation of 2,845 feet. The town is situated in a valley surrounded by mountains, with the Kern River running through it. The climate in Weldon is semi-arid, with hot summers and mild winters.
Economy
The economy of Weldon is largely based on agriculture and tourism. The town is home to several farms, which produce a variety of crops, including alfalfa, cotton, and wheat. The area is also popular with tourists, who come to enjoy the area’s natural beauty and outdoor activities.
Demographics
As of 2019, the population of Weldon was estimated to be 1,845. The racial makeup of the town was 79.3% White, 0.7% African American, 0.3% Native American, 0.2% Asian, 0.1% Pacific Islander, and 18.4% from other races. The median household income in Weldon was $41,944, and the median age was 37.5 years.
Conclusion
Weldon is a small unincorporated community located in Kern County, California. It was founded in 1876 and has a population of 1,845. The economy of Weldon is largely based on agriculture and tourism, and the town is home to several farms and is a popular destination for tourists. The racial makeup of the town is 79.3% White, 0.7% African American, 0.3% Native American, 0.2% Asian, 0.1% Pacific Islander, and 18.4% from other races. The median household income in Weldon was $41,944, and the median age was 37.5 years.
Common Questions
What is Per Capita Income in Weldon?
Per Capita income in Weldon is $26,157.
What is the Median Family Income in Weldon?
Median Family Income in Weldon is $45,107.
What is the Median Household income in Weldon?
Median Household Income in Weldon is $27,377.
What is Inequality or Gini Index in Weldon?
Inequality or Gini Index in Weldon is 0.50.
What is the Total Population of Weldon?
Total Population of Weldon is 2,602.
What is the Total Male Population of Weldon?
Total Male Population of Weldon is 1,377.
What is the Total Female Population of Weldon?
Total Female Population of Weldon is 1,225.
What is the Ratio of Males per 100 Females in Weldon?
There are 112.41 Males per 100 Females in Weldon.
What is the Ratio of Females per 100 Males in Weldon?
There are 88.96 Females per 100 Males in Weldon.
What is the Median Population Age in Weldon?
Median Population Age in Weldon is 59.4 Years.
What is the Average Family Size in Weldon
Average Family Size in Weldon is 2.3 People.
What is the Average Household Size in Weldon
Average Household Size in Weldon is 2.0 People.
How Large is the Labor Force in Weldon?
There are 837 People in the Labor Forcein in Weldon.
What is the Percentage of People in the Labor Force in Weldon?
37.8% of People are in the Labor Force in Weldon.
What is the Unemployment Rate in Weldon?
Unemployment Rate in Weldon is 6.1%.