Zip Codes with the Highest Percentage of Population Employed in Health Diagnosing & Treating in Compton, CA
RELATED REPORTS & OPTIONS
Health Diagnosing & Treating
Compton
Compare Zip Codes
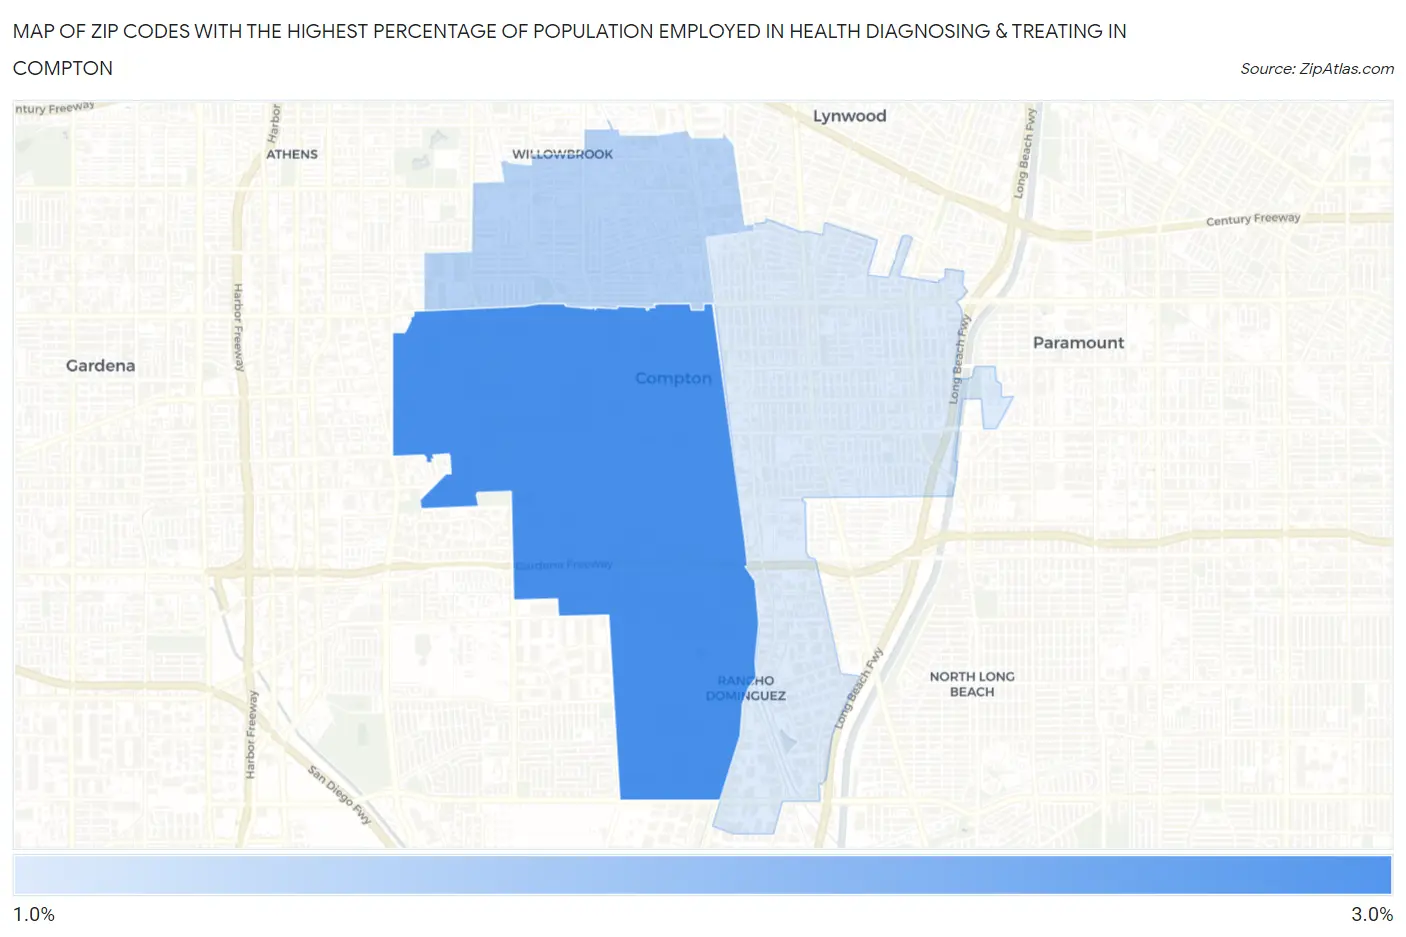
Map of Zip Codes with the Highest Percentage of Population Employed in Health Diagnosing & Treating in Compton
1.8%
2.7%
Zip Codes with the Highest Percentage of Population Employed in Health Diagnosing & Treating in Compton, CA
| Zip Code | % Employed | vs State | vs National | |
| 1. | 90220 | 2.7% | 5.3%(-2.61)#1,243 | 6.2%(-3.54)#25,031 |
| 2. | 90222 | 2.1% | 5.3%(-3.26)#1,341 | 6.2%(-4.19)#26,368 |
| 3. | 90221 | 1.8% | 5.3%(-3.48)#1,374 | 6.2%(-4.42)#26,757 |
1
Common Questions
What are the Top Zip Codes with the Highest Percentage of Population Employed in Health Diagnosing & Treating in Compton, CA?
Top Zip Codes with the Highest Percentage of Population Employed in Health Diagnosing & Treating in Compton, CA are:
What zip code has the Highest Percentage of Population Employed in Health Diagnosing & Treating in Compton, CA?
90220 has the Highest Percentage of Population Employed in Health Diagnosing & Treating in Compton, CA with 2.7%.
What is the Percentage of Population Employed in Health Diagnosing & Treating in Compton, CA?
Percentage of Population Employed in Health Diagnosing & Treating in Compton is 2.5%.
What is the Percentage of Population Employed in Health Diagnosing & Treating in California?
Percentage of Population Employed in Health Diagnosing & Treating in California is 5.3%.
What is the Percentage of Population Employed in Health Diagnosing & Treating in the United States?
Percentage of Population Employed in Health Diagnosing & Treating in the United States is 6.2%.