Cities with the Highest Percentage of Population Employed in Health Diagnosing & Treating in Tennessee
RELATED REPORTS & OPTIONS
Health Diagnosing & Treating
Tennessee
Compare Cities
Map of Cities with the Highest Percentage of Population Employed in Health Diagnosing & Treating in Tennessee
0.0%
50.0%
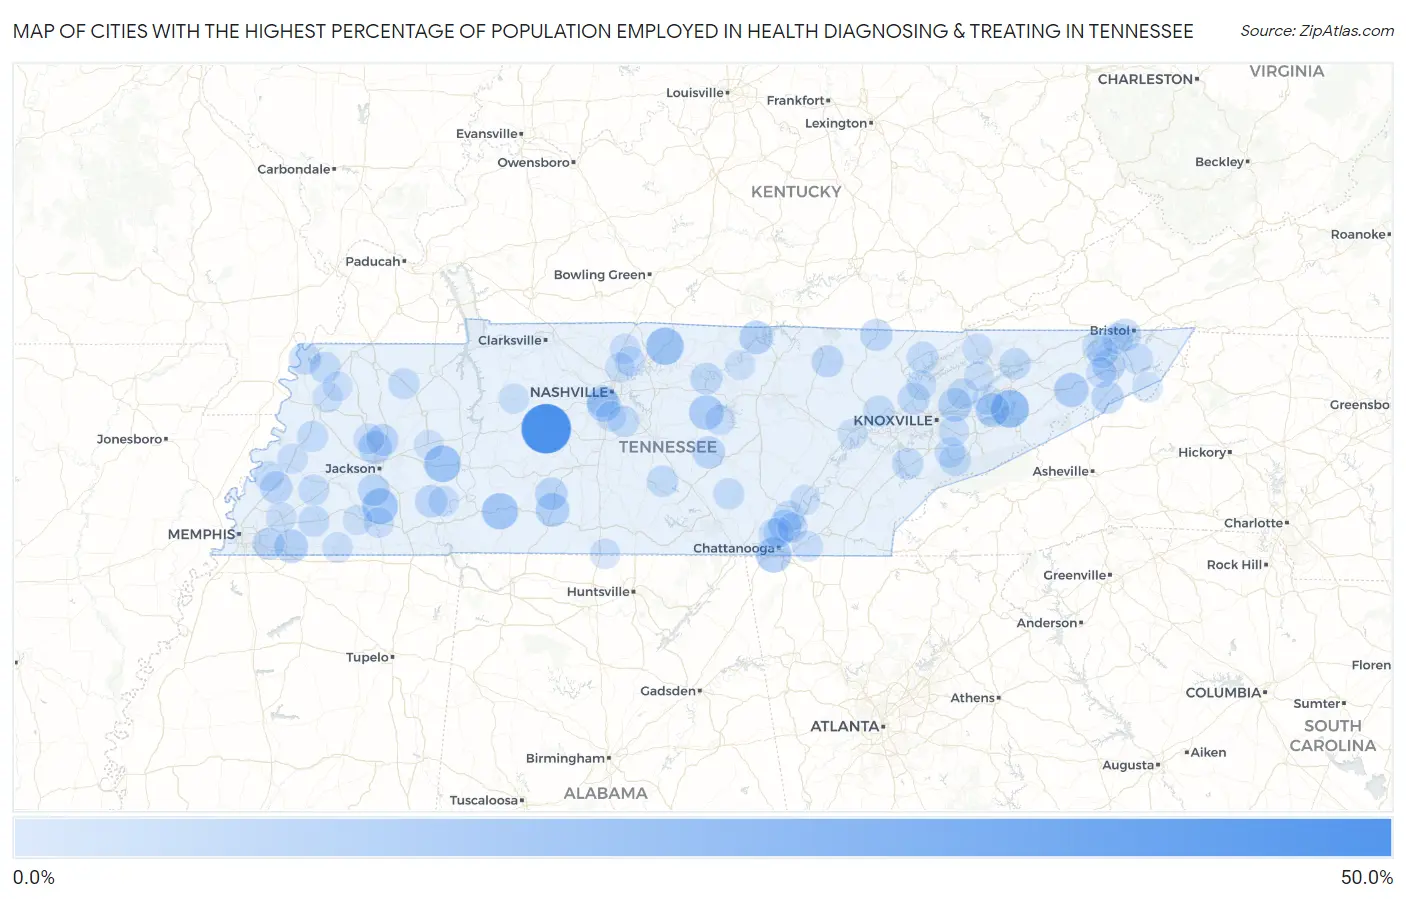
Cities with the Highest Percentage of Population Employed in Health Diagnosing & Treating in Tennessee
| City | % Employed | vs State | vs National | |
| 1. | Wrigley | 45.9% | 6.9%(+39.1)#1 | 6.2%(+39.7)#101 |
| 2. | Walnut Grove Cdp Hardin County | 33.7% | 6.9%(+26.8)#2 | 6.2%(+27.4)#220 |
| 3. | Huron | 30.3% | 6.9%(+23.4)#3 | 6.2%(+24.1)#301 |
| 4. | Ocoee | 24.6% | 6.9%(+17.8)#4 | 6.2%(+18.4)#462 |
| 5. | Baneberry | 23.6% | 6.9%(+16.7)#5 | 6.2%(+17.3)#516 |
| 6. | Bethpage | 22.4% | 6.9%(+15.6)#6 | 6.2%(+16.2)#577 |
| 7. | Beech Bluff | 21.8% | 6.9%(+15.0)#7 | 6.2%(+15.6)#612 |
| 8. | Chesterfield | 21.3% | 6.9%(+14.4)#8 | 6.2%(+15.0)#641 |
| 9. | Prospect | 20.8% | 6.9%(+14.0)#9 | 6.2%(+14.6)#681 |
| 10. | Gladeville | 20.6% | 6.9%(+13.7)#10 | 6.2%(+14.3)#697 |
| 11. | Waynesboro | 20.4% | 6.9%(+13.5)#11 | 6.2%(+14.2)#711 |
| 12. | Silerton | 19.5% | 6.9%(+12.7)#12 | 6.2%(+13.3)#796 |
| 13. | Taft | 18.7% | 6.9%(+11.8)#13 | 6.2%(+12.4)#877 |
| 14. | Lookout Mountain | 18.5% | 6.9%(+11.7)#14 | 6.2%(+12.3)#895 |
| 15. | Orebank | 17.6% | 6.9%(+10.8)#15 | 6.2%(+11.4)#989 |
| 16. | Dowelltown | 17.4% | 6.9%(+10.5)#16 | 6.2%(+11.1)#1,027 |
| 17. | Tusculum | 16.8% | 6.9%(+9.99)#17 | 6.2%(+10.6)#1,116 |
| 18. | Hilham | 16.3% | 6.9%(+9.39)#18 | 6.2%(+10.0)#1,229 |
| 19. | Dandridge | 15.9% | 6.9%(+9.01)#19 | 6.2%(+9.62)#1,310 |
| 20. | Ethridge | 15.9% | 6.9%(+9.00)#20 | 6.2%(+9.61)#1,312 |
| 21. | Celina | 15.7% | 6.9%(+8.82)#21 | 6.2%(+9.44)#1,354 |
| 22. | Mcdonald | 15.7% | 6.9%(+8.80)#22 | 6.2%(+9.41)#1,360 |
| 23. | Piperton | 15.7% | 6.9%(+8.80)#23 | 6.2%(+9.41)#1,361 |
| 24. | Finley | 15.6% | 6.9%(+8.71)#24 | 6.2%(+9.33)#1,378 |
| 25. | Mascot | 15.5% | 6.9%(+8.67)#25 | 6.2%(+9.28)#1,388 |
| 26. | Forest Hills | 15.3% | 6.9%(+8.41)#26 | 6.2%(+9.03)#1,454 |
| 27. | Three Way | 15.0% | 6.9%(+8.19)#27 | 6.2%(+8.80)#1,493 |
| 28. | Falling Water | 14.6% | 6.9%(+7.74)#28 | 6.2%(+8.35)#1,621 |
| 29. | Johnson City | 14.2% | 6.9%(+7.38)#29 | 6.2%(+7.99)#1,734 |
| 30. | Summertown | 13.7% | 6.9%(+6.87)#30 | 6.2%(+7.49)#1,891 |
| 31. | Banner Hill | 13.5% | 6.9%(+6.68)#31 | 6.2%(+7.29)#1,967 |
| 32. | Milledgeville | 13.5% | 6.9%(+6.60)#32 | 6.2%(+7.22)#1,996 |
| 33. | Brighton | 13.5% | 6.9%(+6.59)#33 | 6.2%(+7.21)#2,005 |
| 34. | Centertown | 13.4% | 6.9%(+6.57)#34 | 6.2%(+7.19)#2,013 |
| 35. | Walnut Hill | 13.2% | 6.9%(+6.33)#35 | 6.2%(+6.95)#2,108 |
| 36. | Medina | 12.9% | 6.9%(+6.07)#36 | 6.2%(+6.68)#2,227 |
| 37. | Winfield | 12.9% | 6.9%(+5.99)#37 | 6.2%(+6.61)#2,262 |
| 38. | Blanche | 12.8% | 6.9%(+5.98)#38 | 6.2%(+6.60)#2,265 |
| 39. | Allardt | 12.8% | 6.9%(+5.91)#39 | 6.2%(+6.53)#2,298 |
| 40. | Medon | 12.7% | 6.9%(+5.88)#40 | 6.2%(+6.50)#2,308 |
| 41. | Germantown | 12.7% | 6.9%(+5.88)#41 | 6.2%(+6.50)#2,310 |
| 42. | Belle Meade | 12.6% | 6.9%(+5.76)#42 | 6.2%(+6.38)#2,369 |
| 43. | Carthage | 12.5% | 6.9%(+5.68)#43 | 6.2%(+6.30)#2,402 |
| 44. | Clinton | 12.5% | 6.9%(+5.66)#44 | 6.2%(+6.28)#2,409 |
| 45. | Tiptonville | 12.4% | 6.9%(+5.58)#45 | 6.2%(+6.19)#2,464 |
| 46. | Sullivan Gardens | 12.3% | 6.9%(+5.42)#46 | 6.2%(+6.04)#2,537 |
| 47. | Lenox | 12.3% | 6.9%(+5.39)#47 | 6.2%(+6.01)#2,556 |
| 48. | Oak Grove Cdp Sumner County | 12.2% | 6.9%(+5.30)#48 | 6.2%(+5.92)#2,600 |
| 49. | Townsend | 12.0% | 6.9%(+5.14)#49 | 6.2%(+5.76)#2,671 |
| 50. | Fincastle | 12.0% | 6.9%(+5.13)#50 | 6.2%(+5.75)#2,678 |
| 51. | Greenback | 12.0% | 6.9%(+5.11)#51 | 6.2%(+5.72)#2,692 |
| 52. | Mooresburg | 11.9% | 6.9%(+4.99)#52 | 6.2%(+5.61)#2,745 |
| 53. | Somerville | 11.8% | 6.9%(+4.98)#53 | 6.2%(+5.60)#2,753 |
| 54. | Coalfield | 11.7% | 6.9%(+4.83)#54 | 6.2%(+5.45)#2,840 |
| 55. | Wartrace | 11.7% | 6.9%(+4.83)#55 | 6.2%(+5.45)#2,842 |
| 56. | Hornbeak | 11.6% | 6.9%(+4.75)#56 | 6.2%(+5.36)#2,902 |
| 57. | Nolensville | 11.5% | 6.9%(+4.66)#57 | 6.2%(+5.27)#2,975 |
| 58. | Mowbray Mountain | 11.5% | 6.9%(+4.64)#58 | 6.2%(+5.25)#2,991 |
| 59. | Spurgeon | 11.4% | 6.9%(+4.52)#59 | 6.2%(+5.14)#3,070 |
| 60. | Blountville | 11.3% | 6.9%(+4.41)#60 | 6.2%(+5.03)#3,137 |
| 61. | Gleason | 11.3% | 6.9%(+4.39)#61 | 6.2%(+5.01)#3,150 |
| 62. | Gates | 11.2% | 6.9%(+4.35)#62 | 6.2%(+4.97)#3,178 |
| 63. | Altamont | 11.1% | 6.9%(+4.21)#63 | 6.2%(+4.83)#3,288 |
| 64. | Stanton | 11.0% | 6.9%(+4.11)#64 | 6.2%(+4.73)#3,347 |
| 65. | Colonial Heights | 10.9% | 6.9%(+3.99)#65 | 6.2%(+4.61)#3,426 |
| 66. | Blaine | 10.7% | 6.9%(+3.86)#66 | 6.2%(+4.48)#3,538 |
| 67. | Signal Mountain | 10.6% | 6.9%(+3.79)#67 | 6.2%(+4.40)#3,597 |
| 68. | Walland | 10.6% | 6.9%(+3.75)#68 | 6.2%(+4.37)#3,623 |
| 69. | Humboldt | 10.6% | 6.9%(+3.75)#69 | 6.2%(+4.37)#3,627 |
| 70. | Hunter | 10.6% | 6.9%(+3.69)#70 | 6.2%(+4.31)#3,680 |
| 71. | Saltillo | 10.3% | 6.9%(+3.47)#71 | 6.2%(+4.09)#3,876 |
| 72. | Collegedale | 10.3% | 6.9%(+3.41)#72 | 6.2%(+4.03)#3,944 |
| 73. | Smithville | 10.2% | 6.9%(+3.39)#73 | 6.2%(+4.00)#3,967 |
| 74. | Grand Junction | 10.2% | 6.9%(+3.37)#74 | 6.2%(+3.99)#3,980 |
| 75. | Henning | 10.2% | 6.9%(+3.32)#75 | 6.2%(+3.94)#4,033 |
| 76. | Jonesborough | 10.2% | 6.9%(+3.29)#76 | 6.2%(+3.91)#4,064 |
| 77. | Walden | 10.1% | 6.9%(+3.29)#77 | 6.2%(+3.90)#4,072 |
| 78. | Brentwood | 10.1% | 6.9%(+3.25)#78 | 6.2%(+3.86)#4,100 |
| 79. | Arlington | 10.1% | 6.9%(+3.24)#79 | 6.2%(+3.86)#4,105 |
| 80. | Norris | 10.1% | 6.9%(+3.23)#80 | 6.2%(+3.85)#4,113 |
| 81. | Seymour | 10.0% | 6.9%(+3.18)#81 | 6.2%(+3.80)#4,162 |
| 82. | Tazewell | 10.0% | 6.9%(+3.14)#82 | 6.2%(+3.76)#4,193 |
| 83. | Burlison | 10.0% | 6.9%(+3.14)#83 | 6.2%(+3.76)#4,206 |
| 84. | Middle Valley | 10.0% | 6.9%(+3.14)#84 | 6.2%(+3.75)#4,229 |
| 85. | Ardmore | 9.9% | 6.9%(+3.05)#85 | 6.2%(+3.66)#4,307 |
| 86. | White House | 9.8% | 6.9%(+2.98)#86 | 6.2%(+3.60)#4,380 |
| 87. | Mcewen | 9.8% | 6.9%(+2.98)#87 | 6.2%(+3.60)#4,382 |
| 88. | Hornsby | 9.8% | 6.9%(+2.97)#88 | 6.2%(+3.59)#4,386 |
| 89. | Shackle Island | 9.8% | 6.9%(+2.97)#89 | 6.2%(+3.58)#4,399 |
| 90. | Roan Mountain | 9.7% | 6.9%(+2.80)#90 | 6.2%(+3.42)#4,580 |
| 91. | Newbern | 9.6% | 6.9%(+2.77)#91 | 6.2%(+3.38)#4,614 |
| 92. | Parker S Crossroads | 9.6% | 6.9%(+2.76)#92 | 6.2%(+3.38)#4,616 |
| 93. | Sale Creek | 9.6% | 6.9%(+2.73)#93 | 6.2%(+3.35)#4,651 |
| 94. | Rockwood | 9.6% | 6.9%(+2.72)#94 | 6.2%(+3.33)#4,677 |
| 95. | Jefferson City | 9.6% | 6.9%(+2.71)#95 | 6.2%(+3.32)#4,685 |
| 96. | Goodlettsville | 9.5% | 6.9%(+2.61)#96 | 6.2%(+3.23)#4,795 |
| 97. | Rutledge | 9.5% | 6.9%(+2.60)#97 | 6.2%(+3.21)#4,811 |
| 98. | Gainesboro | 9.4% | 6.9%(+2.58)#98 | 6.2%(+3.19)#4,839 |
| 99. | Bolivar | 9.4% | 6.9%(+2.53)#99 | 6.2%(+3.15)#4,896 |
| 100. | Trimble | 9.4% | 6.9%(+2.51)#100 | 6.2%(+3.13)#4,921 |
Common Questions
What are the Top 10 Cities with the Highest Percentage of Population Employed in Health Diagnosing & Treating in Tennessee?
Top 10 Cities with the Highest Percentage of Population Employed in Health Diagnosing & Treating in Tennessee are:
#1
45.9%
#2
23.6%
#3
22.4%
#4
21.3%
#5
20.4%
#6
19.5%
#7
18.5%
#8
17.4%
#9
16.8%
#10
15.9%
What city has the Highest Percentage of Population Employed in Health Diagnosing & Treating in Tennessee?
Wrigley has the Highest Percentage of Population Employed in Health Diagnosing & Treating in Tennessee with 45.9%.
What is the Percentage of Population Employed in Health Diagnosing & Treating in the State of Tennessee?
Percentage of Population Employed in Health Diagnosing & Treating in Tennessee is 6.9%.
What is the Percentage of Population Employed in Health Diagnosing & Treating in the United States?
Percentage of Population Employed in Health Diagnosing & Treating in the United States is 6.2%.