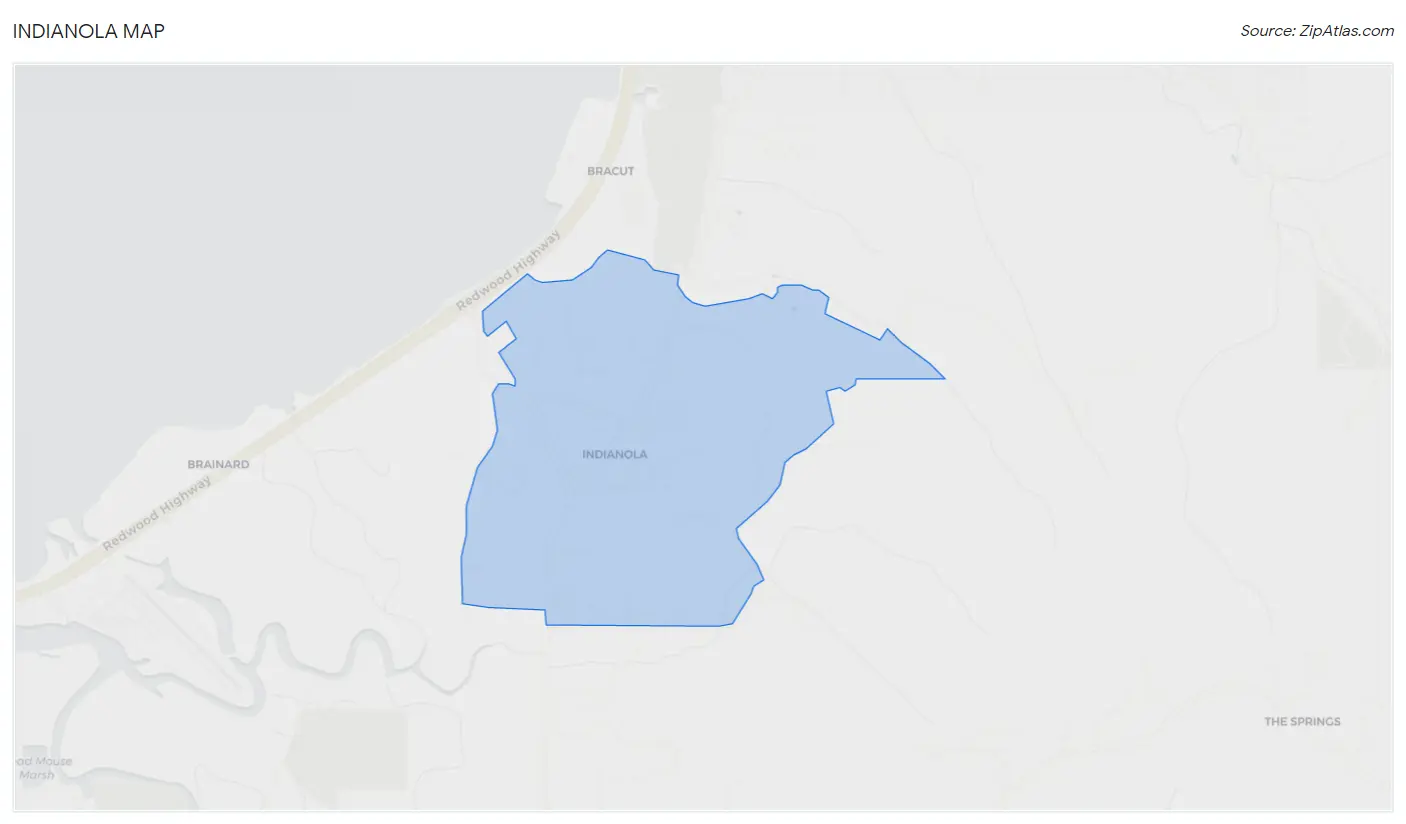
Indianola, CA Map & Demographics
Indianola Map
Indianola Overview
$33,890
PER CAPITA INCOME
$83,750
AVG FAMILY INCOME
$50,104
AVG HOUSEHOLD INCOME
6.2%
WAGE / INCOME GAP [ % ]
93.8¢/ $1
WAGE / INCOME GAP [ $ ]
0.48
INEQUALITY / GINI INDEX
717
TOTAL POPULATION
410
MALE POPULATION
307
FEMALE POPULATION
133.55
MALES / 100 FEMALES
74.88
FEMALES / 100 MALES
43.7
MEDIAN AGE
2.6
AVG FAMILY SIZE
2.5
AVG HOUSEHOLD SIZE
338
LABOR FORCE [ PEOPLE ]
58.7%
PERCENT IN LABOR FORCE
18.6%
UNEMPLOYMENT RATE
Income in Indianola
Income Overview in Indianola
Per Capita Income in Indianola is $33,890, while median incomes of families and households are $83,750 and $50,104 respectively.
| Characteristic | Number | Measure |
| Per Capita Income | 717 | $33,890 |
| Median Family Income | 222 | $83,750 |
| Mean Family Income | 222 | $97,965 |
| Median Household Income | 286 | $50,104 |
| Mean Household Income | 286 | $86,966 |
| Income Deficit | 222 | $0 |
| Wage / Income Gap (%) | 717 | 6.21% |
| Wage / Income Gap ($) | 717 | 93.79¢ per $1 |
| Gini / Inequality Index | 717 | 0.48 |
Earnings by Sex in Indianola
Average Earnings in Indianola are $42,111, $43,516 for men and $40,813 for women, a difference of 6.2%.
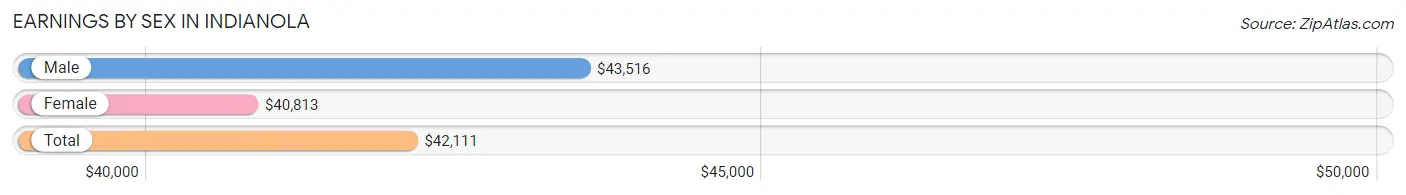
| Sex | Number | Average Earnings |
| Male | 205 (59.9%) | $43,516 |
| Female | 137 (40.1%) | $40,813 |
| Total | 342 (100.0%) | $42,111 |
Earnings by Sex by Income Bracket in Indianola
The most common earnings brackets in Indianola are $100,000+ for men (50 | 24.4%) and $75,000 to $99,999 for women (31 | 22.6%).
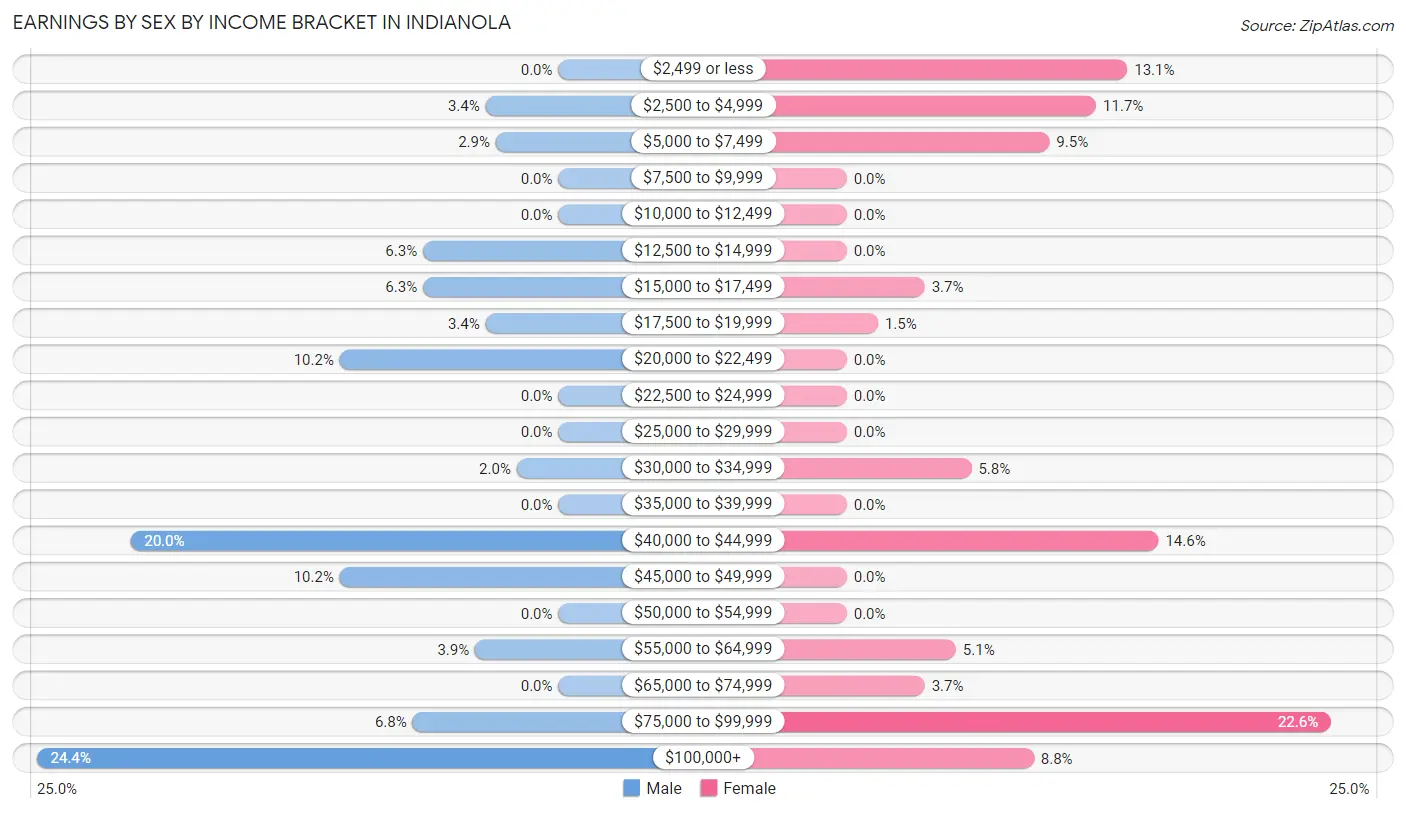
| Income | Male | Female |
| $2,499 or less | 0 (0.0%) | 18 (13.1%) |
| $2,500 to $4,999 | 7 (3.4%) | 16 (11.7%) |
| $5,000 to $7,499 | 6 (2.9%) | 13 (9.5%) |
| $7,500 to $9,999 | 0 (0.0%) | 0 (0.0%) |
| $10,000 to $12,499 | 0 (0.0%) | 0 (0.0%) |
| $12,500 to $14,999 | 13 (6.3%) | 0 (0.0%) |
| $15,000 to $17,499 | 13 (6.3%) | 5 (3.6%) |
| $17,500 to $19,999 | 7 (3.4%) | 2 (1.5%) |
| $20,000 to $22,499 | 21 (10.2%) | 0 (0.0%) |
| $22,500 to $24,999 | 0 (0.0%) | 0 (0.0%) |
| $25,000 to $29,999 | 0 (0.0%) | 0 (0.0%) |
| $30,000 to $34,999 | 4 (1.9%) | 8 (5.8%) |
| $35,000 to $39,999 | 0 (0.0%) | 0 (0.0%) |
| $40,000 to $44,999 | 41 (20.0%) | 20 (14.6%) |
| $45,000 to $49,999 | 21 (10.2%) | 0 (0.0%) |
| $50,000 to $54,999 | 0 (0.0%) | 0 (0.0%) |
| $55,000 to $64,999 | 8 (3.9%) | 7 (5.1%) |
| $65,000 to $74,999 | 0 (0.0%) | 5 (3.6%) |
| $75,000 to $99,999 | 14 (6.8%) | 31 (22.6%) |
| $100,000+ | 50 (24.4%) | 12 (8.8%) |
| Total | 205 (100.0%) | 137 (100.0%) |
Earnings by Sex by Educational Attainment in Indianola
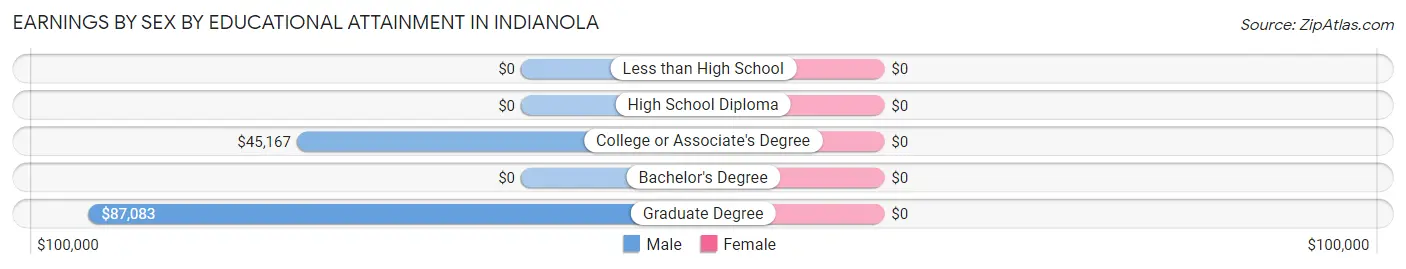
| Educational Attainment | Male Income | Female Income |
| Less than High School | - | - |
| High School Diploma | - | - |
| College or Associate's Degree | $45,167 | $0 |
| Bachelor's Degree | - | - |
| Graduate Degree | $87,083 | $0 |
| Total | $43,516 | $41,938 |
Family Income in Indianola
Family Income Brackets in Indianola
According to the Indianola family income data, there are 54 families falling into the $150,000 to $199,999 income range, which is the most common income bracket and makes up 24.3% of all families.
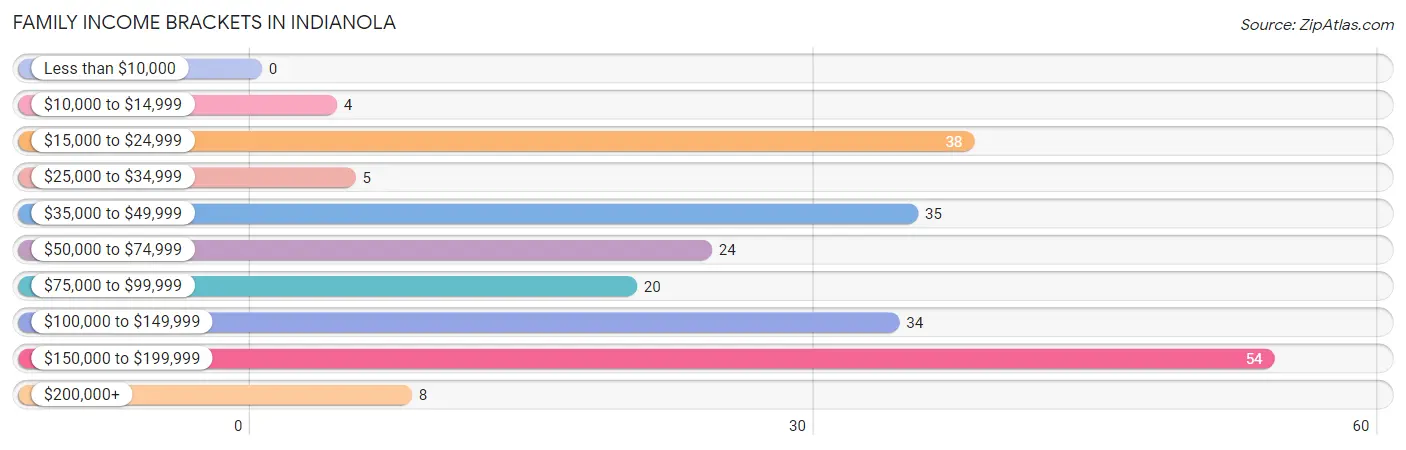
| Income Bracket | # Families | % Families |
| Less than $10,000 | 0 | 0.0% |
| $10,000 to $14,999 | 4 | 1.8% |
| $15,000 to $24,999 | 38 | 17.1% |
| $25,000 to $34,999 | 5 | 2.3% |
| $35,000 to $49,999 | 35 | 15.8% |
| $50,000 to $74,999 | 24 | 10.8% |
| $75,000 to $99,999 | 20 | 9.0% |
| $100,000 to $149,999 | 34 | 15.3% |
| $150,000 to $199,999 | 54 | 24.3% |
| $200,000+ | 8 | 3.6% |
Family Income by Famaliy Size in Indianola
2-person families (111 | 50.0%) account for the highest median family income in Indianola with $99,196 per family, while 2-person families (111 | 50.0%) have the highest median income of $49,598 per family member.
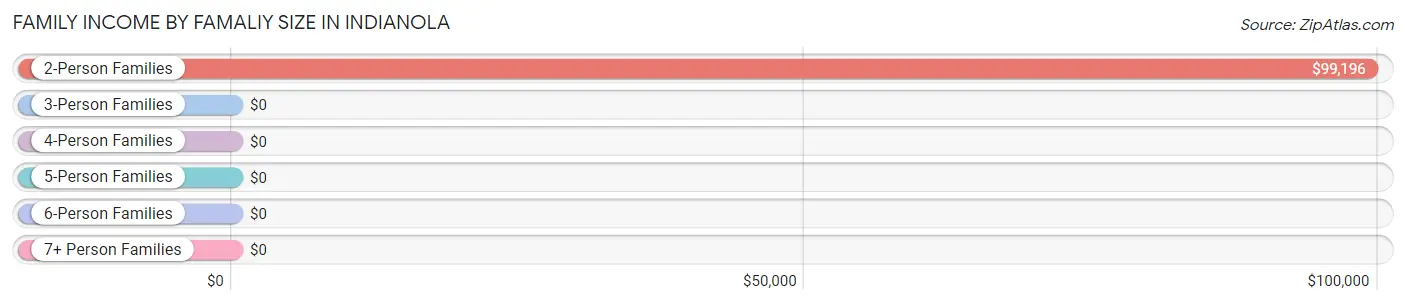
| Income Bracket | # Families | Median Income |
| 2-Person Families | 111 (50.0%) | $99,196 |
| 3-Person Families | 103 (46.4%) | $0 |
| 4-Person Families | 6 (2.7%) | $0 |
| 5-Person Families | 2 (0.9%) | $0 |
| 6-Person Families | 0 (0.0%) | $0 |
| 7+ Person Families | 0 (0.0%) | $0 |
| Total | 222 (100.0%) | $83,750 |
Family Income by Number of Earners in Indianola
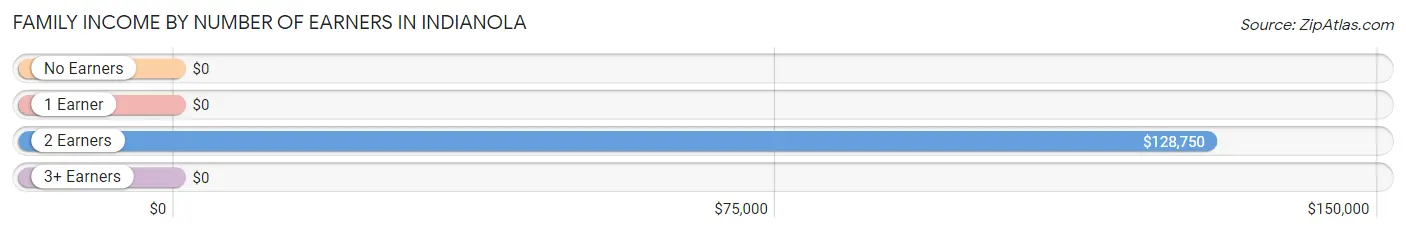
| Number of Earners | # Families | Median Income |
| No Earners | 25 (11.3%) | $0 |
| 1 Earner | 118 (53.1%) | $0 |
| 2 Earners | 72 (32.4%) | $128,750 |
| 3+ Earners | 7 (3.2%) | $0 |
| Total | 222 (100.0%) | $83,750 |
Household Income in Indianola
Household Income Brackets in Indianola
With 62 households falling in the category, the $35,000 to $49,999 income range is the most frequent in Indianola, accounting for 21.7% of all households. In contrast, only 9 households (3.2%) fall into the $10,000 to $14,999 income bracket, making it the least populous group.
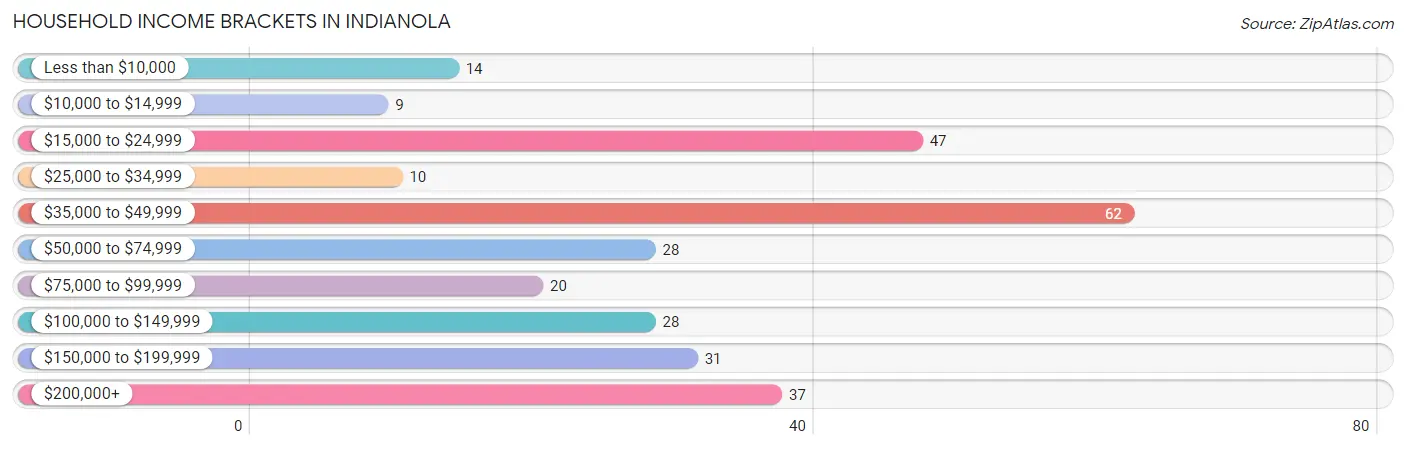
| Income Bracket | # Households | % Households |
| Less than $10,000 | 14 | 4.9% |
| $10,000 to $14,999 | 9 | 3.1% |
| $15,000 to $24,999 | 47 | 16.4% |
| $25,000 to $34,999 | 10 | 3.5% |
| $35,000 to $49,999 | 62 | 21.7% |
| $50,000 to $74,999 | 28 | 9.8% |
| $75,000 to $99,999 | 20 | 7.0% |
| $100,000 to $149,999 | 28 | 9.8% |
| $150,000 to $199,999 | 31 | 10.8% |
| $200,000+ | 37 | 12.9% |
Household Income by Householder Age in Indianola
The median household income in Indianola is $50,104, with the highest median household income of $81,563 found in the 65+ years age bracket for the primary householder. A total of 57 households (19.9%) fall into this category.
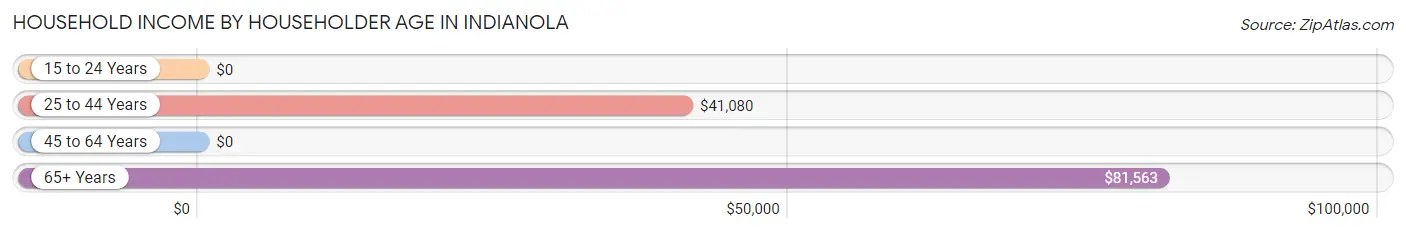
| Income Bracket | # Households | Median Income |
| 15 to 24 Years | 0 (0.0%) | $0 |
| 25 to 44 Years | 87 (30.4%) | $41,080 |
| 45 to 64 Years | 142 (49.6%) | $0 |
| 65+ Years | 57 (19.9%) | $81,563 |
| Total | 286 (100.0%) | $50,104 |
Poverty in Indianola
Income Below Poverty by Sex and Age in Indianola
With 28.3% poverty level for males and 22.5% for females among the residents of Indianola, 25 to 34 year old males and 18 to 24 year old females are the most vulnerable to poverty, with 29 males (80.6%) and 3 females (100.0%) in their respective age groups living below the poverty level.
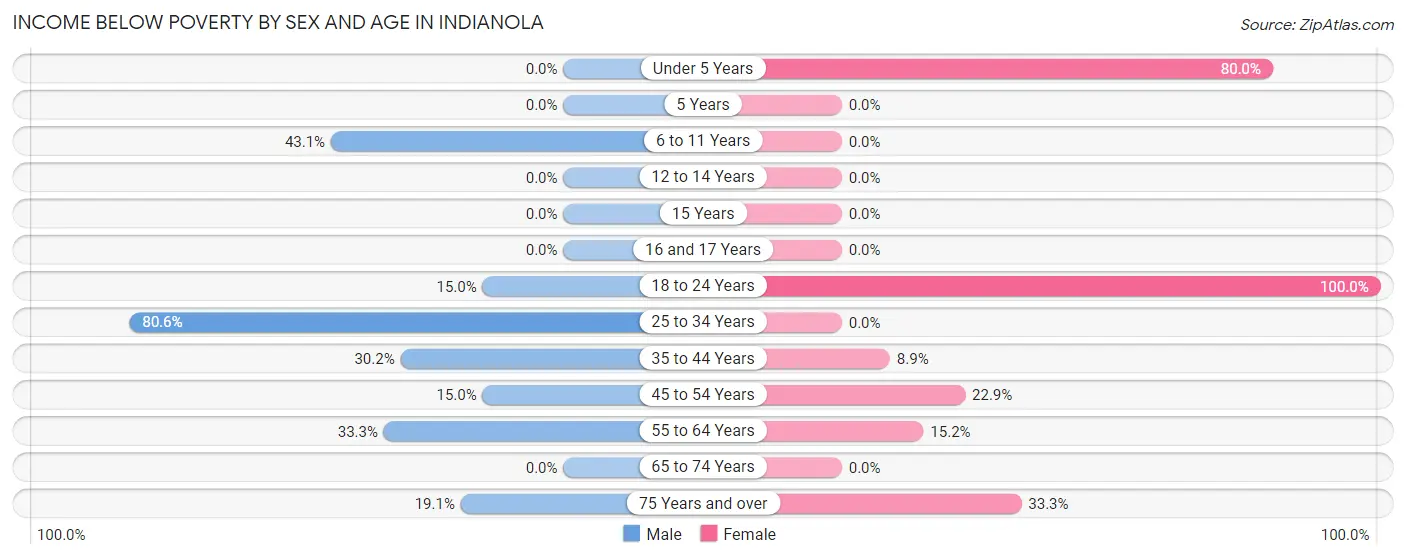
| Age Bracket | Male | Female |
| Under 5 Years | 0 (0.0%) | 32 (80.0%) |
| 5 Years | 0 (0.0%) | 0 (0.0%) |
| 6 to 11 Years | 22 (43.1%) | 0 (0.0%) |
| 12 to 14 Years | 0 (0.0%) | 0 (0.0%) |
| 15 Years | 0 (0.0%) | 0 (0.0%) |
| 16 and 17 Years | 0 (0.0%) | 0 (0.0%) |
| 18 to 24 Years | 3 (15.0%) | 3 (100.0%) |
| 25 to 34 Years | 29 (80.6%) | 0 (0.0%) |
| 35 to 44 Years | 26 (30.2%) | 5 (8.9%) |
| 45 to 54 Years | 12 (15.0%) | 19 (22.9%) |
| 55 to 64 Years | 20 (33.3%) | 5 (15.1%) |
| 65 to 74 Years | 0 (0.0%) | 0 (0.0%) |
| 75 Years and over | 4 (19.1%) | 5 (33.3%) |
| Total | 116 (28.3%) | 69 (22.5%) |
Income Above Poverty by Sex and Age in Indianola
According to the poverty statistics in Indianola, males aged 5 years and females aged 5 years are the age groups that are most secure financially, with 100.0% of males and 100.0% of females in these age groups living above the poverty line.
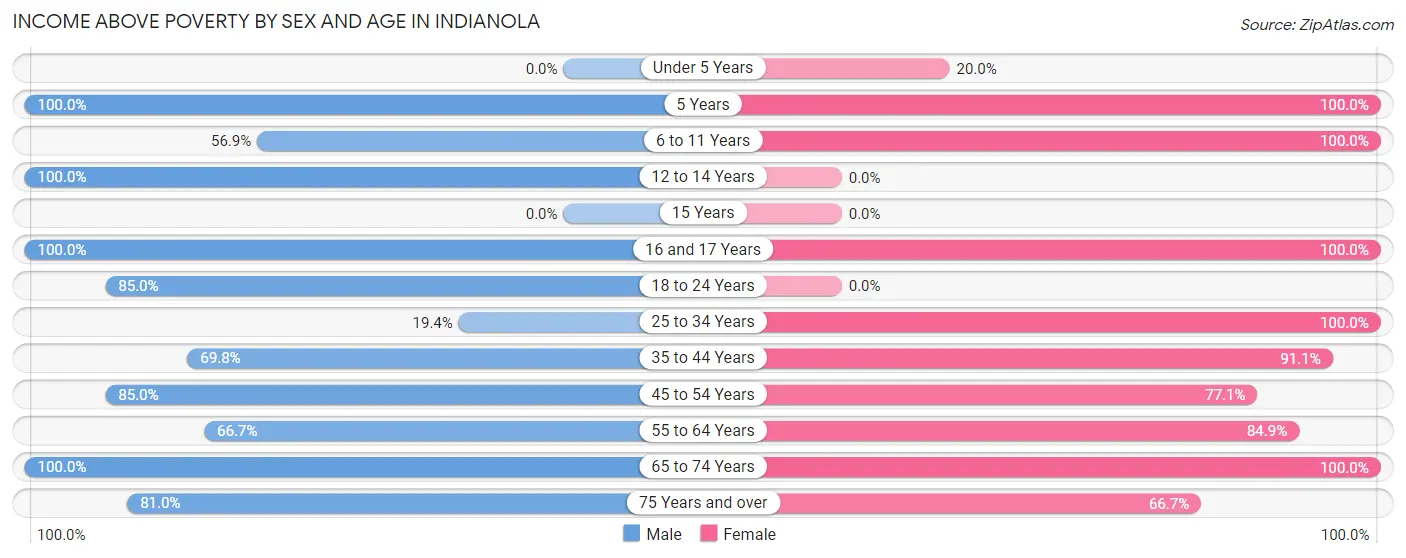
| Age Bracket | Male | Female |
| Under 5 Years | 0 (0.0%) | 8 (20.0%) |
| 5 Years | 13 (100.0%) | 3 (100.0%) |
| 6 to 11 Years | 29 (56.9%) | 19 (100.0%) |
| 12 to 14 Years | 15 (100.0%) | 0 (0.0%) |
| 15 Years | 0 (0.0%) | 0 (0.0%) |
| 16 and 17 Years | 4 (100.0%) | 15 (100.0%) |
| 18 to 24 Years | 17 (85.0%) | 0 (0.0%) |
| 25 to 34 Years | 7 (19.4%) | 9 (100.0%) |
| 35 to 44 Years | 60 (69.8%) | 51 (91.1%) |
| 45 to 54 Years | 68 (85.0%) | 64 (77.1%) |
| 55 to 64 Years | 40 (66.7%) | 28 (84.9%) |
| 65 to 74 Years | 24 (100.0%) | 31 (100.0%) |
| 75 Years and over | 17 (80.9%) | 10 (66.7%) |
| Total | 294 (71.7%) | 238 (77.5%) |
Income Below Poverty Among Married-Couple Families in Indianola
The poverty statistics for married-couple families in Indianola show that 6.2% or 9 of the total 144 families live below the poverty line. Families with no children have the highest poverty rate of 7.7%, comprising of 9 families. On the other hand, families with 1 or 2 children have the lowest poverty rate of 0.0%, which includes 0 families.
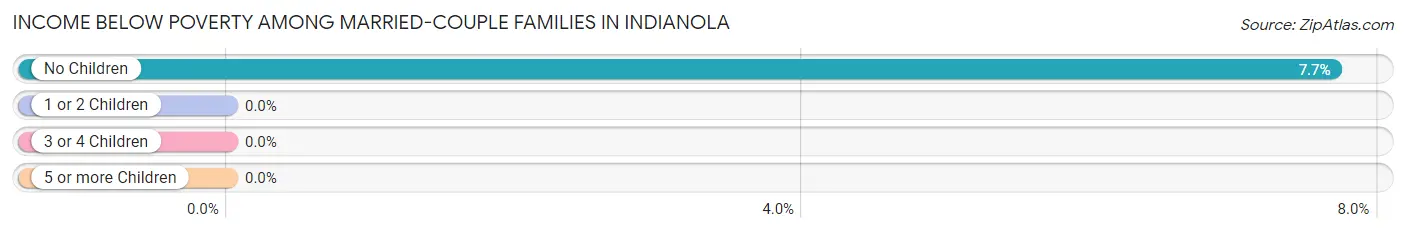
| Children | Above Poverty | Below Poverty |
| No Children | 108 (92.3%) | 9 (7.7%) |
| 1 or 2 Children | 25 (100.0%) | 0 (0.0%) |
| 3 or 4 Children | 2 (100.0%) | 0 (0.0%) |
| 5 or more Children | 0 (0.0%) | 0 (0.0%) |
| Total | 135 (93.8%) | 9 (6.2%) |
Income Below Poverty Among Single-Parent Households in Indianola
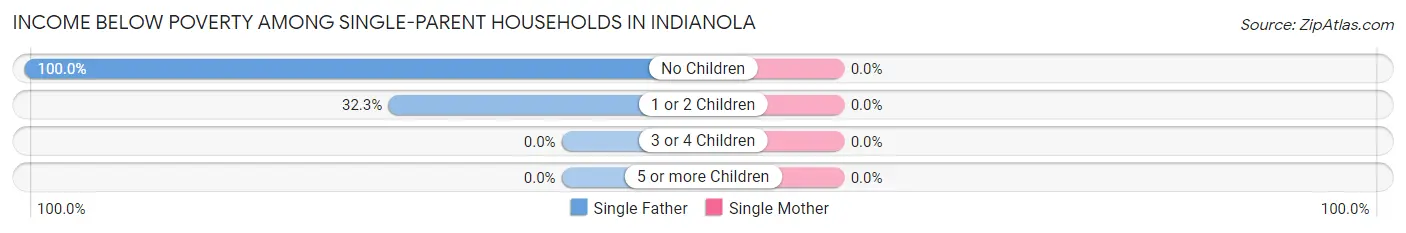
| Children | Single Father | Single Mother |
| No Children | 7 (100.0%) | 0 (0.0%) |
| 1 or 2 Children | 21 (32.3%) | 0 (0.0%) |
| 3 or 4 Children | 0 (0.0%) | 0 (0.0%) |
| 5 or more Children | 0 (0.0%) | 0 (0.0%) |
| Total | 28 (38.9%) | 0 (0.0%) |
Income Below Poverty Among Married-Couple vs Single-Parent Households in Indianola
The poverty data for Indianola shows that 9 of the married-couple family households (6.2%) and 28 of the single-parent households (35.9%) are living below the poverty level. Within the married-couple family households, those with no children have the highest poverty rate, with 9 households (7.7%) falling below the poverty line. Among the single-parent households, those with no children have the highest poverty rate, with 7 household (100.0%) living below poverty.
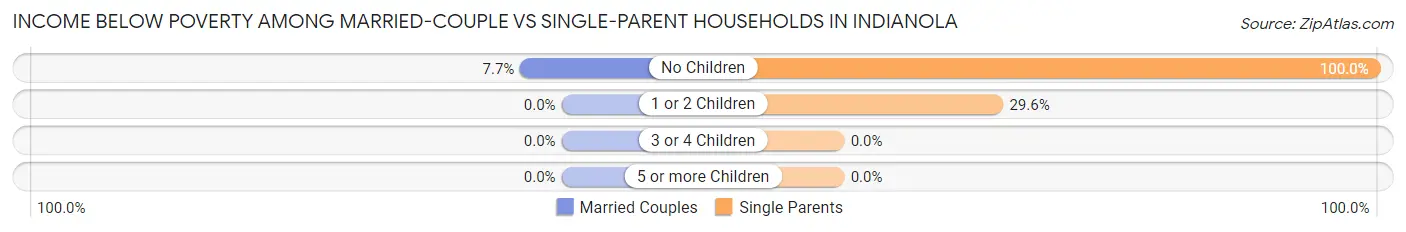
| Children | Married-Couple Families | Single-Parent Households |
| No Children | 9 (7.7%) | 7 (100.0%) |
| 1 or 2 Children | 0 (0.0%) | 21 (29.6%) |
| 3 or 4 Children | 0 (0.0%) | 0 (0.0%) |
| 5 or more Children | 0 (0.0%) | 0 (0.0%) |
| Total | 9 (6.2%) | 28 (35.9%) |
Race in Indianola
The most populous races in Indianola are White / Caucasian (681 | 95.0%), Hispanic or Latino (67 | 9.3%), and Some other Race (17 | 2.4%).
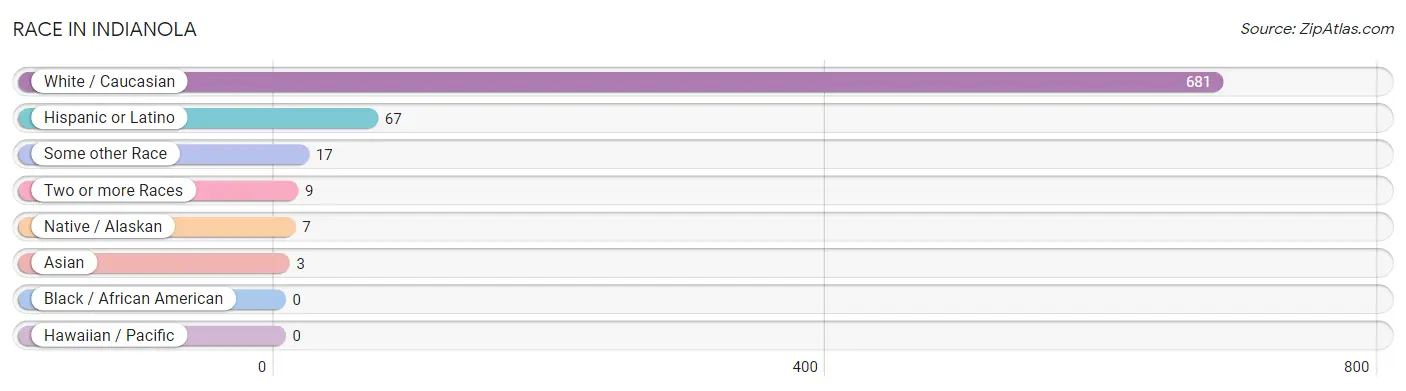
| Race | # Population | % Population |
| Asian | 3 | 0.4% |
| Black / African American | 0 | 0.0% |
| Hawaiian / Pacific | 0 | 0.0% |
| Hispanic or Latino | 67 | 9.3% |
| Native / Alaskan | 7 | 1.0% |
| White / Caucasian | 681 | 95.0% |
| Two or more Races | 9 | 1.3% |
| Some other Race | 17 | 2.4% |
| Total | 717 | 100.0% |
Ancestry in Indianola
The most populous ancestries reported in Indianola are German (110 | 15.3%), Irish (78 | 10.9%), Mexican (67 | 9.3%), European (66 | 9.2%), and Israeli (53 | 7.4%), together accounting for 52.2% of all Indianola residents.
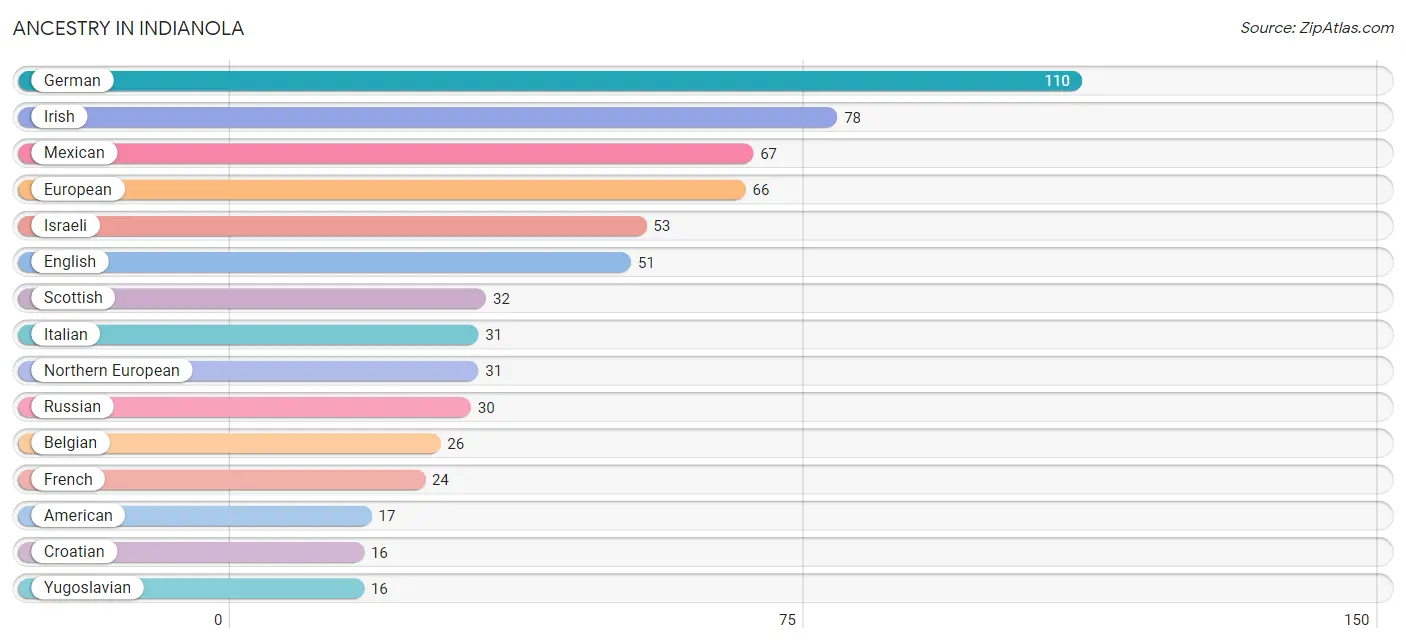
| Ancestry | # Population | % Population |
| American | 17 | 2.4% |
| Austrian | 9 | 1.3% |
| Belgian | 26 | 3.6% |
| Brazilian | 9 | 1.3% |
| Croatian | 16 | 2.2% |
| Danish | 5 | 0.7% |
| English | 51 | 7.1% |
| European | 66 | 9.2% |
| Finnish | 5 | 0.7% |
| French | 24 | 3.4% |
| German | 110 | 15.3% |
| Irish | 78 | 10.9% |
| Israeli | 53 | 7.4% |
| Italian | 31 | 4.3% |
| Lithuanian | 9 | 1.3% |
| Mexican | 67 | 9.3% |
| Northern European | 31 | 4.3% |
| Pakistani | 3 | 0.4% |
| Polish | 6 | 0.8% |
| Russian | 30 | 4.2% |
| Scandinavian | 5 | 0.7% |
| Scottish | 32 | 4.5% |
| Swedish | 8 | 1.1% |
| Welsh | 15 | 2.1% |
| Yugoslavian | 16 | 2.2% | View All 25 Rows |
Immigrants in Indianola
The most numerous immigrant groups reported in Indianola came from Brazil (9 | 1.3%), Latin America (9 | 1.3%), South America (9 | 1.3%), Canada (5 | 0.7%), and Europe (5 | 0.7%), together accounting for 5.2% of all Indianola residents.
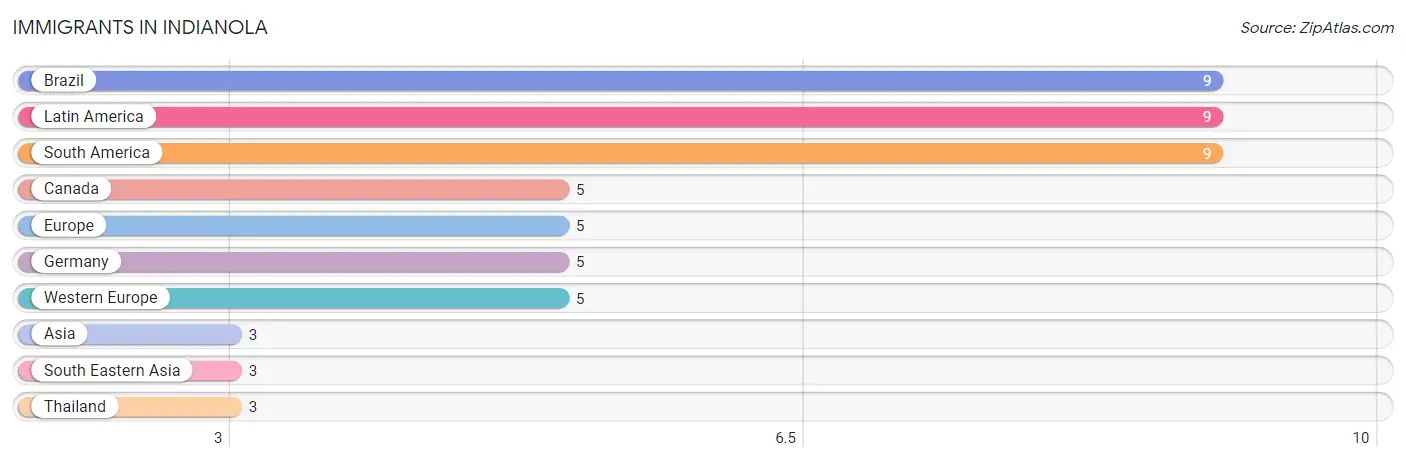
| Immigration Origin | # Population | % Population |
| Asia | 3 | 0.4% |
| Brazil | 9 | 1.3% |
| Canada | 5 | 0.7% |
| Europe | 5 | 0.7% |
| Germany | 5 | 0.7% |
| Latin America | 9 | 1.3% |
| South America | 9 | 1.3% |
| South Eastern Asia | 3 | 0.4% |
| Thailand | 3 | 0.4% |
| Western Europe | 5 | 0.7% | View All 10 Rows |
Sex and Age in Indianola
Sex and Age in Indianola
The most populous age groups in Indianola are 5 to 9 Years (64 | 15.6%) for men and 45 to 49 Years (52 | 16.9%) for women.
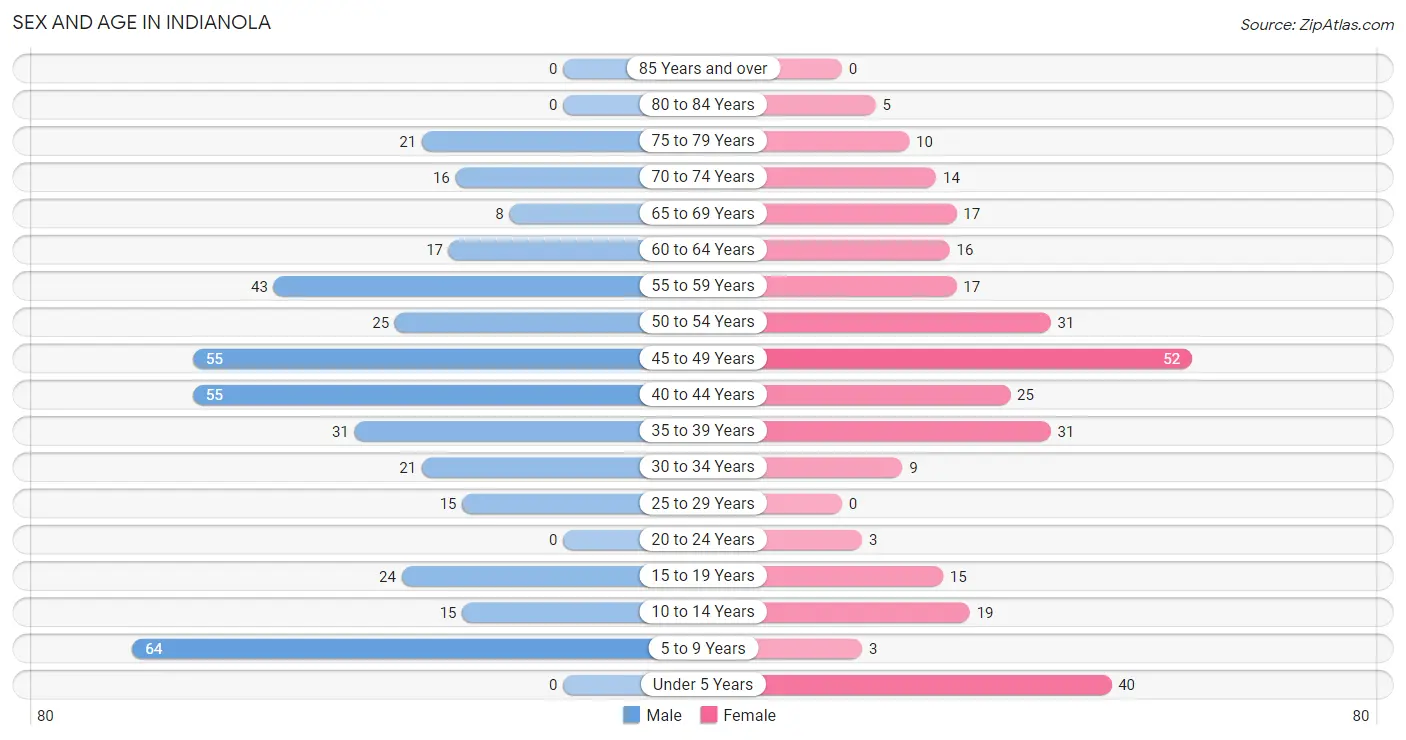
| Age Bracket | Male | Female |
| Under 5 Years | 0 (0.0%) | 40 (13.0%) |
| 5 to 9 Years | 64 (15.6%) | 3 (1.0%) |
| 10 to 14 Years | 15 (3.7%) | 19 (6.2%) |
| 15 to 19 Years | 24 (5.9%) | 15 (4.9%) |
| 20 to 24 Years | 0 (0.0%) | 3 (1.0%) |
| 25 to 29 Years | 15 (3.7%) | 0 (0.0%) |
| 30 to 34 Years | 21 (5.1%) | 9 (2.9%) |
| 35 to 39 Years | 31 (7.6%) | 31 (10.1%) |
| 40 to 44 Years | 55 (13.4%) | 25 (8.1%) |
| 45 to 49 Years | 55 (13.4%) | 52 (16.9%) |
| 50 to 54 Years | 25 (6.1%) | 31 (10.1%) |
| 55 to 59 Years | 43 (10.5%) | 17 (5.5%) |
| 60 to 64 Years | 17 (4.2%) | 16 (5.2%) |
| 65 to 69 Years | 8 (1.9%) | 17 (5.5%) |
| 70 to 74 Years | 16 (3.9%) | 14 (4.6%) |
| 75 to 79 Years | 21 (5.1%) | 10 (3.3%) |
| 80 to 84 Years | 0 (0.0%) | 5 (1.6%) |
| 85 Years and over | 0 (0.0%) | 0 (0.0%) |
| Total | 410 (100.0%) | 307 (100.0%) |
Families and Households in Indianola
Median Family Size in Indianola
The median family size in Indianola is 2.56 persons per family, with single male/father families (72 | 32.4%) accounting for the largest median family size of 2.74 persons per family. On the other hand, single female/mother families (6 | 2.7%) represent the smallest median family size with 1.67 persons per family.
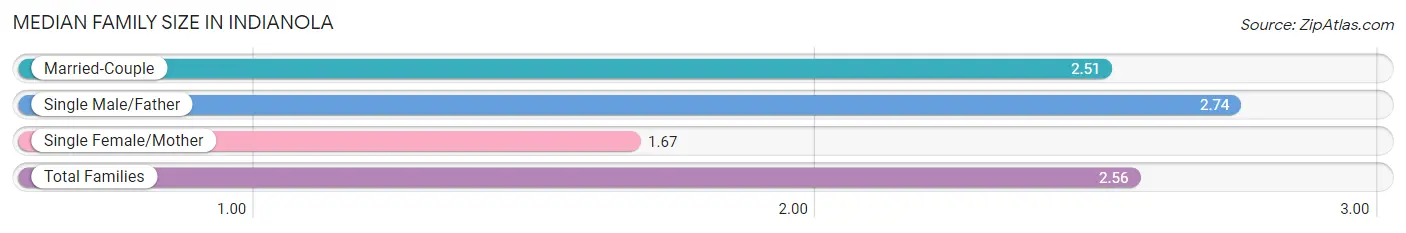
| Family Type | # Families | Family Size |
| Married-Couple | 144 (64.9%) | 2.51 |
| Single Male/Father | 72 (32.4%) | 2.74 |
| Single Female/Mother | 6 (2.7%) | 1.67 |
| Total Families | 222 (100.0%) | 2.56 |
Median Household Size in Indianola
The median household size in Indianola is 2.51 persons per household, with single male/father households (72 | 25.2%) accounting for the largest median household size of 3.28 persons per household. non-family households (64 | 22.4%) represent the smallest median household size with 1.59 persons per household.
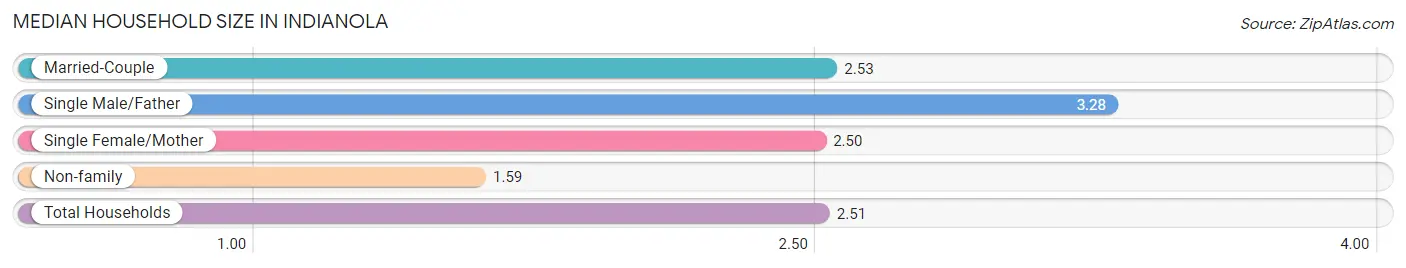
| Household Type | # Households | Household Size |
| Married-Couple | 144 (50.3%) | 2.53 |
| Single Male/Father | 72 (25.2%) | 3.28 |
| Single Female/Mother | 6 (2.1%) | 2.50 |
| Non-family | 64 (22.4%) | 1.59 |
| Total Households | 286 (100.0%) | 2.51 |
Household Size by Marriage Status in Indianola
Out of a total of 286 households in Indianola, 222 (77.6%) are family households, while 64 (22.4%) are nonfamily households. The most numerous type of family households are 2-person households, comprising 105, and the most common type of nonfamily households are 1-person households, comprising 37.
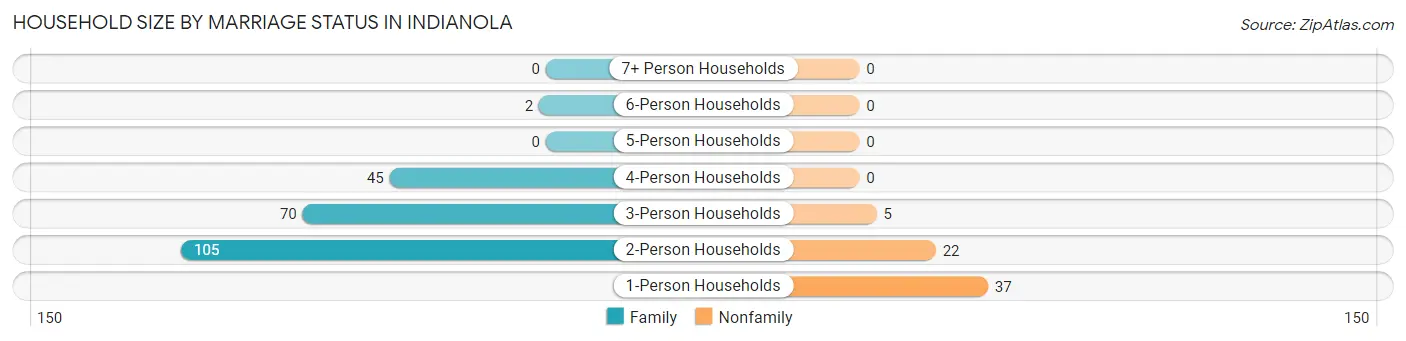
| Household Size | Family Households | Nonfamily Households |
| 1-Person Households | - | 37 (12.9%) |
| 2-Person Households | 105 (36.7%) | 22 (7.7%) |
| 3-Person Households | 70 (24.5%) | 5 (1.8%) |
| 4-Person Households | 45 (15.7%) | 0 (0.0%) |
| 5-Person Households | 0 (0.0%) | 0 (0.0%) |
| 6-Person Households | 2 (0.7%) | 0 (0.0%) |
| 7+ Person Households | 0 (0.0%) | 0 (0.0%) |
| Total | 222 (77.6%) | 64 (22.4%) |
Female Fertility in Indianola
Fertility by Age in Indianola
| Age Bracket | Women with Births | Births / 1,000 Women |
| 15 to 19 years | 0 (0.0%) | 0.0 |
| 20 to 34 years | 0 (0.0%) | 0.0 |
| 35 to 50 years | 0 (0.0%) | 0.0 |
| Total | 0 (0.0%) | 0.0 |
Fertility by Age by Marriage Status in Indianola
| Age Bracket | Married | Unmarried |
| 15 to 19 years | 0 (0.0%) | 0 (0.0%) |
| 20 to 34 years | 0 (0.0%) | 0 (0.0%) |
| 35 to 50 years | 0 (0.0%) | 0 (0.0%) |
| Total | 0 (0.0%) | 0 (0.0%) |
Fertility by Education in Indianola
| Educational Attainment | Women with Births | Births / 1,000 Women |
| Less than High School | 0 (0.0%) | 0.0 |
| High School Diploma | 0 (0.0%) | 0.0 |
| College or Associate's Degree | 0 (0.0%) | 0.0 |
| Bachelor's Degree | 0 (0.0%) | 0.0 |
| Graduate Degree | 0 (0.0%) | 0.0 |
| Total | 0 (0.0%) | 0.0 |
Fertility by Education by Marriage Status in Indianola
| Educational Attainment | Married | Unmarried |
| Less than High School | 0 (0.0%) | 0 (0.0%) |
| High School Diploma | 0 (0.0%) | 0 (0.0%) |
| College or Associate's Degree | 0 (0.0%) | 0 (0.0%) |
| Bachelor's Degree | 0 (0.0%) | 0 (0.0%) |
| Graduate Degree | 0 (0.0%) | 0 (0.0%) |
| Total | 0 (0.0%) | 0 (0.0%) |
Employment Characteristics in Indianola
Employment by Class of Employer in Indianola
Among the 275 employed individuals in Indianola, private company employees (111 | 40.4%), self-employed (not incorporated) (47 | 17.1%), and local government employees (44 | 16.0%) make up the most common classes of employment.
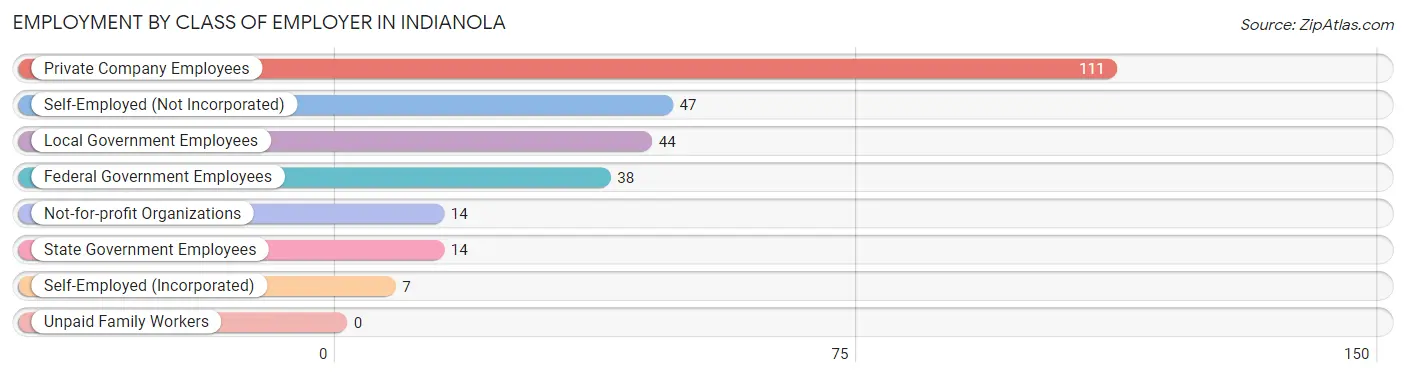
| Employer Class | # Employees | % Employees |
| Private Company Employees | 111 | 40.4% |
| Self-Employed (Incorporated) | 7 | 2.5% |
| Self-Employed (Not Incorporated) | 47 | 17.1% |
| Not-for-profit Organizations | 14 | 5.1% |
| Local Government Employees | 44 | 16.0% |
| State Government Employees | 14 | 5.1% |
| Federal Government Employees | 38 | 13.8% |
| Unpaid Family Workers | 0 | 0.0% |
| Total | 275 | 100.0% |
Employment Status by Age in Indianola
According to the labor force statistics for Indianola, out of the total population over 16 years of age (576), 58.7% or 338 individuals are in the labor force, with 18.6% or 63 of them unemployed. The age group with the highest labor force participation rate is 20 to 24 years, with 100.0% or 3 individuals in the labor force. Within the labor force, the 30 to 34 years age range has the highest percentage of unemployed individuals, with 100.0% or 21 of them being unemployed.
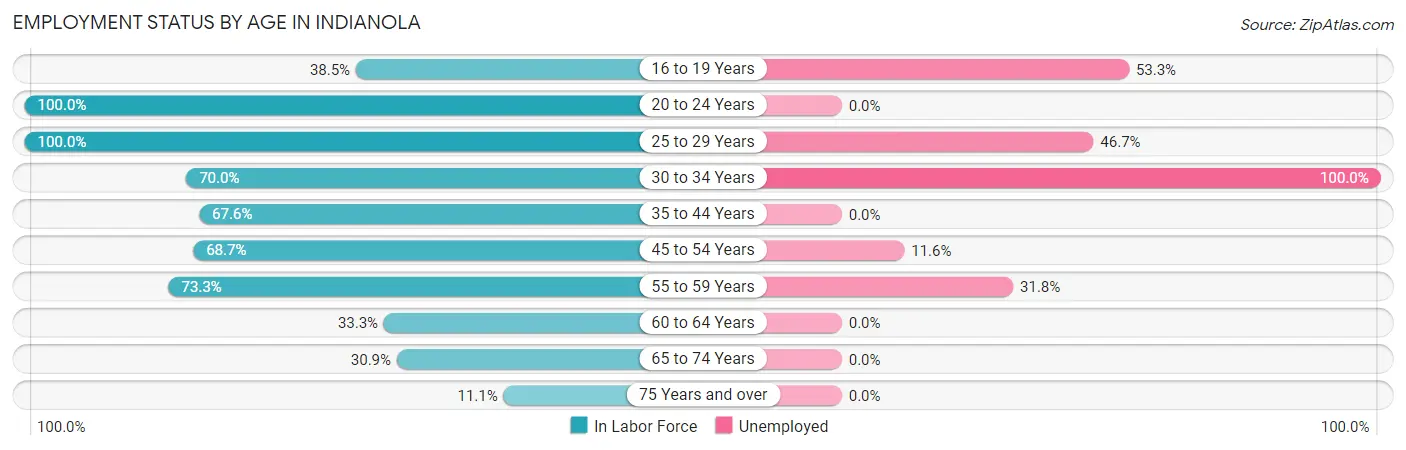
| Age Bracket | In Labor Force | Unemployed |
| 16 to 19 Years | 15 (38.5%) | 8 (53.3%) |
| 20 to 24 Years | 3 (100.0%) | 0 (0.0%) |
| 25 to 29 Years | 15 (100.0%) | 7 (46.7%) |
| 30 to 34 Years | 21 (70.0%) | 21 (100.0%) |
| 35 to 44 Years | 96 (67.6%) | 0 (0.0%) |
| 45 to 54 Years | 112 (68.7%) | 13 (11.6%) |
| 55 to 59 Years | 44 (73.3%) | 14 (31.8%) |
| 60 to 64 Years | 11 (33.3%) | 0 (0.0%) |
| 65 to 74 Years | 17 (30.9%) | 0 (0.0%) |
| 75 Years and over | 4 (11.1%) | 0 (0.0%) |
| Total | 338 (58.7%) | 63 (18.6%) |
Employment Status by Educational Attainment in Indianola
According to labor force statistics for Indianola, 67.5% of individuals (299) out of the total population between 25 and 64 years of age (443) are in the labor force, with 18.4% or 55 of them being unemployed. The group with the highest labor force participation rate are those with the educational attainment of bachelor's degree or higher, with 90.1% or 73 individuals in the labor force. Within the labor force, individuals with less than high school education have the highest percentage of unemployment, with 71.1% or 27 of them being unemployed.
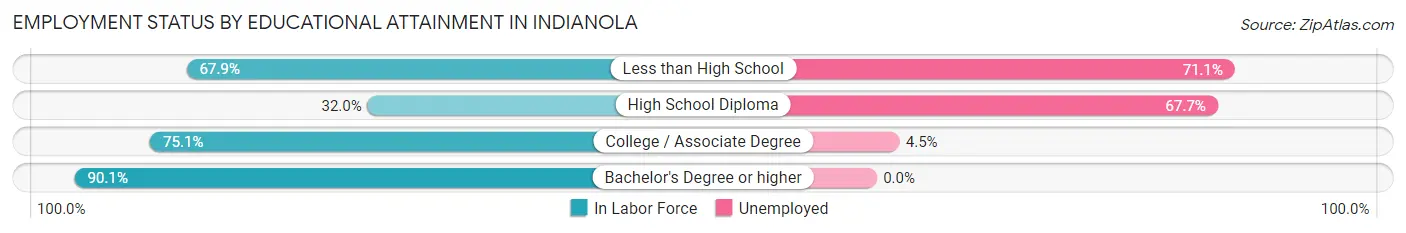
| Educational Attainment | In Labor Force | Unemployed |
| Less than High School | 38 (67.9%) | 40 (71.1%) |
| High School Diploma | 31 (32.0%) | 66 (67.7%) |
| College / Associate Degree | 157 (75.1%) | 9 (4.5%) |
| Bachelor's Degree or higher | 73 (90.1%) | 0 (0.0%) |
| Total | 299 (67.5%) | 82 (18.4%) |
Employment Occupations by Sex in Indianola
Management, Business, Science and Arts Occupations
The most common Management, Business, Science and Arts occupations in Indianola are Health Diagnosing & Treating (47 | 17.1%), Management (46 | 16.7%), Health Technologists (39 | 14.2%), Computers, Engineering & Science (13 | 4.7%), and Life, Physical & Social Science (8 | 2.9%).
Management, Business, Science and Arts Occupations by Sex
Within the Management, Business, Science and Arts occupations in Indianola, the most male-oriented occupations are Business & Financial (100.0%), Life, Physical & Social Science (62.5%), and Health Technologists (59.0%), while the most female-oriented occupations are Computers & Mathematics (100.0%), Computers, Engineering & Science (61.5%), and Health Diagnosing & Treating (51.1%).
| Occupation | Male | Female |
| Management | 25 (54.3%) | 21 (45.7%) |
| Business & Financial | 4 (100.0%) | 0 (0.0%) |
| Computers, Engineering & Science | 5 (38.5%) | 8 (61.5%) |
| Computers & Mathematics | 0 (0.0%) | 5 (100.0%) |
| Architecture & Engineering | 0 (0.0%) | 0 (0.0%) |
| Life, Physical & Social Science | 5 (62.5%) | 3 (37.5%) |
| Community & Social Service | 2 (50.0%) | 2 (50.0%) |
| Education, Arts & Media | 0 (0.0%) | 0 (0.0%) |
| Legal Services & Support | 0 (0.0%) | 0 (0.0%) |
| Education Instruction & Library | 2 (50.0%) | 2 (50.0%) |
| Arts, Media & Entertainment | 0 (0.0%) | 0 (0.0%) |
| Health Diagnosing & Treating | 23 (48.9%) | 24 (51.1%) |
| Health Technologists | 23 (59.0%) | 16 (41.0%) |
| Total (Category) | 59 (51.7%) | 55 (48.2%) |
| Total (Overall) | 161 (58.6%) | 114 (41.4%) |
Services Occupations
The most common Services occupations in Indianola are Healthcare Support (20 | 7.3%), Food Preparation & Serving (12 | 4.4%), Personal Care & Service (5 | 1.8%), Security & Protection (4 | 1.5%), and Firefighting & Prevention (4 | 1.5%).
Services Occupations by Sex
Within the Services occupations in Indianola, the most male-oriented occupations are Security & Protection (100.0%), Firefighting & Prevention (100.0%), and Food Preparation & Serving (100.0%), while the most female-oriented occupations are Healthcare Support (100.0%), and Personal Care & Service (100.0%).
| Occupation | Male | Female |
| Healthcare Support | 0 (0.0%) | 20 (100.0%) |
| Security & Protection | 4 (100.0%) | 0 (0.0%) |
| Firefighting & Prevention | 4 (100.0%) | 0 (0.0%) |
| Law Enforcement | 0 (0.0%) | 0 (0.0%) |
| Food Preparation & Serving | 12 (100.0%) | 0 (0.0%) |
| Cleaning & Maintenance | 0 (0.0%) | 0 (0.0%) |
| Personal Care & Service | 0 (0.0%) | 5 (100.0%) |
| Total (Category) | 16 (39.0%) | 25 (61.0%) |
| Total (Overall) | 161 (58.6%) | 114 (41.4%) |
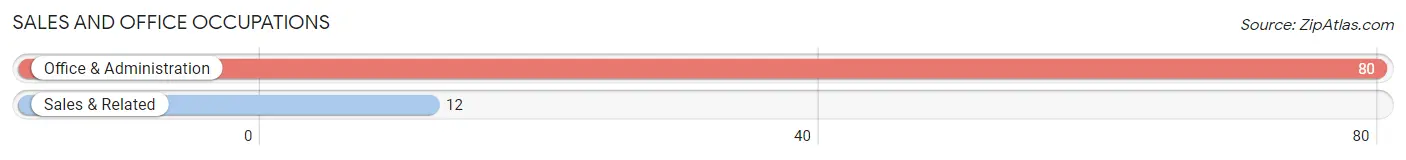
Sales and Office Occupations
The most common Sales and Office occupations in Indianola are Office & Administration (80 | 29.1%), and Sales & Related (12 | 4.4%).
Sales and Office Occupations by Sex
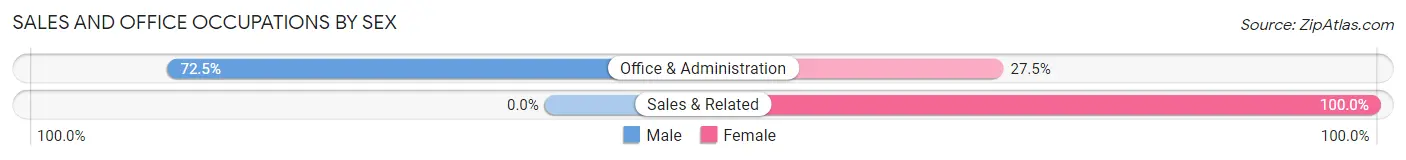
| Occupation | Male | Female |
| Sales & Related | 0 (0.0%) | 12 (100.0%) |
| Office & Administration | 58 (72.5%) | 22 (27.5%) |
| Total (Category) | 58 (63.0%) | 34 (37.0%) |
| Total (Overall) | 161 (58.6%) | 114 (41.4%) |
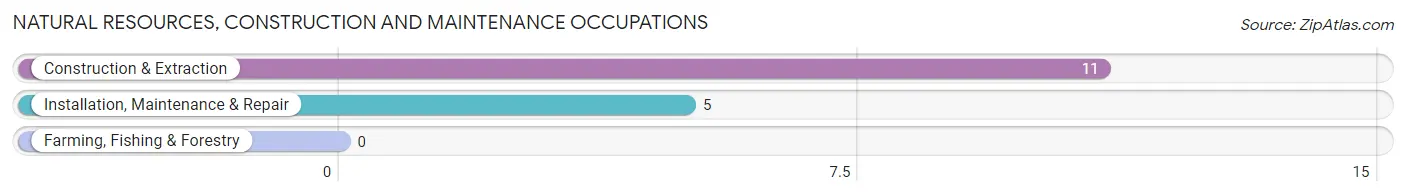
Natural Resources, Construction and Maintenance Occupations
The most common Natural Resources, Construction and Maintenance occupations in Indianola are Construction & Extraction (11 | 4.0%), and Installation, Maintenance & Repair (5 | 1.8%).
Natural Resources, Construction and Maintenance Occupations by Sex
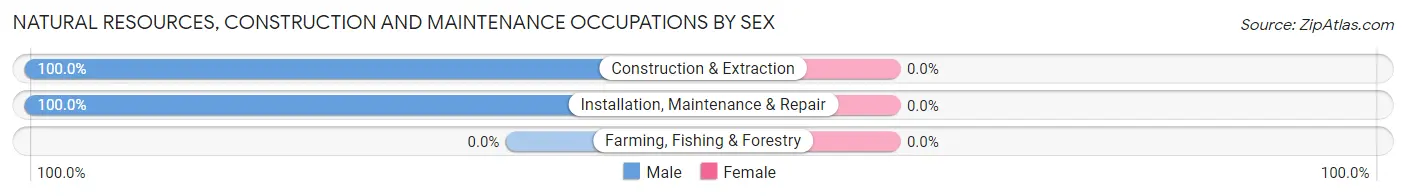
| Occupation | Male | Female |
| Farming, Fishing & Forestry | 0 (0.0%) | 0 (0.0%) |
| Construction & Extraction | 11 (100.0%) | 0 (0.0%) |
| Installation, Maintenance & Repair | 5 (100.0%) | 0 (0.0%) |
| Total (Category) | 16 (100.0%) | 0 (0.0%) |
| Total (Overall) | 161 (58.6%) | 114 (41.4%) |
Production, Transportation and Moving Occupations
The most common Production, Transportation and Moving occupations in Indianola are Production (6 | 2.2%), and Transportation (6 | 2.2%).
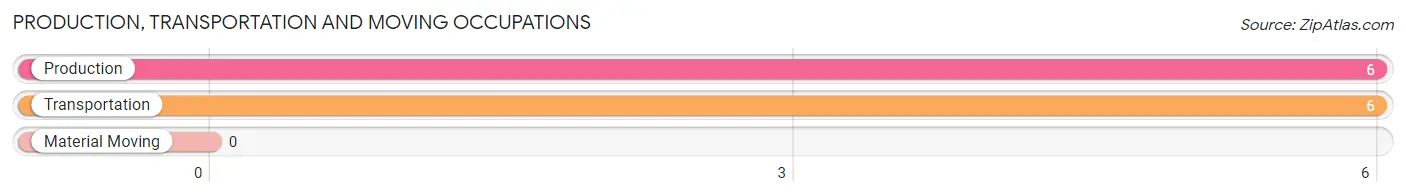
Production, Transportation and Moving Occupations by Sex
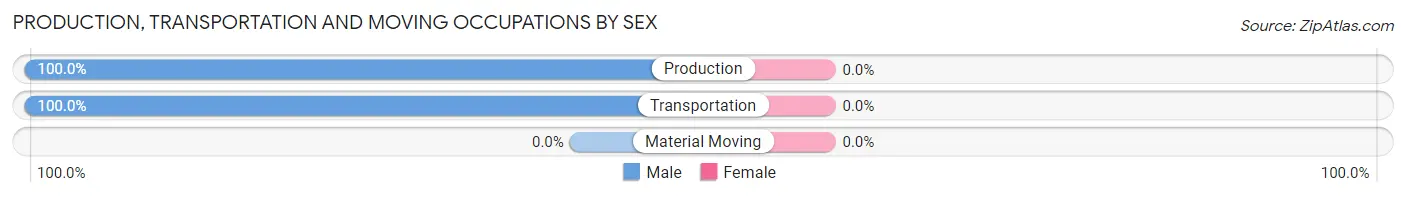
| Occupation | Male | Female |
| Production | 6 (100.0%) | 0 (0.0%) |
| Transportation | 6 (100.0%) | 0 (0.0%) |
| Material Moving | 0 (0.0%) | 0 (0.0%) |
| Total (Category) | 12 (100.0%) | 0 (0.0%) |
| Total (Overall) | 161 (58.6%) | 114 (41.4%) |
Employment Industries by Sex in Indianola
Employment Industries in Indianola
The major employment industries in Indianola include Health Care & Social Assistance (59 | 21.4%), Transportation & Warehousing (41 | 14.9%), Public Administration (29 | 10.5%), Construction (27 | 9.8%), and Accommodation & Food Services (25 | 9.1%).
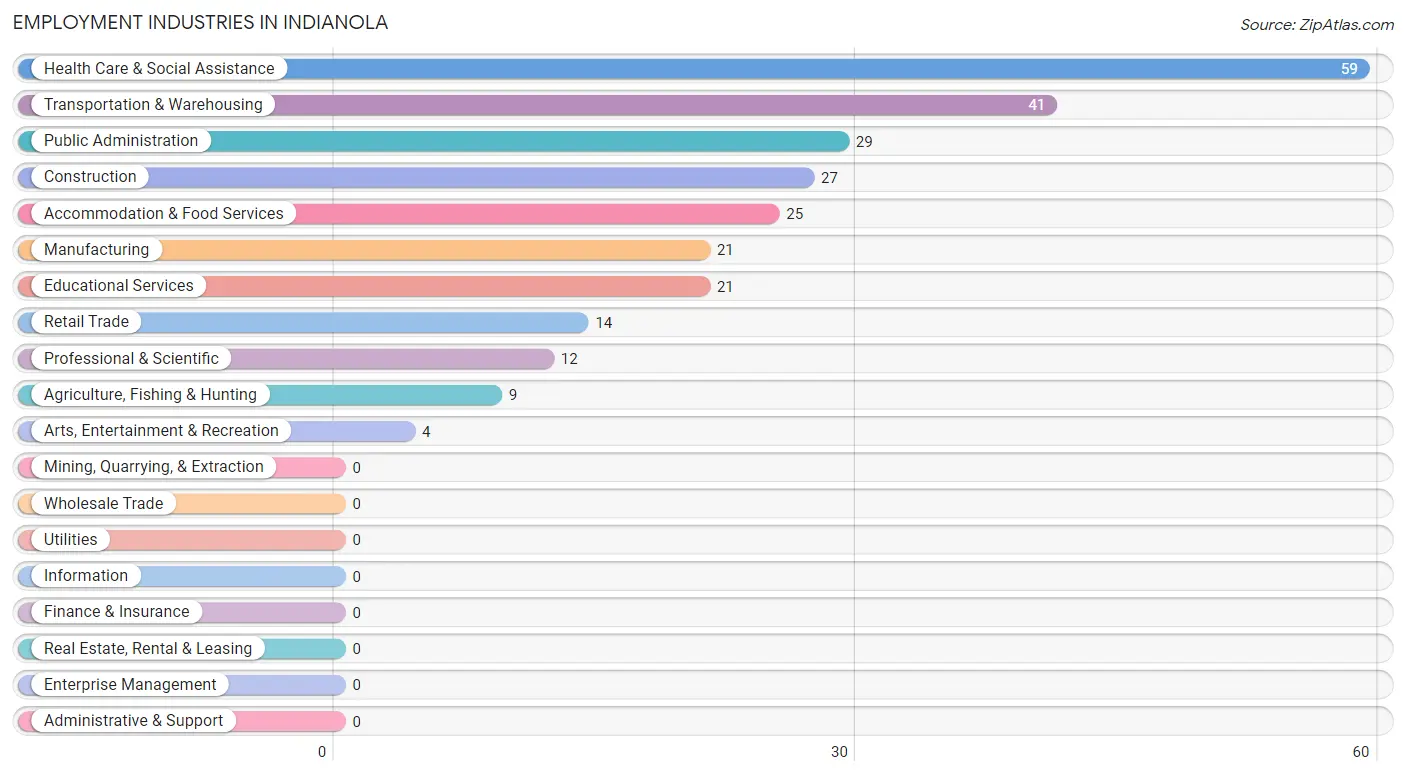
Employment Industries by Sex in Indianola
The Indianola industries that see more men than women are Construction (100.0%), Manufacturing (100.0%), and Arts, Entertainment & Recreation (100.0%), whereas the industries that tend to have a higher number of women are Agriculture, Fishing & Hunting (100.0%), Public Administration (82.8%), and Professional & Scientific (66.7%).
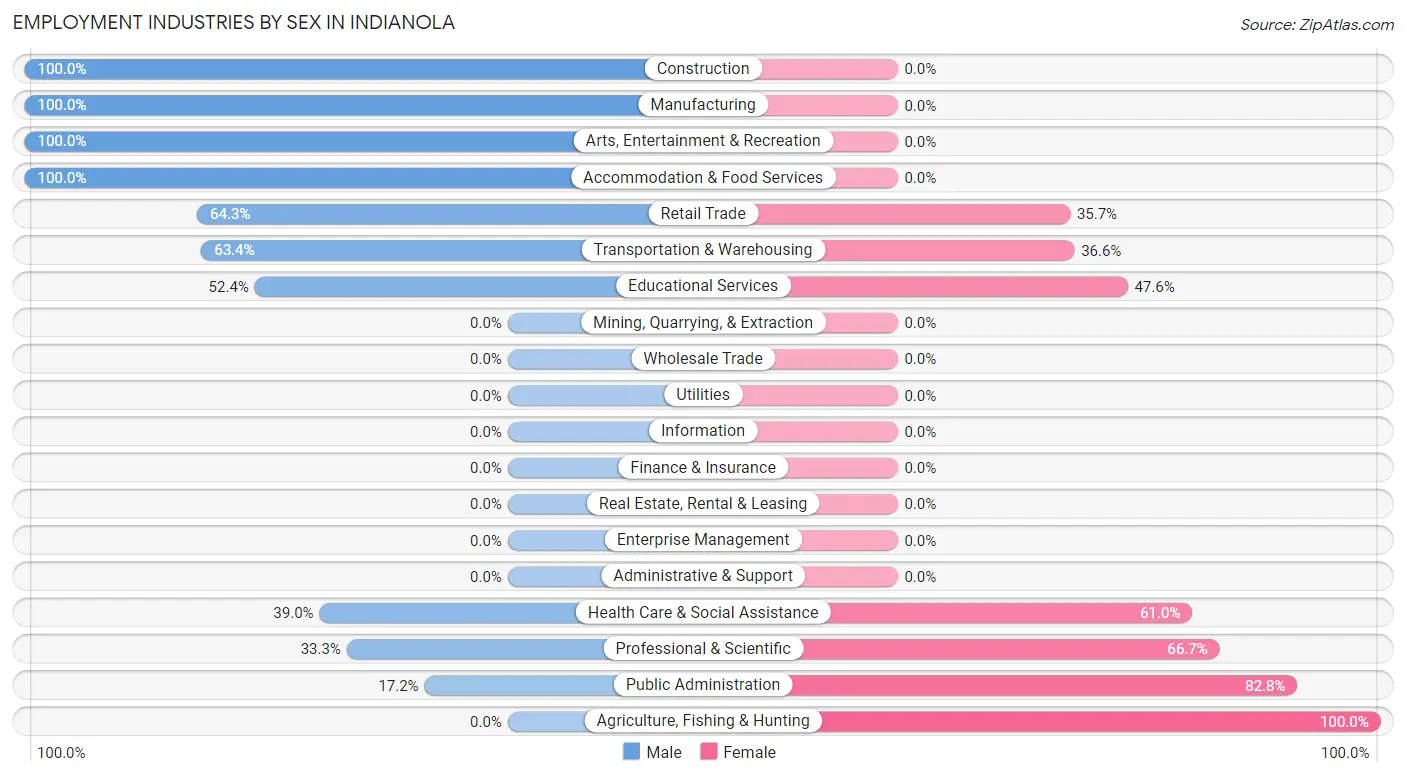
| Industry | Male | Female |
| Agriculture, Fishing & Hunting | 0 (0.0%) | 9 (100.0%) |
| Mining, Quarrying, & Extraction | 0 (0.0%) | 0 (0.0%) |
| Construction | 27 (100.0%) | 0 (0.0%) |
| Manufacturing | 21 (100.0%) | 0 (0.0%) |
| Wholesale Trade | 0 (0.0%) | 0 (0.0%) |
| Retail Trade | 9 (64.3%) | 5 (35.7%) |
| Transportation & Warehousing | 26 (63.4%) | 15 (36.6%) |
| Utilities | 0 (0.0%) | 0 (0.0%) |
| Information | 0 (0.0%) | 0 (0.0%) |
| Finance & Insurance | 0 (0.0%) | 0 (0.0%) |
| Real Estate, Rental & Leasing | 0 (0.0%) | 0 (0.0%) |
| Professional & Scientific | 4 (33.3%) | 8 (66.7%) |
| Enterprise Management | 0 (0.0%) | 0 (0.0%) |
| Administrative & Support | 0 (0.0%) | 0 (0.0%) |
| Educational Services | 11 (52.4%) | 10 (47.6%) |
| Health Care & Social Assistance | 23 (39.0%) | 36 (61.0%) |
| Arts, Entertainment & Recreation | 4 (100.0%) | 0 (0.0%) |
| Accommodation & Food Services | 25 (100.0%) | 0 (0.0%) |
| Public Administration | 5 (17.2%) | 24 (82.8%) |
| Total | 161 (58.6%) | 114 (41.4%) |
Education in Indianola
School Enrollment in Indianola
The most common levels of schooling among the 143 students in Indianola are elementary school (51 | 35.7%), middle school (34 | 23.8%), and high school (22 | 15.4%).
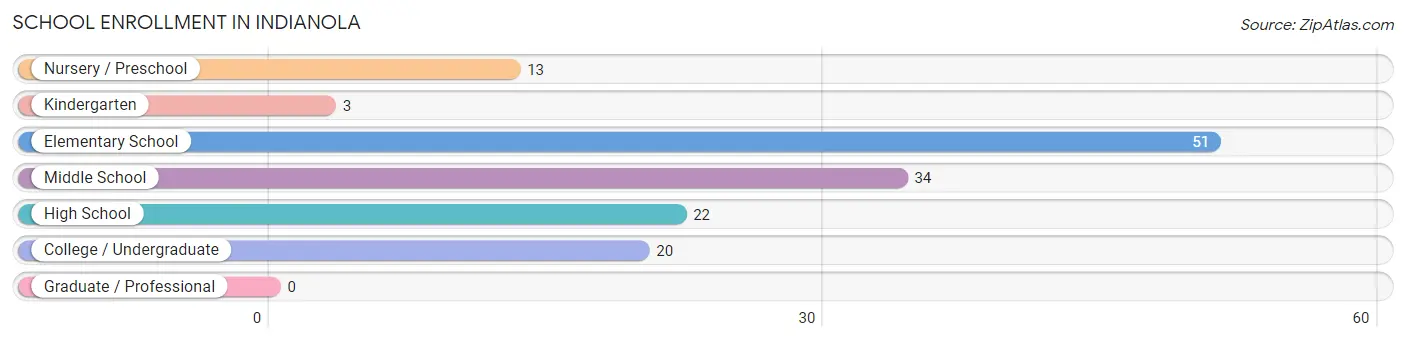
| School Level | # Students | % Students |
| Nursery / Preschool | 13 | 9.1% |
| Kindergarten | 3 | 2.1% |
| Elementary School | 51 | 35.7% |
| Middle School | 34 | 23.8% |
| High School | 22 | 15.4% |
| College / Undergraduate | 20 | 14.0% |
| Graduate / Professional | 0 | 0.0% |
| Total | 143 | 100.0% |
School Enrollment by Age by Funding Source in Indianola
Out of a total of 143 students who are enrolled in schools in Indianola, 19 (13.3%) attend a private institution, while the remaining 124 (86.7%) are enrolled in public schools. The age group of 10 to 14 year olds has the highest likelihood of being enrolled in private schools, with 19 (55.9% in the age bracket) enrolled. Conversely, the age group of 5 to 9 year old has the lowest likelihood of being enrolled in a private school, with 67 (100.0% in the age bracket) attending a public institution.
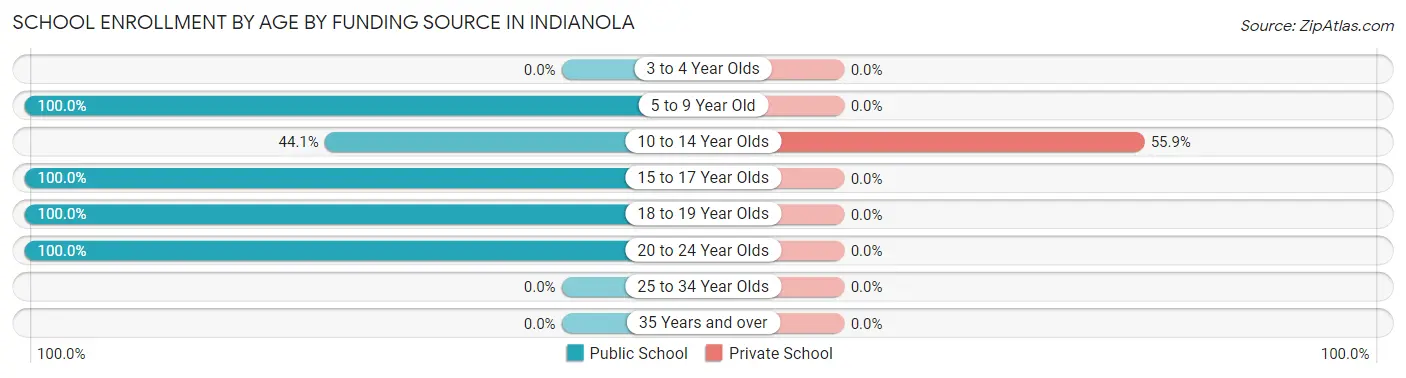
| Age Bracket | Public School | Private School |
| 3 to 4 Year Olds | 0 (0.0%) | 0 (0.0%) |
| 5 to 9 Year Old | 67 (100.0%) | 0 (0.0%) |
| 10 to 14 Year Olds | 15 (44.1%) | 19 (55.9%) |
| 15 to 17 Year Olds | 19 (100.0%) | 0 (0.0%) |
| 18 to 19 Year Olds | 20 (100.0%) | 0 (0.0%) |
| 20 to 24 Year Olds | 3 (100.0%) | 0 (0.0%) |
| 25 to 34 Year Olds | 0 (0.0%) | 0 (0.0%) |
| 35 Years and over | 0 (0.0%) | 0 (0.0%) |
| Total | 124 (86.7%) | 19 (13.3%) |
Educational Attainment by Field of Study in Indianola
Bio, nature & agricultural (39 | 33.6%), visual & performing arts (19 | 16.4%), social sciences (17 | 14.7%), education (13 | 11.2%), and business (11 | 9.5%) are the most common fields of study among 116 individuals in Indianola who have obtained a bachelor's degree or higher.
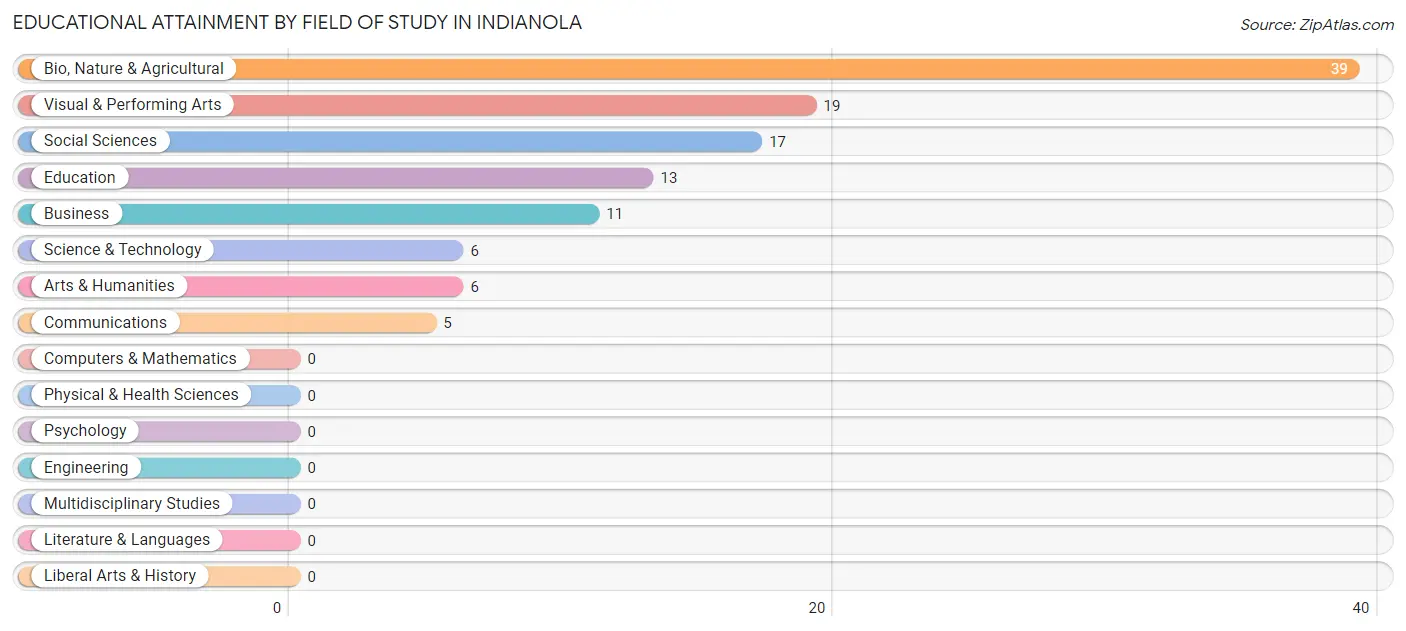
| Field of Study | # Graduates | % Graduates |
| Computers & Mathematics | 0 | 0.0% |
| Bio, Nature & Agricultural | 39 | 33.6% |
| Physical & Health Sciences | 0 | 0.0% |
| Psychology | 0 | 0.0% |
| Social Sciences | 17 | 14.7% |
| Engineering | 0 | 0.0% |
| Multidisciplinary Studies | 0 | 0.0% |
| Science & Technology | 6 | 5.2% |
| Business | 11 | 9.5% |
| Education | 13 | 11.2% |
| Literature & Languages | 0 | 0.0% |
| Liberal Arts & History | 0 | 0.0% |
| Visual & Performing Arts | 19 | 16.4% |
| Communications | 5 | 4.3% |
| Arts & Humanities | 6 | 5.2% |
| Total | 116 | 100.0% |
Transportation & Commute in Indianola
Vehicle Availability by Sex in Indianola
The most prevalent vehicle ownership categories in Indianola are males with 2 vehicles (93, accounting for 57.8%) and females with 2 vehicles (31, making up 81.6%).
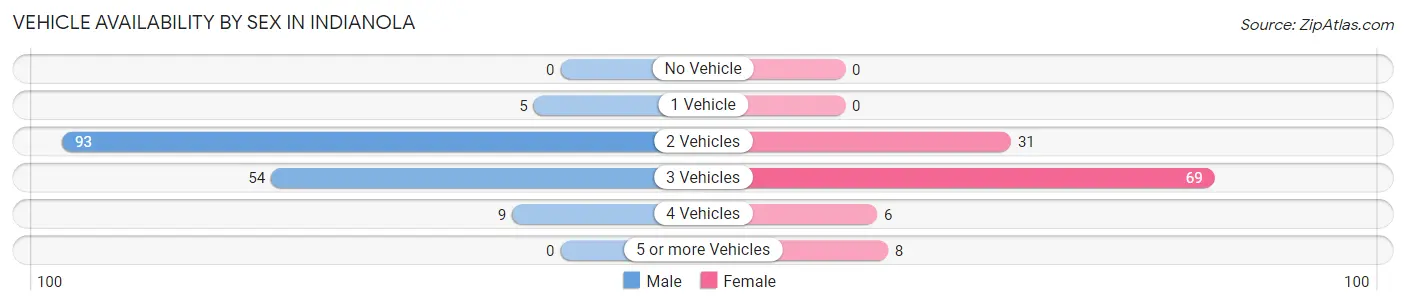
| Vehicles Available | Male | Female |
| No Vehicle | 0 (0.0%) | 0 (0.0%) |
| 1 Vehicle | 5 (3.1%) | 0 (0.0%) |
| 2 Vehicles | 93 (57.8%) | 31 (27.2%) |
| 3 Vehicles | 54 (33.5%) | 69 (60.5%) |
| 4 Vehicles | 9 (5.6%) | 6 (5.3%) |
| 5 or more Vehicles | 0 (0.0%) | 8 (7.0%) |
| Total | 161 (100.0%) | 114 (100.0%) |
Commute Time in Indianola
The most frequently occuring commute durations in Indianola are 20 to 24 minutes (95 commuters, 34.5%), 15 to 19 minutes (88 commuters, 32.0%), and 10 to 14 minutes (48 commuters, 17.4%).
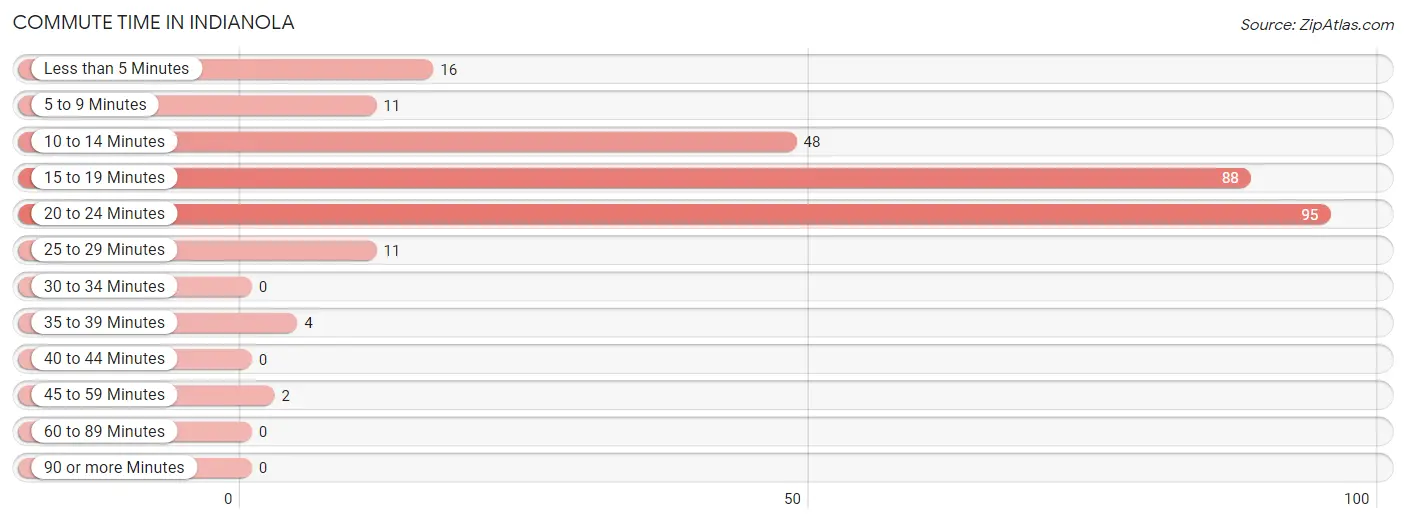
| Commute Time | # Commuters | % Commuters |
| Less than 5 Minutes | 16 | 5.8% |
| 5 to 9 Minutes | 11 | 4.0% |
| 10 to 14 Minutes | 48 | 17.4% |
| 15 to 19 Minutes | 88 | 32.0% |
| 20 to 24 Minutes | 95 | 34.5% |
| 25 to 29 Minutes | 11 | 4.0% |
| 30 to 34 Minutes | 0 | 0.0% |
| 35 to 39 Minutes | 4 | 1.5% |
| 40 to 44 Minutes | 0 | 0.0% |
| 45 to 59 Minutes | 2 | 0.7% |
| 60 to 89 Minutes | 0 | 0.0% |
| 90 or more Minutes | 0 | 0.0% |
Commute Time by Sex in Indianola
The most common commute times in Indianola are 20 to 24 minutes (66 commuters, 41.0%) for males and 15 to 19 minutes (41 commuters, 36.0%) for females.
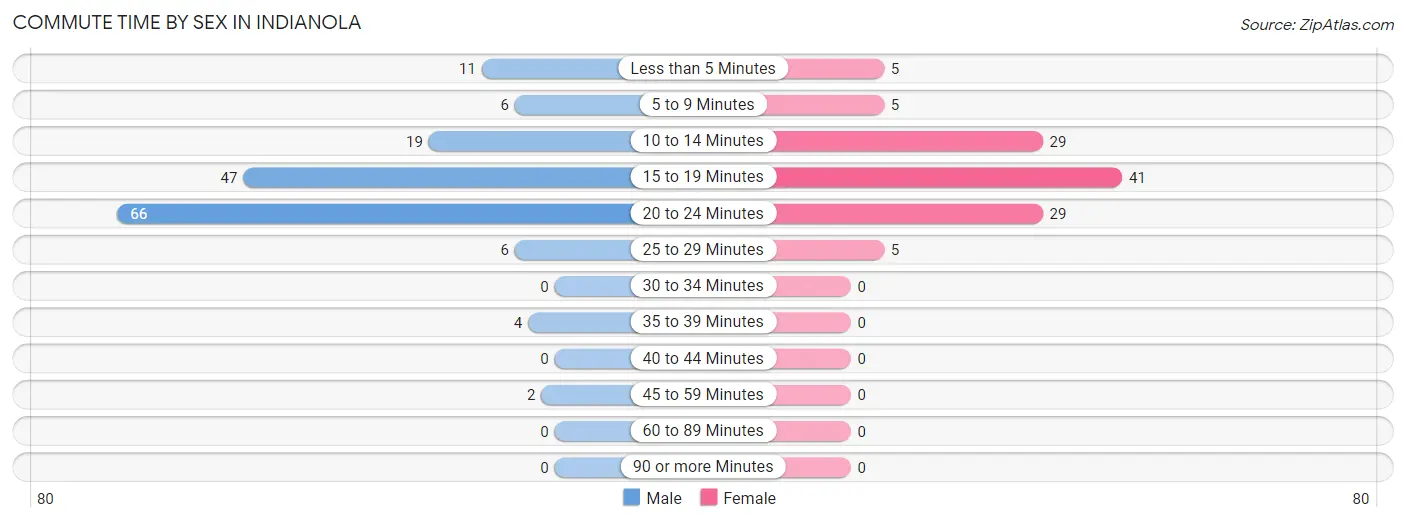
| Commute Time | Male | Female |
| Less than 5 Minutes | 11 (6.8%) | 5 (4.4%) |
| 5 to 9 Minutes | 6 (3.7%) | 5 (4.4%) |
| 10 to 14 Minutes | 19 (11.8%) | 29 (25.4%) |
| 15 to 19 Minutes | 47 (29.2%) | 41 (36.0%) |
| 20 to 24 Minutes | 66 (41.0%) | 29 (25.4%) |
| 25 to 29 Minutes | 6 (3.7%) | 5 (4.4%) |
| 30 to 34 Minutes | 0 (0.0%) | 0 (0.0%) |
| 35 to 39 Minutes | 4 (2.5%) | 0 (0.0%) |
| 40 to 44 Minutes | 0 (0.0%) | 0 (0.0%) |
| 45 to 59 Minutes | 2 (1.2%) | 0 (0.0%) |
| 60 to 89 Minutes | 0 (0.0%) | 0 (0.0%) |
| 90 or more Minutes | 0 (0.0%) | 0 (0.0%) |
Time of Departure to Work by Sex in Indianola
The most frequent times of departure to work in Indianola are 8:00 AM to 8:29 AM (43, 26.7%) for males and 7:00 AM to 7:29 AM (29, 25.4%) for females.
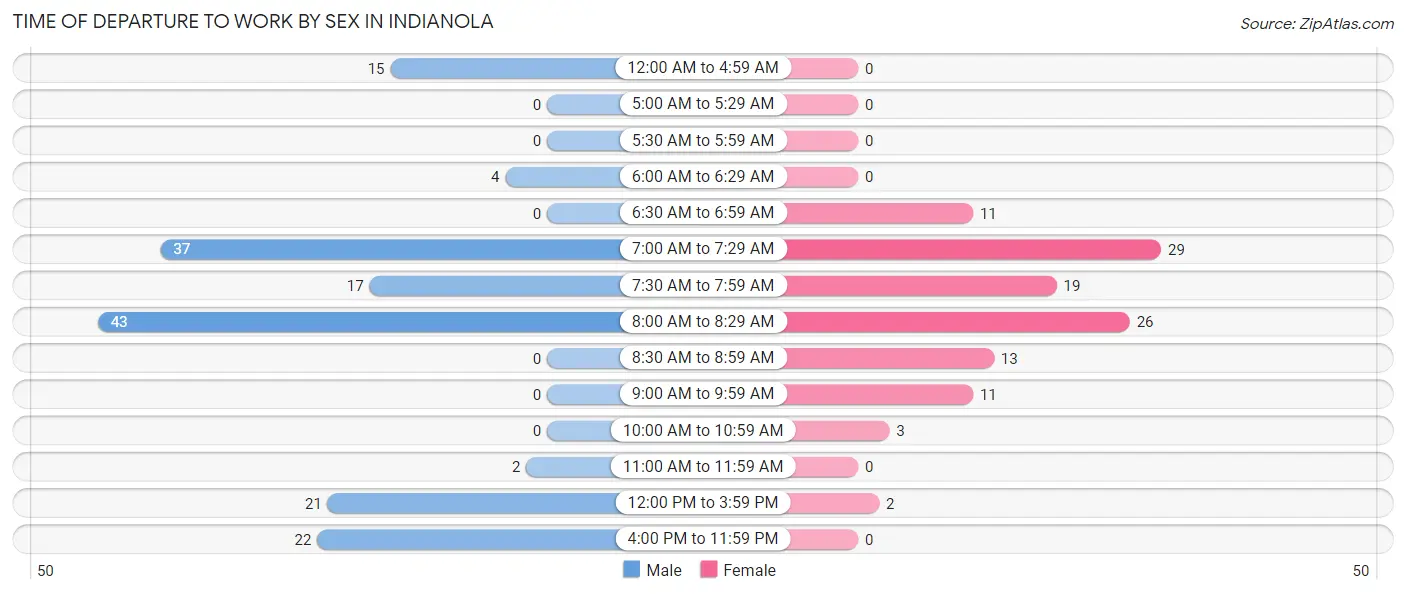
| Time of Departure | Male | Female |
| 12:00 AM to 4:59 AM | 15 (9.3%) | 0 (0.0%) |
| 5:00 AM to 5:29 AM | 0 (0.0%) | 0 (0.0%) |
| 5:30 AM to 5:59 AM | 0 (0.0%) | 0 (0.0%) |
| 6:00 AM to 6:29 AM | 4 (2.5%) | 0 (0.0%) |
| 6:30 AM to 6:59 AM | 0 (0.0%) | 11 (9.7%) |
| 7:00 AM to 7:29 AM | 37 (23.0%) | 29 (25.4%) |
| 7:30 AM to 7:59 AM | 17 (10.6%) | 19 (16.7%) |
| 8:00 AM to 8:29 AM | 43 (26.7%) | 26 (22.8%) |
| 8:30 AM to 8:59 AM | 0 (0.0%) | 13 (11.4%) |
| 9:00 AM to 9:59 AM | 0 (0.0%) | 11 (9.7%) |
| 10:00 AM to 10:59 AM | 0 (0.0%) | 3 (2.6%) |
| 11:00 AM to 11:59 AM | 2 (1.2%) | 0 (0.0%) |
| 12:00 PM to 3:59 PM | 21 (13.0%) | 2 (1.8%) |
| 4:00 PM to 11:59 PM | 22 (13.7%) | 0 (0.0%) |
| Total | 161 (100.0%) | 114 (100.0%) |
Housing Occupancy in Indianola
Occupancy by Ownership in Indianola
Of the total 286 dwellings in Indianola, owner-occupied units account for 180 (62.9%), while renter-occupied units make up 106 (37.1%).
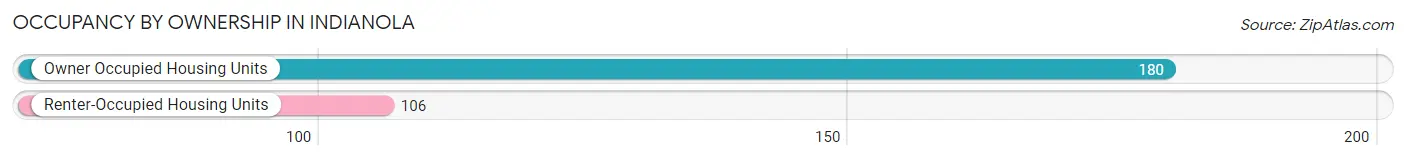
| Occupancy | # Housing Units | % Housing Units |
| Owner Occupied Housing Units | 180 | 62.9% |
| Renter-Occupied Housing Units | 106 | 37.1% |
| Total Occupied Housing Units | 286 | 100.0% |
Occupancy by Household Size in Indianola
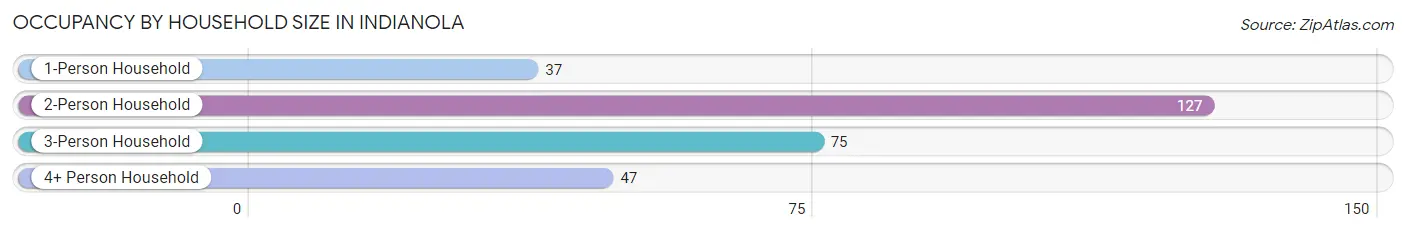
| Household Size | # Housing Units | % Housing Units |
| 1-Person Household | 37 | 12.9% |
| 2-Person Household | 127 | 44.4% |
| 3-Person Household | 75 | 26.2% |
| 4+ Person Household | 47 | 16.4% |
| Total Housing Units | 286 | 100.0% |
Occupancy by Ownership by Household Size in Indianola
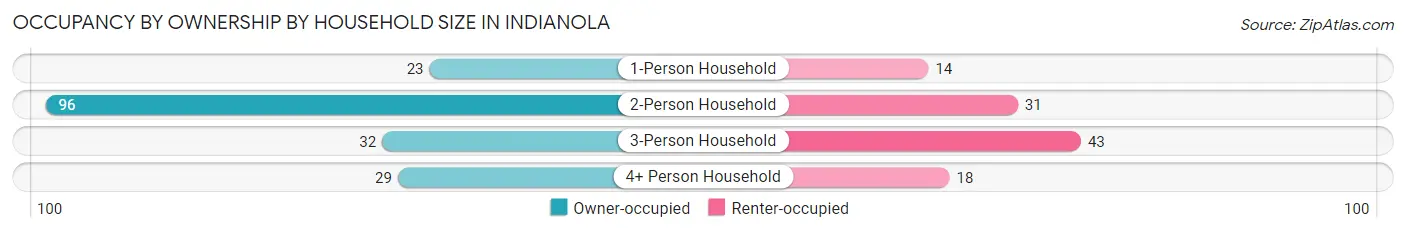
| Household Size | Owner-occupied | Renter-occupied |
| 1-Person Household | 23 (62.2%) | 14 (37.8%) |
| 2-Person Household | 96 (75.6%) | 31 (24.4%) |
| 3-Person Household | 32 (42.7%) | 43 (57.3%) |
| 4+ Person Household | 29 (61.7%) | 18 (38.3%) |
| Total Housing Units | 180 (62.9%) | 106 (37.1%) |
Occupancy by Educational Attainment in Indianola
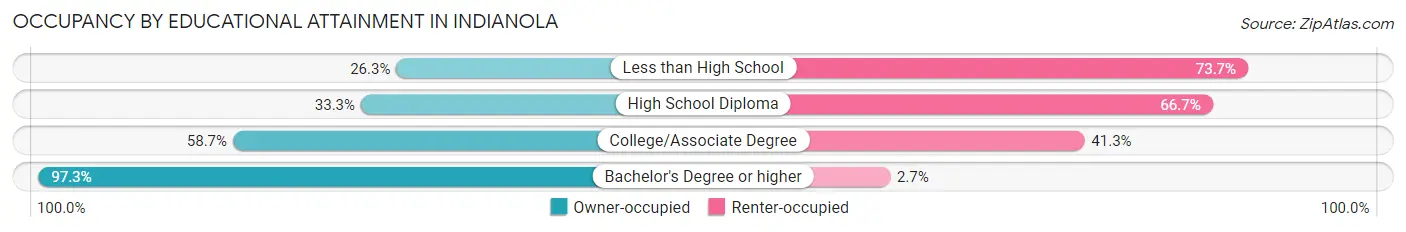
| Household Size | Owner-occupied | Renter-occupied |
| Less than High School | 5 (26.3%) | 14 (73.7%) |
| High School Diploma | 13 (33.3%) | 26 (66.7%) |
| College/Associate Degree | 91 (58.7%) | 64 (41.3%) |
| Bachelor's Degree or higher | 71 (97.3%) | 2 (2.7%) |
Occupancy by Age of Householder in Indianola
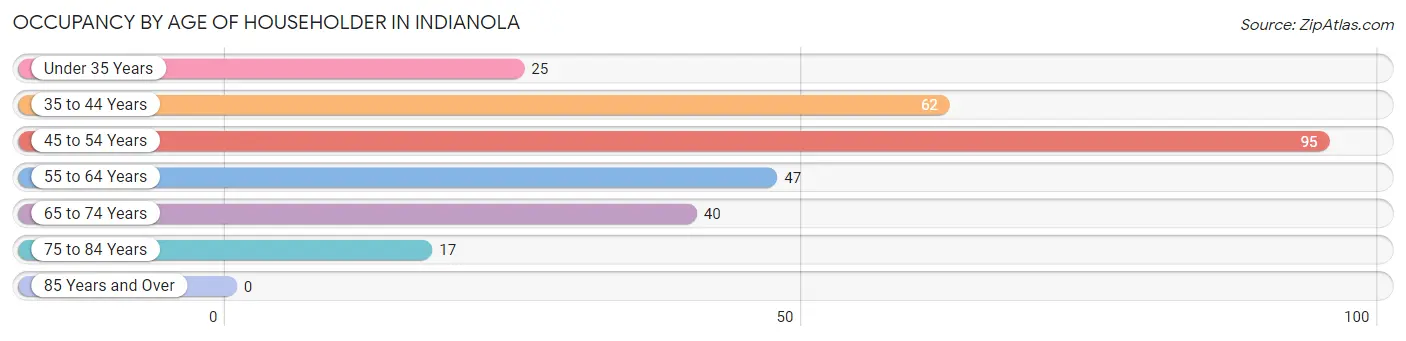
| Age Bracket | # Households | % Households |
| Under 35 Years | 25 | 8.7% |
| 35 to 44 Years | 62 | 21.7% |
| 45 to 54 Years | 95 | 33.2% |
| 55 to 64 Years | 47 | 16.4% |
| 65 to 74 Years | 40 | 14.0% |
| 75 to 84 Years | 17 | 5.9% |
| 85 Years and Over | 0 | 0.0% |
| Total | 286 | 100.0% |
Housing Finances in Indianola
Median Income by Occupancy in Indianola
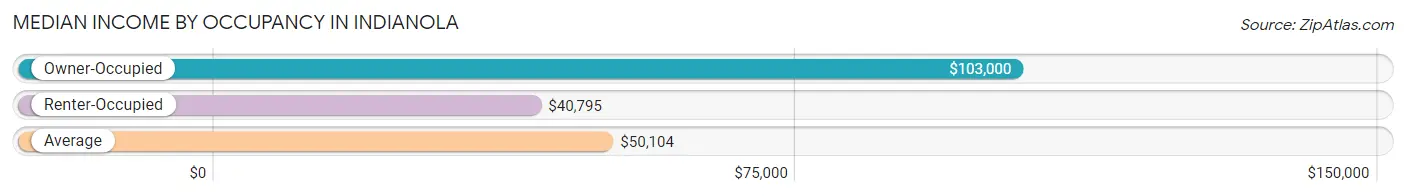
| Occupancy Type | # Households | Median Income |
| Owner-Occupied | 180 (62.9%) | $103,000 |
| Renter-Occupied | 106 (37.1%) | $40,795 |
| Average | 286 (100.0%) | $50,104 |
Occupancy by Householder Income Bracket in Indianola
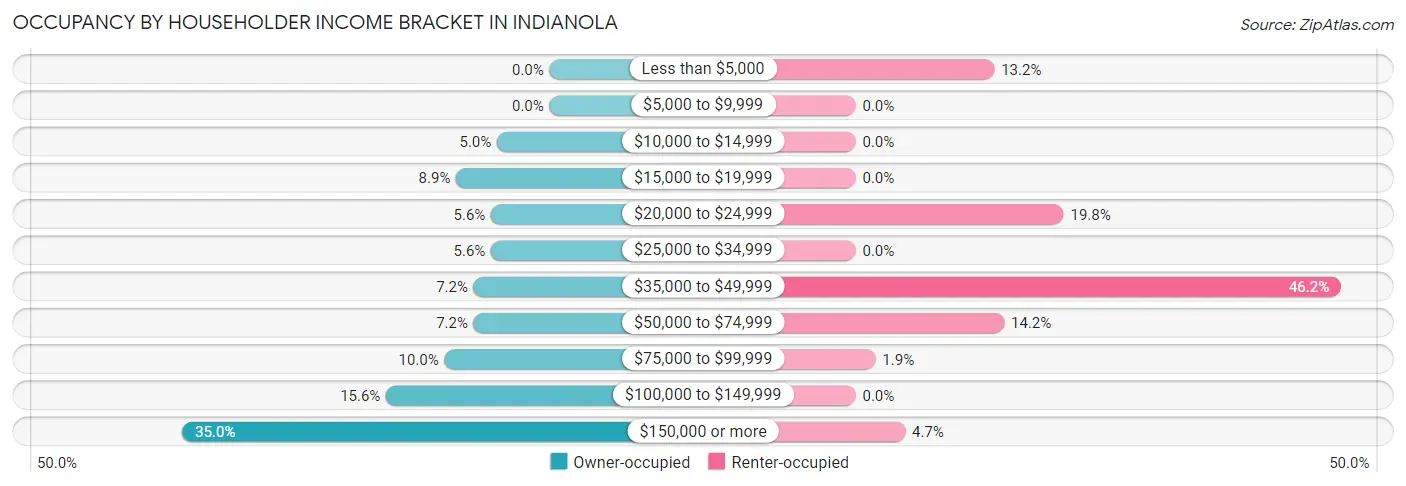
| Income Bracket | Owner-occupied | Renter-occupied |
| Less than $5,000 | 0 (0.0%) | 14 (13.2%) |
| $5,000 to $9,999 | 0 (0.0%) | 0 (0.0%) |
| $10,000 to $14,999 | 9 (5.0%) | 0 (0.0%) |
| $15,000 to $19,999 | 16 (8.9%) | 0 (0.0%) |
| $20,000 to $24,999 | 10 (5.6%) | 21 (19.8%) |
| $25,000 to $34,999 | 10 (5.6%) | 0 (0.0%) |
| $35,000 to $49,999 | 13 (7.2%) | 49 (46.2%) |
| $50,000 to $74,999 | 13 (7.2%) | 15 (14.1%) |
| $75,000 to $99,999 | 18 (10.0%) | 2 (1.9%) |
| $100,000 to $149,999 | 28 (15.6%) | 0 (0.0%) |
| $150,000 or more | 63 (35.0%) | 5 (4.7%) |
| Total | 180 (100.0%) | 106 (100.0%) |
Monthly Housing Cost Tiers in Indianola
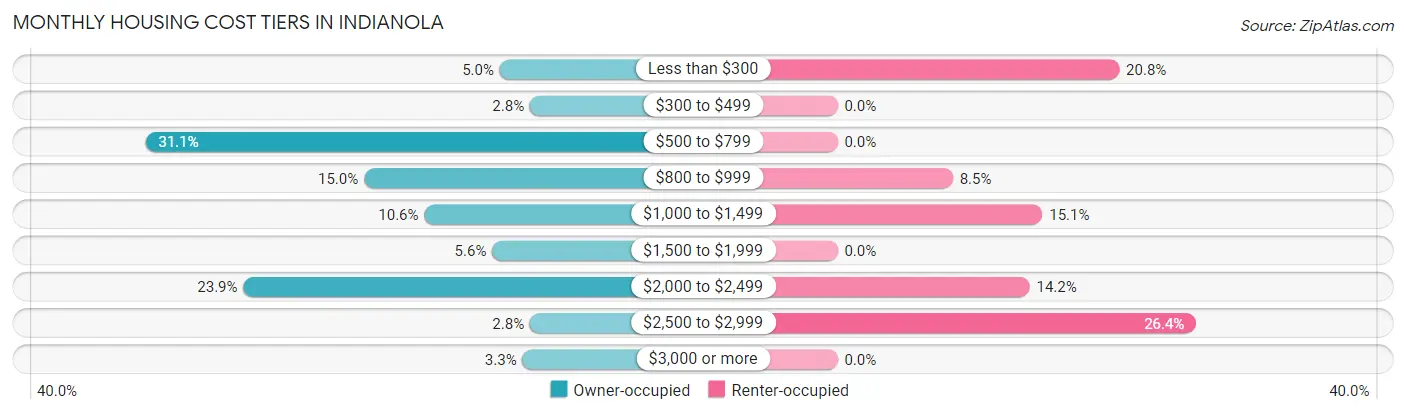
| Monthly Cost | Owner-occupied | Renter-occupied |
| Less than $300 | 9 (5.0%) | 22 (20.7%) |
| $300 to $499 | 5 (2.8%) | 0 (0.0%) |
| $500 to $799 | 56 (31.1%) | 0 (0.0%) |
| $800 to $999 | 27 (15.0%) | 9 (8.5%) |
| $1,000 to $1,499 | 19 (10.6%) | 16 (15.1%) |
| $1,500 to $1,999 | 10 (5.6%) | 0 (0.0%) |
| $2,000 to $2,499 | 43 (23.9%) | 15 (14.1%) |
| $2,500 to $2,999 | 5 (2.8%) | 28 (26.4%) |
| $3,000 or more | 6 (3.3%) | 0 (0.0%) |
| Total | 180 (100.0%) | 106 (100.0%) |
Physical Housing Characteristics in Indianola
Housing Structures in Indianola
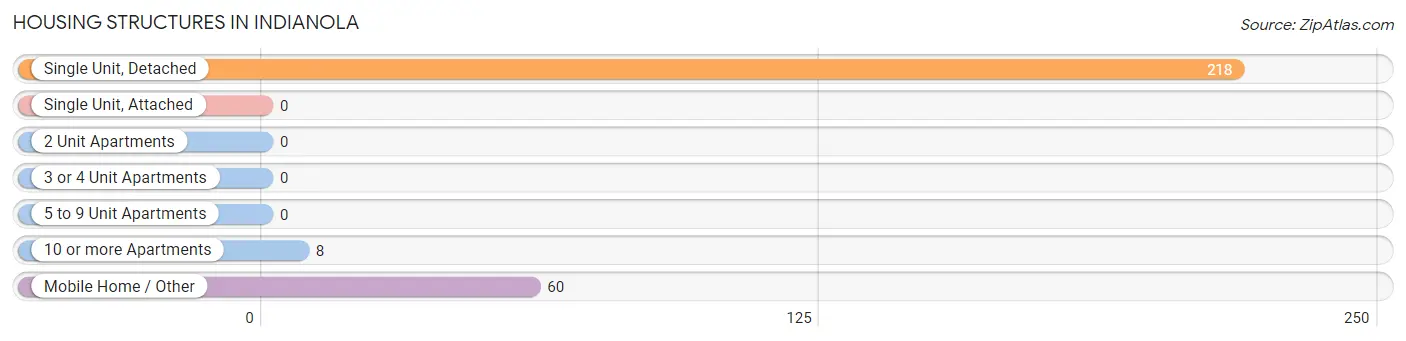
| Structure Type | # Housing Units | % Housing Units |
| Single Unit, Detached | 218 | 76.2% |
| Single Unit, Attached | 0 | 0.0% |
| 2 Unit Apartments | 0 | 0.0% |
| 3 or 4 Unit Apartments | 0 | 0.0% |
| 5 to 9 Unit Apartments | 0 | 0.0% |
| 10 or more Apartments | 8 | 2.8% |
| Mobile Home / Other | 60 | 21.0% |
| Total | 286 | 100.0% |
Housing Structures by Occupancy in Indianola
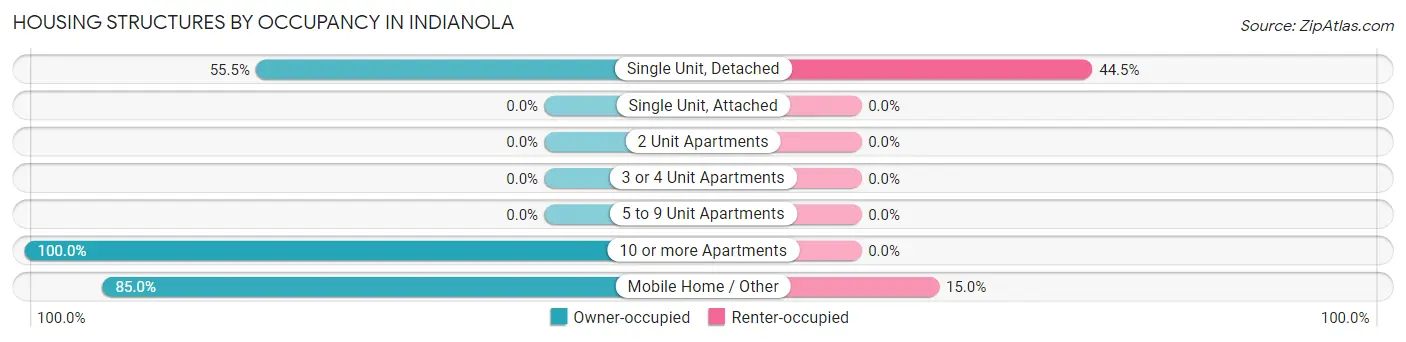
| Structure Type | Owner-occupied | Renter-occupied |
| Single Unit, Detached | 121 (55.5%) | 97 (44.5%) |
| Single Unit, Attached | 0 (0.0%) | 0 (0.0%) |
| 2 Unit Apartments | 0 (0.0%) | 0 (0.0%) |
| 3 or 4 Unit Apartments | 0 (0.0%) | 0 (0.0%) |
| 5 to 9 Unit Apartments | 0 (0.0%) | 0 (0.0%) |
| 10 or more Apartments | 8 (100.0%) | 0 (0.0%) |
| Mobile Home / Other | 51 (85.0%) | 9 (15.0%) |
| Total | 180 (62.9%) | 106 (37.1%) |
Housing Structures by Number of Rooms in Indianola
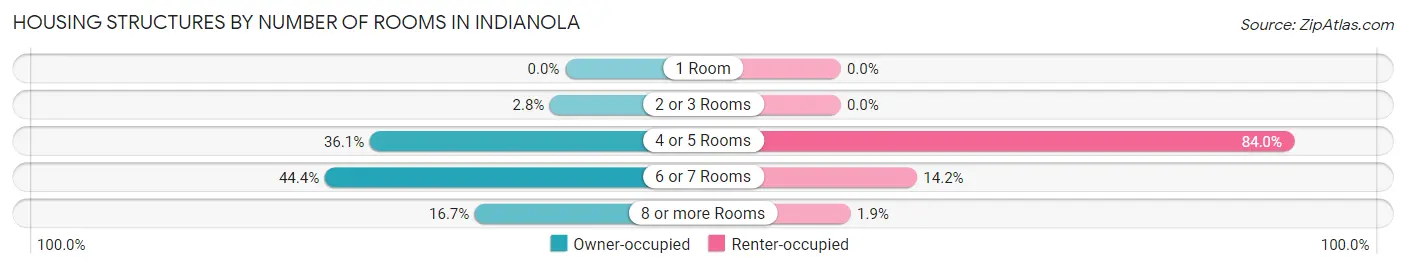
| Number of Rooms | Owner-occupied | Renter-occupied |
| 1 Room | 0 (0.0%) | 0 (0.0%) |
| 2 or 3 Rooms | 5 (2.8%) | 0 (0.0%) |
| 4 or 5 Rooms | 65 (36.1%) | 89 (84.0%) |
| 6 or 7 Rooms | 80 (44.4%) | 15 (14.1%) |
| 8 or more Rooms | 30 (16.7%) | 2 (1.9%) |
| Total | 180 (100.0%) | 106 (100.0%) |
Housing Structure by Heating Type in Indianola
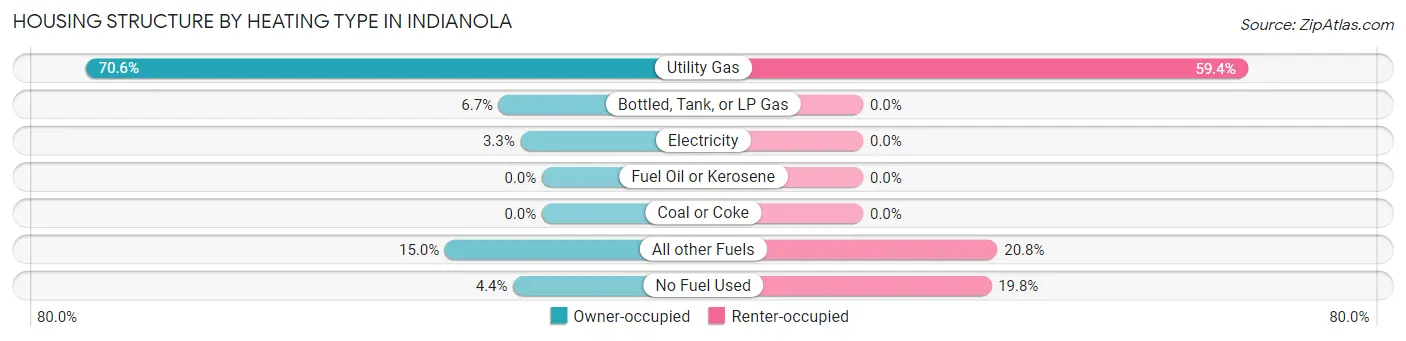
| Heating Type | Owner-occupied | Renter-occupied |
| Utility Gas | 127 (70.6%) | 63 (59.4%) |
| Bottled, Tank, or LP Gas | 12 (6.7%) | 0 (0.0%) |
| Electricity | 6 (3.3%) | 0 (0.0%) |
| Fuel Oil or Kerosene | 0 (0.0%) | 0 (0.0%) |
| Coal or Coke | 0 (0.0%) | 0 (0.0%) |
| All other Fuels | 27 (15.0%) | 22 (20.7%) |
| No Fuel Used | 8 (4.4%) | 21 (19.8%) |
| Total | 180 (100.0%) | 106 (100.0%) |
Household Vehicle Usage in Indianola
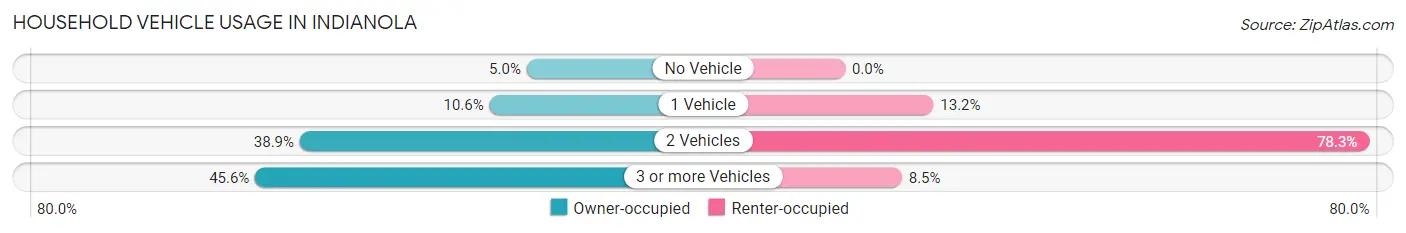
| Vehicles per Household | Owner-occupied | Renter-occupied |
| No Vehicle | 9 (5.0%) | 0 (0.0%) |
| 1 Vehicle | 19 (10.6%) | 14 (13.2%) |
| 2 Vehicles | 70 (38.9%) | 83 (78.3%) |
| 3 or more Vehicles | 82 (45.6%) | 9 (8.5%) |
| Total | 180 (100.0%) | 106 (100.0%) |
Real Estate & Mortgages in Indianola
Real Estate and Mortgage Overview in Indianola
| Characteristic | Without Mortgage | With Mortgage |
| Housing Units | 103 | 77 |
| Median Property Value | - | - |
| Median Household Income | - | - |
| Monthly Housing Costs | $746 | $6 |
| Real Estate Taxes | - | - |
Property Value by Mortgage Status in Indianola
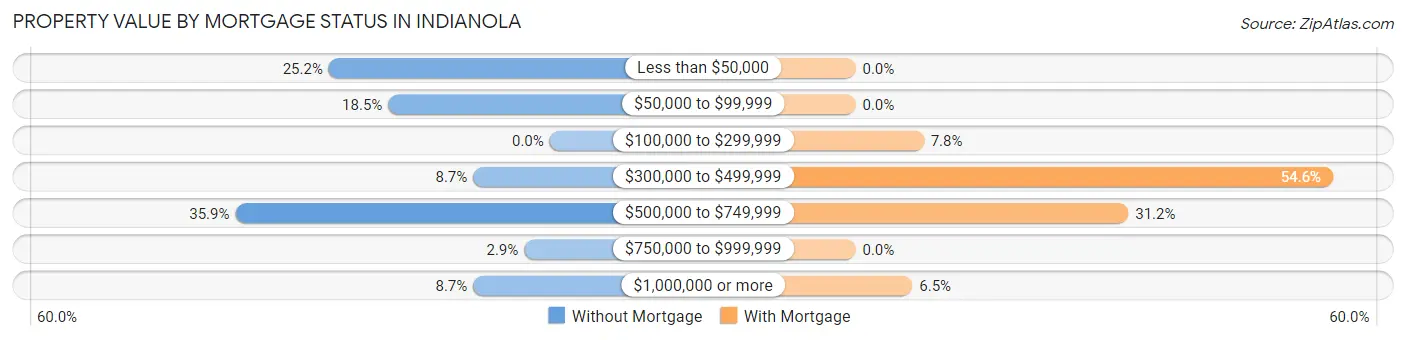
| Property Value | Without Mortgage | With Mortgage |
| Less than $50,000 | 26 (25.2%) | 0 (0.0%) |
| $50,000 to $99,999 | 19 (18.4%) | 0 (0.0%) |
| $100,000 to $299,999 | 0 (0.0%) | 6 (7.8%) |
| $300,000 to $499,999 | 9 (8.7%) | 42 (54.5%) |
| $500,000 to $749,999 | 37 (35.9%) | 24 (31.2%) |
| $750,000 to $999,999 | 3 (2.9%) | 0 (0.0%) |
| $1,000,000 or more | 9 (8.7%) | 5 (6.5%) |
| Total | 103 (100.0%) | 77 (100.0%) |
Household Income by Mortgage Status in Indianola
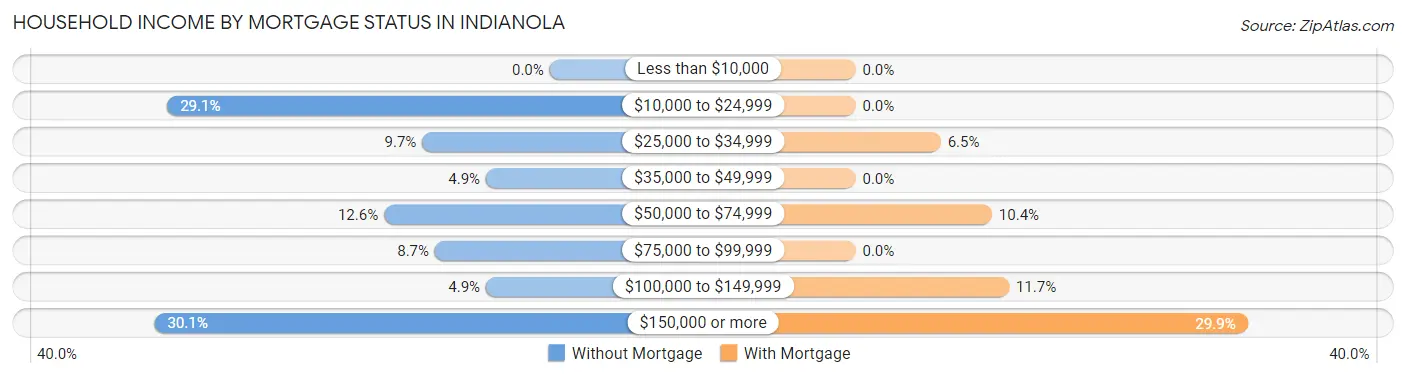
| Household Income | Without Mortgage | With Mortgage |
| Less than $10,000 | 0 (0.0%) | 0 (0.0%) |
| $10,000 to $24,999 | 30 (29.1%) | 0 (0.0%) |
| $25,000 to $34,999 | 10 (9.7%) | 5 (6.5%) |
| $35,000 to $49,999 | 5 (4.9%) | 0 (0.0%) |
| $50,000 to $74,999 | 13 (12.6%) | 8 (10.4%) |
| $75,000 to $99,999 | 9 (8.7%) | 0 (0.0%) |
| $100,000 to $149,999 | 5 (4.9%) | 9 (11.7%) |
| $150,000 or more | 31 (30.1%) | 23 (29.9%) |
| Total | 103 (100.0%) | 77 (100.0%) |
Property Value to Household Income Ratio in Indianola
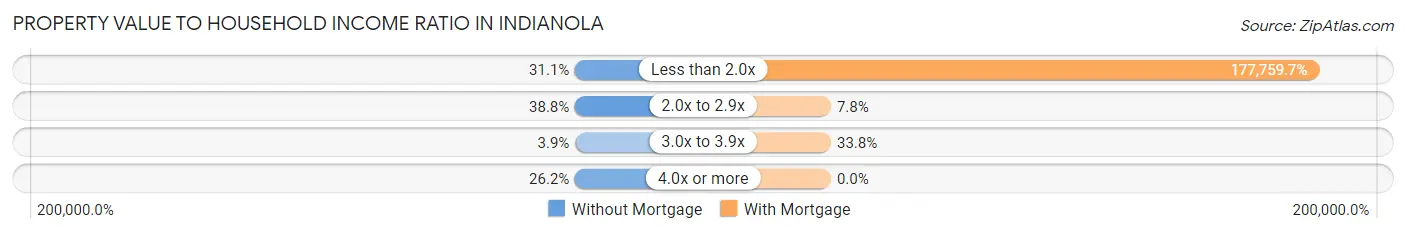
| Value-to-Income Ratio | Without Mortgage | With Mortgage |
| Less than 2.0x | 32 (31.1%) | 136,875 (177,759.7%) |
| 2.0x to 2.9x | 40 (38.8%) | 6 (7.8%) |
| 3.0x to 3.9x | 4 (3.9%) | 26 (33.8%) |
| 4.0x or more | 27 (26.2%) | 0 (0.0%) |
| Total | 103 (100.0%) | 77 (100.0%) |
Real Estate Taxes by Mortgage Status in Indianola
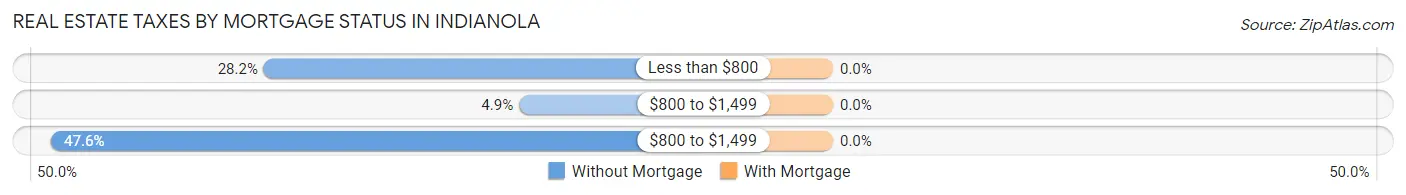
| Property Taxes | Without Mortgage | With Mortgage |
| Less than $800 | 29 (28.2%) | 0 (0.0%) |
| $800 to $1,499 | 5 (4.9%) | 0 (0.0%) |
| $800 to $1,499 | 49 (47.6%) | 0 (0.0%) |
| Total | 103 (100.0%) | 77 (100.0%) |
Health & Disability in Indianola
Health Insurance Coverage by Age in Indianola
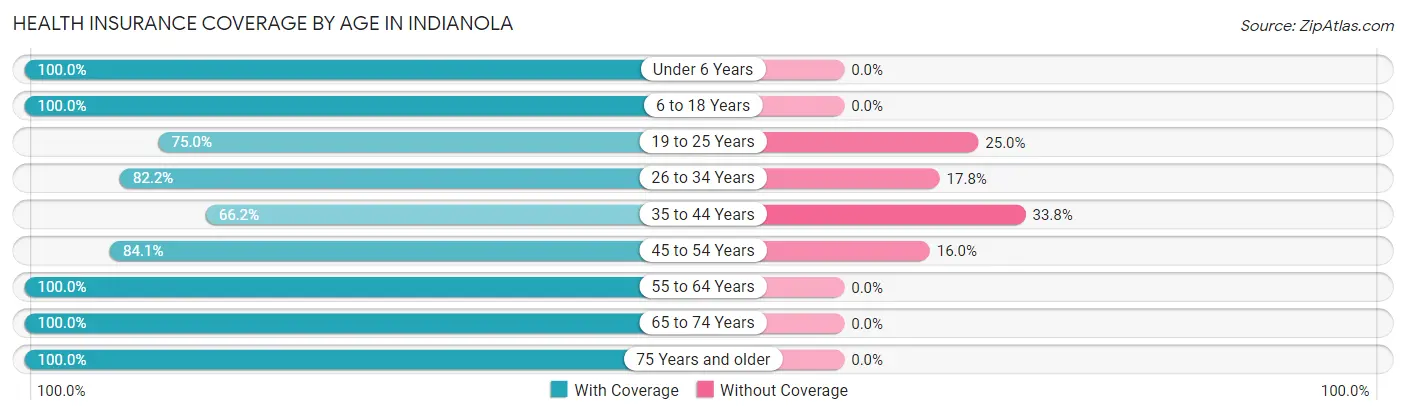
| Age Bracket | With Coverage | Without Coverage |
| Under 6 Years | 56 (100.0%) | 0 (0.0%) |
| 6 to 18 Years | 115 (100.0%) | 0 (0.0%) |
| 19 to 25 Years | 9 (75.0%) | 3 (25.0%) |
| 26 to 34 Years | 37 (82.2%) | 8 (17.8%) |
| 35 to 44 Years | 94 (66.2%) | 48 (33.8%) |
| 45 to 54 Years | 137 (84.1%) | 26 (16.0%) |
| 55 to 64 Years | 93 (100.0%) | 0 (0.0%) |
| 65 to 74 Years | 55 (100.0%) | 0 (0.0%) |
| 75 Years and older | 36 (100.0%) | 0 (0.0%) |
| Total | 632 (88.1%) | 85 (11.8%) |
Health Insurance Coverage by Citizenship Status in Indianola
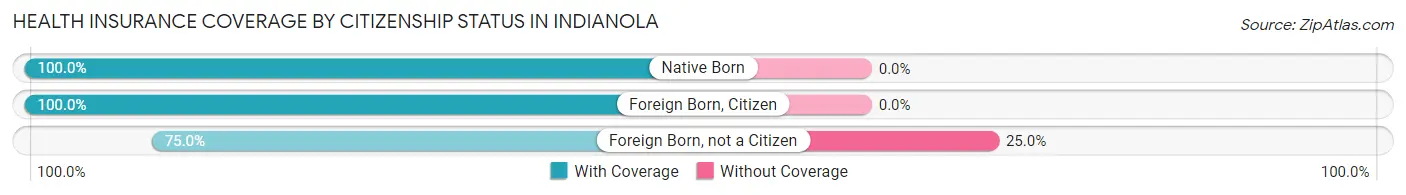
| Citizenship Status | With Coverage | Without Coverage |
| Native Born | 56 (100.0%) | 0 (0.0%) |
| Foreign Born, Citizen | 115 (100.0%) | 0 (0.0%) |
| Foreign Born, not a Citizen | 9 (75.0%) | 3 (25.0%) |
Health Insurance Coverage by Household Income in Indianola
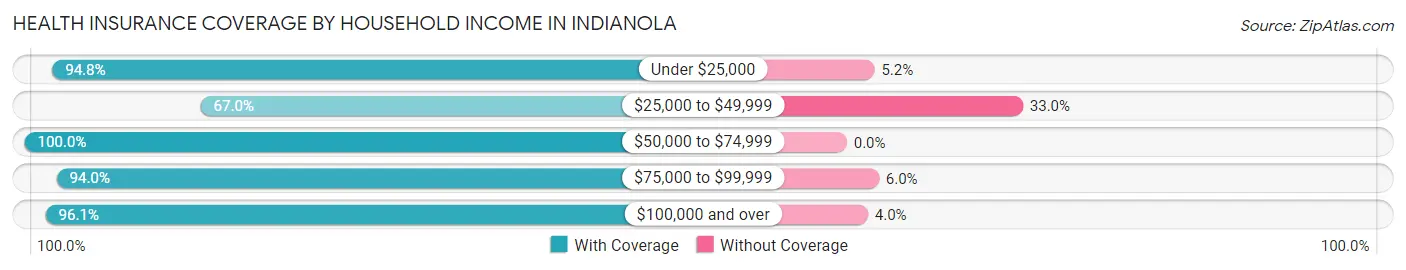
| Household Income | With Coverage | Without Coverage |
| Under $25,000 | 146 (94.8%) | 8 (5.2%) |
| $25,000 to $49,999 | 130 (67.0%) | 64 (33.0%) |
| $50,000 to $74,999 | 66 (100.0%) | 0 (0.0%) |
| $75,000 to $99,999 | 47 (94.0%) | 3 (6.0%) |
| $100,000 and over | 243 (96.1%) | 10 (4.0%) |
Public vs Private Health Insurance Coverage by Age in Indianola
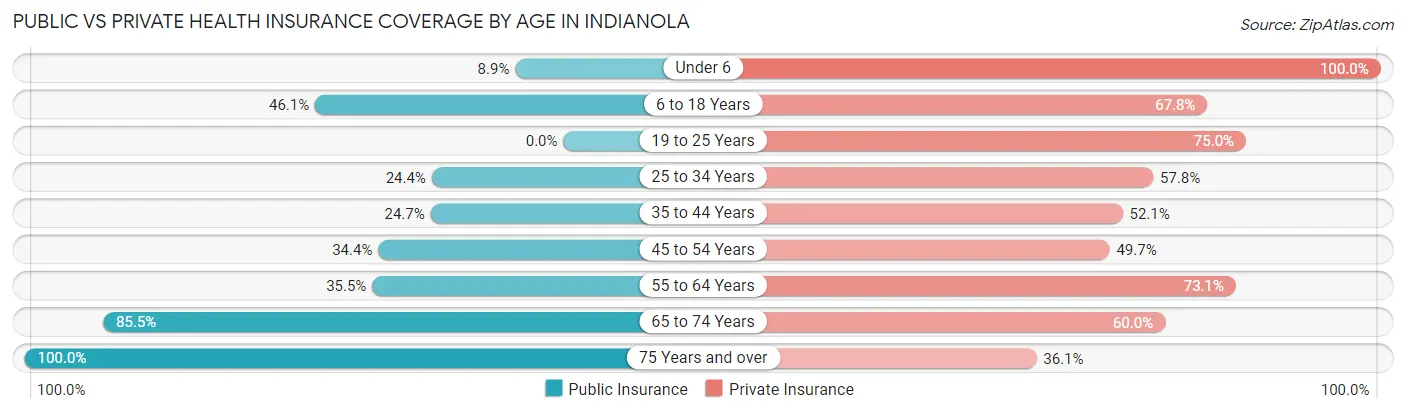
| Age Bracket | Public Insurance | Private Insurance |
| Under 6 | 5 (8.9%) | 56 (100.0%) |
| 6 to 18 Years | 53 (46.1%) | 78 (67.8%) |
| 19 to 25 Years | 0 (0.0%) | 9 (75.0%) |
| 25 to 34 Years | 11 (24.4%) | 26 (57.8%) |
| 35 to 44 Years | 35 (24.6%) | 74 (52.1%) |
| 45 to 54 Years | 56 (34.4%) | 81 (49.7%) |
| 55 to 64 Years | 33 (35.5%) | 68 (73.1%) |
| 65 to 74 Years | 47 (85.5%) | 33 (60.0%) |
| 75 Years and over | 36 (100.0%) | 13 (36.1%) |
| Total | 276 (38.5%) | 438 (61.1%) |
Disability Status by Sex by Age in Indianola
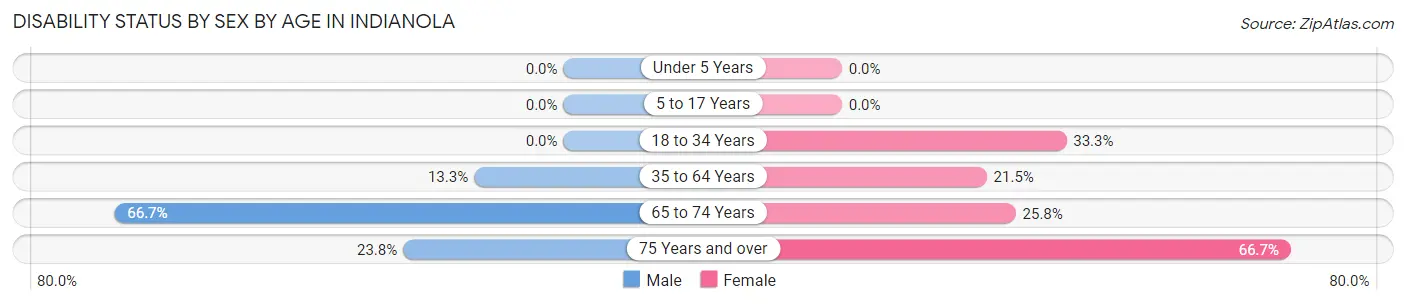
| Age Bracket | Male | Female |
| Under 5 Years | 0 (0.0%) | 0 (0.0%) |
| 5 to 17 Years | 0 (0.0%) | 0 (0.0%) |
| 18 to 34 Years | 0 (0.0%) | 4 (33.3%) |
| 35 to 64 Years | 30 (13.3%) | 37 (21.5%) |
| 65 to 74 Years | 16 (66.7%) | 8 (25.8%) |
| 75 Years and over | 5 (23.8%) | 10 (66.7%) |
Disability Class by Sex by Age in Indianola
Disability Class: Hearing Difficulty
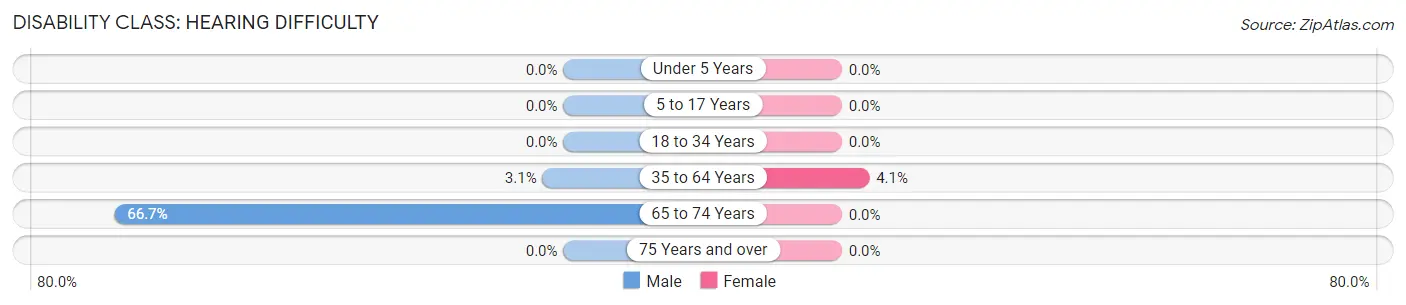
| Age Bracket | Male | Female |
| Under 5 Years | 0 (0.0%) | 0 (0.0%) |
| 5 to 17 Years | 0 (0.0%) | 0 (0.0%) |
| 18 to 34 Years | 0 (0.0%) | 0 (0.0%) |
| 35 to 64 Years | 7 (3.1%) | 7 (4.1%) |
| 65 to 74 Years | 16 (66.7%) | 0 (0.0%) |
| 75 Years and over | 0 (0.0%) | 0 (0.0%) |
Disability Class: Vision Difficulty
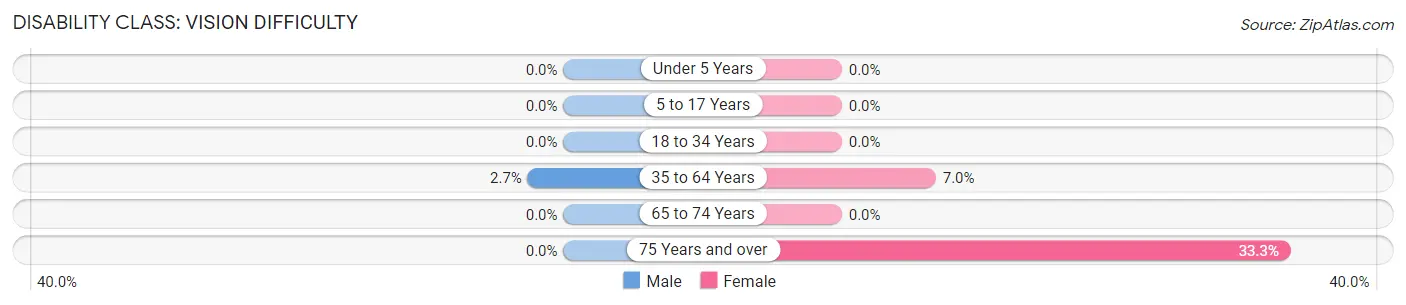
| Age Bracket | Male | Female |
| Under 5 Years | 0 (0.0%) | 0 (0.0%) |
| 5 to 17 Years | 0 (0.0%) | 0 (0.0%) |
| 18 to 34 Years | 0 (0.0%) | 0 (0.0%) |
| 35 to 64 Years | 6 (2.6%) | 12 (7.0%) |
| 65 to 74 Years | 0 (0.0%) | 0 (0.0%) |
| 75 Years and over | 0 (0.0%) | 5 (33.3%) |
Disability Class: Cognitive Difficulty
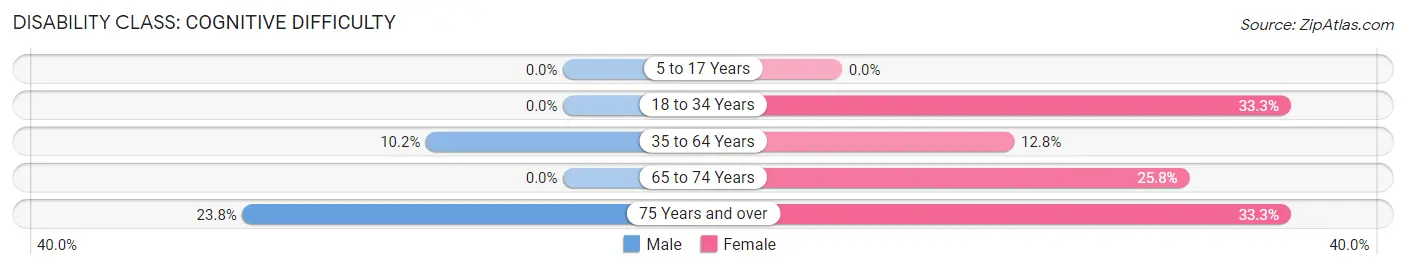
| Age Bracket | Male | Female |
| 5 to 17 Years | 0 (0.0%) | 0 (0.0%) |
| 18 to 34 Years | 0 (0.0%) | 4 (33.3%) |
| 35 to 64 Years | 23 (10.2%) | 22 (12.8%) |
| 65 to 74 Years | 0 (0.0%) | 8 (25.8%) |
| 75 Years and over | 5 (23.8%) | 5 (33.3%) |
Disability Class: Ambulatory Difficulty
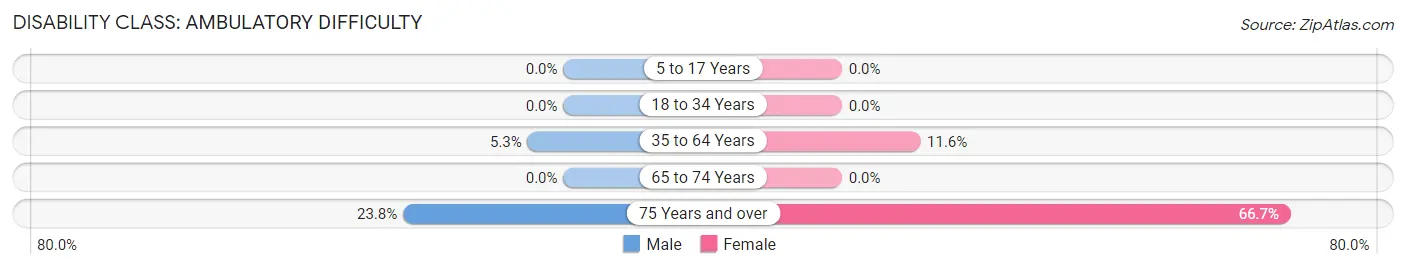
| Age Bracket | Male | Female |
| 5 to 17 Years | 0 (0.0%) | 0 (0.0%) |
| 18 to 34 Years | 0 (0.0%) | 0 (0.0%) |
| 35 to 64 Years | 12 (5.3%) | 20 (11.6%) |
| 65 to 74 Years | 0 (0.0%) | 0 (0.0%) |
| 75 Years and over | 5 (23.8%) | 10 (66.7%) |
Disability Class: Self-Care Difficulty
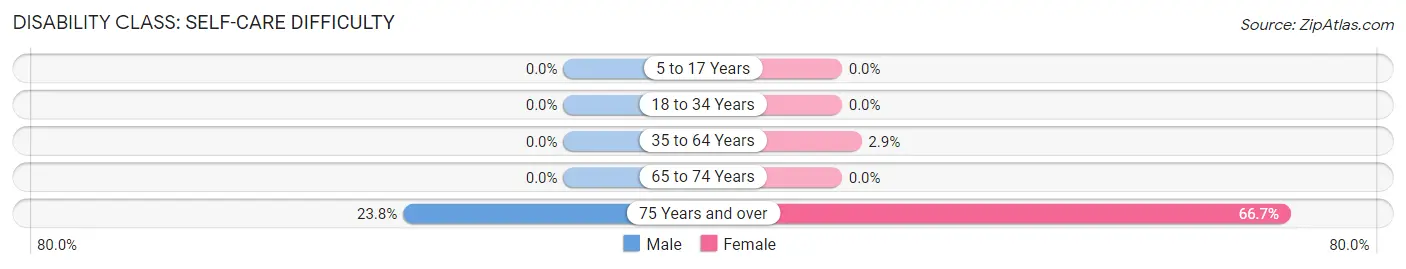
| Age Bracket | Male | Female |
| 5 to 17 Years | 0 (0.0%) | 0 (0.0%) |
| 18 to 34 Years | 0 (0.0%) | 0 (0.0%) |
| 35 to 64 Years | 0 (0.0%) | 5 (2.9%) |
| 65 to 74 Years | 0 (0.0%) | 0 (0.0%) |
| 75 Years and over | 5 (23.8%) | 10 (66.7%) |
Technology Access in Indianola
Computing Device Access in Indianola
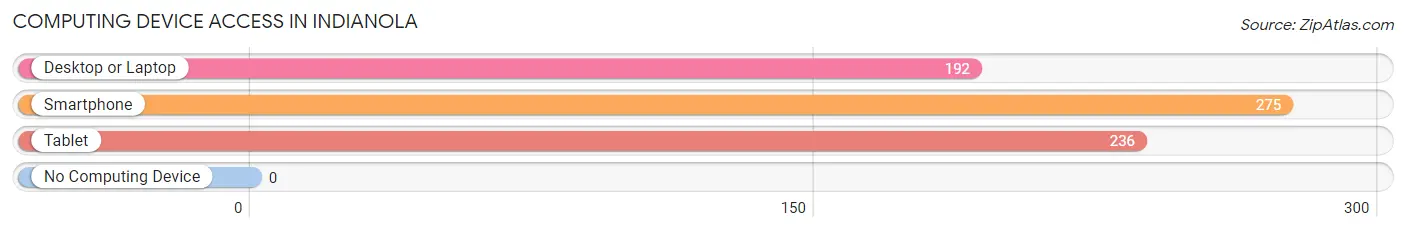
| Device Type | # Households | % Households |
| Desktop or Laptop | 192 | 67.1% |
| Smartphone | 275 | 96.2% |
| Tablet | 236 | 82.5% |
| No Computing Device | 0 | 0.0% |
| Total | 286 | 100.0% |
Internet Access in Indianola
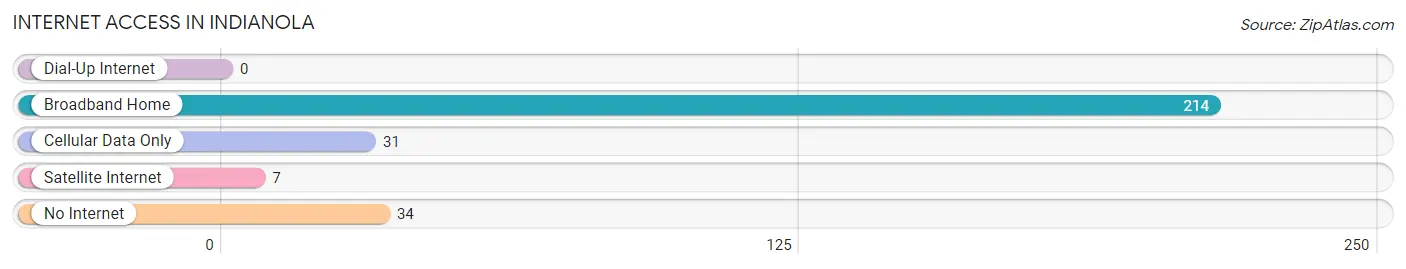
| Internet Type | # Households | % Households |
| Dial-Up Internet | 0 | 0.0% |
| Broadband Home | 214 | 74.8% |
| Cellular Data Only | 31 | 10.8% |
| Satellite Internet | 7 | 2.5% |
| No Internet | 34 | 11.9% |
| Total | 286 | 100.0% |
Indianola Summary
Introduction
Indianola is a small unincorporated community located in the foothills of the Sierra Nevada Mountains in California. It is located in El Dorado County, approximately 25 miles east of Placerville. Indianola is a rural community with a population of approximately 200 people. The town is known for its small-town charm and its close proximity to the nearby cities of Placerville and South Lake Tahoe.
History
The area that is now Indianola was first settled in the late 1800s by miners and ranchers. The town was originally known as Indian Diggings, and was named after the Native American tribe that lived in the area. The town was officially established in 1883, and the first post office was established in 1884.
In the early 1900s, Indianola was a thriving community with a population of over 500 people. The town had a school, a general store, a hotel, and several other businesses. The town was also home to a number of churches, including the Indianola Methodist Church, which was established in 1885.
In the 1920s, the population of Indianola began to decline as the mining industry in the area declined. By the 1940s, the population had dropped to just over 200 people. The town has remained relatively unchanged since then, and the population has remained steady at around 200 people.
Geography
Indianola is located in the foothills of the Sierra Nevada Mountains in El Dorado County, California. The town is situated at an elevation of 2,400 feet, and is surrounded by rolling hills and forests. The town is located approximately 25 miles east of Placerville, and is accessible via State Route 49.
The climate in Indianola is mild and temperate, with hot summers and cold winters. The average high temperature in the summer is around 85 degrees Fahrenheit, and the average low temperature in the winter is around 30 degrees Fahrenheit.
Economy
The economy of Indianola is largely based on tourism and agriculture. The town is home to several small businesses, including a general store, a cafe, and a few other small shops. The town is also home to a number of farms, which produce a variety of fruits and vegetables.
The town is also home to a number of wineries, which produce a variety of wines. The town is also home to a number of bed and breakfasts, which attract visitors from all over the world.
Demographics
As of the 2010 census, the population of Indianola was 200 people. The racial makeup of the town was 95.5% White, 0.5% African American, 0.5% Native American, 0.5% Asian, and 2.5% from other races. The median household income in the town was $45,000, and the median age was 44 years.
Conclusion
Indianola is a small unincorporated community located in the foothills of the Sierra Nevada Mountains in California. The town is known for its small-town charm and its close proximity to the nearby cities of Placerville and South Lake Tahoe. The economy of Indianola is largely based on tourism and agriculture, and the town is home to a number of small businesses, farms, wineries, and bed and breakfasts. The population of Indianola is approximately 200 people, and the median household income is $45,000.
Common Questions
What is Per Capita Income in Indianola?
Per Capita income in Indianola is $33,890.
What is the Median Family Income in Indianola?
Median Family Income in Indianola is $83,750.
What is the Median Household income in Indianola?
Median Household Income in Indianola is $50,104.
What is Income or Wage Gap in Indianola?
Income or Wage Gap in Indianola is 6.2%.
Women in Indianola earn 93.8 cents for every dollar earned by a man.
What is Inequality or Gini Index in Indianola?
Inequality or Gini Index in Indianola is 0.48.
What is the Total Population of Indianola?
Total Population of Indianola is 717.
What is the Total Male Population of Indianola?
Total Male Population of Indianola is 410.
What is the Total Female Population of Indianola?
Total Female Population of Indianola is 307.
What is the Ratio of Males per 100 Females in Indianola?
There are 133.55 Males per 100 Females in Indianola.
What is the Ratio of Females per 100 Males in Indianola?
There are 74.88 Females per 100 Males in Indianola.
What is the Median Population Age in Indianola?
Median Population Age in Indianola is 43.7 Years.
What is the Average Family Size in Indianola
Average Family Size in Indianola is 2.6 People.
What is the Average Household Size in Indianola
Average Household Size in Indianola is 2.5 People.
How Large is the Labor Force in Indianola?
There are 338 People in the Labor Forcein in Indianola.
What is the Percentage of People in the Labor Force in Indianola?
58.7% of People are in the Labor Force in Indianola.
What is the Unemployment Rate in Indianola?
Unemployment Rate in Indianola is 18.6%.