Zip Codes with the Highest Percentage of Population Employed in Health Diagnosing & Treating in Yorba Linda, CA
RELATED REPORTS & OPTIONS
Health Diagnosing & Treating
Yorba Linda
Compare Zip Codes
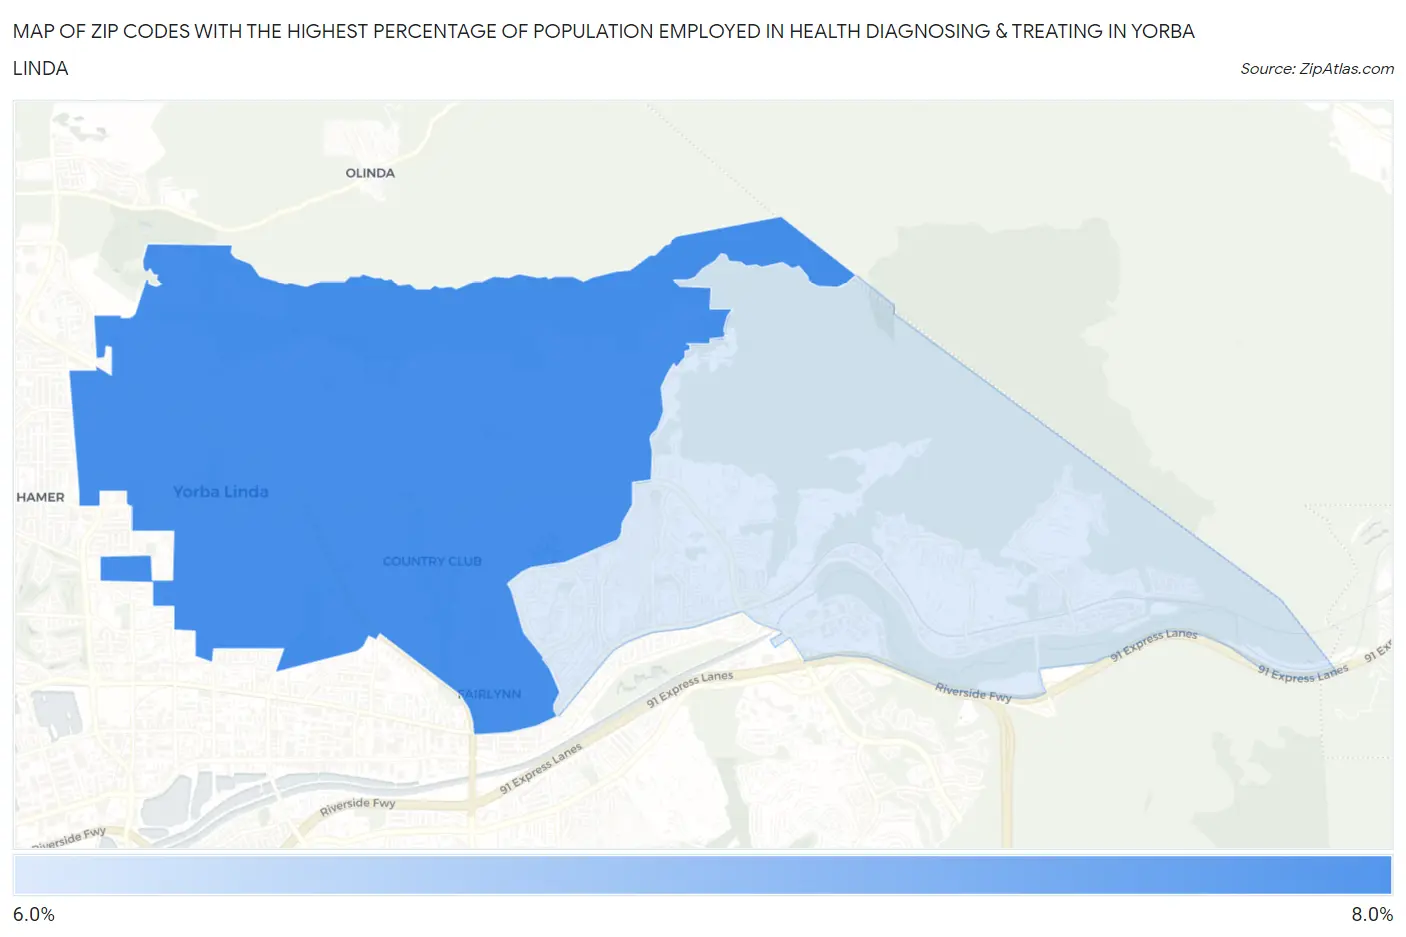
Map of Zip Codes with the Highest Percentage of Population Employed in Health Diagnosing & Treating in Yorba Linda
6.8%
7.8%
Zip Codes with the Highest Percentage of Population Employed in Health Diagnosing & Treating in Yorba Linda, CA
| Zip Code | % Employed | vs State | vs National | |
| 1. | 92886 | 7.8% | 5.3%(+2.53)#260 | 6.2%(+1.60)#7,903 |
| 2. | 92887 | 6.8% | 5.3%(+1.44)#421 | 6.2%(+0.506)#11,151 |
1
Common Questions
What are the Top Zip Codes with the Highest Percentage of Population Employed in Health Diagnosing & Treating in Yorba Linda, CA?
Top Zip Codes with the Highest Percentage of Population Employed in Health Diagnosing & Treating in Yorba Linda, CA are:
What zip code has the Highest Percentage of Population Employed in Health Diagnosing & Treating in Yorba Linda, CA?
92886 has the Highest Percentage of Population Employed in Health Diagnosing & Treating in Yorba Linda, CA with 7.8%.
What is the Percentage of Population Employed in Health Diagnosing & Treating in Yorba Linda, CA?
Percentage of Population Employed in Health Diagnosing & Treating in Yorba Linda is 7.7%.
What is the Percentage of Population Employed in Health Diagnosing & Treating in California?
Percentage of Population Employed in Health Diagnosing & Treating in California is 5.3%.
What is the Percentage of Population Employed in Health Diagnosing & Treating in the United States?
Percentage of Population Employed in Health Diagnosing & Treating in the United States is 6.2%.