Zip Codes with the Highest Percentage of Population Employed in Health Diagnosing & Treating in Grass Valley, CA
RELATED REPORTS & OPTIONS
Health Diagnosing & Treating
Grass Valley
Compare Zip Codes
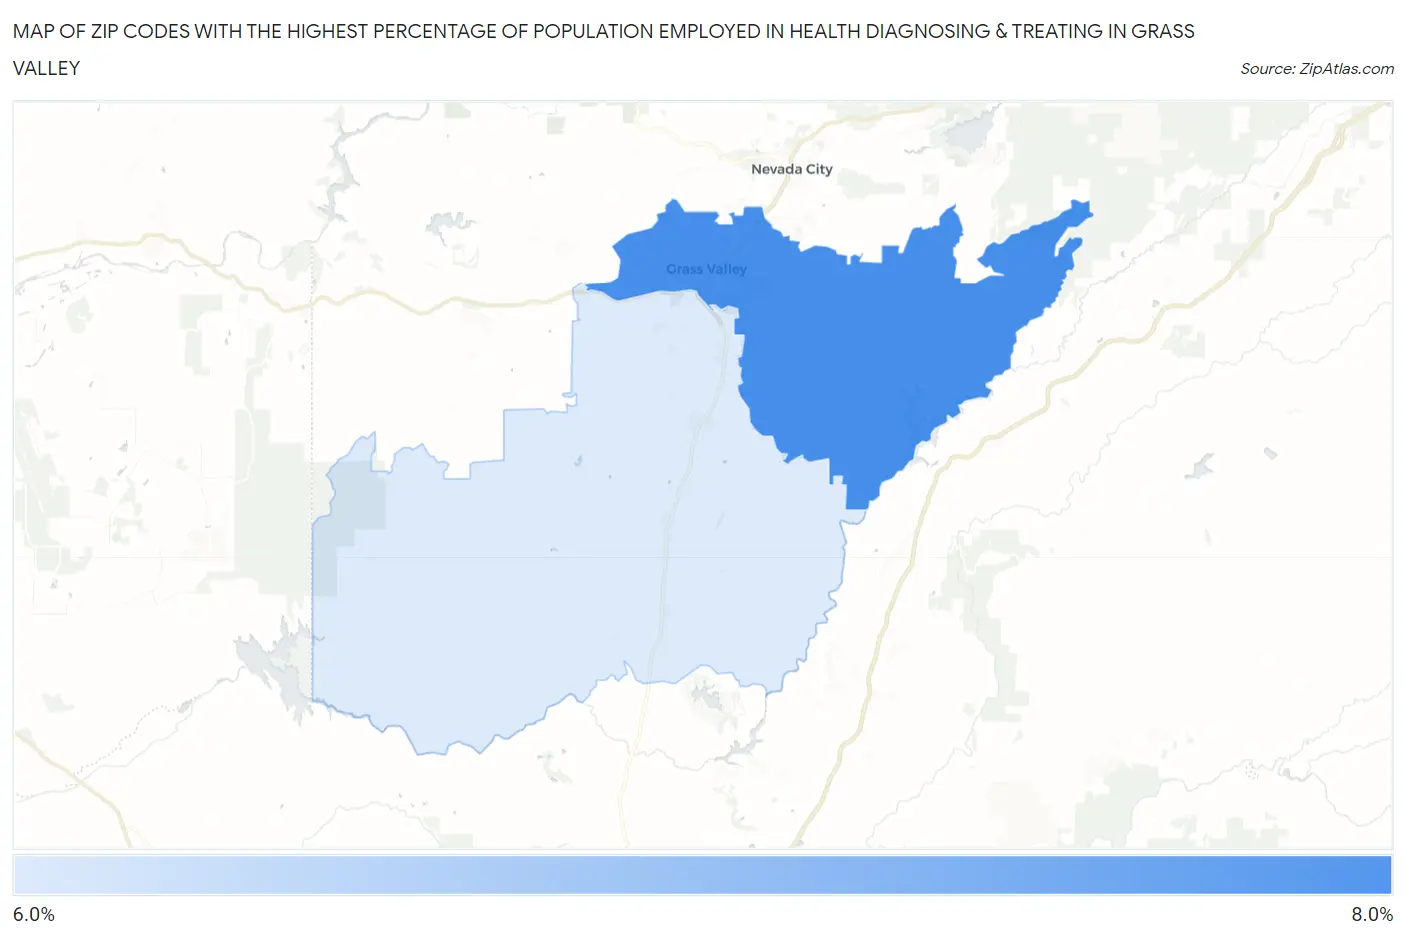
Map of Zip Codes with the Highest Percentage of Population Employed in Health Diagnosing & Treating in Grass Valley
6.0%
6.8%
Zip Codes with the Highest Percentage of Population Employed in Health Diagnosing & Treating in Grass Valley, CA
| Zip Code | % Employed | vs State | vs National | |
| 1. | 95945 | 6.8% | 5.3%(+1.46)#419 | 6.2%(+0.527)#11,085 |
| 2. | 95949 | 6.0% | 5.3%(+0.725)#562 | 6.2%(-0.209)#13,751 |
1
Common Questions
What are the Top Zip Codes with the Highest Percentage of Population Employed in Health Diagnosing & Treating in Grass Valley, CA?
Top Zip Codes with the Highest Percentage of Population Employed in Health Diagnosing & Treating in Grass Valley, CA are:
What zip code has the Highest Percentage of Population Employed in Health Diagnosing & Treating in Grass Valley, CA?
95945 has the Highest Percentage of Population Employed in Health Diagnosing & Treating in Grass Valley, CA with 6.8%.
What is the Percentage of Population Employed in Health Diagnosing & Treating in Grass Valley, CA?
Percentage of Population Employed in Health Diagnosing & Treating in Grass Valley is 4.7%.
What is the Percentage of Population Employed in Health Diagnosing & Treating in California?
Percentage of Population Employed in Health Diagnosing & Treating in California is 5.3%.
What is the Percentage of Population Employed in Health Diagnosing & Treating in the United States?
Percentage of Population Employed in Health Diagnosing & Treating in the United States is 6.2%.