East Oakdale, CA Map & Demographics
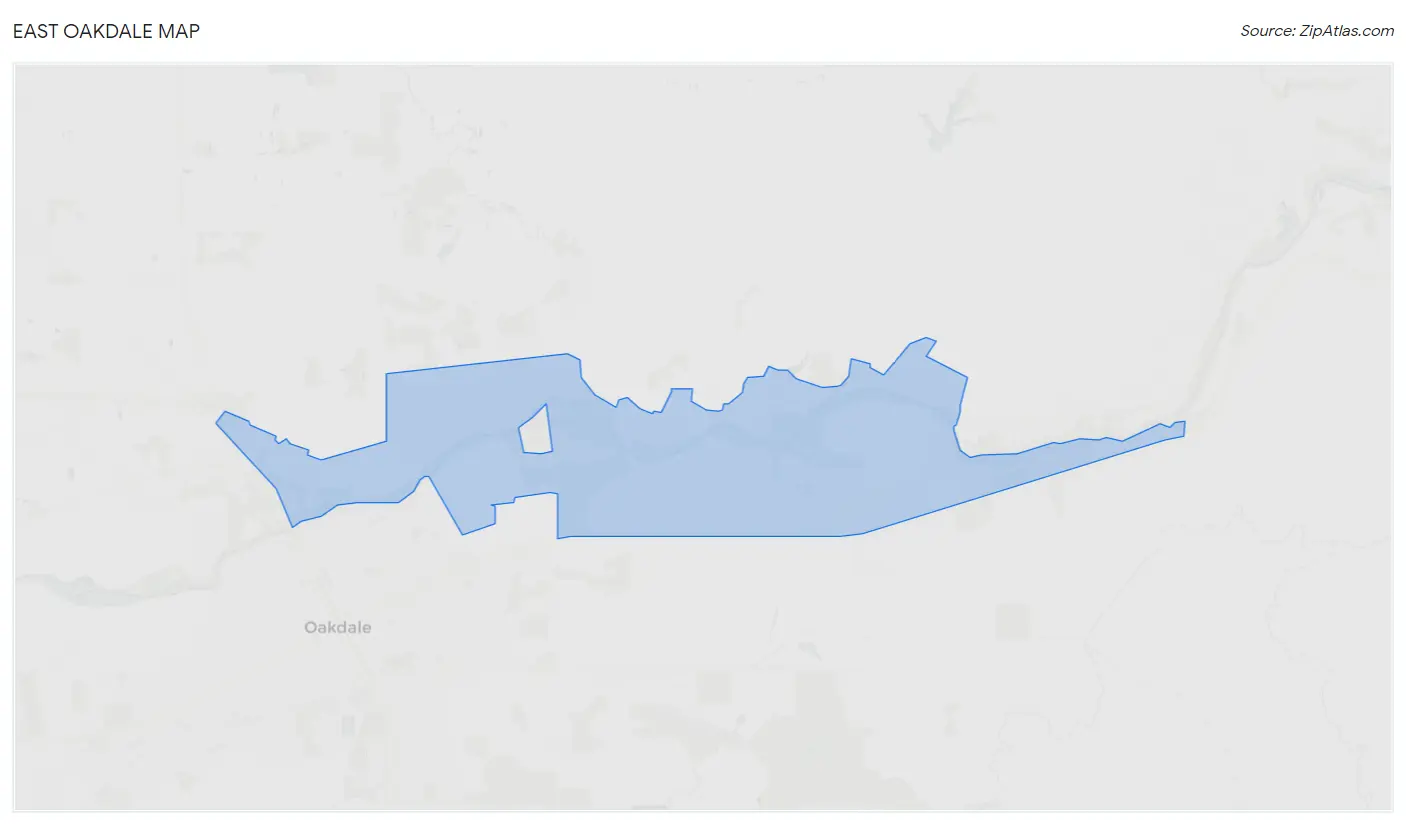
East Oakdale Map
East Oakdale Overview
$79,279
PER CAPITA INCOME
$140,568
AVG FAMILY INCOME
$124,010
AVG HOUSEHOLD INCOME
34.4%
WAGE / INCOME GAP [ % ]
65.6¢/ $1
WAGE / INCOME GAP [ $ ]
0.49
INEQUALITY / GINI INDEX
2,381
TOTAL POPULATION
1,315
MALE POPULATION
1,066
FEMALE POPULATION
123.36
MALES / 100 FEMALES
81.06
FEMALES / 100 MALES
56.7
MEDIAN AGE
2.7
AVG FAMILY SIZE
2.4
AVG HOUSEHOLD SIZE
939
LABOR FORCE [ PEOPLE ]
46.4%
PERCENT IN LABOR FORCE
5.3%
UNEMPLOYMENT RATE
Income in East Oakdale
Income Overview in East Oakdale
Per Capita Income in East Oakdale is $79,279, while median incomes of families and households are $140,568 and $124,010 respectively.
| Characteristic | Number | Measure |
| Per Capita Income | 2,381 | $79,279 |
| Median Family Income | 765 | $140,568 |
| Mean Family Income | 765 | $213,735 |
| Median Household Income | 999 | $124,010 |
| Mean Household Income | 999 | $187,543 |
| Income Deficit | 765 | $0 |
| Wage / Income Gap (%) | 2,381 | 34.40% |
| Wage / Income Gap ($) | 2,381 | 65.60¢ per $1 |
| Gini / Inequality Index | 2,381 | 0.49 |
Earnings by Sex in East Oakdale
Average Earnings in East Oakdale are $67,153, $80,833 for men and $53,029 for women, a difference of 34.4%.
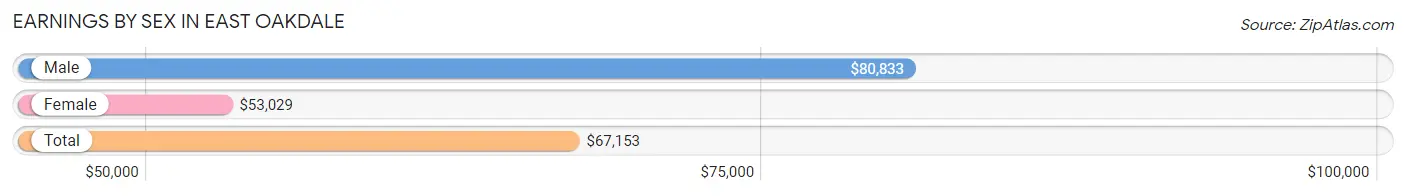
| Sex | Number | Average Earnings |
| Male | 760 (69.2%) | $80,833 |
| Female | 339 (30.8%) | $53,029 |
| Total | 1,099 (100.0%) | $67,153 |
Earnings by Sex by Income Bracket in East Oakdale
The most common earnings brackets in East Oakdale are $100,000+ for men (372 | 48.9%) and $100,000+ for women (94 | 27.7%).
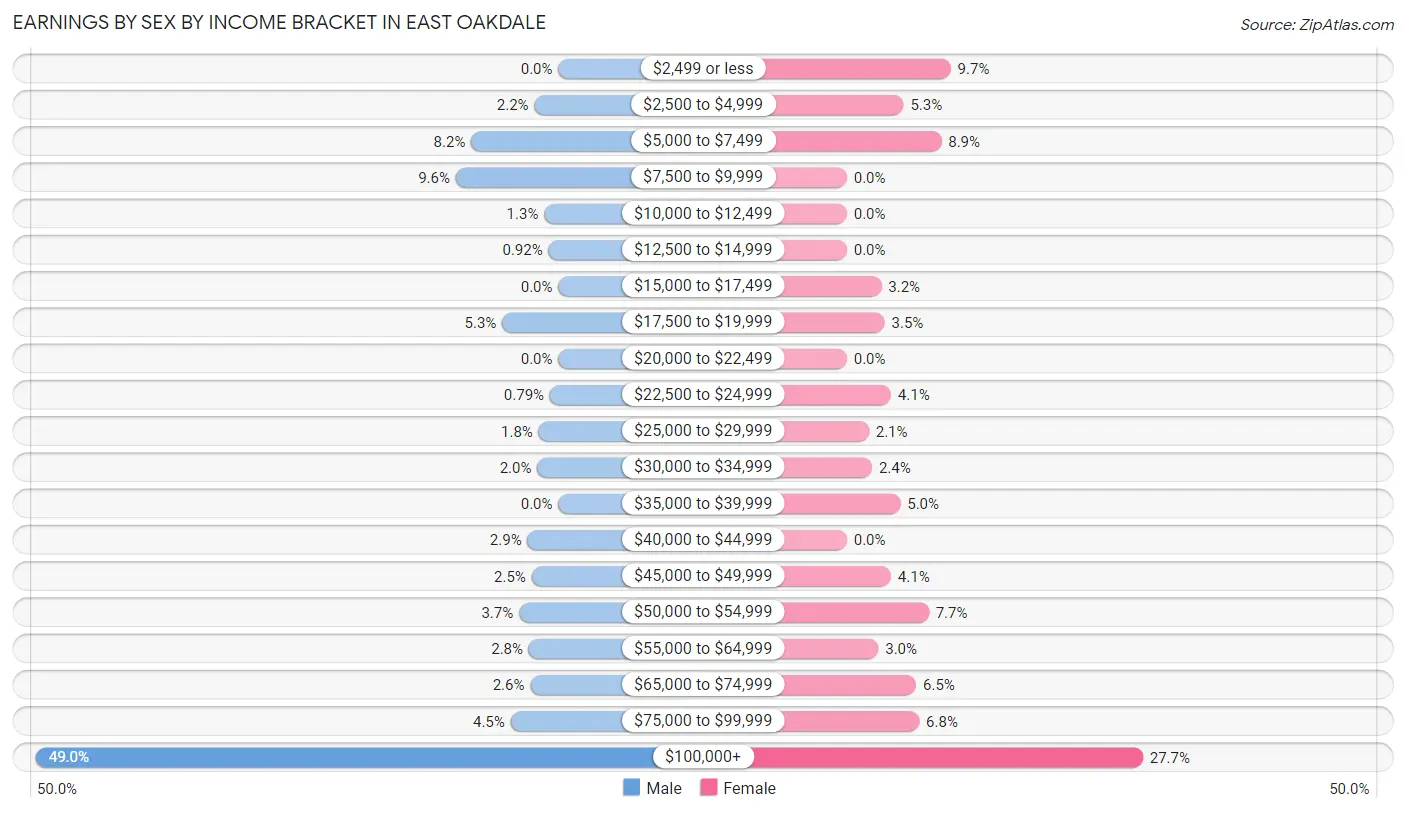
| Income | Male | Female |
| $2,499 or less | 0 (0.0%) | 33 (9.7%) |
| $2,500 to $4,999 | 17 (2.2%) | 18 (5.3%) |
| $5,000 to $7,499 | 62 (8.2%) | 30 (8.8%) |
| $7,500 to $9,999 | 73 (9.6%) | 0 (0.0%) |
| $10,000 to $12,499 | 10 (1.3%) | 0 (0.0%) |
| $12,500 to $14,999 | 7 (0.9%) | 0 (0.0%) |
| $15,000 to $17,499 | 0 (0.0%) | 11 (3.2%) |
| $17,500 to $19,999 | 40 (5.3%) | 12 (3.5%) |
| $20,000 to $22,499 | 0 (0.0%) | 0 (0.0%) |
| $22,500 to $24,999 | 6 (0.8%) | 14 (4.1%) |
| $25,000 to $29,999 | 14 (1.8%) | 7 (2.1%) |
| $30,000 to $34,999 | 15 (2.0%) | 8 (2.4%) |
| $35,000 to $39,999 | 0 (0.0%) | 17 (5.0%) |
| $40,000 to $44,999 | 22 (2.9%) | 0 (0.0%) |
| $45,000 to $49,999 | 19 (2.5%) | 14 (4.1%) |
| $50,000 to $54,999 | 28 (3.7%) | 26 (7.7%) |
| $55,000 to $64,999 | 21 (2.8%) | 10 (2.9%) |
| $65,000 to $74,999 | 20 (2.6%) | 22 (6.5%) |
| $75,000 to $99,999 | 34 (4.5%) | 23 (6.8%) |
| $100,000+ | 372 (48.9%) | 94 (27.7%) |
| Total | 760 (100.0%) | 339 (100.0%) |
Earnings by Sex by Educational Attainment in East Oakdale
Average earnings in East Oakdale are $118,125 for men and $57,875 for women, a difference of 51.0%. Men with an educational attainment of graduate degree enjoy the highest average annual earnings of $190,265, while those with less than high school education earn the least with $18,094. Women with an educational attainment of bachelor's degree earn the most with the average annual earnings of $106,346, while those with college or associate's degree education have the smallest earnings of $58,000.
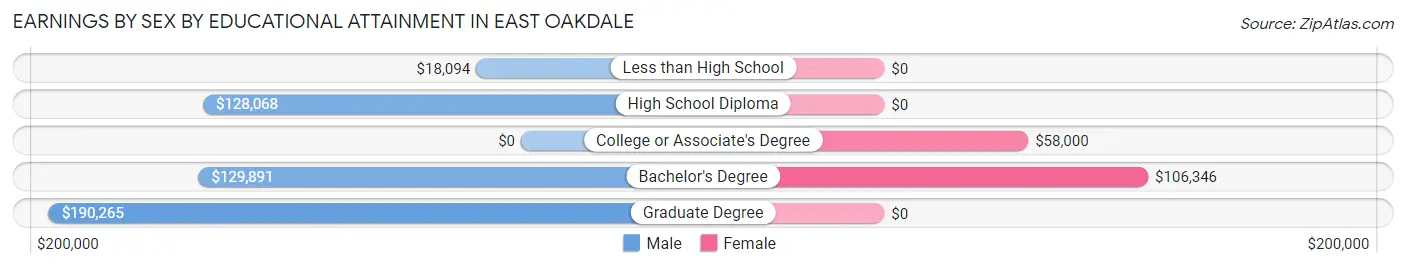
| Educational Attainment | Male Income | Female Income |
| Less than High School | $18,094 | $0 |
| High School Diploma | $128,068 | $0 |
| College or Associate's Degree | - | - |
| Bachelor's Degree | $129,891 | $106,346 |
| Graduate Degree | $190,265 | $0 |
| Total | $118,125 | $57,875 |
Family Income in East Oakdale
Family Income Brackets in East Oakdale
According to the East Oakdale family income data, there are 269 families falling into the $200,000+ income range, which is the most common income bracket and makes up 35.2% of all families.
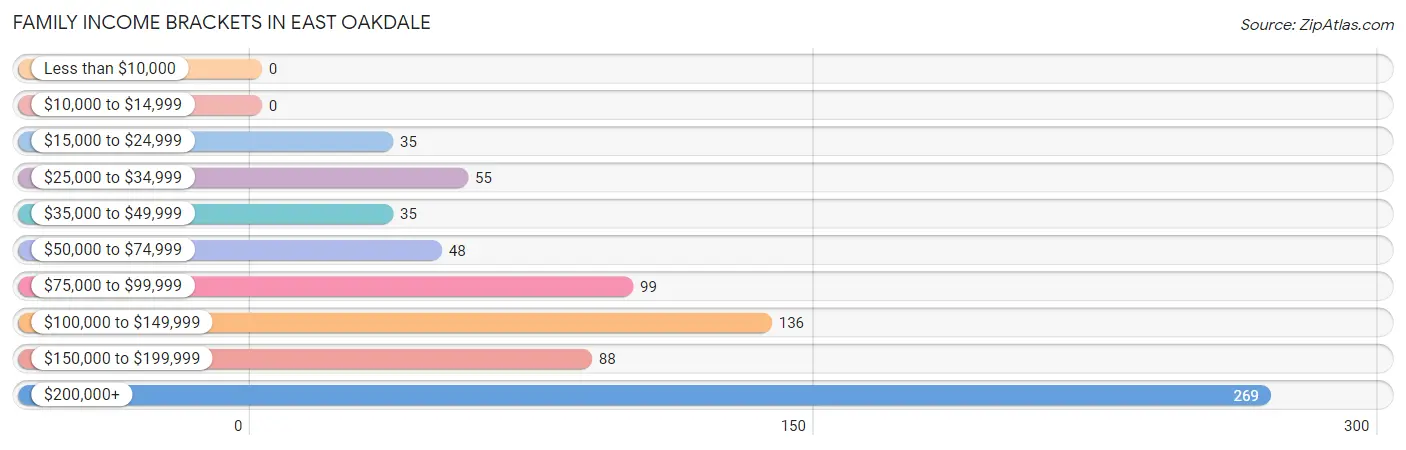
| Income Bracket | # Families | % Families |
| Less than $10,000 | 0 | 0.0% |
| $10,000 to $14,999 | 0 | 0.0% |
| $15,000 to $24,999 | 35 | 4.6% |
| $25,000 to $34,999 | 55 | 7.2% |
| $35,000 to $49,999 | 35 | 4.6% |
| $50,000 to $74,999 | 48 | 6.3% |
| $75,000 to $99,999 | 99 | 12.9% |
| $100,000 to $149,999 | 136 | 17.8% |
| $150,000 to $199,999 | 88 | 11.5% |
| $200,000+ | 269 | 35.2% |
Family Income by Famaliy Size in East Oakdale
4-person families (140 | 18.3%) account for the highest median family income in East Oakdale with $178,854 per family, while 2-person families (482 | 63.0%) have the highest median income of $70,114 per family member.
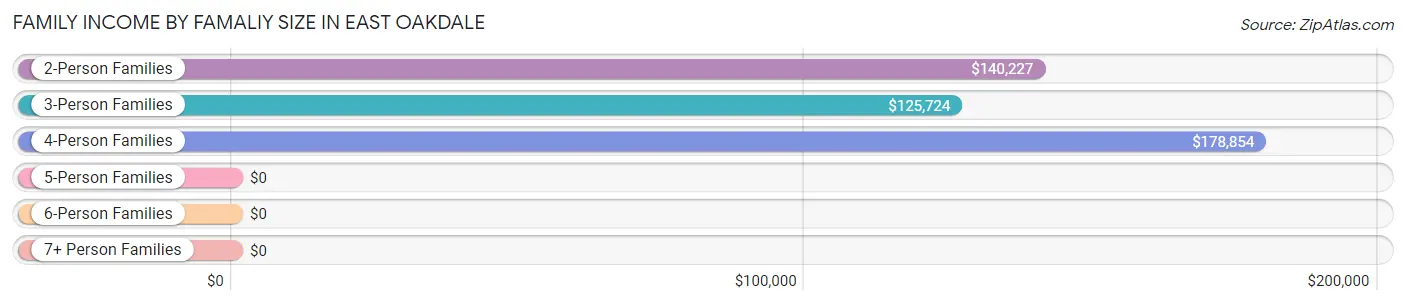
| Income Bracket | # Families | Median Income |
| 2-Person Families | 482 (63.0%) | $140,227 |
| 3-Person Families | 107 (14.0%) | $125,724 |
| 4-Person Families | 140 (18.3%) | $178,854 |
| 5-Person Families | 36 (4.7%) | $0 |
| 6-Person Families | 0 (0.0%) | $0 |
| 7+ Person Families | 0 (0.0%) | $0 |
| Total | 765 (100.0%) | $140,568 |
Family Income by Number of Earners in East Oakdale
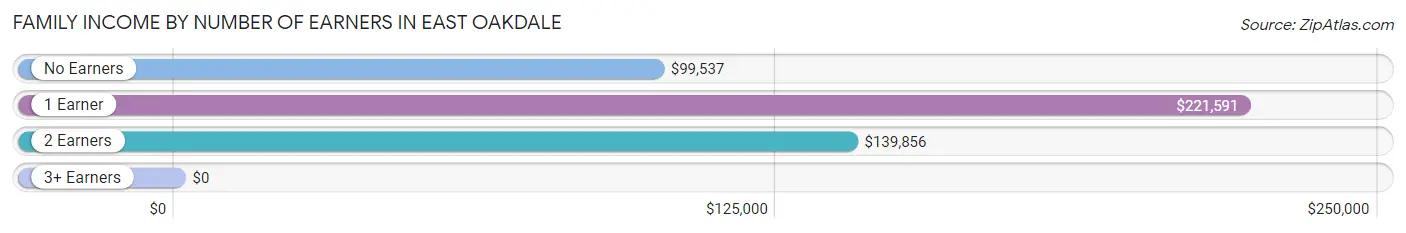
| Number of Earners | # Families | Median Income |
| No Earners | 206 (26.9%) | $99,537 |
| 1 Earner | 264 (34.5%) | $221,591 |
| 2 Earners | 239 (31.2%) | $139,856 |
| 3+ Earners | 56 (7.3%) | $0 |
| Total | 765 (100.0%) | $140,568 |
Household Income in East Oakdale
Household Income Brackets in East Oakdale
With 323 households falling in the category, the $200,000+ income range is the most frequent in East Oakdale, accounting for 32.3% of all households.
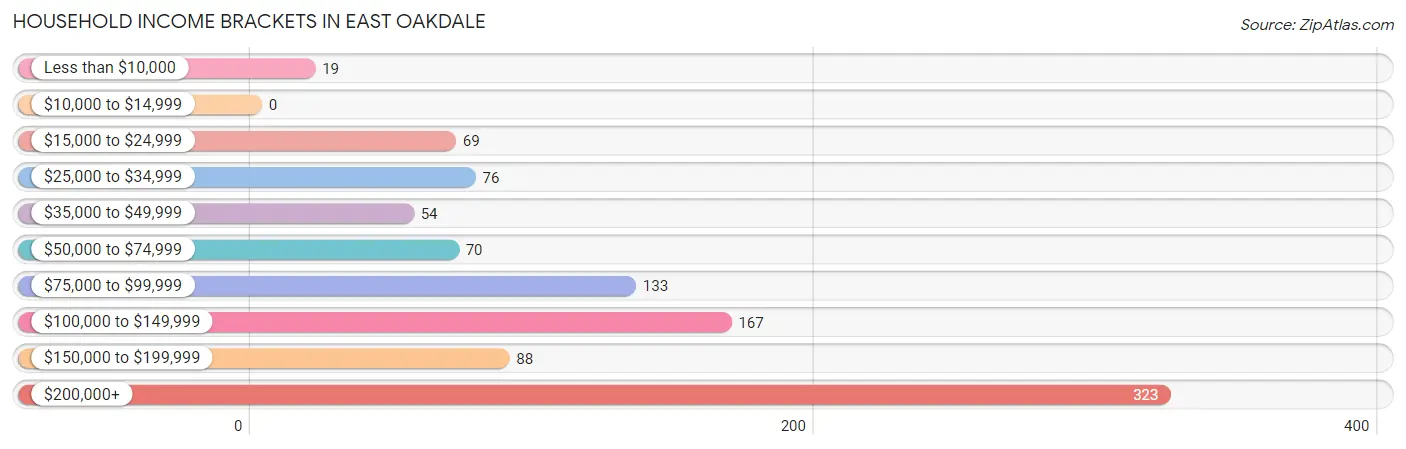
| Income Bracket | # Households | % Households |
| Less than $10,000 | 19 | 1.9% |
| $10,000 to $14,999 | 0 | 0.0% |
| $15,000 to $24,999 | 69 | 6.9% |
| $25,000 to $34,999 | 76 | 7.6% |
| $35,000 to $49,999 | 54 | 5.4% |
| $50,000 to $74,999 | 70 | 7.0% |
| $75,000 to $99,999 | 133 | 13.3% |
| $100,000 to $149,999 | 167 | 16.7% |
| $150,000 to $199,999 | 88 | 8.8% |
| $200,000+ | 323 | 32.3% |
Household Income by Householder Age in East Oakdale
The median household income in East Oakdale is $124,010, with the highest median household income of $194,940 found in the 45 to 64 years age bracket for the primary householder. A total of 293 households (29.3%) fall into this category.
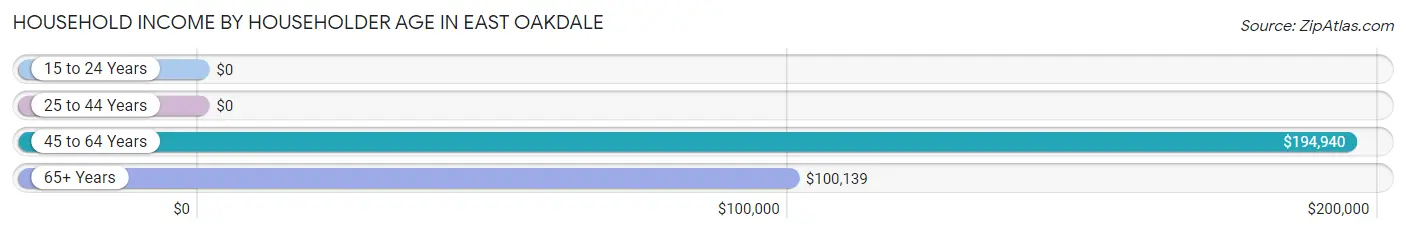
| Income Bracket | # Households | Median Income |
| 15 to 24 Years | 0 (0.0%) | $0 |
| 25 to 44 Years | 177 (17.7%) | $0 |
| 45 to 64 Years | 293 (29.3%) | $194,940 |
| 65+ Years | 529 (52.9%) | $100,139 |
| Total | 999 (100.0%) | $124,010 |
Poverty in East Oakdale
Income Below Poverty by Sex and Age in East Oakdale
With 6.5% poverty level for males and 6.9% for females among the residents of East Oakdale, 18 to 24 year old males and 12 to 14 year old females are the most vulnerable to poverty, with 38 males (41.3%) and 37 females (100.0%) in their respective age groups living below the poverty level.
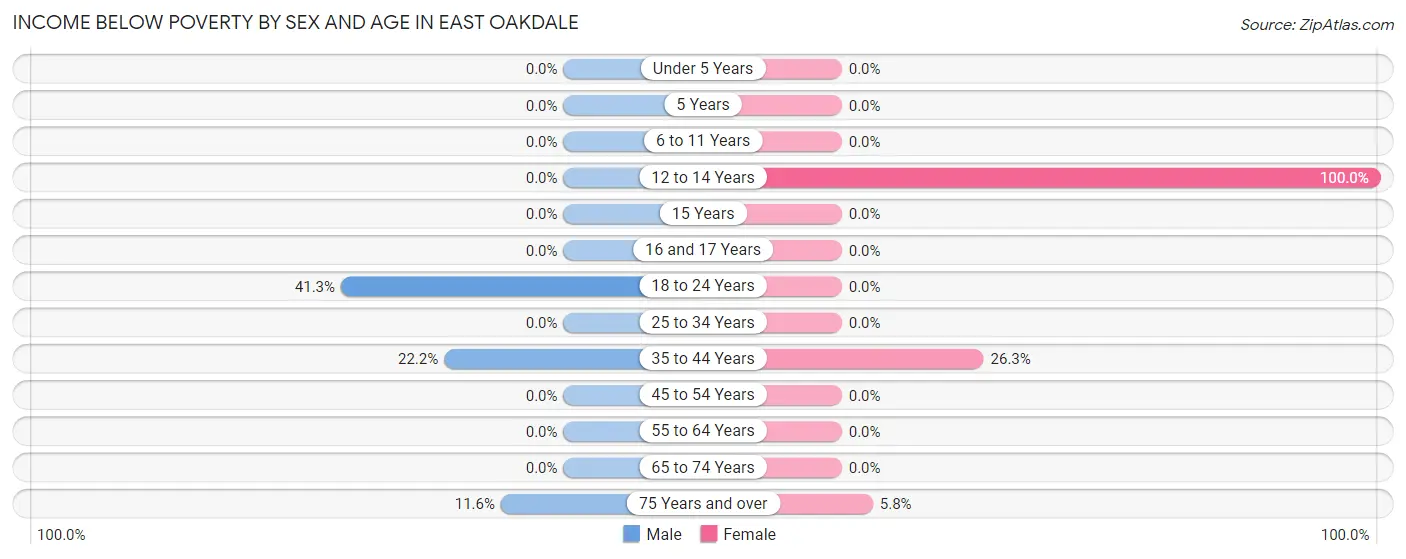
| Age Bracket | Male | Female |
| Under 5 Years | 0 (0.0%) | 0 (0.0%) |
| 5 Years | 0 (0.0%) | 0 (0.0%) |
| 6 to 11 Years | 0 (0.0%) | 0 (0.0%) |
| 12 to 14 Years | 0 (0.0%) | 37 (100.0%) |
| 15 Years | 0 (0.0%) | 0 (0.0%) |
| 16 and 17 Years | 0 (0.0%) | 0 (0.0%) |
| 18 to 24 Years | 38 (41.3%) | 0 (0.0%) |
| 25 to 34 Years | 0 (0.0%) | 0 (0.0%) |
| 35 to 44 Years | 35 (22.2%) | 30 (26.3%) |
| 45 to 54 Years | 0 (0.0%) | 0 (0.0%) |
| 55 to 64 Years | 0 (0.0%) | 0 (0.0%) |
| 65 to 74 Years | 0 (0.0%) | 0 (0.0%) |
| 75 Years and over | 13 (11.6%) | 6 (5.8%) |
| Total | 86 (6.5%) | 73 (6.9%) |
Income Above Poverty by Sex and Age in East Oakdale
According to the poverty statistics in East Oakdale, males aged under 5 years and females aged 5 years are the age groups that are most secure financially, with 100.0% of males and 100.0% of females in these age groups living above the poverty line.
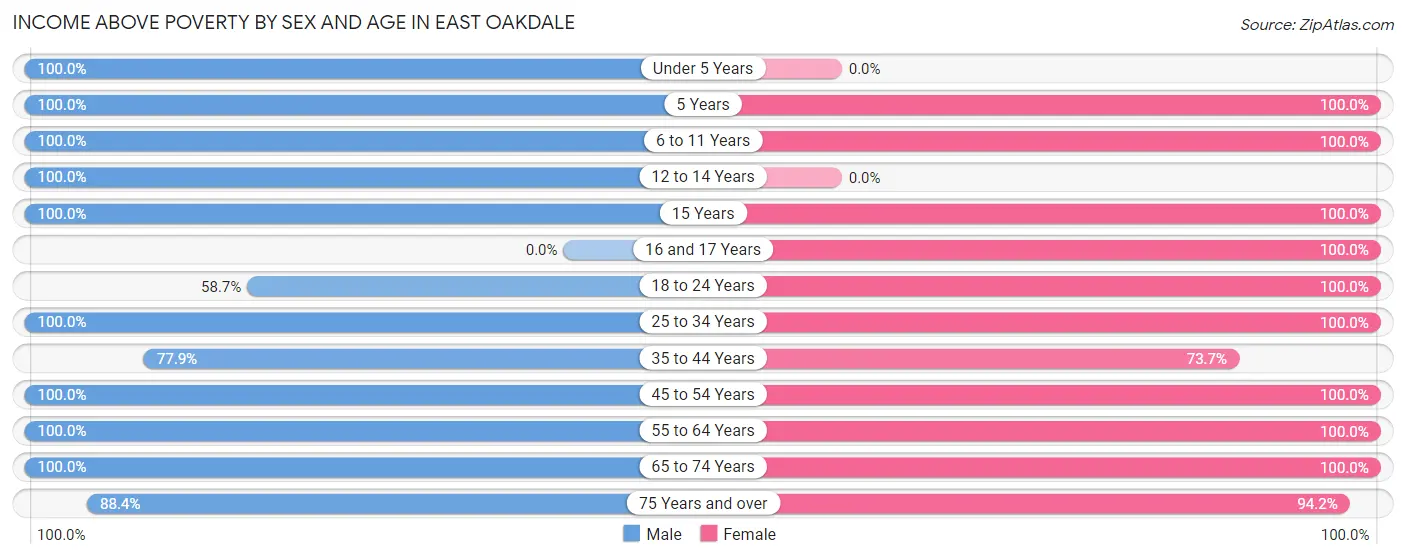
| Age Bracket | Male | Female |
| Under 5 Years | 37 (100.0%) | 0 (0.0%) |
| 5 Years | 38 (100.0%) | 21 (100.0%) |
| 6 to 11 Years | 94 (100.0%) | 56 (100.0%) |
| 12 to 14 Years | 30 (100.0%) | 0 (0.0%) |
| 15 Years | 22 (100.0%) | 22 (100.0%) |
| 16 and 17 Years | 0 (0.0%) | 26 (100.0%) |
| 18 to 24 Years | 54 (58.7%) | 33 (100.0%) |
| 25 to 34 Years | 96 (100.0%) | 56 (100.0%) |
| 35 to 44 Years | 123 (77.8%) | 84 (73.7%) |
| 45 to 54 Years | 71 (100.0%) | 135 (100.0%) |
| 55 to 64 Years | 203 (100.0%) | 199 (100.0%) |
| 65 to 74 Years | 362 (100.0%) | 263 (100.0%) |
| 75 Years and over | 99 (88.4%) | 98 (94.2%) |
| Total | 1,229 (93.5%) | 993 (93.1%) |
Income Below Poverty Among Married-Couple Families in East Oakdale
The poverty statistics for married-couple families in East Oakdale show that 4.8% or 35 of the total 725 families live below the poverty line. Families with 1 or 2 children have the highest poverty rate of 23.3%, comprising of 35 families. On the other hand, families with no children have the lowest poverty rate of 0.0%, which includes 0 families.
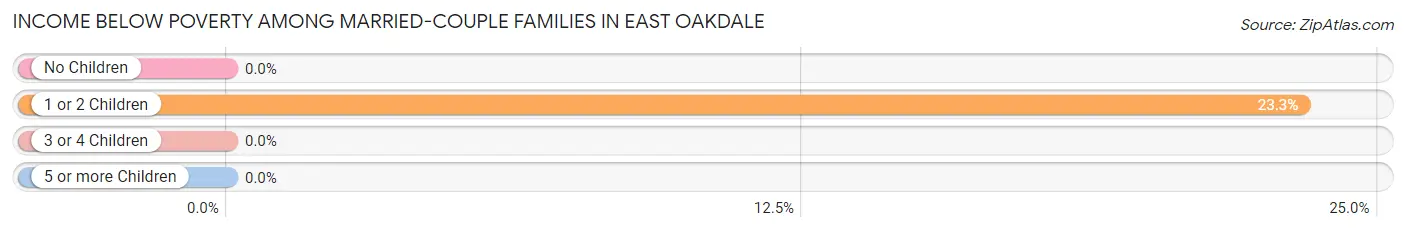
| Children | Above Poverty | Below Poverty |
| No Children | 539 (100.0%) | 0 (0.0%) |
| 1 or 2 Children | 115 (76.7%) | 35 (23.3%) |
| 3 or 4 Children | 36 (100.0%) | 0 (0.0%) |
| 5 or more Children | 0 (0.0%) | 0 (0.0%) |
| Total | 690 (95.2%) | 35 (4.8%) |
Income Below Poverty Among Single-Parent Households in East Oakdale
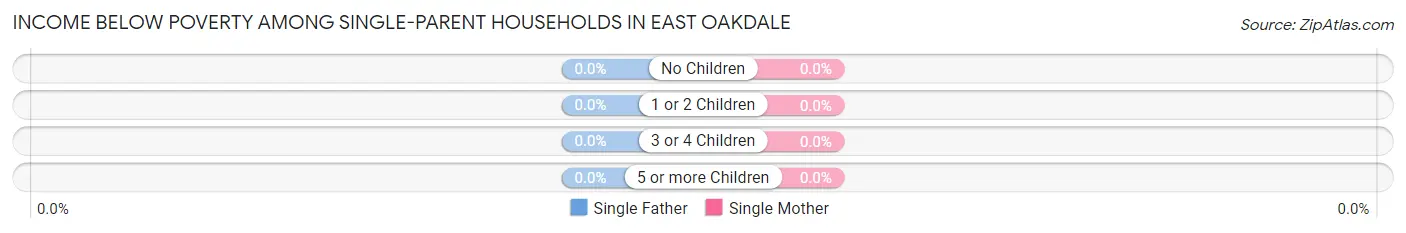
| Children | Single Father | Single Mother |
| No Children | 0 (0.0%) | 0 (0.0%) |
| 1 or 2 Children | 0 (0.0%) | 0 (0.0%) |
| 3 or 4 Children | 0 (0.0%) | 0 (0.0%) |
| 5 or more Children | 0 (0.0%) | 0 (0.0%) |
| Total | 0 (0.0%) | 0 (0.0%) |
Income Below Poverty Among Married-Couple vs Single-Parent Households in East Oakdale
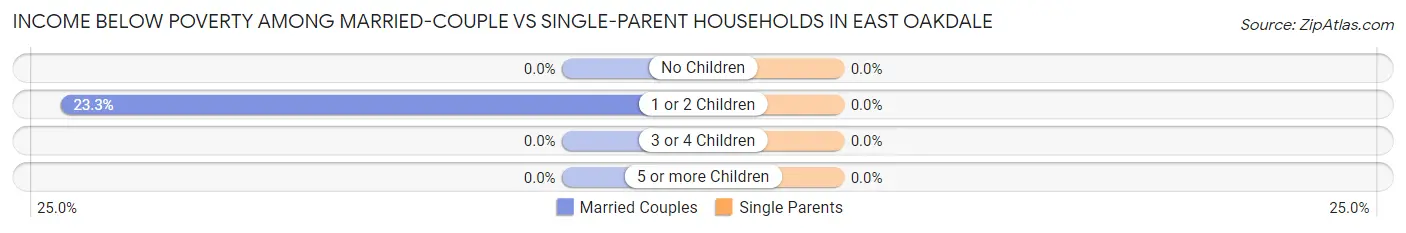
| Children | Married-Couple Families | Single-Parent Households |
| No Children | 0 (0.0%) | 0 (0.0%) |
| 1 or 2 Children | 35 (23.3%) | 0 (0.0%) |
| 3 or 4 Children | 0 (0.0%) | 0 (0.0%) |
| 5 or more Children | 0 (0.0%) | 0 (0.0%) |
| Total | 35 (4.8%) | 0 (0.0%) |
Race in East Oakdale
The most populous races in East Oakdale are White / Caucasian (1,898 | 79.7%), Hispanic or Latino (297 | 12.5%), and Two or more Races (194 | 8.2%).
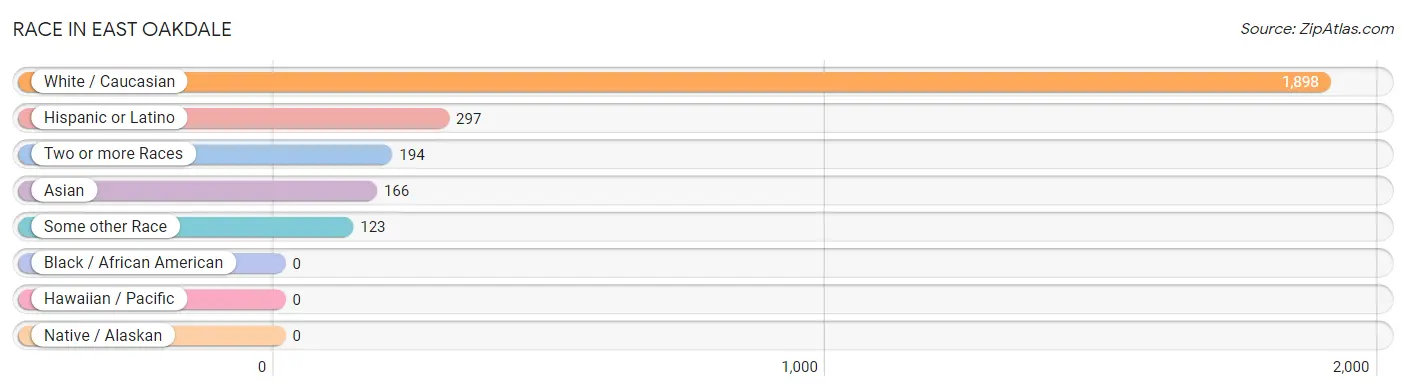
| Race | # Population | % Population |
| Asian | 166 | 7.0% |
| Black / African American | 0 | 0.0% |
| Hawaiian / Pacific | 0 | 0.0% |
| Hispanic or Latino | 297 | 12.5% |
| Native / Alaskan | 0 | 0.0% |
| White / Caucasian | 1,898 | 79.7% |
| Two or more Races | 194 | 8.2% |
| Some other Race | 123 | 5.2% |
| Total | 2,381 | 100.0% |
Ancestry in East Oakdale
The most populous ancestries reported in East Oakdale are English (454 | 19.1%), German (232 | 9.7%), Irish (213 | 8.9%), Polish (198 | 8.3%), and Italian (193 | 8.1%), together accounting for 54.2% of all East Oakdale residents.
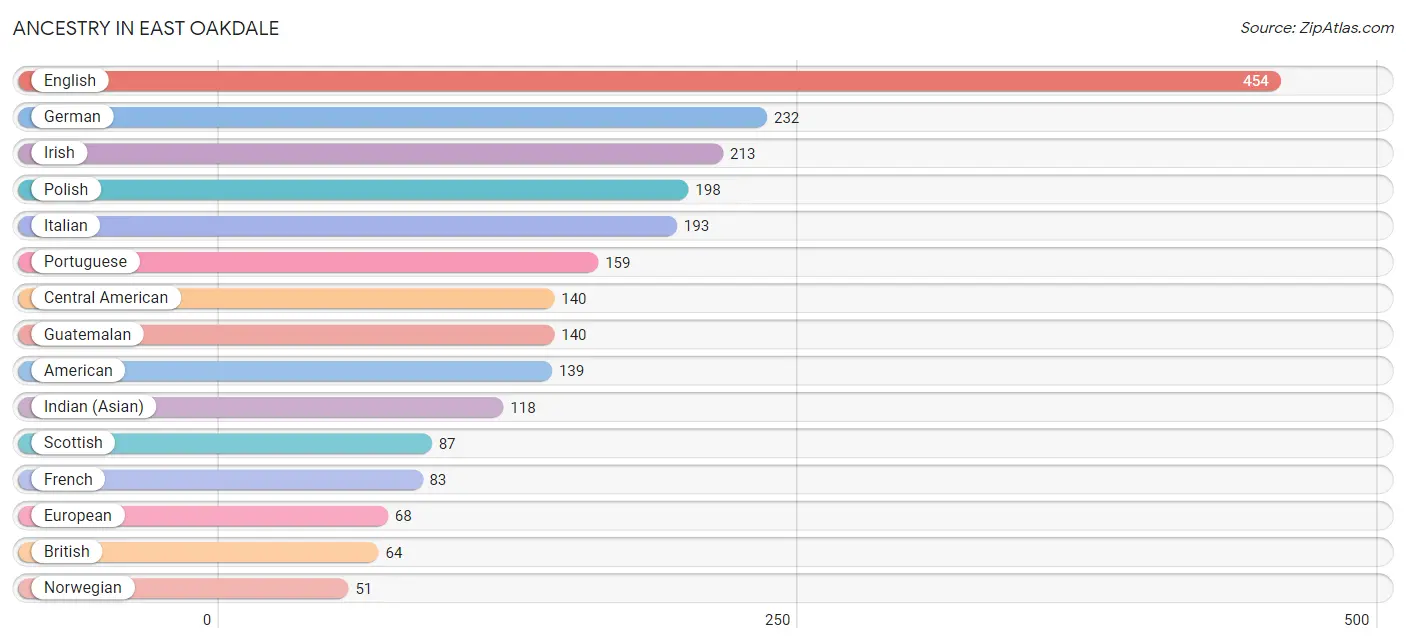
| Ancestry | # Population | % Population |
| American | 139 | 5.8% |
| Armenian | 21 | 0.9% |
| Assyrian / Chaldean / Syriac | 9 | 0.4% |
| Austrian | 12 | 0.5% |
| Bhutanese | 14 | 0.6% |
| British | 64 | 2.7% |
| Burmese | 13 | 0.5% |
| Central American | 140 | 5.9% |
| Danish | 25 | 1.1% |
| Dutch | 20 | 0.8% |
| English | 454 | 19.1% |
| European | 68 | 2.9% |
| Finnish | 47 | 2.0% |
| French | 83 | 3.5% |
| German | 232 | 9.7% |
| Guatemalan | 140 | 5.9% |
| Indian (Asian) | 118 | 5.0% |
| Irish | 213 | 8.9% |
| Italian | 193 | 8.1% |
| Japanese | 19 | 0.8% |
| Mexican | 8 | 0.3% |
| Native Hawaiian | 12 | 0.5% |
| Northern European | 17 | 0.7% |
| Norwegian | 51 | 2.1% |
| Polish | 198 | 8.3% |
| Portuguese | 159 | 6.7% |
| Scandinavian | 11 | 0.5% |
| Scottish | 87 | 3.6% |
| Spaniard | 26 | 1.1% |
| Sri Lankan | 7 | 0.3% |
| Swedish | 24 | 1.0% |
| Thai | 28 | 1.2% |
| Welsh | 13 | 0.5% | View All 33 Rows |
Immigrants in East Oakdale
The most numerous immigrant groups reported in East Oakdale came from Asia (116 | 4.9%), Central America (103 | 4.3%), Guatemala (103 | 4.3%), Latin America (103 | 4.3%), and Eastern Asia (41 | 1.7%), together accounting for 19.6% of all East Oakdale residents.
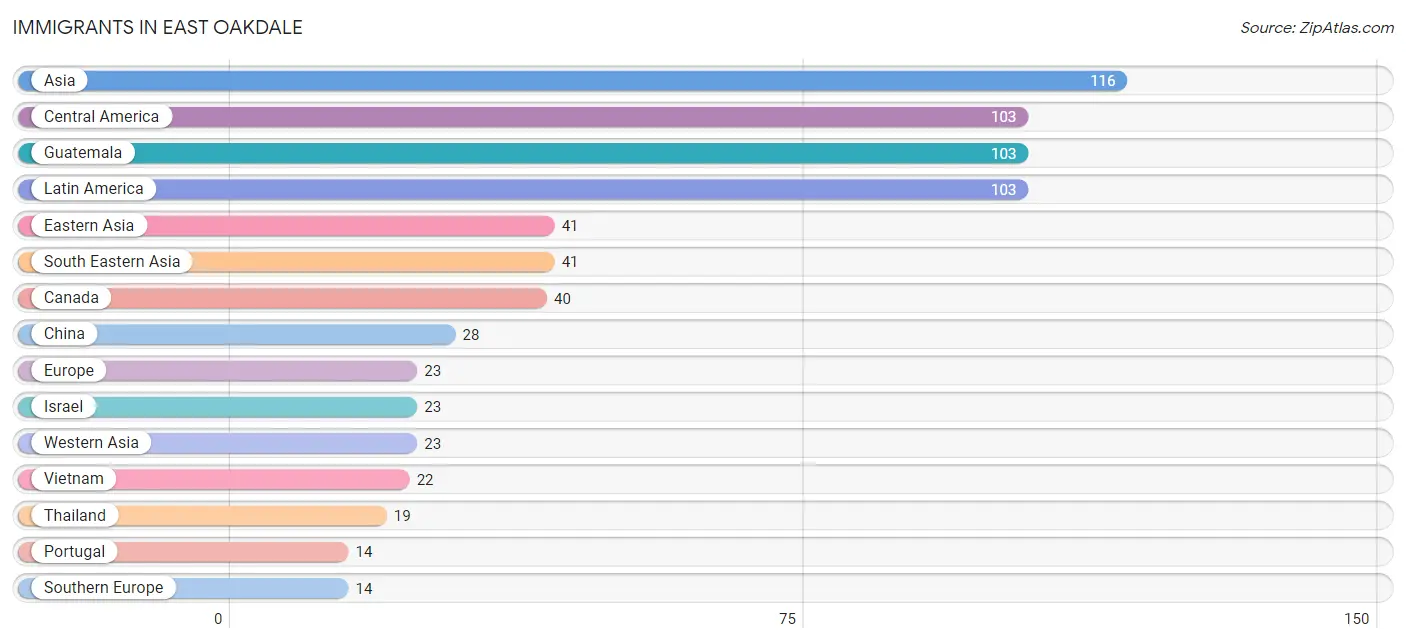
| Immigration Origin | # Population | % Population |
| Asia | 116 | 4.9% |
| Canada | 40 | 1.7% |
| Central America | 103 | 4.3% |
| China | 28 | 1.2% |
| Eastern Asia | 41 | 1.7% |
| Europe | 23 | 1.0% |
| Guatemala | 103 | 4.3% |
| India | 11 | 0.5% |
| Israel | 23 | 1.0% |
| Korea | 13 | 0.5% |
| Latin America | 103 | 4.3% |
| Northern Europe | 9 | 0.4% |
| Portugal | 14 | 0.6% |
| South Central Asia | 11 | 0.5% |
| South Eastern Asia | 41 | 1.7% |
| Southern Europe | 14 | 0.6% |
| Thailand | 19 | 0.8% |
| Vietnam | 22 | 0.9% |
| Western Asia | 23 | 1.0% | View All 19 Rows |
Sex and Age in East Oakdale
Sex and Age in East Oakdale
The most populous age groups in East Oakdale are 65 to 69 Years (215 | 16.4%) for men and 65 to 69 Years (171 | 16.0%) for women.
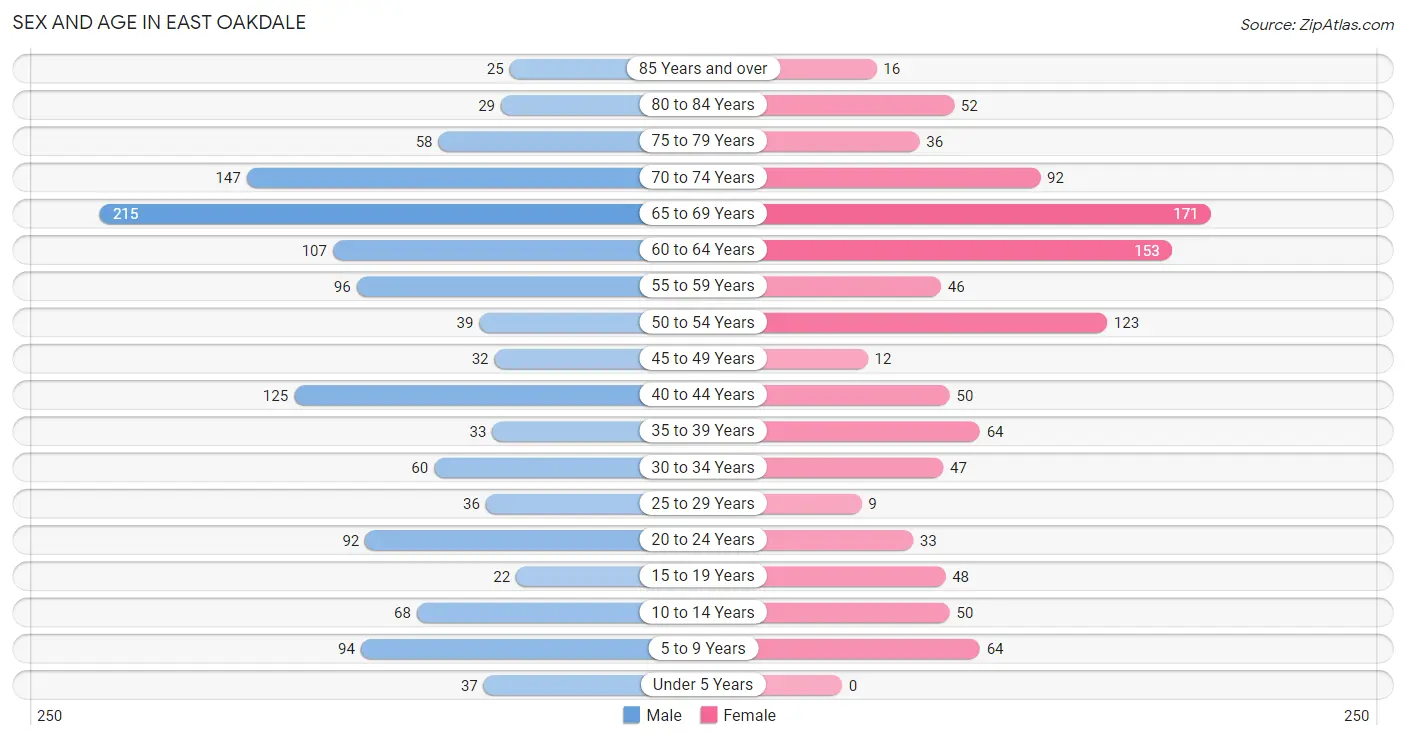
| Age Bracket | Male | Female |
| Under 5 Years | 37 (2.8%) | 0 (0.0%) |
| 5 to 9 Years | 94 (7.1%) | 64 (6.0%) |
| 10 to 14 Years | 68 (5.2%) | 50 (4.7%) |
| 15 to 19 Years | 22 (1.7%) | 48 (4.5%) |
| 20 to 24 Years | 92 (7.0%) | 33 (3.1%) |
| 25 to 29 Years | 36 (2.7%) | 9 (0.8%) |
| 30 to 34 Years | 60 (4.6%) | 47 (4.4%) |
| 35 to 39 Years | 33 (2.5%) | 64 (6.0%) |
| 40 to 44 Years | 125 (9.5%) | 50 (4.7%) |
| 45 to 49 Years | 32 (2.4%) | 12 (1.1%) |
| 50 to 54 Years | 39 (3.0%) | 123 (11.5%) |
| 55 to 59 Years | 96 (7.3%) | 46 (4.3%) |
| 60 to 64 Years | 107 (8.1%) | 153 (14.3%) |
| 65 to 69 Years | 215 (16.4%) | 171 (16.0%) |
| 70 to 74 Years | 147 (11.2%) | 92 (8.6%) |
| 75 to 79 Years | 58 (4.4%) | 36 (3.4%) |
| 80 to 84 Years | 29 (2.2%) | 52 (4.9%) |
| 85 Years and over | 25 (1.9%) | 16 (1.5%) |
| Total | 1,315 (100.0%) | 1,066 (100.0%) |
Families and Households in East Oakdale
Median Family Size in East Oakdale
The median family size in East Oakdale is 2.72 persons per family, with single female/mother families (28 | 3.7%) accounting for the largest median family size of 2.89 persons per family. On the other hand, single male/father families (12 | 1.6%) represent the smallest median family size with 2.17 persons per family.
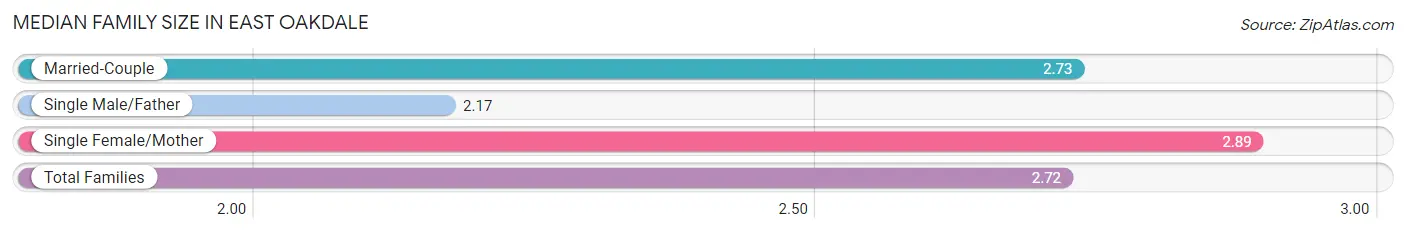
| Family Type | # Families | Family Size |
| Married-Couple | 725 (94.8%) | 2.73 |
| Single Male/Father | 12 (1.6%) | 2.17 |
| Single Female/Mother | 28 (3.7%) | 2.89 |
| Total Families | 765 (100.0%) | 2.72 |
Median Household Size in East Oakdale
The median household size in East Oakdale is 2.38 persons per household, with single female/mother households (28 | 2.8%) accounting for the largest median household size of 3.32 persons per household. non-family households (234 | 23.4%) represent the smallest median household size with 1.10 persons per household.
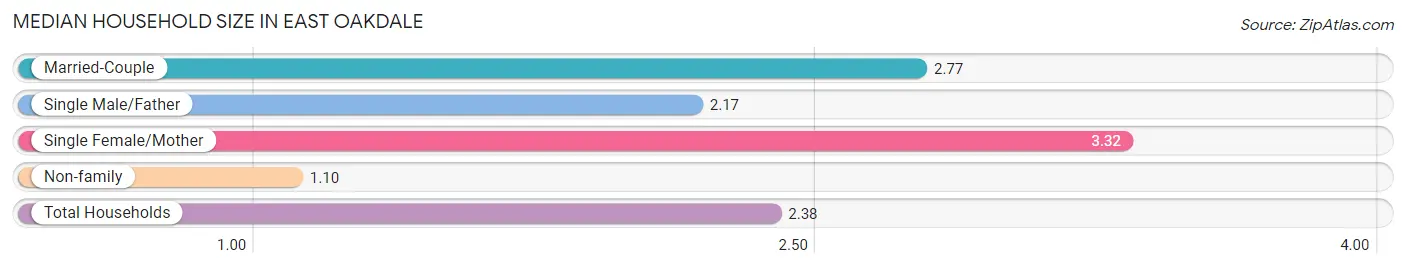
| Household Type | # Households | Household Size |
| Married-Couple | 725 (72.6%) | 2.77 |
| Single Male/Father | 12 (1.2%) | 2.17 |
| Single Female/Mother | 28 (2.8%) | 3.32 |
| Non-family | 234 (23.4%) | 1.10 |
| Total Households | 999 (100.0%) | 2.38 |
Household Size by Marriage Status in East Oakdale
Out of a total of 999 households in East Oakdale, 765 (76.6%) are family households, while 234 (23.4%) are nonfamily households. The most numerous type of family households are 2-person households, comprising 470, and the most common type of nonfamily households are 1-person households, comprising 208.
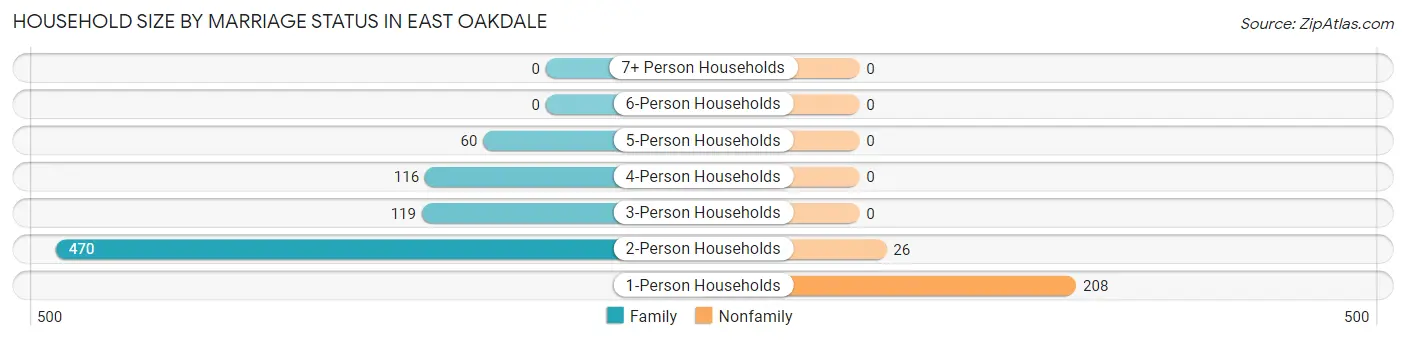
| Household Size | Family Households | Nonfamily Households |
| 1-Person Households | - | 208 (20.8%) |
| 2-Person Households | 470 (47.0%) | 26 (2.6%) |
| 3-Person Households | 119 (11.9%) | 0 (0.0%) |
| 4-Person Households | 116 (11.6%) | 0 (0.0%) |
| 5-Person Households | 60 (6.0%) | 0 (0.0%) |
| 6-Person Households | 0 (0.0%) | 0 (0.0%) |
| 7+ Person Households | 0 (0.0%) | 0 (0.0%) |
| Total | 765 (76.6%) | 234 (23.4%) |
Female Fertility in East Oakdale
Fertility by Age in East Oakdale
Average fertility rate in East Oakdale is 39.0 births per 1,000 women. Women in the age bracket of 20 to 34 years have the highest fertility rate with 124.0 births per 1,000 women. Women in the age bracket of 20 to 34 years acount for 100.0% of all women with births.
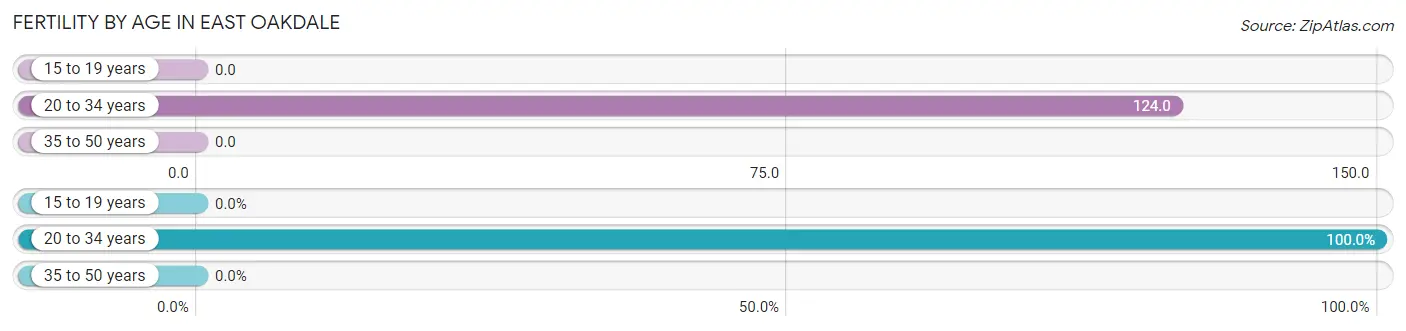
| Age Bracket | Women with Births | Births / 1,000 Women |
| 15 to 19 years | 0 (0.0%) | 0.0 |
| 20 to 34 years | 11 (100.0%) | 124.0 |
| 35 to 50 years | 0 (0.0%) | 0.0 |
| Total | 11 (100.0%) | 39.0 |
Fertility by Age by Marriage Status in East Oakdale
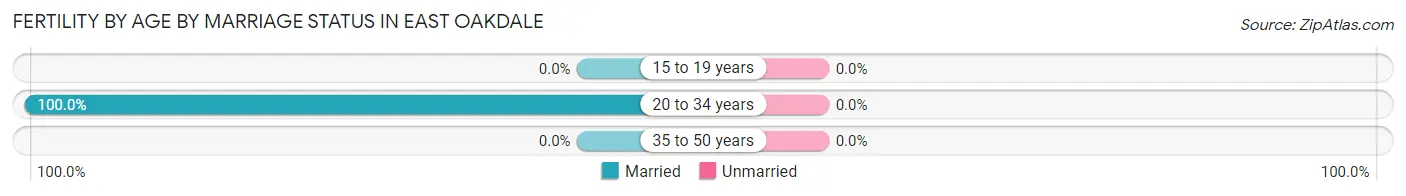
| Age Bracket | Married | Unmarried |
| 15 to 19 years | 0 (0.0%) | 0 (0.0%) |
| 20 to 34 years | 11 (100.0%) | 0 (0.0%) |
| 35 to 50 years | 0 (0.0%) | 0 (0.0%) |
| Total | 11 (100.0%) | 0 (0.0%) |
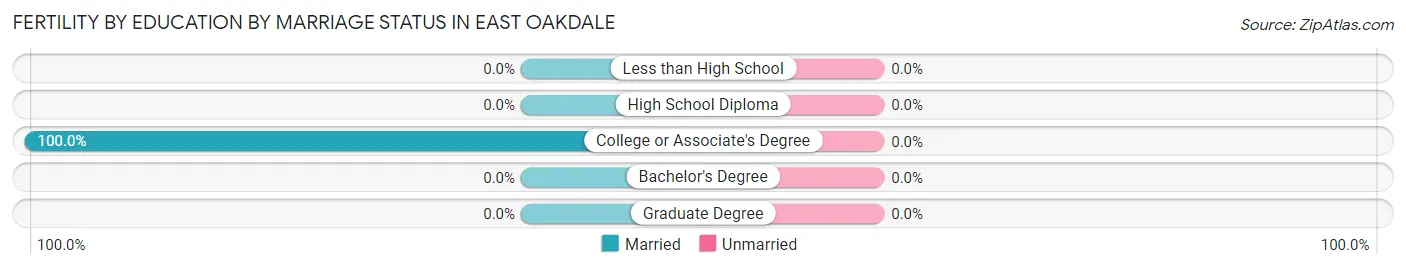
Fertility by Education in East Oakdale
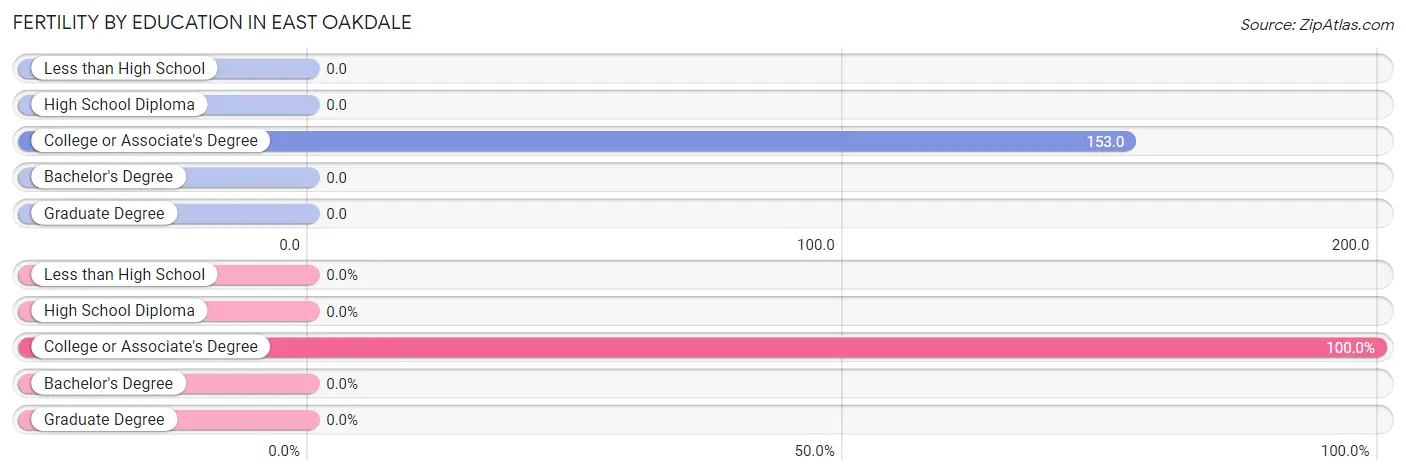
| Educational Attainment | Women with Births | Births / 1,000 Women |
| Less than High School | 0 (0.0%) | 0.0 |
| High School Diploma | 0 (0.0%) | 0.0 |
| College or Associate's Degree | 11 (100.0%) | 153.0 |
| Bachelor's Degree | 0 (0.0%) | 0.0 |
| Graduate Degree | 0 (0.0%) | 0.0 |
| Total | 11 (100.0%) | 39.0 |
Fertility by Education by Marriage Status in East Oakdale
| Educational Attainment | Married | Unmarried |
| Less than High School | 0 (0.0%) | 0 (0.0%) |
| High School Diploma | 0 (0.0%) | 0 (0.0%) |
| College or Associate's Degree | 11 (100.0%) | 0 (0.0%) |
| Bachelor's Degree | 0 (0.0%) | 0 (0.0%) |
| Graduate Degree | 0 (0.0%) | 0 (0.0%) |
| Total | 11 (100.0%) | 0 (0.0%) |
Employment Characteristics in East Oakdale
Employment by Class of Employer in East Oakdale
Among the 827 employed individuals in East Oakdale, private company employees (326 | 39.4%), self-employed (incorporated) (227 | 27.5%), and local government employees (108 | 13.1%) make up the most common classes of employment.
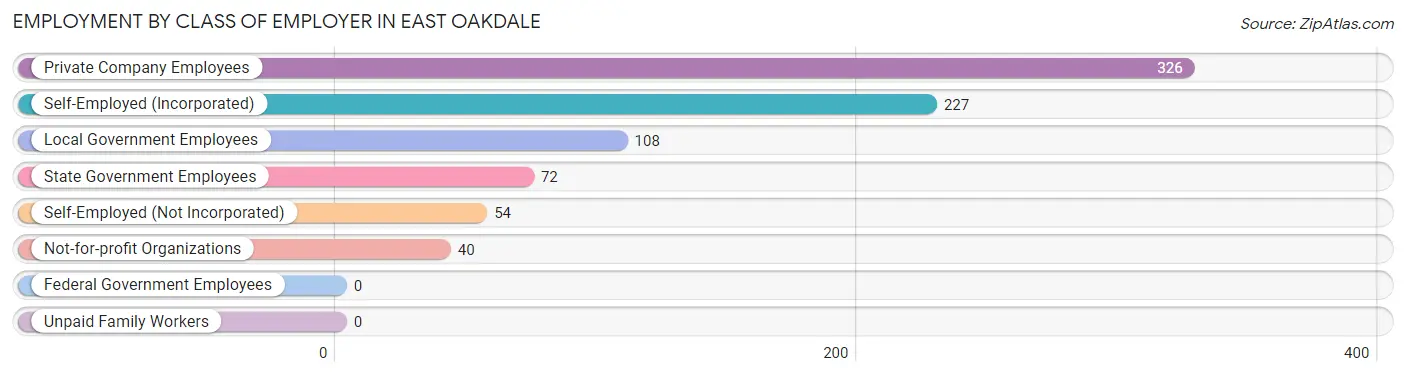
| Employer Class | # Employees | % Employees |
| Private Company Employees | 326 | 39.4% |
| Self-Employed (Incorporated) | 227 | 27.5% |
| Self-Employed (Not Incorporated) | 54 | 6.5% |
| Not-for-profit Organizations | 40 | 4.8% |
| Local Government Employees | 108 | 13.1% |
| State Government Employees | 72 | 8.7% |
| Federal Government Employees | 0 | 0.0% |
| Unpaid Family Workers | 0 | 0.0% |
| Total | 827 | 100.0% |
Employment Status by Age in East Oakdale
According to the labor force statistics for East Oakdale, out of the total population over 16 years of age (2,024), 46.4% or 939 individuals are in the labor force, with 5.3% or 50 of them unemployed. The age group with the highest labor force participation rate is 35 to 44 years, with 82.4% or 224 individuals in the labor force. Within the labor force, the 20 to 24 years age range has the highest percentage of unemployed individuals, with 30.3% or 27 of them being unemployed.
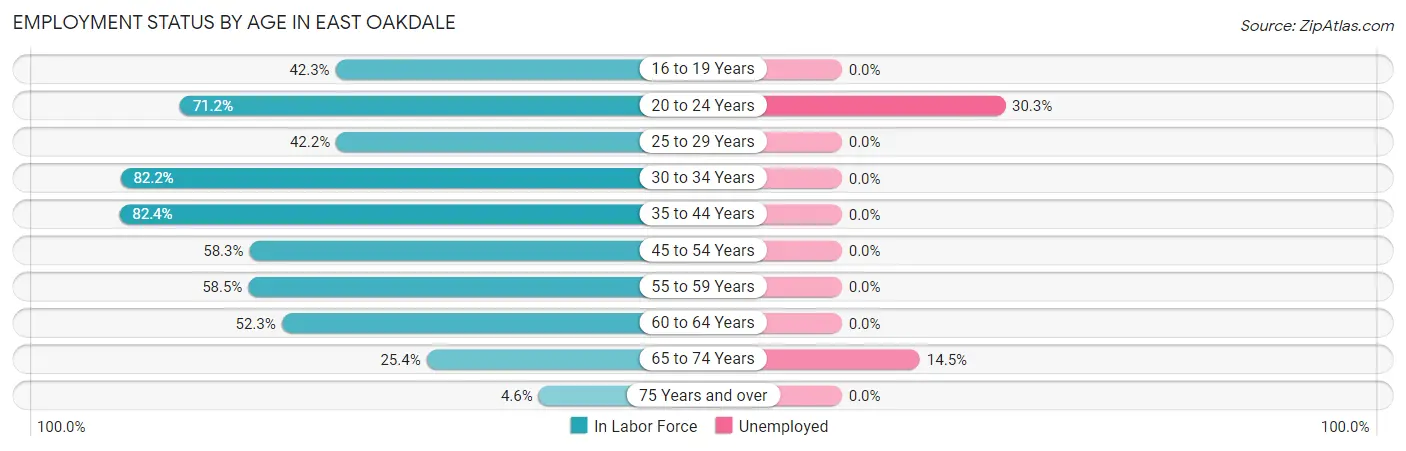
| Age Bracket | In Labor Force | Unemployed |
| 16 to 19 Years | 11 (42.3%) | 0 (0.0%) |
| 20 to 24 Years | 89 (71.2%) | 27 (30.3%) |
| 25 to 29 Years | 19 (42.2%) | 0 (0.0%) |
| 30 to 34 Years | 88 (82.2%) | 0 (0.0%) |
| 35 to 44 Years | 224 (82.4%) | 0 (0.0%) |
| 45 to 54 Years | 120 (58.3%) | 0 (0.0%) |
| 55 to 59 Years | 83 (58.5%) | 0 (0.0%) |
| 60 to 64 Years | 136 (52.3%) | 0 (0.0%) |
| 65 to 74 Years | 159 (25.4%) | 23 (14.5%) |
| 75 Years and over | 10 (4.6%) | 0 (0.0%) |
| Total | 939 (46.4%) | 50 (5.3%) |
Employment Status by Educational Attainment in East Oakdale
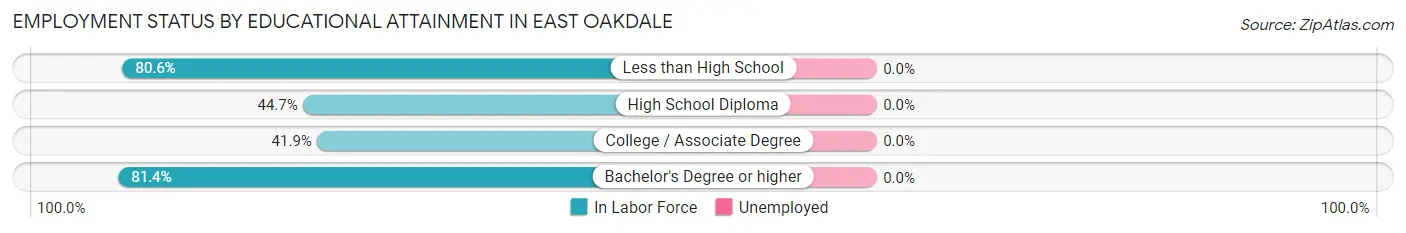
| Educational Attainment | In Labor Force | Unemployed |
| Less than High School | 79 (80.6%) | 0 (0.0%) |
| High School Diploma | 72 (44.7%) | 0 (0.0%) |
| College / Associate Degree | 117 (41.9%) | 0 (0.0%) |
| Bachelor's Degree or higher | 402 (81.4%) | 0 (0.0%) |
| Total | 670 (64.9%) | 0 (0.0%) |
Employment Occupations by Sex in East Oakdale
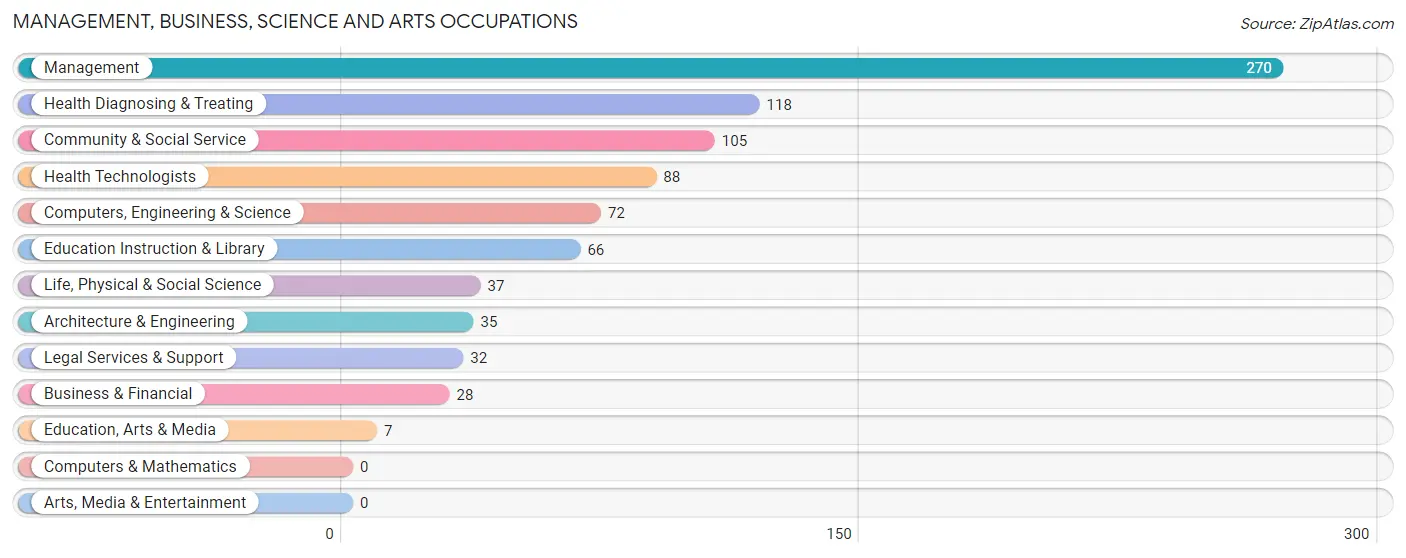
Management, Business, Science and Arts Occupations
The most common Management, Business, Science and Arts occupations in East Oakdale are Management (270 | 30.4%), Health Diagnosing & Treating (118 | 13.3%), Community & Social Service (105 | 11.8%), Health Technologists (88 | 9.9%), and Computers, Engineering & Science (72 | 8.1%).
Management, Business, Science and Arts Occupations by Sex
Within the Management, Business, Science and Arts occupations in East Oakdale, the most male-oriented occupations are Architecture & Engineering (100.0%), Management (87.4%), and Health Technologists (68.2%), while the most female-oriented occupations are Education, Arts & Media (100.0%), Legal Services & Support (100.0%), and Community & Social Service (74.3%).
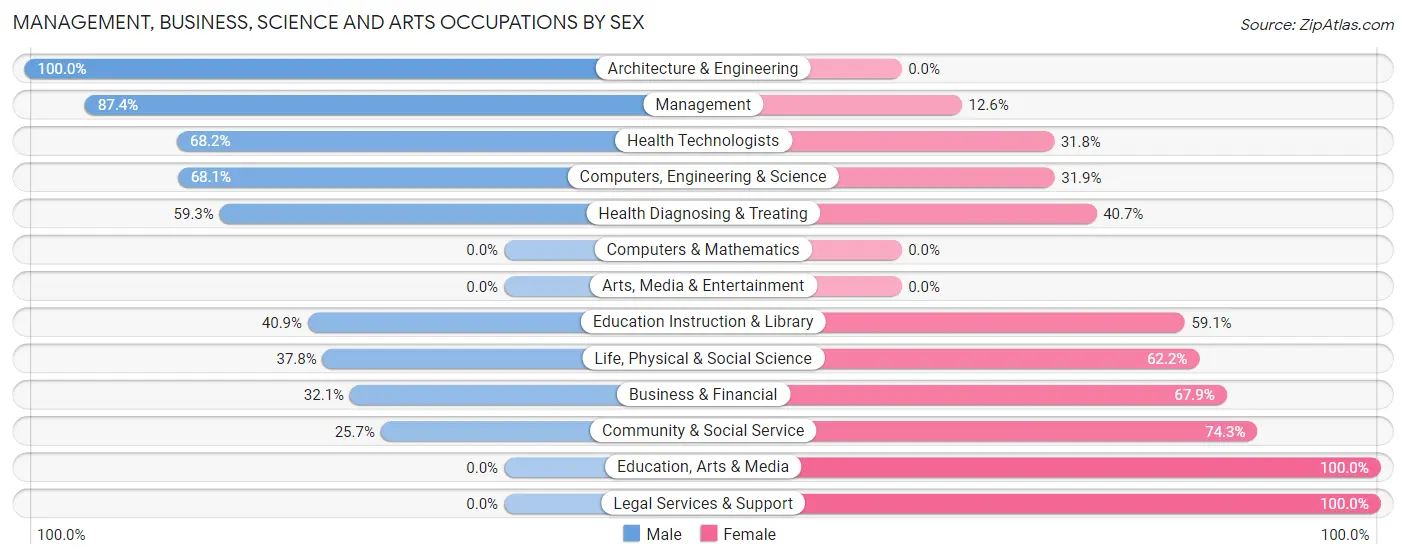
| Occupation | Male | Female |
| Management | 236 (87.4%) | 34 (12.6%) |
| Business & Financial | 9 (32.1%) | 19 (67.9%) |
| Computers, Engineering & Science | 49 (68.1%) | 23 (31.9%) |
| Computers & Mathematics | 0 (0.0%) | 0 (0.0%) |
| Architecture & Engineering | 35 (100.0%) | 0 (0.0%) |
| Life, Physical & Social Science | 14 (37.8%) | 23 (62.2%) |
| Community & Social Service | 27 (25.7%) | 78 (74.3%) |
| Education, Arts & Media | 0 (0.0%) | 7 (100.0%) |
| Legal Services & Support | 0 (0.0%) | 32 (100.0%) |
| Education Instruction & Library | 27 (40.9%) | 39 (59.1%) |
| Arts, Media & Entertainment | 0 (0.0%) | 0 (0.0%) |
| Health Diagnosing & Treating | 70 (59.3%) | 48 (40.7%) |
| Health Technologists | 60 (68.2%) | 28 (31.8%) |
| Total (Category) | 391 (65.9%) | 202 (34.1%) |
| Total (Overall) | 611 (68.7%) | 278 (31.3%) |
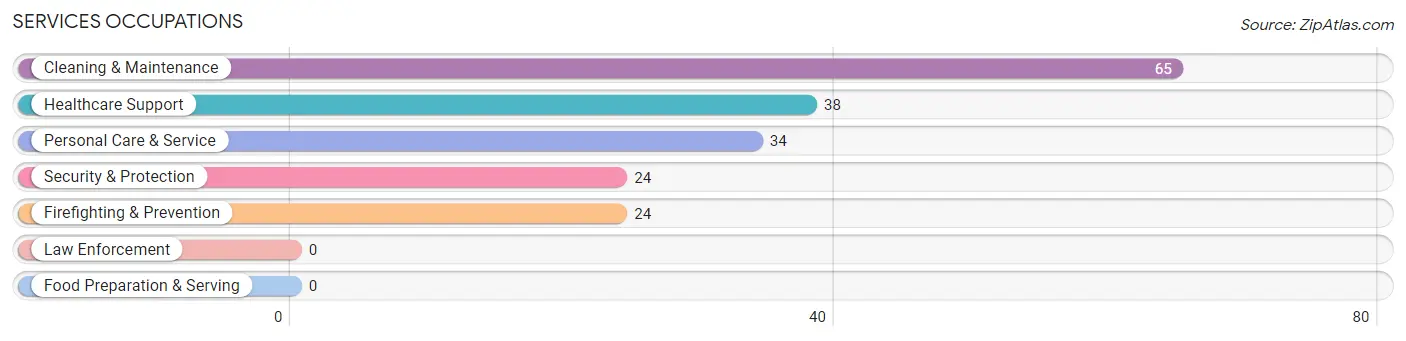
Services Occupations
The most common Services occupations in East Oakdale are Cleaning & Maintenance (65 | 7.3%), Healthcare Support (38 | 4.3%), Personal Care & Service (34 | 3.8%), Security & Protection (24 | 2.7%), and Firefighting & Prevention (24 | 2.7%).
Services Occupations by Sex
Within the Services occupations in East Oakdale, the most male-oriented occupations are Healthcare Support (100.0%), Security & Protection (100.0%), and Firefighting & Prevention (100.0%), while the most female-oriented occupations are Cleaning & Maintenance (46.2%), and Personal Care & Service (44.1%).
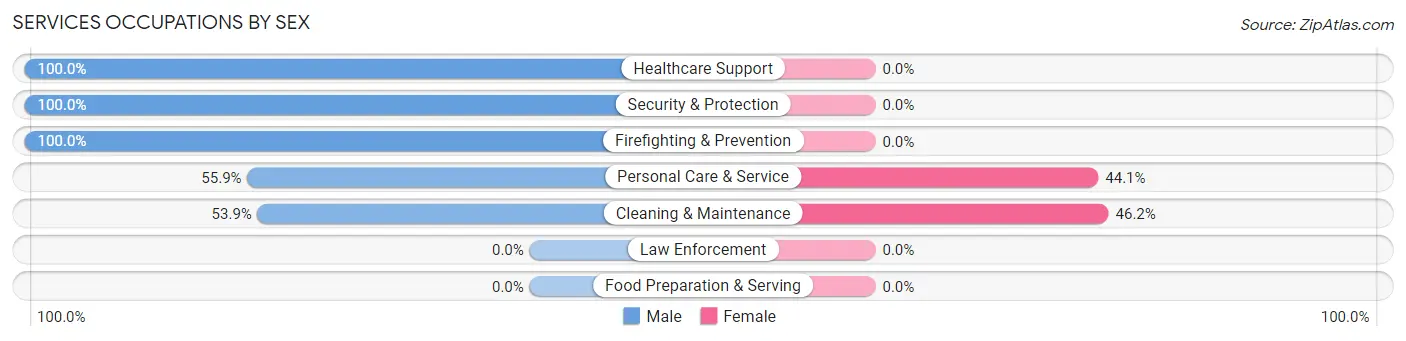
| Occupation | Male | Female |
| Healthcare Support | 38 (100.0%) | 0 (0.0%) |
| Security & Protection | 24 (100.0%) | 0 (0.0%) |
| Firefighting & Prevention | 24 (100.0%) | 0 (0.0%) |
| Law Enforcement | 0 (0.0%) | 0 (0.0%) |
| Food Preparation & Serving | 0 (0.0%) | 0 (0.0%) |
| Cleaning & Maintenance | 35 (53.8%) | 30 (46.2%) |
| Personal Care & Service | 19 (55.9%) | 15 (44.1%) |
| Total (Category) | 116 (72.1%) | 45 (28.0%) |
| Total (Overall) | 611 (68.7%) | 278 (31.3%) |
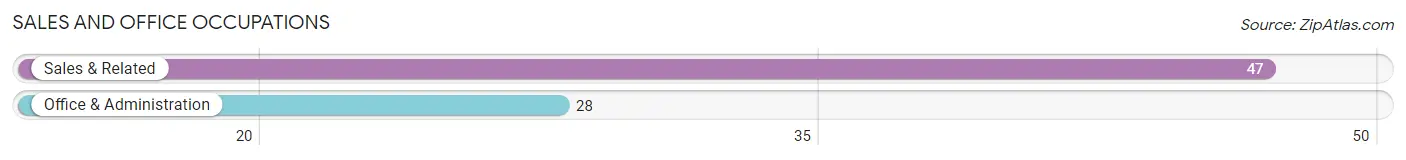
Sales and Office Occupations
The most common Sales and Office occupations in East Oakdale are Sales & Related (47 | 5.3%), and Office & Administration (28 | 3.2%).
Sales and Office Occupations by Sex
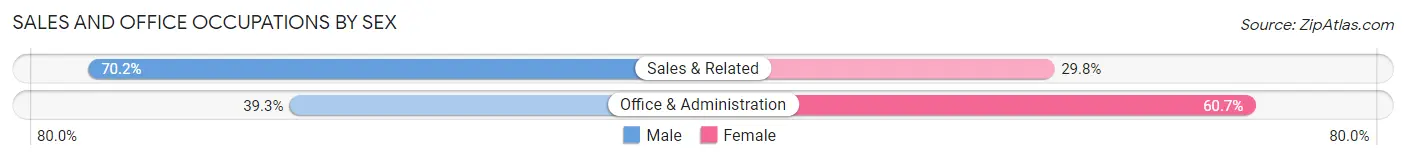
| Occupation | Male | Female |
| Sales & Related | 33 (70.2%) | 14 (29.8%) |
| Office & Administration | 11 (39.3%) | 17 (60.7%) |
| Total (Category) | 44 (58.7%) | 31 (41.3%) |
| Total (Overall) | 611 (68.7%) | 278 (31.3%) |
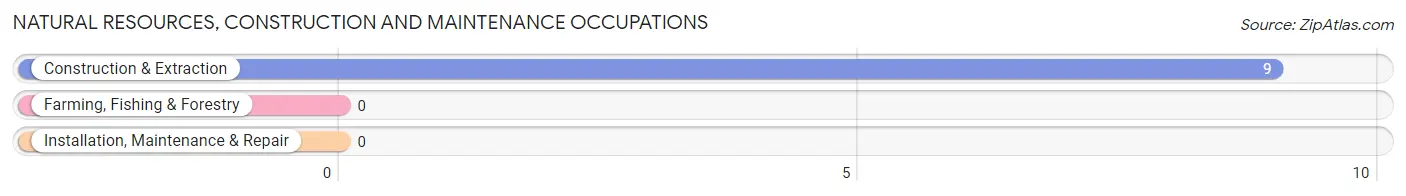
Natural Resources, Construction and Maintenance Occupations
The most common Natural Resources, Construction and Maintenance occupations in East Oakdale are , and Construction & Extraction (9 | 1.0%).
Natural Resources, Construction and Maintenance Occupations by Sex
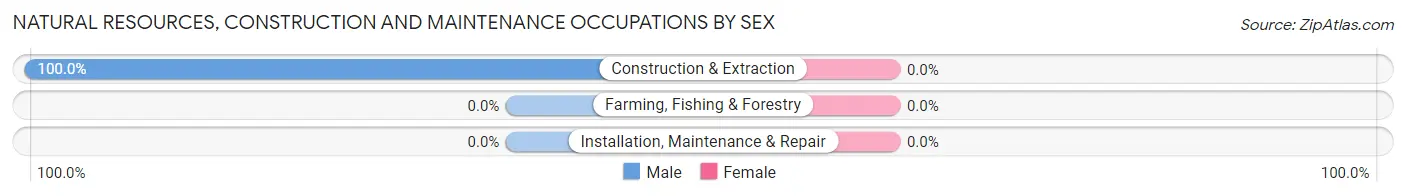
| Occupation | Male | Female |
| Farming, Fishing & Forestry | 0 (0.0%) | 0 (0.0%) |
| Construction & Extraction | 9 (100.0%) | 0 (0.0%) |
| Installation, Maintenance & Repair | 0 (0.0%) | 0 (0.0%) |
| Total (Category) | 9 (100.0%) | 0 (0.0%) |
| Total (Overall) | 611 (68.7%) | 278 (31.3%) |
Production, Transportation and Moving Occupations
The most common Production, Transportation and Moving occupations in East Oakdale are Material Moving (22 | 2.5%), Transportation (17 | 1.9%), and Production (12 | 1.3%).
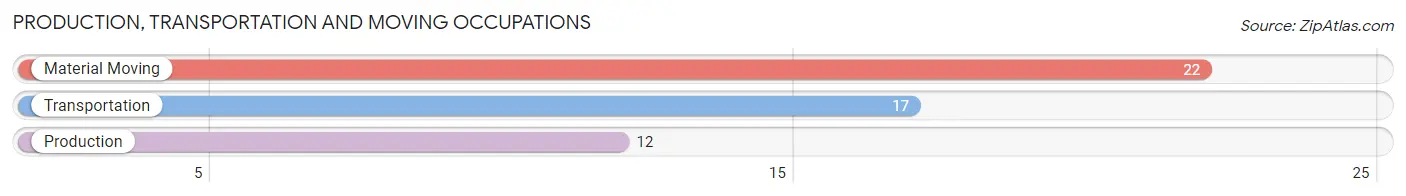
Production, Transportation and Moving Occupations by Sex
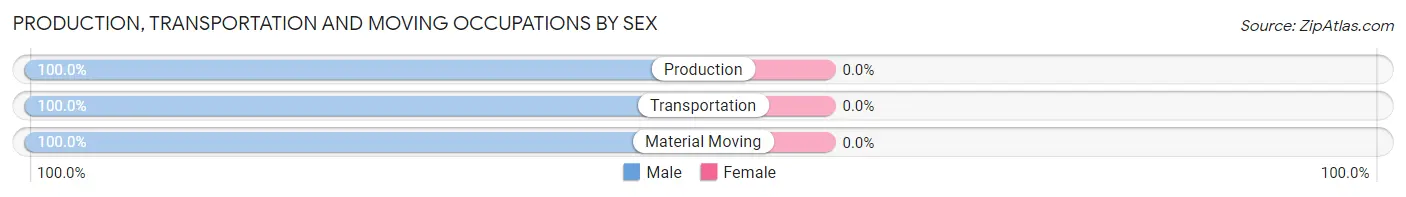
| Occupation | Male | Female |
| Production | 12 (100.0%) | 0 (0.0%) |
| Transportation | 17 (100.0%) | 0 (0.0%) |
| Material Moving | 22 (100.0%) | 0 (0.0%) |
| Total (Category) | 51 (100.0%) | 0 (0.0%) |
| Total (Overall) | 611 (68.7%) | 278 (31.3%) |
Employment Industries by Sex in East Oakdale
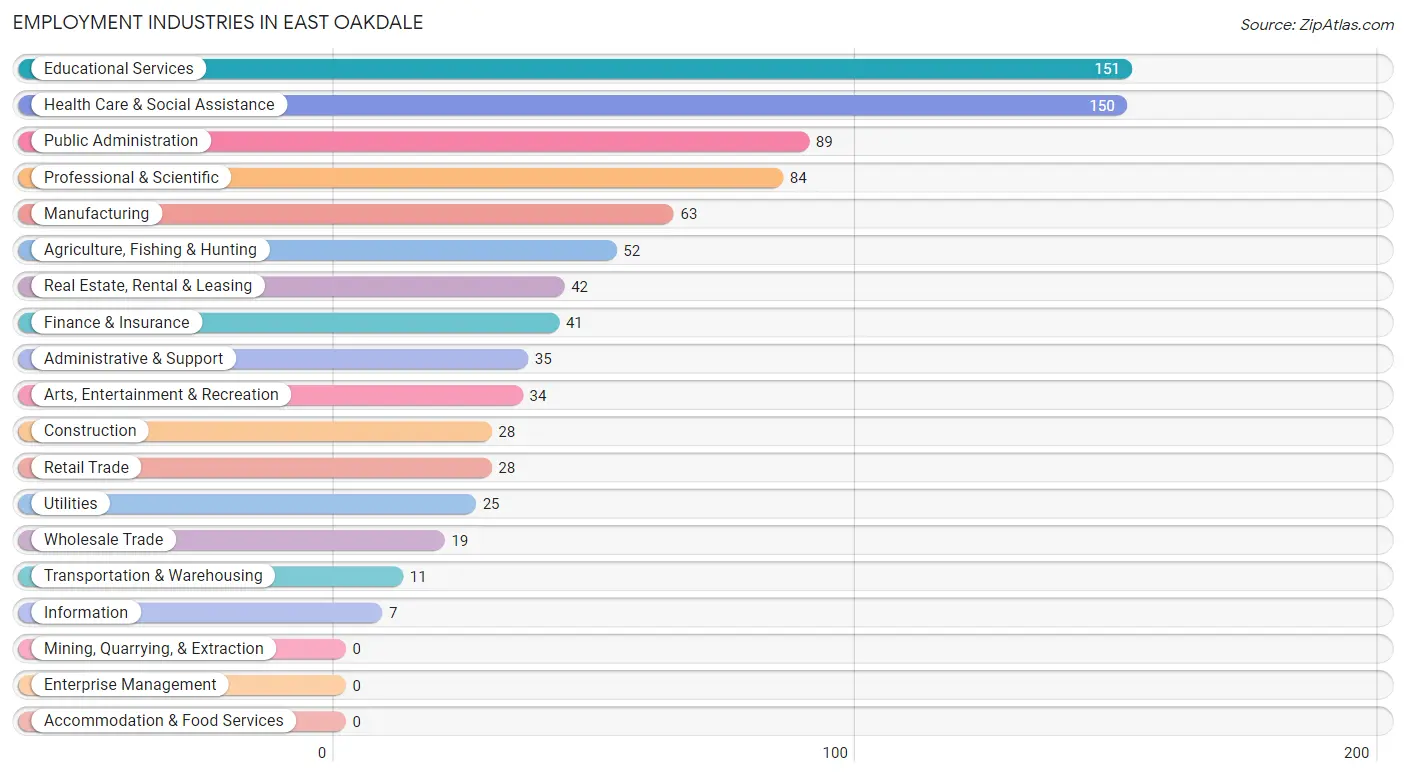
Employment Industries in East Oakdale
The major employment industries in East Oakdale include Educational Services (151 | 17.0%), Health Care & Social Assistance (150 | 16.9%), Public Administration (89 | 10.0%), Professional & Scientific (84 | 9.5%), and Manufacturing (63 | 7.1%).
Employment Industries by Sex in East Oakdale
The East Oakdale industries that see more men than women are Construction (100.0%), Manufacturing (100.0%), and Wholesale Trade (100.0%), whereas the industries that tend to have a higher number of women are Information (100.0%), Health Care & Social Assistance (54.7%), and Educational Services (47.7%).
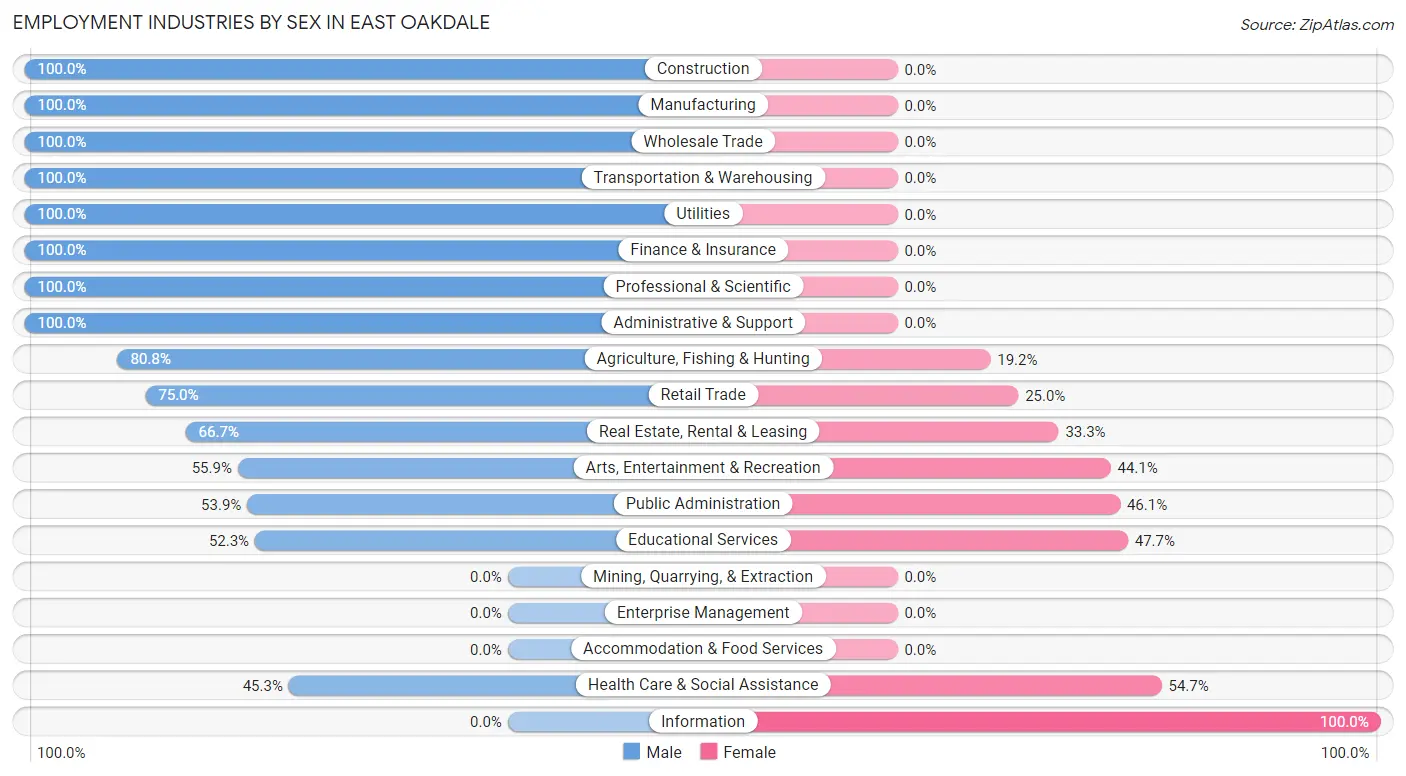
| Industry | Male | Female |
| Agriculture, Fishing & Hunting | 42 (80.8%) | 10 (19.2%) |
| Mining, Quarrying, & Extraction | 0 (0.0%) | 0 (0.0%) |
| Construction | 28 (100.0%) | 0 (0.0%) |
| Manufacturing | 63 (100.0%) | 0 (0.0%) |
| Wholesale Trade | 19 (100.0%) | 0 (0.0%) |
| Retail Trade | 21 (75.0%) | 7 (25.0%) |
| Transportation & Warehousing | 11 (100.0%) | 0 (0.0%) |
| Utilities | 25 (100.0%) | 0 (0.0%) |
| Information | 0 (0.0%) | 7 (100.0%) |
| Finance & Insurance | 41 (100.0%) | 0 (0.0%) |
| Real Estate, Rental & Leasing | 28 (66.7%) | 14 (33.3%) |
| Professional & Scientific | 84 (100.0%) | 0 (0.0%) |
| Enterprise Management | 0 (0.0%) | 0 (0.0%) |
| Administrative & Support | 35 (100.0%) | 0 (0.0%) |
| Educational Services | 79 (52.3%) | 72 (47.7%) |
| Health Care & Social Assistance | 68 (45.3%) | 82 (54.7%) |
| Arts, Entertainment & Recreation | 19 (55.9%) | 15 (44.1%) |
| Accommodation & Food Services | 0 (0.0%) | 0 (0.0%) |
| Public Administration | 48 (53.9%) | 41 (46.1%) |
| Total | 611 (68.7%) | 278 (31.3%) |
Education in East Oakdale
School Enrollment in East Oakdale
The most common levels of schooling among the 370 students in East Oakdale are elementary school (112 | 30.3%), middle school (105 | 28.4%), and high school (70 | 18.9%).
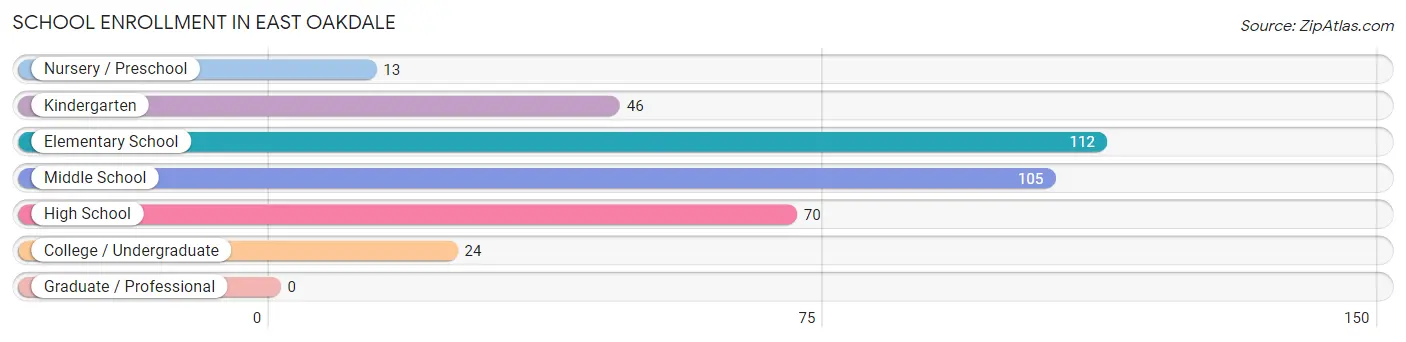
| School Level | # Students | % Students |
| Nursery / Preschool | 13 | 3.5% |
| Kindergarten | 46 | 12.4% |
| Elementary School | 112 | 30.3% |
| Middle School | 105 | 28.4% |
| High School | 70 | 18.9% |
| College / Undergraduate | 24 | 6.5% |
| Graduate / Professional | 0 | 0.0% |
| Total | 370 | 100.0% |
School Enrollment by Age by Funding Source in East Oakdale
Out of a total of 370 students who are enrolled in schools in East Oakdale, 41 (11.1%) attend a private institution, while the remaining 329 (88.9%) are enrolled in public schools. The age group of 5 to 9 year old has the highest likelihood of being enrolled in private schools, with 41 (26.0% in the age bracket) enrolled. Conversely, the age group of 10 to 14 year olds has the lowest likelihood of being enrolled in a private school, with 118 (100.0% in the age bracket) attending a public institution.
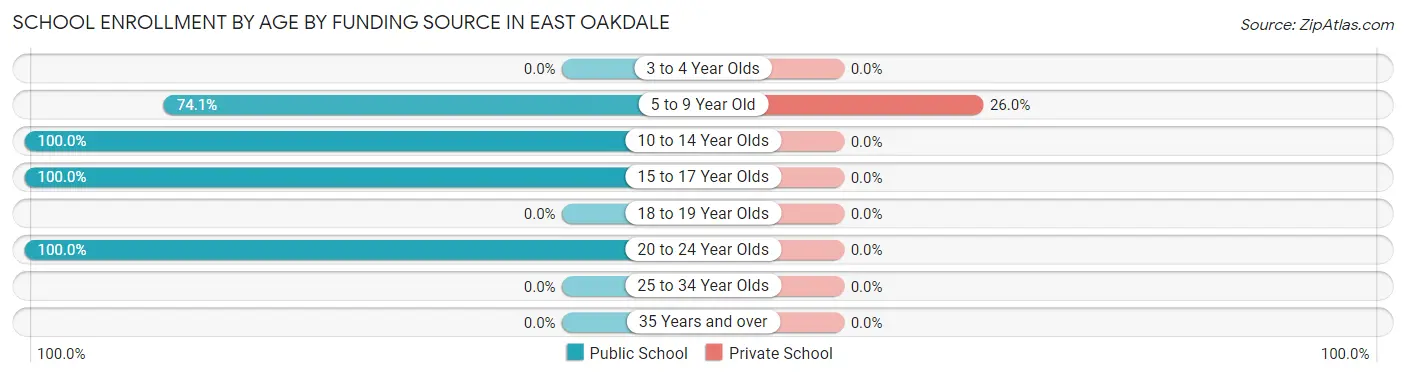
| Age Bracket | Public School | Private School |
| 3 to 4 Year Olds | 0 (0.0%) | 0 (0.0%) |
| 5 to 9 Year Old | 117 (74.1%) | 41 (26.0%) |
| 10 to 14 Year Olds | 118 (100.0%) | 0 (0.0%) |
| 15 to 17 Year Olds | 70 (100.0%) | 0 (0.0%) |
| 18 to 19 Year Olds | 0 (0.0%) | 0 (0.0%) |
| 20 to 24 Year Olds | 24 (100.0%) | 0 (0.0%) |
| 25 to 34 Year Olds | 0 (0.0%) | 0 (0.0%) |
| 35 Years and over | 0 (0.0%) | 0 (0.0%) |
| Total | 329 (88.9%) | 41 (11.1%) |
Educational Attainment by Field of Study in East Oakdale
Business (149 | 15.9%), bio, nature & agricultural (130 | 13.8%), social sciences (109 | 11.6%), education (72 | 7.7%), and science & technology (68 | 7.2%) are the most common fields of study among 940 individuals in East Oakdale who have obtained a bachelor's degree or higher.
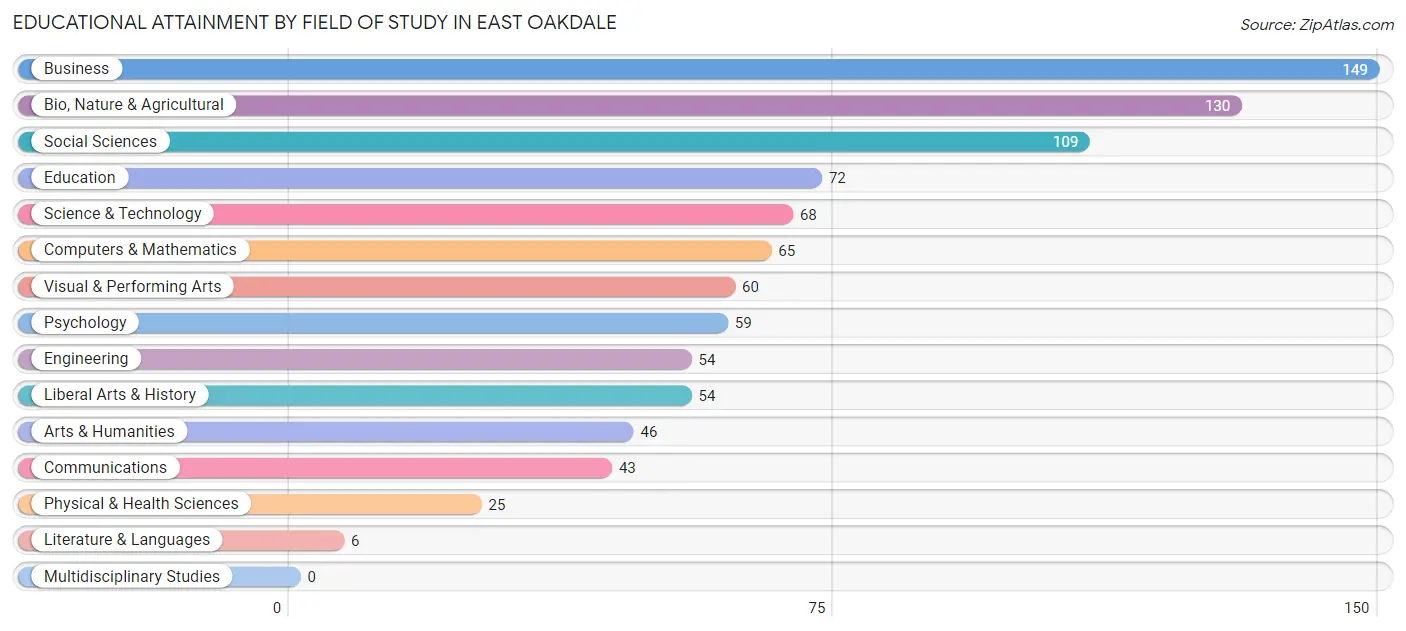
| Field of Study | # Graduates | % Graduates |
| Computers & Mathematics | 65 | 6.9% |
| Bio, Nature & Agricultural | 130 | 13.8% |
| Physical & Health Sciences | 25 | 2.7% |
| Psychology | 59 | 6.3% |
| Social Sciences | 109 | 11.6% |
| Engineering | 54 | 5.7% |
| Multidisciplinary Studies | 0 | 0.0% |
| Science & Technology | 68 | 7.2% |
| Business | 149 | 15.9% |
| Education | 72 | 7.7% |
| Literature & Languages | 6 | 0.6% |
| Liberal Arts & History | 54 | 5.7% |
| Visual & Performing Arts | 60 | 6.4% |
| Communications | 43 | 4.6% |
| Arts & Humanities | 46 | 4.9% |
| Total | 940 | 100.0% |
Transportation & Commute in East Oakdale
Vehicle Availability by Sex in East Oakdale
The most prevalent vehicle ownership categories in East Oakdale are males with 4 vehicles (205, accounting for 36.7%) and females with 4 vehicles (62, making up 76.5%).
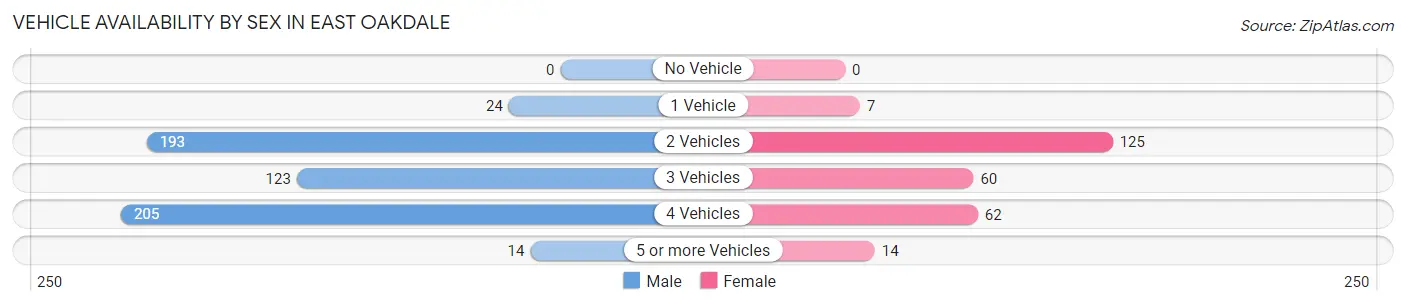
| Vehicles Available | Male | Female |
| No Vehicle | 0 (0.0%) | 0 (0.0%) |
| 1 Vehicle | 24 (4.3%) | 7 (2.6%) |
| 2 Vehicles | 193 (34.5%) | 125 (46.6%) |
| 3 Vehicles | 123 (22.0%) | 60 (22.4%) |
| 4 Vehicles | 205 (36.7%) | 62 (23.1%) |
| 5 or more Vehicles | 14 (2.5%) | 14 (5.2%) |
| Total | 559 (100.0%) | 268 (100.0%) |
Commute Time in East Oakdale
The most frequently occuring commute durations in East Oakdale are 5 to 9 minutes (121 commuters, 17.0%), 90 or more minutes (104 commuters, 14.6%), and 30 to 34 minutes (77 commuters, 10.8%).
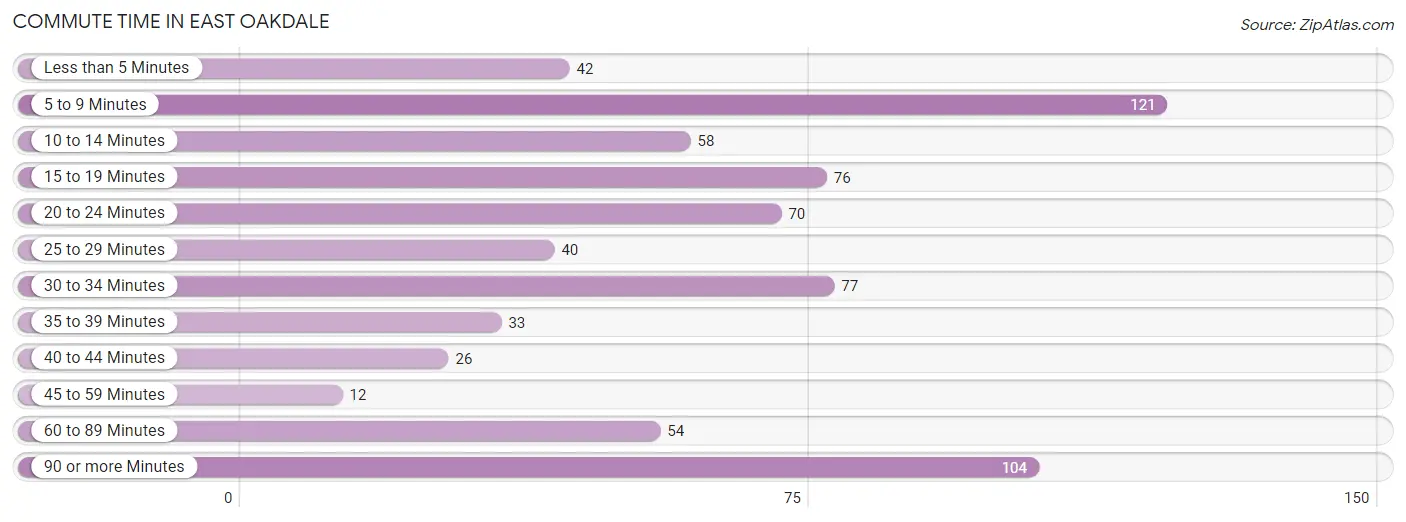
| Commute Time | # Commuters | % Commuters |
| Less than 5 Minutes | 42 | 5.9% |
| 5 to 9 Minutes | 121 | 17.0% |
| 10 to 14 Minutes | 58 | 8.1% |
| 15 to 19 Minutes | 76 | 10.7% |
| 20 to 24 Minutes | 70 | 9.8% |
| 25 to 29 Minutes | 40 | 5.6% |
| 30 to 34 Minutes | 77 | 10.8% |
| 35 to 39 Minutes | 33 | 4.6% |
| 40 to 44 Minutes | 26 | 3.6% |
| 45 to 59 Minutes | 12 | 1.7% |
| 60 to 89 Minutes | 54 | 7.6% |
| 90 or more Minutes | 104 | 14.6% |
Commute Time by Sex in East Oakdale
The most common commute times in East Oakdale are 5 to 9 minutes (78 commuters, 15.9%) for males and 90 or more minutes (55 commuters, 24.7%) for females.
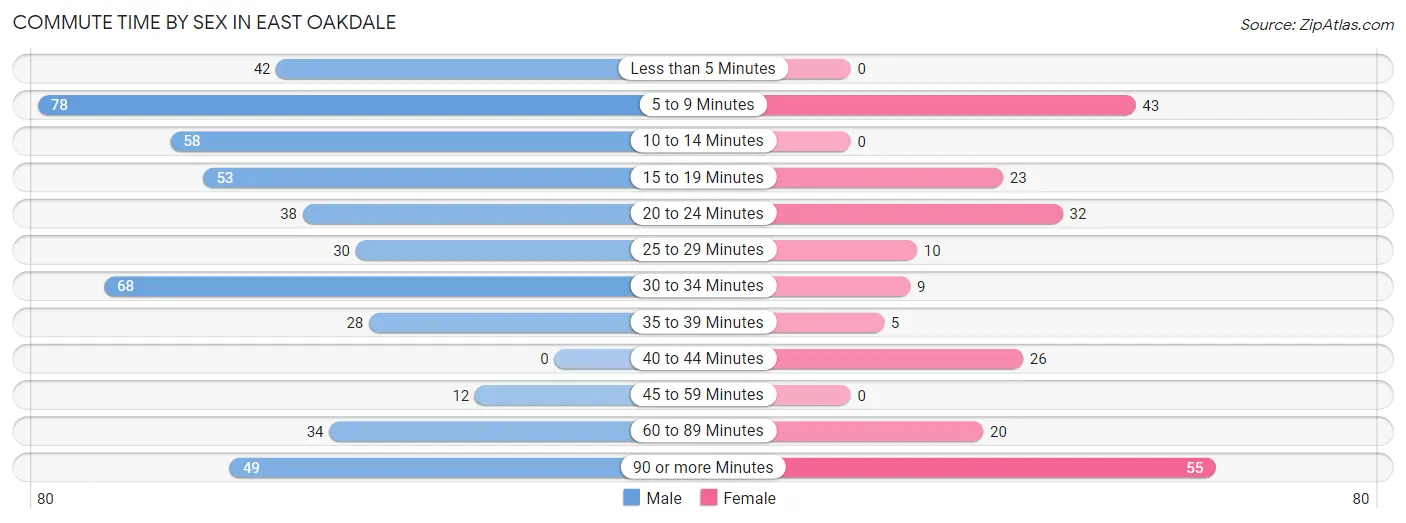
| Commute Time | Male | Female |
| Less than 5 Minutes | 42 (8.6%) | 0 (0.0%) |
| 5 to 9 Minutes | 78 (15.9%) | 43 (19.3%) |
| 10 to 14 Minutes | 58 (11.8%) | 0 (0.0%) |
| 15 to 19 Minutes | 53 (10.8%) | 23 (10.3%) |
| 20 to 24 Minutes | 38 (7.8%) | 32 (14.3%) |
| 25 to 29 Minutes | 30 (6.1%) | 10 (4.5%) |
| 30 to 34 Minutes | 68 (13.9%) | 9 (4.0%) |
| 35 to 39 Minutes | 28 (5.7%) | 5 (2.2%) |
| 40 to 44 Minutes | 0 (0.0%) | 26 (11.7%) |
| 45 to 59 Minutes | 12 (2.5%) | 0 (0.0%) |
| 60 to 89 Minutes | 34 (6.9%) | 20 (9.0%) |
| 90 or more Minutes | 49 (10.0%) | 55 (24.7%) |
Time of Departure to Work by Sex in East Oakdale
The most frequent times of departure to work in East Oakdale are 7:30 AM to 7:59 AM (93, 19.0%) for males and 4:00 PM to 11:59 PM (47, 21.1%) for females.
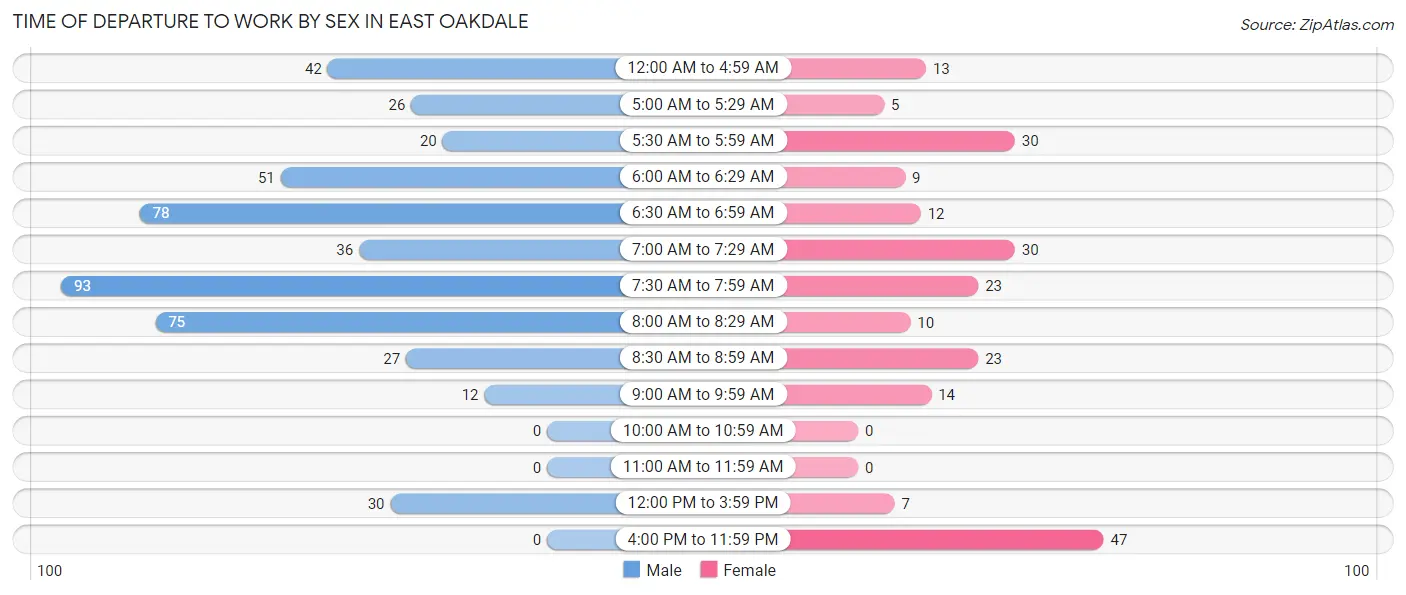
| Time of Departure | Male | Female |
| 12:00 AM to 4:59 AM | 42 (8.6%) | 13 (5.8%) |
| 5:00 AM to 5:29 AM | 26 (5.3%) | 5 (2.2%) |
| 5:30 AM to 5:59 AM | 20 (4.1%) | 30 (13.5%) |
| 6:00 AM to 6:29 AM | 51 (10.4%) | 9 (4.0%) |
| 6:30 AM to 6:59 AM | 78 (15.9%) | 12 (5.4%) |
| 7:00 AM to 7:29 AM | 36 (7.3%) | 30 (13.5%) |
| 7:30 AM to 7:59 AM | 93 (19.0%) | 23 (10.3%) |
| 8:00 AM to 8:29 AM | 75 (15.3%) | 10 (4.5%) |
| 8:30 AM to 8:59 AM | 27 (5.5%) | 23 (10.3%) |
| 9:00 AM to 9:59 AM | 12 (2.5%) | 14 (6.3%) |
| 10:00 AM to 10:59 AM | 0 (0.0%) | 0 (0.0%) |
| 11:00 AM to 11:59 AM | 0 (0.0%) | 0 (0.0%) |
| 12:00 PM to 3:59 PM | 30 (6.1%) | 7 (3.1%) |
| 4:00 PM to 11:59 PM | 0 (0.0%) | 47 (21.1%) |
| Total | 490 (100.0%) | 223 (100.0%) |
Housing Occupancy in East Oakdale
Occupancy by Ownership in East Oakdale
Of the total 999 dwellings in East Oakdale, owner-occupied units account for 953 (95.4%), while renter-occupied units make up 46 (4.6%).
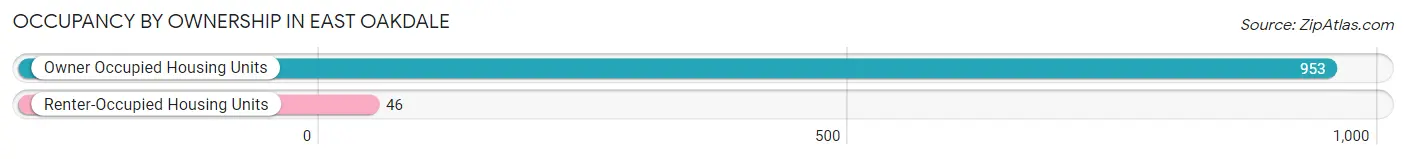
| Occupancy | # Housing Units | % Housing Units |
| Owner Occupied Housing Units | 953 | 95.4% |
| Renter-Occupied Housing Units | 46 | 4.6% |
| Total Occupied Housing Units | 999 | 100.0% |
Occupancy by Household Size in East Oakdale
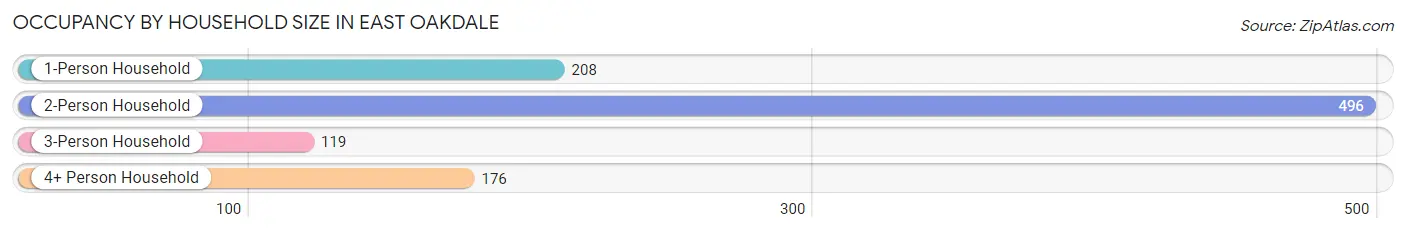
| Household Size | # Housing Units | % Housing Units |
| 1-Person Household | 208 | 20.8% |
| 2-Person Household | 496 | 49.6% |
| 3-Person Household | 119 | 11.9% |
| 4+ Person Household | 176 | 17.6% |
| Total Housing Units | 999 | 100.0% |
Occupancy by Ownership by Household Size in East Oakdale
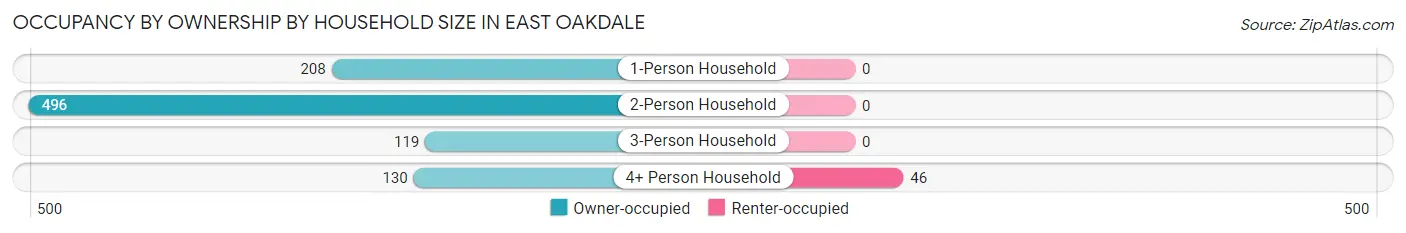
| Household Size | Owner-occupied | Renter-occupied |
| 1-Person Household | 208 (100.0%) | 0 (0.0%) |
| 2-Person Household | 496 (100.0%) | 0 (0.0%) |
| 3-Person Household | 119 (100.0%) | 0 (0.0%) |
| 4+ Person Household | 130 (73.9%) | 46 (26.1%) |
| Total Housing Units | 953 (95.4%) | 46 (4.6%) |
Occupancy by Educational Attainment in East Oakdale
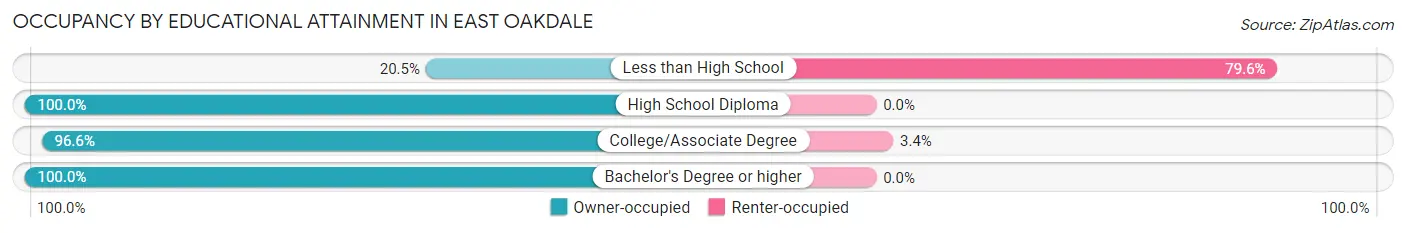
| Household Size | Owner-occupied | Renter-occupied |
| Less than High School | 9 (20.4%) | 35 (79.5%) |
| High School Diploma | 81 (100.0%) | 0 (0.0%) |
| College/Associate Degree | 316 (96.6%) | 11 (3.4%) |
| Bachelor's Degree or higher | 547 (100.0%) | 0 (0.0%) |
Occupancy by Age of Householder in East Oakdale
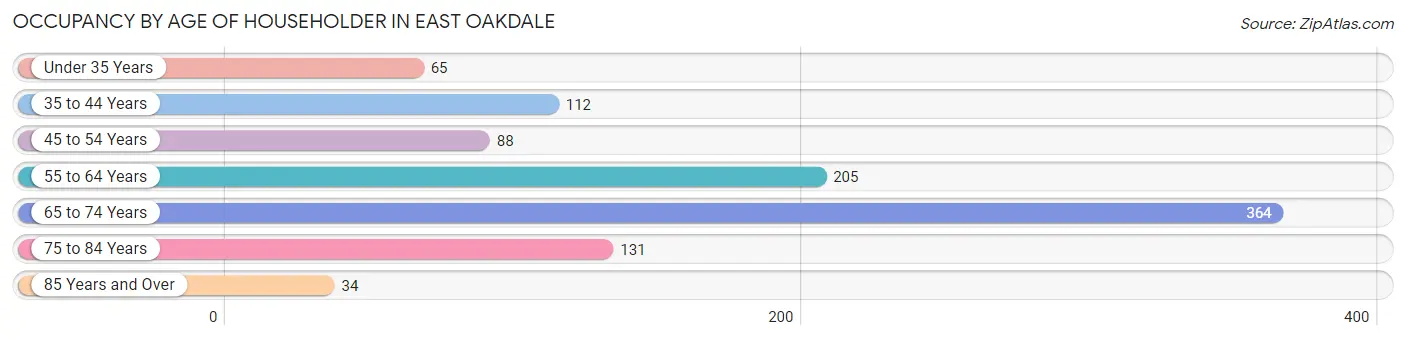
| Age Bracket | # Households | % Households |
| Under 35 Years | 65 | 6.5% |
| 35 to 44 Years | 112 | 11.2% |
| 45 to 54 Years | 88 | 8.8% |
| 55 to 64 Years | 205 | 20.5% |
| 65 to 74 Years | 364 | 36.4% |
| 75 to 84 Years | 131 | 13.1% |
| 85 Years and Over | 34 | 3.4% |
| Total | 999 | 100.0% |
Housing Finances in East Oakdale
Median Income by Occupancy in East Oakdale
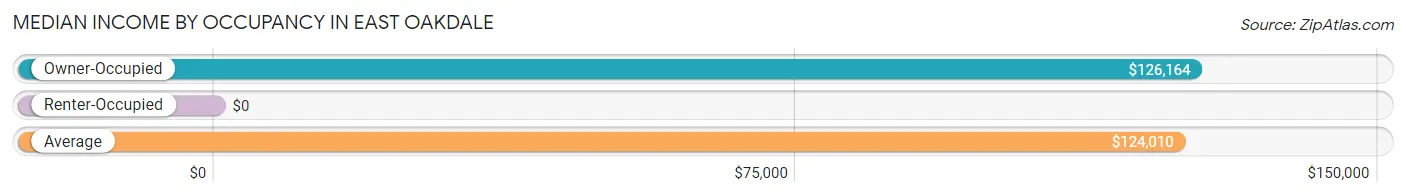
| Occupancy Type | # Households | Median Income |
| Owner-Occupied | 953 (95.4%) | $126,164 |
| Renter-Occupied | 46 (4.6%) | $0 |
| Average | 999 (100.0%) | $124,010 |
Occupancy by Householder Income Bracket in East Oakdale
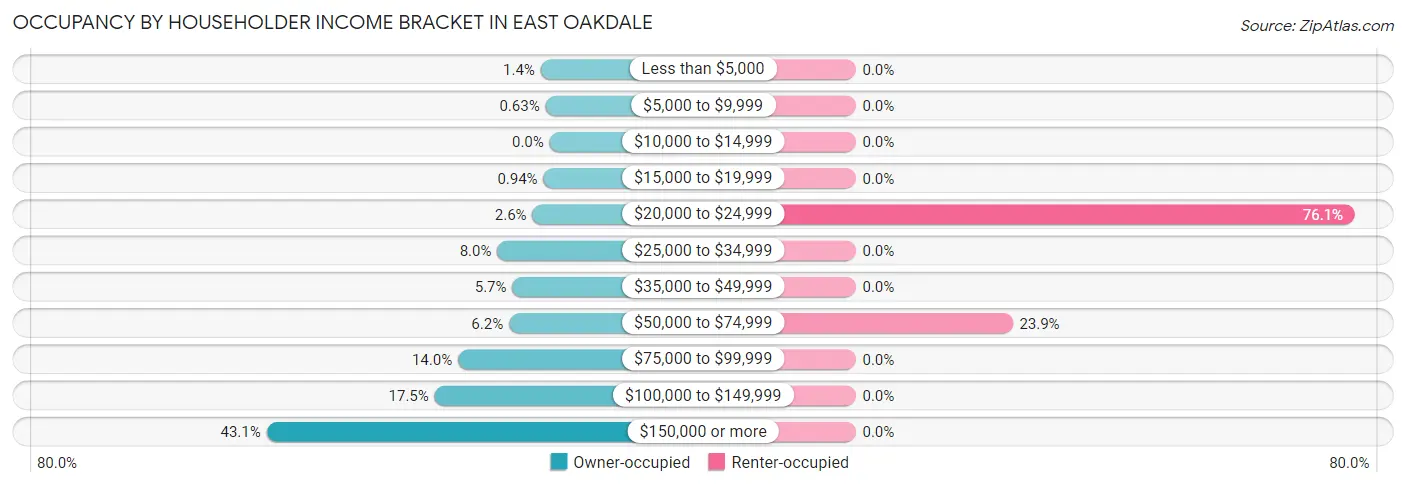
| Income Bracket | Owner-occupied | Renter-occupied |
| Less than $5,000 | 13 (1.4%) | 0 (0.0%) |
| $5,000 to $9,999 | 6 (0.6%) | 0 (0.0%) |
| $10,000 to $14,999 | 0 (0.0%) | 0 (0.0%) |
| $15,000 to $19,999 | 9 (0.9%) | 0 (0.0%) |
| $20,000 to $24,999 | 25 (2.6%) | 35 (76.1%) |
| $25,000 to $34,999 | 76 (8.0%) | 0 (0.0%) |
| $35,000 to $49,999 | 54 (5.7%) | 0 (0.0%) |
| $50,000 to $74,999 | 59 (6.2%) | 11 (23.9%) |
| $75,000 to $99,999 | 133 (14.0%) | 0 (0.0%) |
| $100,000 to $149,999 | 167 (17.5%) | 0 (0.0%) |
| $150,000 or more | 411 (43.1%) | 0 (0.0%) |
| Total | 953 (100.0%) | 46 (100.0%) |
Monthly Housing Cost Tiers in East Oakdale
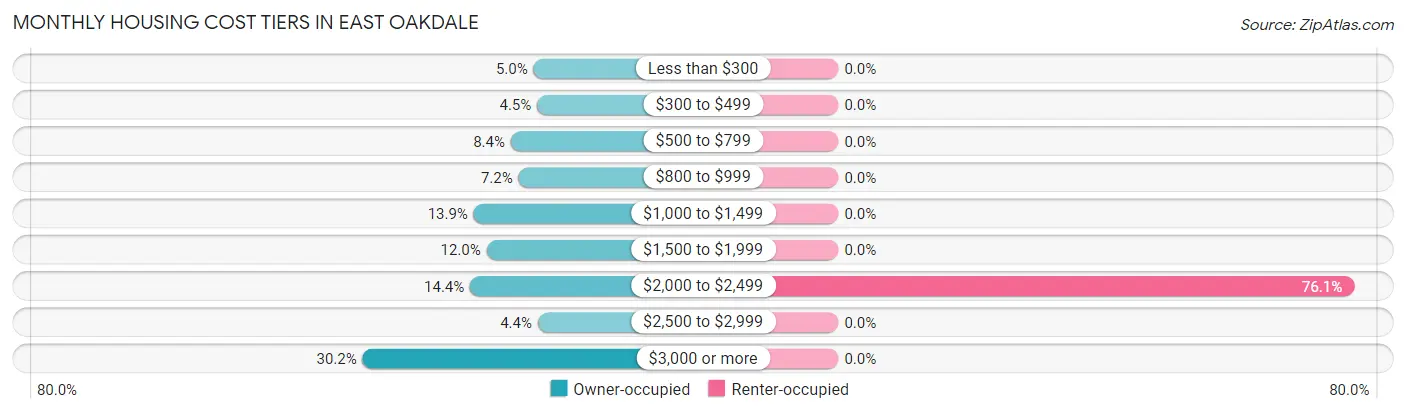
| Monthly Cost | Owner-occupied | Renter-occupied |
| Less than $300 | 48 (5.0%) | 0 (0.0%) |
| $300 to $499 | 43 (4.5%) | 0 (0.0%) |
| $500 to $799 | 80 (8.4%) | 0 (0.0%) |
| $800 to $999 | 69 (7.2%) | 0 (0.0%) |
| $1,000 to $1,499 | 132 (13.9%) | 0 (0.0%) |
| $1,500 to $1,999 | 114 (12.0%) | 0 (0.0%) |
| $2,000 to $2,499 | 137 (14.4%) | 35 (76.1%) |
| $2,500 to $2,999 | 42 (4.4%) | 0 (0.0%) |
| $3,000 or more | 288 (30.2%) | 0 (0.0%) |
| Total | 953 (100.0%) | 46 (100.0%) |
Physical Housing Characteristics in East Oakdale
Housing Structures in East Oakdale
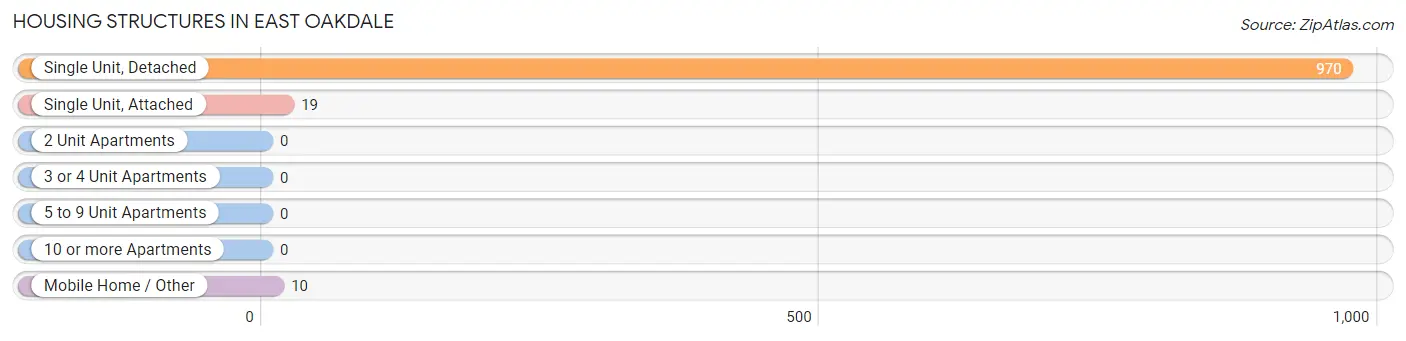
| Structure Type | # Housing Units | % Housing Units |
| Single Unit, Detached | 970 | 97.1% |
| Single Unit, Attached | 19 | 1.9% |
| 2 Unit Apartments | 0 | 0.0% |
| 3 or 4 Unit Apartments | 0 | 0.0% |
| 5 to 9 Unit Apartments | 0 | 0.0% |
| 10 or more Apartments | 0 | 0.0% |
| Mobile Home / Other | 10 | 1.0% |
| Total | 999 | 100.0% |
Housing Structures by Occupancy in East Oakdale
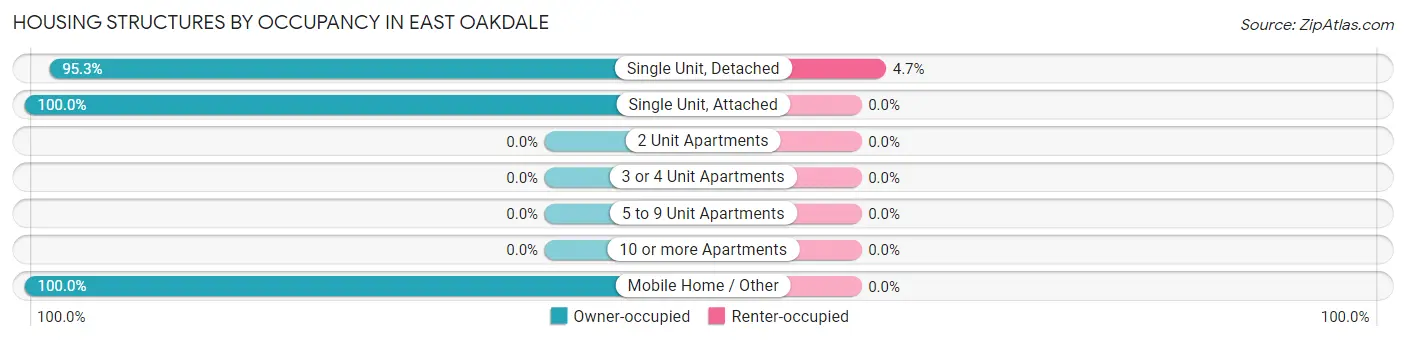
| Structure Type | Owner-occupied | Renter-occupied |
| Single Unit, Detached | 924 (95.3%) | 46 (4.7%) |
| Single Unit, Attached | 19 (100.0%) | 0 (0.0%) |
| 2 Unit Apartments | 0 (0.0%) | 0 (0.0%) |
| 3 or 4 Unit Apartments | 0 (0.0%) | 0 (0.0%) |
| 5 to 9 Unit Apartments | 0 (0.0%) | 0 (0.0%) |
| 10 or more Apartments | 0 (0.0%) | 0 (0.0%) |
| Mobile Home / Other | 10 (100.0%) | 0 (0.0%) |
| Total | 953 (95.4%) | 46 (4.6%) |
Housing Structures by Number of Rooms in East Oakdale
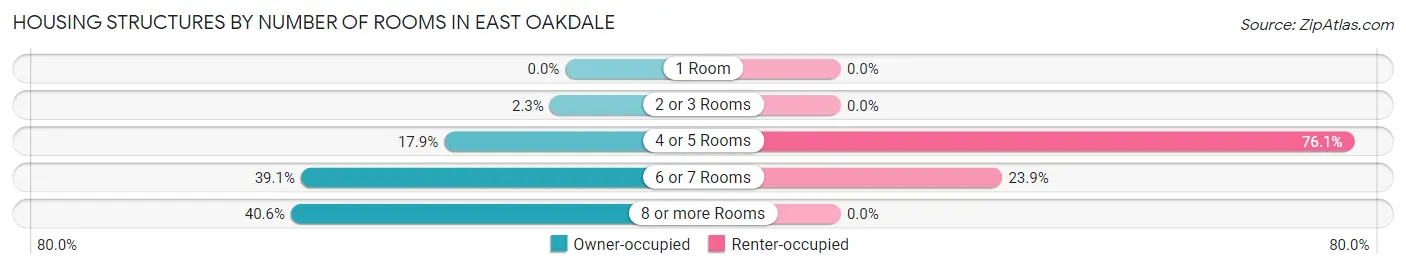
| Number of Rooms | Owner-occupied | Renter-occupied |
| 1 Room | 0 (0.0%) | 0 (0.0%) |
| 2 or 3 Rooms | 22 (2.3%) | 0 (0.0%) |
| 4 or 5 Rooms | 171 (17.9%) | 35 (76.1%) |
| 6 or 7 Rooms | 373 (39.1%) | 11 (23.9%) |
| 8 or more Rooms | 387 (40.6%) | 0 (0.0%) |
| Total | 953 (100.0%) | 46 (100.0%) |
Housing Structure by Heating Type in East Oakdale
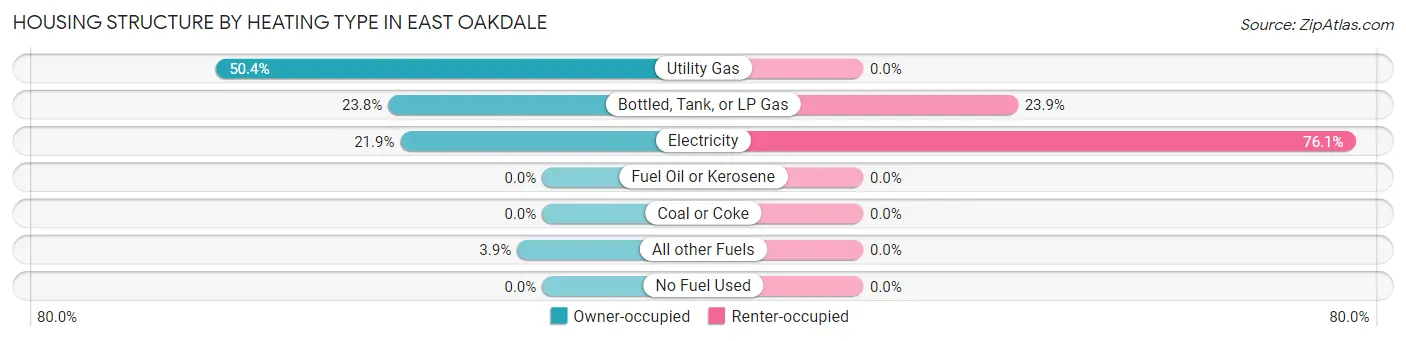
| Heating Type | Owner-occupied | Renter-occupied |
| Utility Gas | 480 (50.4%) | 0 (0.0%) |
| Bottled, Tank, or LP Gas | 227 (23.8%) | 11 (23.9%) |
| Electricity | 209 (21.9%) | 35 (76.1%) |
| Fuel Oil or Kerosene | 0 (0.0%) | 0 (0.0%) |
| Coal or Coke | 0 (0.0%) | 0 (0.0%) |
| All other Fuels | 37 (3.9%) | 0 (0.0%) |
| No Fuel Used | 0 (0.0%) | 0 (0.0%) |
| Total | 953 (100.0%) | 46 (100.0%) |
Household Vehicle Usage in East Oakdale
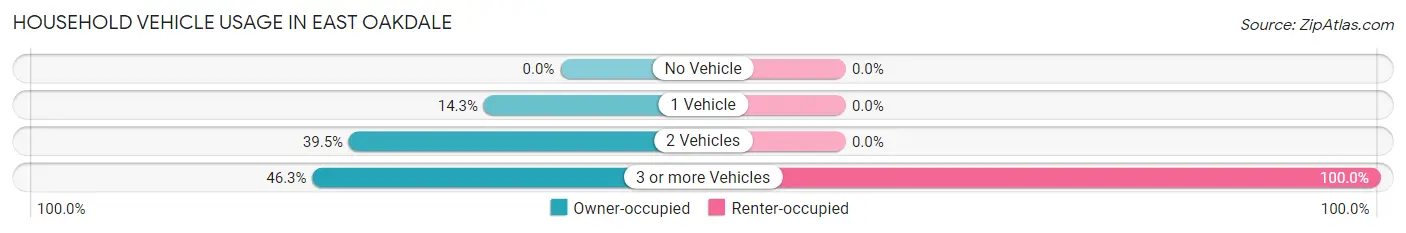
| Vehicles per Household | Owner-occupied | Renter-occupied |
| No Vehicle | 0 (0.0%) | 0 (0.0%) |
| 1 Vehicle | 136 (14.3%) | 0 (0.0%) |
| 2 Vehicles | 376 (39.5%) | 0 (0.0%) |
| 3 or more Vehicles | 441 (46.3%) | 46 (100.0%) |
| Total | 953 (100.0%) | 46 (100.0%) |
Real Estate & Mortgages in East Oakdale
Real Estate and Mortgage Overview in East Oakdale
| Characteristic | Without Mortgage | With Mortgage |
| Housing Units | 395 | 558 |
| Median Property Value | $729,200 | $846,500 |
| Median Household Income | $99,398 | $284 |
| Monthly Housing Costs | $888 | $275 |
| Real Estate Taxes | $5,738 | $13 |
Property Value by Mortgage Status in East Oakdale
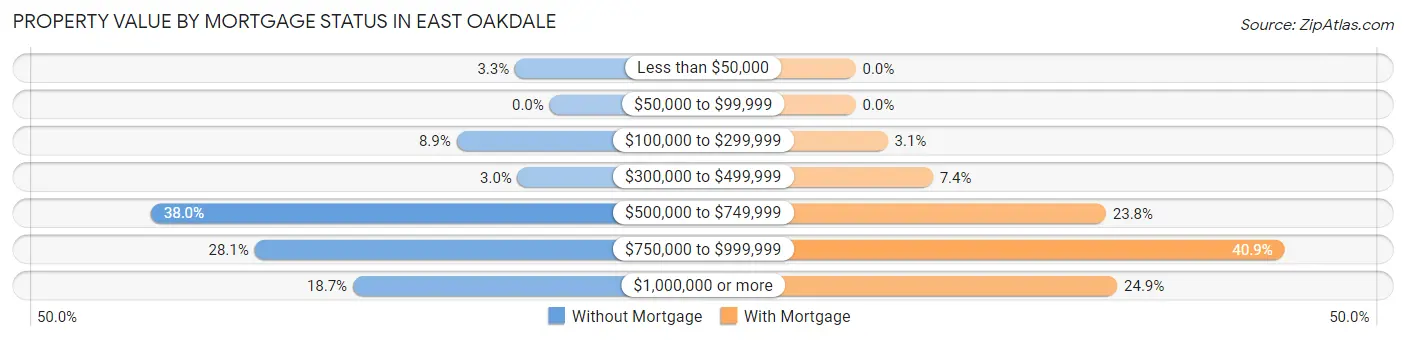
| Property Value | Without Mortgage | With Mortgage |
| Less than $50,000 | 13 (3.3%) | 0 (0.0%) |
| $50,000 to $99,999 | 0 (0.0%) | 0 (0.0%) |
| $100,000 to $299,999 | 35 (8.9%) | 17 (3.0%) |
| $300,000 to $499,999 | 12 (3.0%) | 41 (7.3%) |
| $500,000 to $749,999 | 150 (38.0%) | 133 (23.8%) |
| $750,000 to $999,999 | 111 (28.1%) | 228 (40.9%) |
| $1,000,000 or more | 74 (18.7%) | 139 (24.9%) |
| Total | 395 (100.0%) | 558 (100.0%) |
Household Income by Mortgage Status in East Oakdale
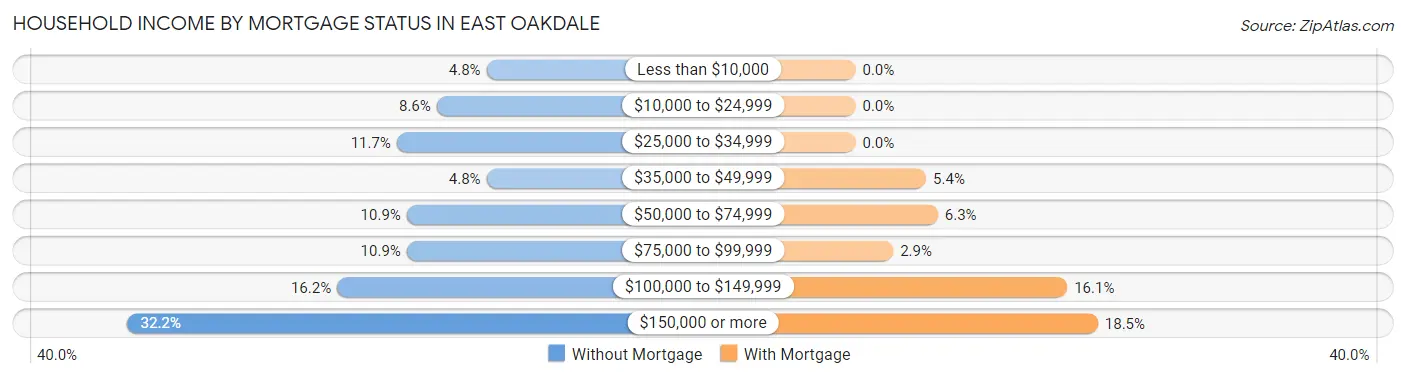
| Household Income | Without Mortgage | With Mortgage |
| Less than $10,000 | 19 (4.8%) | 0 (0.0%) |
| $10,000 to $24,999 | 34 (8.6%) | 0 (0.0%) |
| $25,000 to $34,999 | 46 (11.7%) | 0 (0.0%) |
| $35,000 to $49,999 | 19 (4.8%) | 30 (5.4%) |
| $50,000 to $74,999 | 43 (10.9%) | 35 (6.3%) |
| $75,000 to $99,999 | 43 (10.9%) | 16 (2.9%) |
| $100,000 to $149,999 | 64 (16.2%) | 90 (16.1%) |
| $150,000 or more | 127 (32.2%) | 103 (18.5%) |
| Total | 395 (100.0%) | 558 (100.0%) |
Property Value to Household Income Ratio in East Oakdale
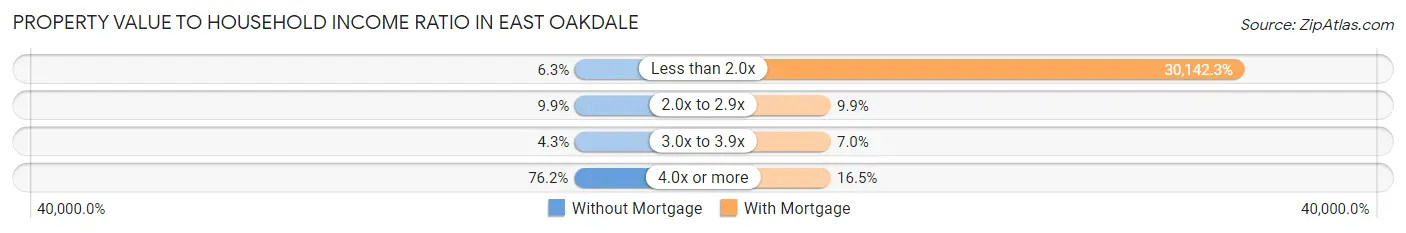
| Value-to-Income Ratio | Without Mortgage | With Mortgage |
| Less than 2.0x | 25 (6.3%) | 168,194 (30,142.3%) |
| 2.0x to 2.9x | 39 (9.9%) | 55 (9.9%) |
| 3.0x to 3.9x | 17 (4.3%) | 39 (7.0%) |
| 4.0x or more | 301 (76.2%) | 92 (16.5%) |
| Total | 395 (100.0%) | 558 (100.0%) |
Real Estate Taxes by Mortgage Status in East Oakdale
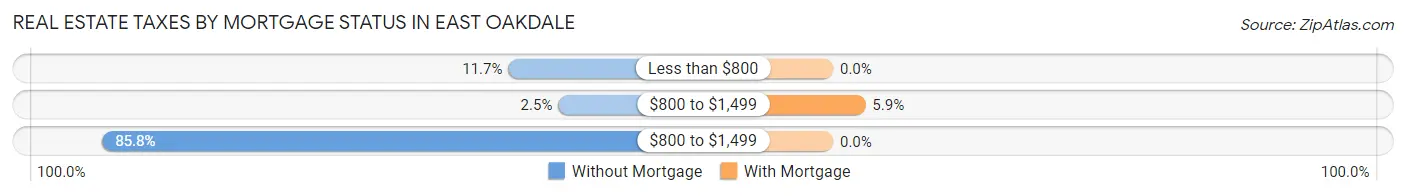
| Property Taxes | Without Mortgage | With Mortgage |
| Less than $800 | 46 (11.7%) | 0 (0.0%) |
| $800 to $1,499 | 10 (2.5%) | 33 (5.9%) |
| $800 to $1,499 | 339 (85.8%) | 0 (0.0%) |
| Total | 395 (100.0%) | 558 (100.0%) |
Health & Disability in East Oakdale
Health Insurance Coverage by Age in East Oakdale
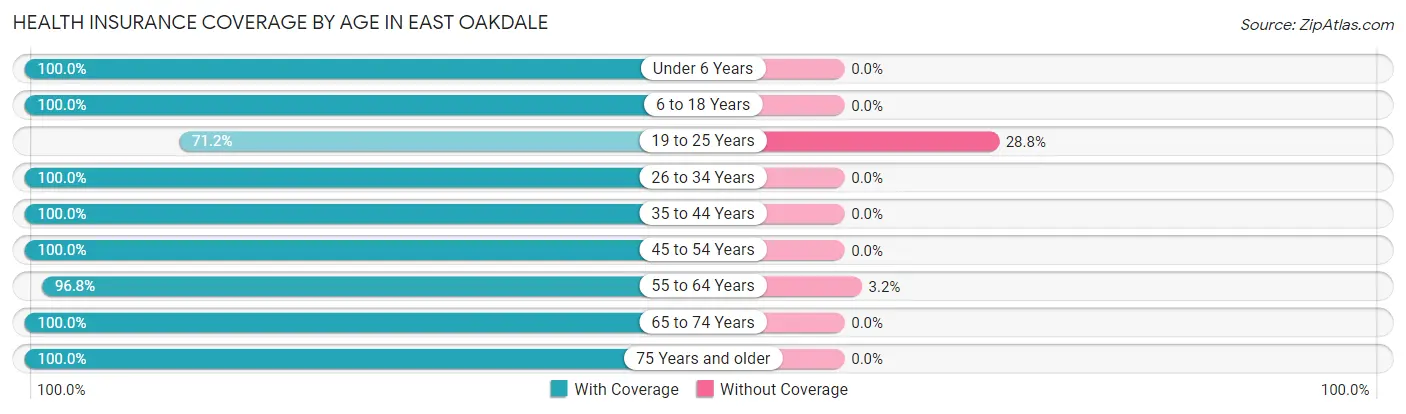
| Age Bracket | With Coverage | Without Coverage |
| Under 6 Years | 96 (100.0%) | 0 (0.0%) |
| 6 to 18 Years | 287 (100.0%) | 0 (0.0%) |
| 19 to 25 Years | 89 (71.2%) | 36 (28.8%) |
| 26 to 34 Years | 152 (100.0%) | 0 (0.0%) |
| 35 to 44 Years | 272 (100.0%) | 0 (0.0%) |
| 45 to 54 Years | 206 (100.0%) | 0 (0.0%) |
| 55 to 64 Years | 389 (96.8%) | 13 (3.2%) |
| 65 to 74 Years | 625 (100.0%) | 0 (0.0%) |
| 75 Years and older | 216 (100.0%) | 0 (0.0%) |
| Total | 2,332 (97.9%) | 49 (2.1%) |
Health Insurance Coverage by Citizenship Status in East Oakdale
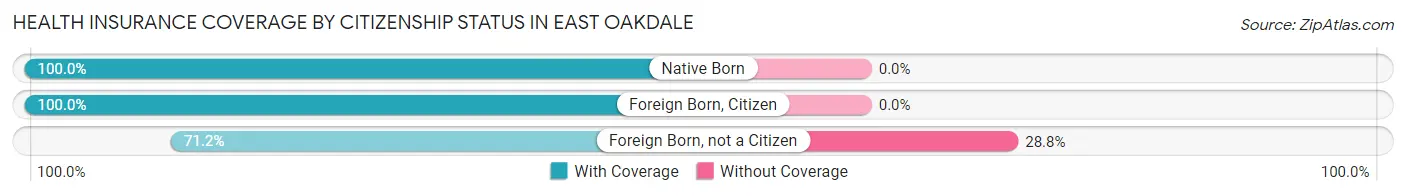
| Citizenship Status | With Coverage | Without Coverage |
| Native Born | 96 (100.0%) | 0 (0.0%) |
| Foreign Born, Citizen | 287 (100.0%) | 0 (0.0%) |
| Foreign Born, not a Citizen | 89 (71.2%) | 36 (28.8%) |
Health Insurance Coverage by Household Income in East Oakdale
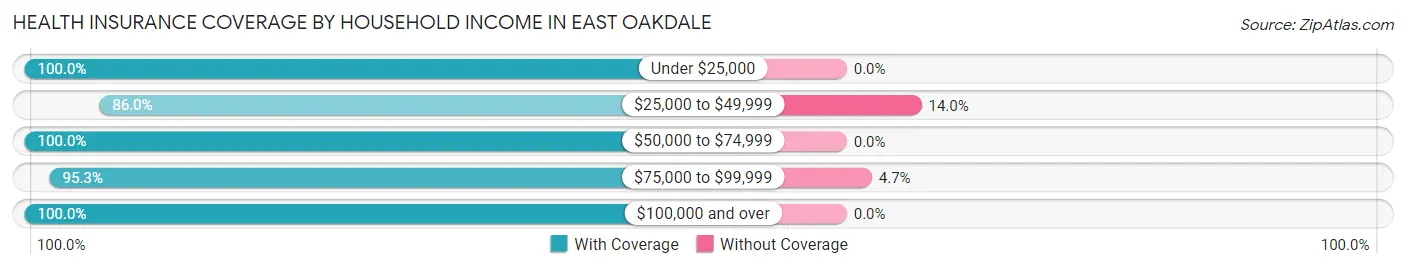
| Household Income | With Coverage | Without Coverage |
| Under $25,000 | 193 (100.0%) | 0 (0.0%) |
| $25,000 to $49,999 | 221 (86.0%) | 36 (14.0%) |
| $50,000 to $74,999 | 178 (100.0%) | 0 (0.0%) |
| $75,000 to $99,999 | 264 (95.3%) | 13 (4.7%) |
| $100,000 and over | 1,476 (100.0%) | 0 (0.0%) |
Public vs Private Health Insurance Coverage by Age in East Oakdale
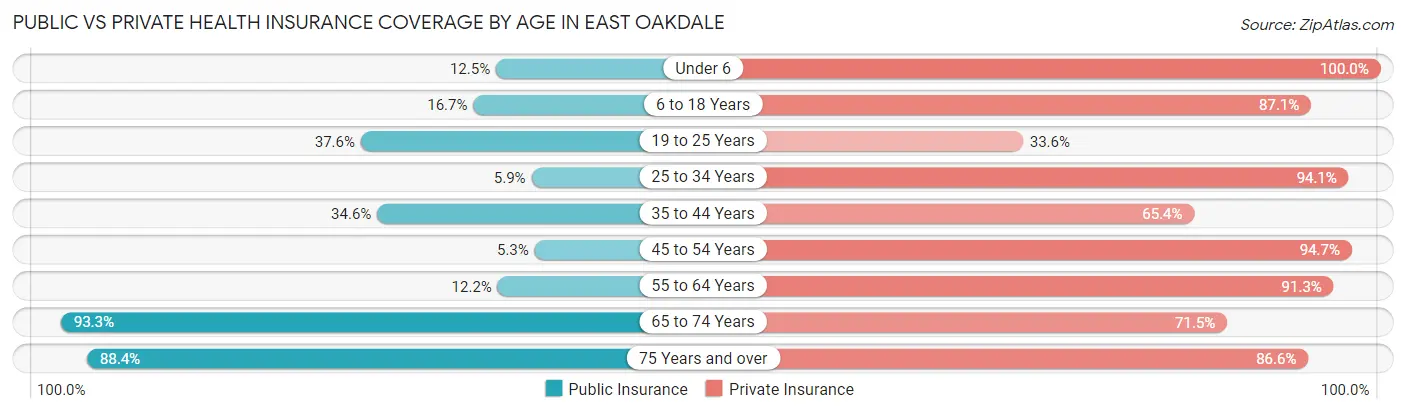
| Age Bracket | Public Insurance | Private Insurance |
| Under 6 | 12 (12.5%) | 96 (100.0%) |
| 6 to 18 Years | 48 (16.7%) | 250 (87.1%) |
| 19 to 25 Years | 47 (37.6%) | 42 (33.6%) |
| 25 to 34 Years | 9 (5.9%) | 143 (94.1%) |
| 35 to 44 Years | 94 (34.6%) | 178 (65.4%) |
| 45 to 54 Years | 11 (5.3%) | 195 (94.7%) |
| 55 to 64 Years | 49 (12.2%) | 367 (91.3%) |
| 65 to 74 Years | 583 (93.3%) | 447 (71.5%) |
| 75 Years and over | 191 (88.4%) | 187 (86.6%) |
| Total | 1,044 (43.9%) | 1,905 (80.0%) |
Disability Status by Sex by Age in East Oakdale
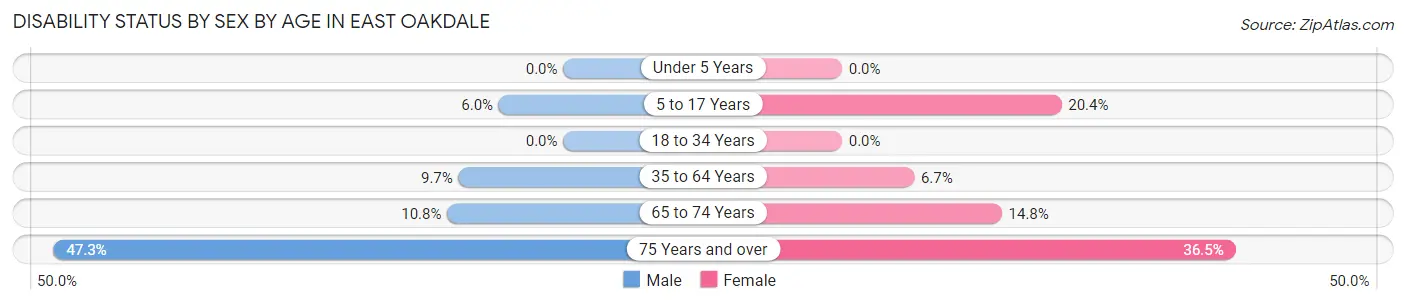
| Age Bracket | Male | Female |
| Under 5 Years | 0 (0.0%) | 0 (0.0%) |
| 5 to 17 Years | 11 (6.0%) | 33 (20.4%) |
| 18 to 34 Years | 0 (0.0%) | 0 (0.0%) |
| 35 to 64 Years | 42 (9.7%) | 30 (6.7%) |
| 65 to 74 Years | 39 (10.8%) | 39 (14.8%) |
| 75 Years and over | 53 (47.3%) | 38 (36.5%) |
Disability Class by Sex by Age in East Oakdale
Disability Class: Hearing Difficulty
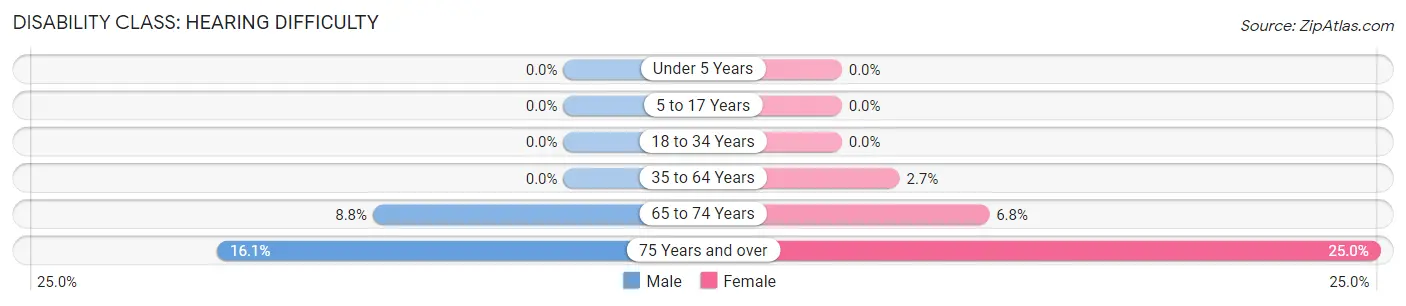
| Age Bracket | Male | Female |
| Under 5 Years | 0 (0.0%) | 0 (0.0%) |
| 5 to 17 Years | 0 (0.0%) | 0 (0.0%) |
| 18 to 34 Years | 0 (0.0%) | 0 (0.0%) |
| 35 to 64 Years | 0 (0.0%) | 12 (2.7%) |
| 65 to 74 Years | 32 (8.8%) | 18 (6.8%) |
| 75 Years and over | 18 (16.1%) | 26 (25.0%) |
Disability Class: Vision Difficulty
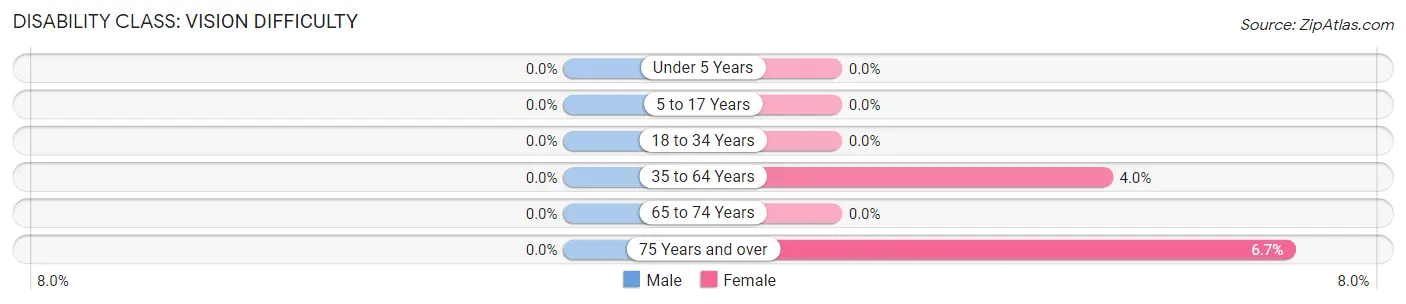
| Age Bracket | Male | Female |
| Under 5 Years | 0 (0.0%) | 0 (0.0%) |
| 5 to 17 Years | 0 (0.0%) | 0 (0.0%) |
| 18 to 34 Years | 0 (0.0%) | 0 (0.0%) |
| 35 to 64 Years | 0 (0.0%) | 18 (4.0%) |
| 65 to 74 Years | 0 (0.0%) | 0 (0.0%) |
| 75 Years and over | 0 (0.0%) | 7 (6.7%) |
Disability Class: Cognitive Difficulty
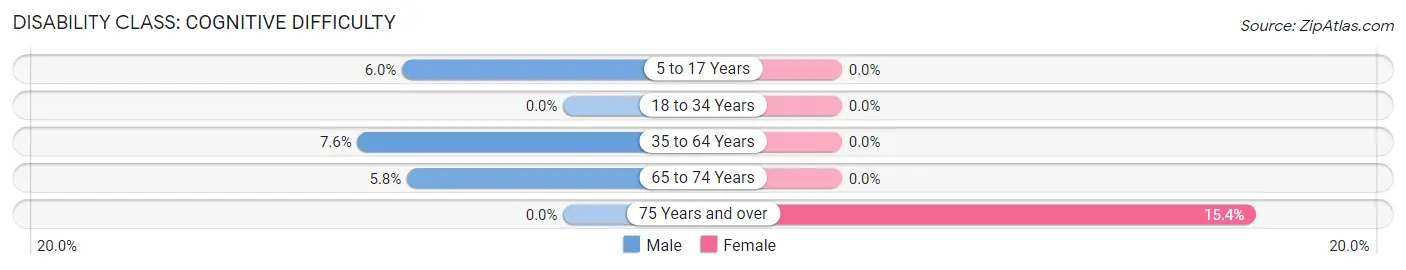
| Age Bracket | Male | Female |
| 5 to 17 Years | 11 (6.0%) | 0 (0.0%) |
| 18 to 34 Years | 0 (0.0%) | 0 (0.0%) |
| 35 to 64 Years | 33 (7.6%) | 0 (0.0%) |
| 65 to 74 Years | 21 (5.8%) | 0 (0.0%) |
| 75 Years and over | 0 (0.0%) | 16 (15.4%) |
Disability Class: Ambulatory Difficulty
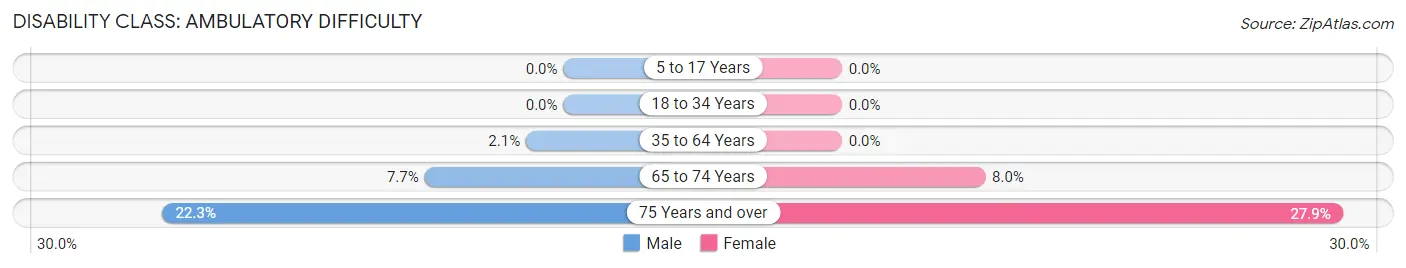
| Age Bracket | Male | Female |
| 5 to 17 Years | 0 (0.0%) | 0 (0.0%) |
| 18 to 34 Years | 0 (0.0%) | 0 (0.0%) |
| 35 to 64 Years | 9 (2.1%) | 0 (0.0%) |
| 65 to 74 Years | 28 (7.7%) | 21 (8.0%) |
| 75 Years and over | 25 (22.3%) | 29 (27.9%) |
Disability Class: Self-Care Difficulty
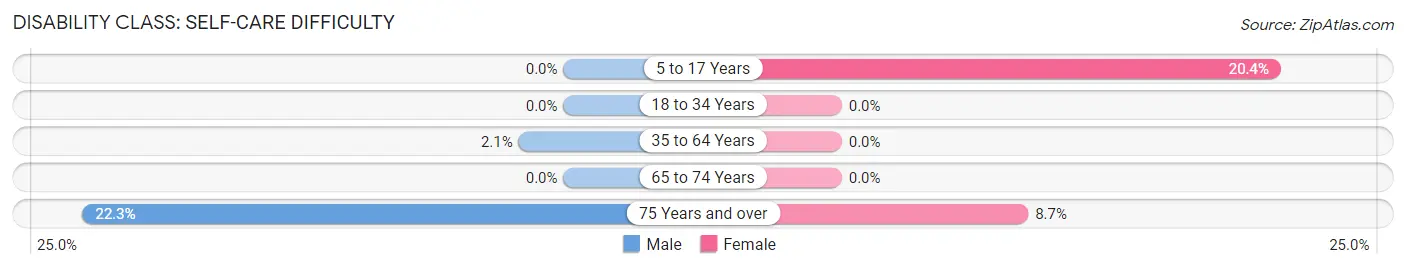
| Age Bracket | Male | Female |
| 5 to 17 Years | 0 (0.0%) | 33 (20.4%) |
| 18 to 34 Years | 0 (0.0%) | 0 (0.0%) |
| 35 to 64 Years | 9 (2.1%) | 0 (0.0%) |
| 65 to 74 Years | 0 (0.0%) | 0 (0.0%) |
| 75 Years and over | 25 (22.3%) | 9 (8.6%) |
Technology Access in East Oakdale
Computing Device Access in East Oakdale
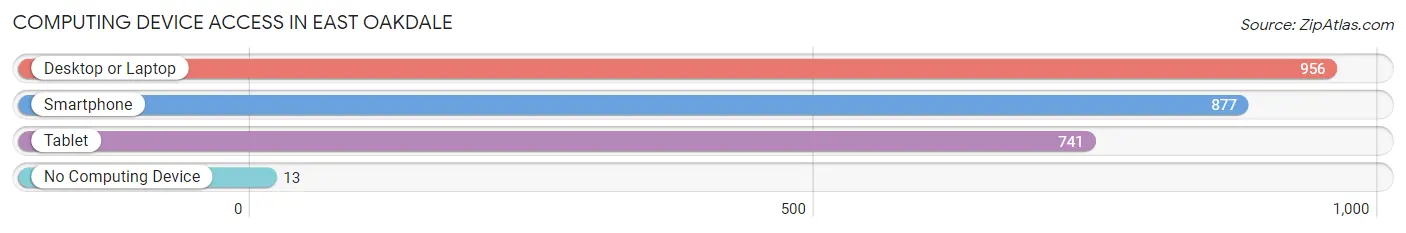
| Device Type | # Households | % Households |
| Desktop or Laptop | 956 | 95.7% |
| Smartphone | 877 | 87.8% |
| Tablet | 741 | 74.2% |
| No Computing Device | 13 | 1.3% |
| Total | 999 | 100.0% |
Internet Access in East Oakdale
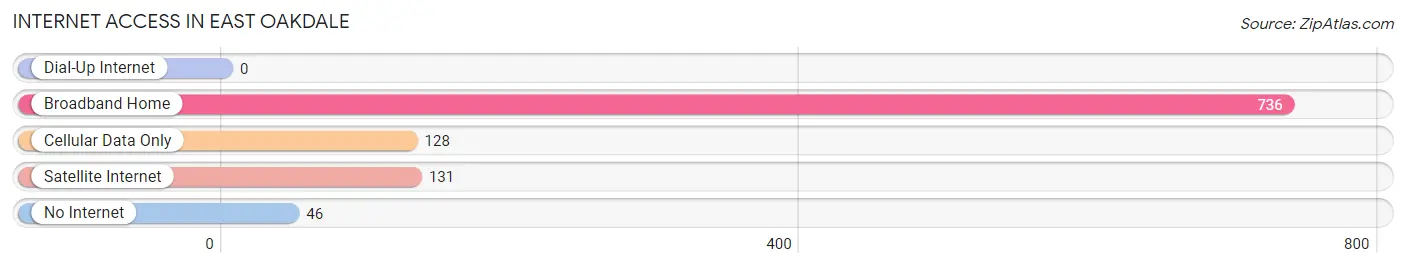
| Internet Type | # Households | % Households |
| Dial-Up Internet | 0 | 0.0% |
| Broadband Home | 736 | 73.7% |
| Cellular Data Only | 128 | 12.8% |
| Satellite Internet | 131 | 13.1% |
| No Internet | 46 | 4.6% |
| Total | 999 | 100.0% |
East Oakdale Summary
Oakdale, California is a small city located in the Central Valley of California, about 70 miles east of San Francisco. It is the county seat of Stanislaus County and is part of the Modesto Metropolitan Statistical Area. The city has a population of about 20,000 people and is known for its agricultural production, particularly of almonds, walnuts, and other tree nuts.
History
Oakdale was founded in 1871 by a group of settlers from the East Coast. The city was named after the oak trees that grew in the area. The first post office was established in 1872 and the city was incorporated in 1874.
In the late 19th century, Oakdale was a major stop on the Central Pacific Railroad, which connected the city to San Francisco and other major cities in the West. The railroad also brought in many new settlers, and the population of Oakdale grew rapidly.
In the early 20th century, Oakdale was a major center for the production of fruit and nuts. The city was home to several large canneries and packing houses, and the local economy was largely based on agriculture.
Geography
Oakdale is located in the Central Valley of California, about 70 miles east of San Francisco. The city is situated on the Stanislaus River, which flows through the city and provides a source of irrigation for the surrounding agricultural lands.
The city is surrounded by rolling hills and is located at an elevation of about 200 feet. The climate is mild and dry, with hot summers and cool winters.
Economy
Oakdale’s economy is largely based on agriculture. The city is home to several large almond and walnut farms, as well as other tree nut farms. The city is also home to several large packing houses and canneries, which process and package the local agricultural products.
In addition to agriculture, Oakdale is home to several small businesses, including restaurants, retail stores, and service providers. The city is also home to a small manufacturing sector, which produces a variety of products, including furniture, clothing, and electronics.
Demographics
As of the 2010 census, Oakdale had a population of 20,675 people. The racial makeup of the city was 75.3% White, 1.3% African American, 0.7% Native American, 1.2% Asian, 0.2% Pacific Islander, 17.7% from other races, and 3.7% from two or more races. Hispanic or Latino of any race were 33.2% of the population.
The median household income in Oakdale was $45,845, and the median family income was $51,919. The per capita income was $20,945. About 17.2% of the population was below the poverty line.
Oakdale is a small city with a diverse population and a strong agricultural economy. The city is home to several large farms and packing houses, as well as a variety of small businesses. The city is also home to a diverse population, with a mix of races and ethnicities.
Common Questions
What is Per Capita Income in East Oakdale?
Per Capita income in East Oakdale is $79,279.
What is the Median Family Income in East Oakdale?
Median Family Income in East Oakdale is $140,568.
What is the Median Household income in East Oakdale?
Median Household Income in East Oakdale is $124,010.
What is Income or Wage Gap in East Oakdale?
Income or Wage Gap in East Oakdale is 34.4%.
Women in East Oakdale earn 65.6 cents for every dollar earned by a man.
What is Inequality or Gini Index in East Oakdale?
Inequality or Gini Index in East Oakdale is 0.49.
What is the Total Population of East Oakdale?
Total Population of East Oakdale is 2,381.
What is the Total Male Population of East Oakdale?
Total Male Population of East Oakdale is 1,315.
What is the Total Female Population of East Oakdale?
Total Female Population of East Oakdale is 1,066.
What is the Ratio of Males per 100 Females in East Oakdale?
There are 123.36 Males per 100 Females in East Oakdale.
What is the Ratio of Females per 100 Males in East Oakdale?
There are 81.06 Females per 100 Males in East Oakdale.
What is the Median Population Age in East Oakdale?
Median Population Age in East Oakdale is 56.7 Years.
What is the Average Family Size in East Oakdale
Average Family Size in East Oakdale is 2.7 People.
What is the Average Household Size in East Oakdale
Average Household Size in East Oakdale is 2.4 People.
How Large is the Labor Force in East Oakdale?
There are 939 People in the Labor Forcein in East Oakdale.
What is the Percentage of People in the Labor Force in East Oakdale?
46.4% of People are in the Labor Force in East Oakdale.
What is the Unemployment Rate in East Oakdale?
Unemployment Rate in East Oakdale is 5.3%.