Trowbridge, CA Map & Demographics
Trowbridge Map
Trowbridge Overview
$48,361
PER CAPITA INCOME
$178,875
AVG FAMILY INCOME
$138,750
AVG HOUSEHOLD INCOME
28.4%
WAGE / INCOME GAP [ % ]
71.6¢/ $1
WAGE / INCOME GAP [ $ ]
0.41
INEQUALITY / GINI INDEX
192
TOTAL POPULATION
91
MALE POPULATION
101
FEMALE POPULATION
90.10
MALES / 100 FEMALES
110.99
FEMALES / 100 MALES
47.3
MEDIAN AGE
3.1
AVG FAMILY SIZE
2.7
AVG HOUSEHOLD SIZE
103
LABOR FORCE [ PEOPLE ]
64.8%
PERCENT IN LABOR FORCE
14.6%
UNEMPLOYMENT RATE
Income in Trowbridge
Income Overview in Trowbridge
Per Capita Income in Trowbridge is $48,361, while median incomes of families and households are $178,875 and $138,750 respectively.
| Characteristic | Number | Measure |
| Per Capita Income | 192 | $48,361 |
| Median Family Income | 53 | $178,875 |
| Mean Family Income | 53 | $168,696 |
| Median Household Income | 72 | $138,750 |
| Mean Household Income | 72 | $131,418 |
| Income Deficit | 53 | $0 |
| Wage / Income Gap (%) | 192 | 28.45% |
| Wage / Income Gap ($) | 192 | 71.55¢ per $1 |
| Gini / Inequality Index | 192 | 0.41 |
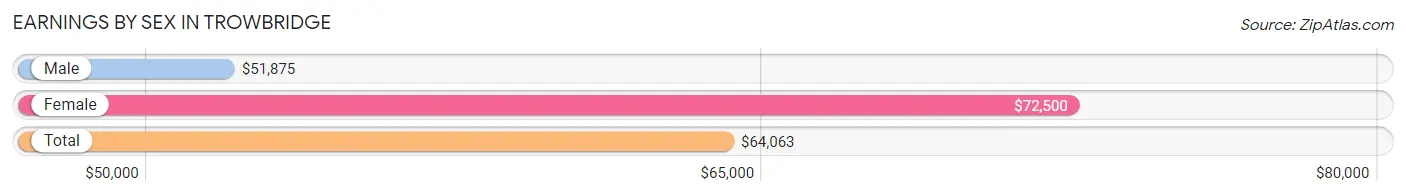
Earnings by Sex in Trowbridge
Average Earnings in Trowbridge are $64,063, $51,875 for men and $72,500 for women, a difference of 28.4%.
| Sex | Number | Average Earnings |
| Male | 61 (56.0%) | $51,875 |
| Female | 48 (44.0%) | $72,500 |
| Total | 109 (100.0%) | $64,063 |
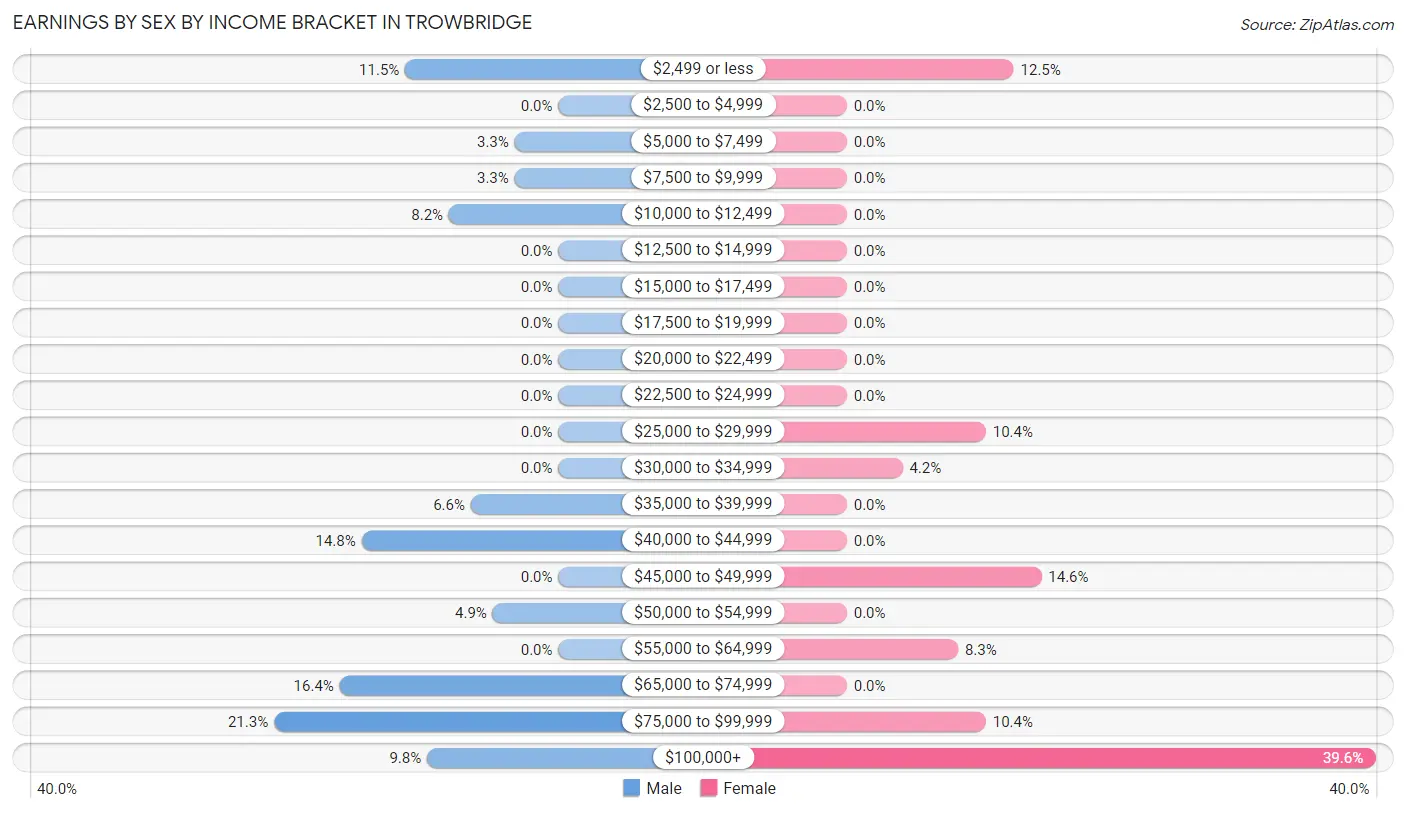
Earnings by Sex by Income Bracket in Trowbridge
The most common earnings brackets in Trowbridge are $75,000 to $99,999 for men (13 | 21.3%) and $100,000+ for women (19 | 39.6%).
| Income | Male | Female |
| $2,499 or less | 7 (11.5%) | 6 (12.5%) |
| $2,500 to $4,999 | 0 (0.0%) | 0 (0.0%) |
| $5,000 to $7,499 | 2 (3.3%) | 0 (0.0%) |
| $7,500 to $9,999 | 2 (3.3%) | 0 (0.0%) |
| $10,000 to $12,499 | 5 (8.2%) | 0 (0.0%) |
| $12,500 to $14,999 | 0 (0.0%) | 0 (0.0%) |
| $15,000 to $17,499 | 0 (0.0%) | 0 (0.0%) |
| $17,500 to $19,999 | 0 (0.0%) | 0 (0.0%) |
| $20,000 to $22,499 | 0 (0.0%) | 0 (0.0%) |
| $22,500 to $24,999 | 0 (0.0%) | 0 (0.0%) |
| $25,000 to $29,999 | 0 (0.0%) | 5 (10.4%) |
| $30,000 to $34,999 | 0 (0.0%) | 2 (4.2%) |
| $35,000 to $39,999 | 4 (6.6%) | 0 (0.0%) |
| $40,000 to $44,999 | 9 (14.7%) | 0 (0.0%) |
| $45,000 to $49,999 | 0 (0.0%) | 7 (14.6%) |
| $50,000 to $54,999 | 3 (4.9%) | 0 (0.0%) |
| $55,000 to $64,999 | 0 (0.0%) | 4 (8.3%) |
| $65,000 to $74,999 | 10 (16.4%) | 0 (0.0%) |
| $75,000 to $99,999 | 13 (21.3%) | 5 (10.4%) |
| $100,000+ | 6 (9.8%) | 19 (39.6%) |
| Total | 61 (100.0%) | 48 (100.0%) |
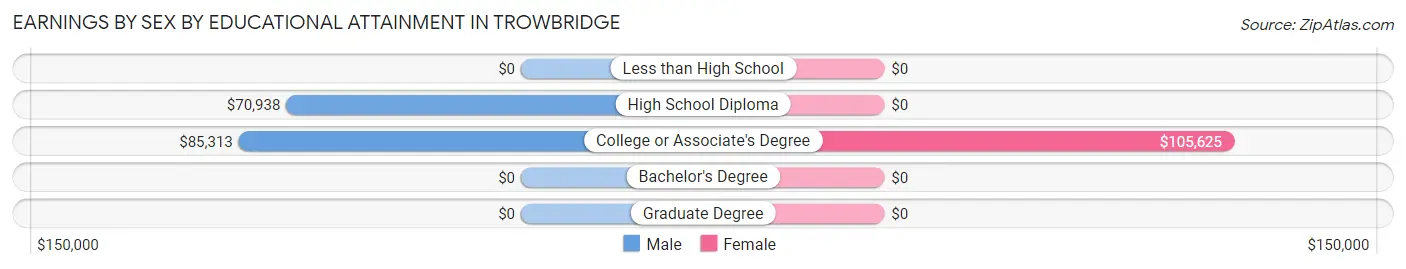
Earnings by Sex by Educational Attainment in Trowbridge
Average earnings in Trowbridge are $70,750 for men and $90,000 for women, a difference of 21.4%. Men with an educational attainment of college or associate's degree enjoy the highest average annual earnings of $85,313, while those with high school diploma education earn the least with $70,938. Women with an educational attainment of college or associate's degree earn the most with the average annual earnings of $105,625, while those with college or associate's degree education have the smallest earnings of $105,625.
| Educational Attainment | Male Income | Female Income |
| Less than High School | - | - |
| High School Diploma | $70,938 | $0 |
| College or Associate's Degree | $85,313 | $105,625 |
| Bachelor's Degree | - | - |
| Graduate Degree | - | - |
| Total | $70,750 | $90,000 |
Family Income in Trowbridge
Family Income Brackets in Trowbridge
According to the Trowbridge family income data, there are 21 families falling into the $150,000 to $199,999 income range, which is the most common income bracket and makes up 39.6% of all families.
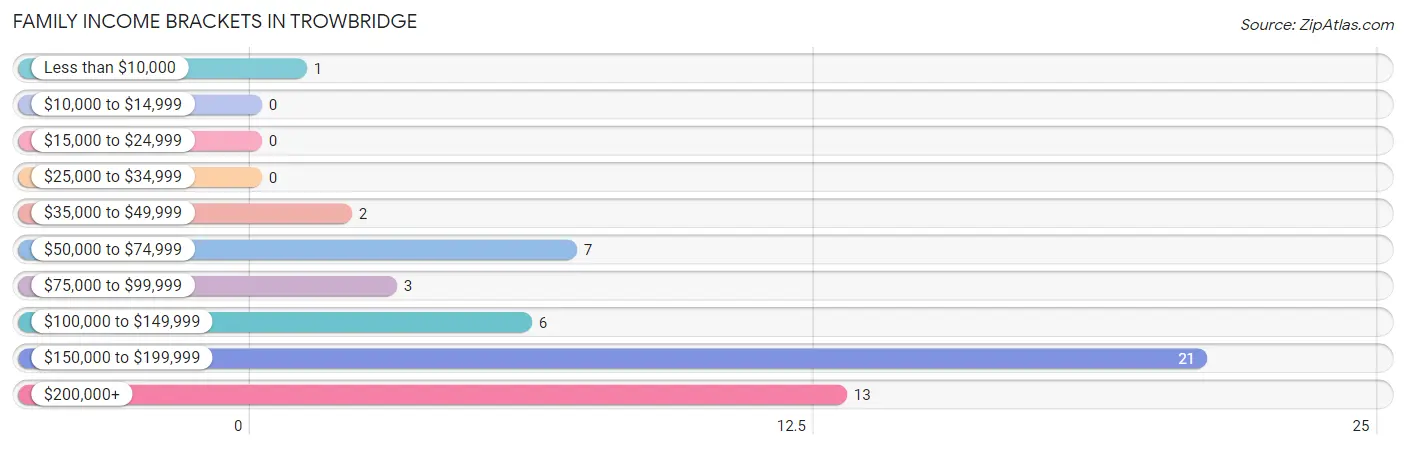
| Income Bracket | # Families | % Families |
| Less than $10,000 | 1 | 1.9% |
| $10,000 to $14,999 | 0 | 0.0% |
| $15,000 to $24,999 | 0 | 0.0% |
| $25,000 to $34,999 | 0 | 0.0% |
| $35,000 to $49,999 | 2 | 3.8% |
| $50,000 to $74,999 | 7 | 13.2% |
| $75,000 to $99,999 | 3 | 5.7% |
| $100,000 to $149,999 | 6 | 11.3% |
| $150,000 to $199,999 | 21 | 39.6% |
| $200,000+ | 13 | 24.5% |
Family Income by Famaliy Size in Trowbridge
4-person families (21 | 39.6%) account for the highest median family income in Trowbridge with $180,893 per family, while 2-person families (23 | 43.4%) have the highest median income of $69,062 per family member.
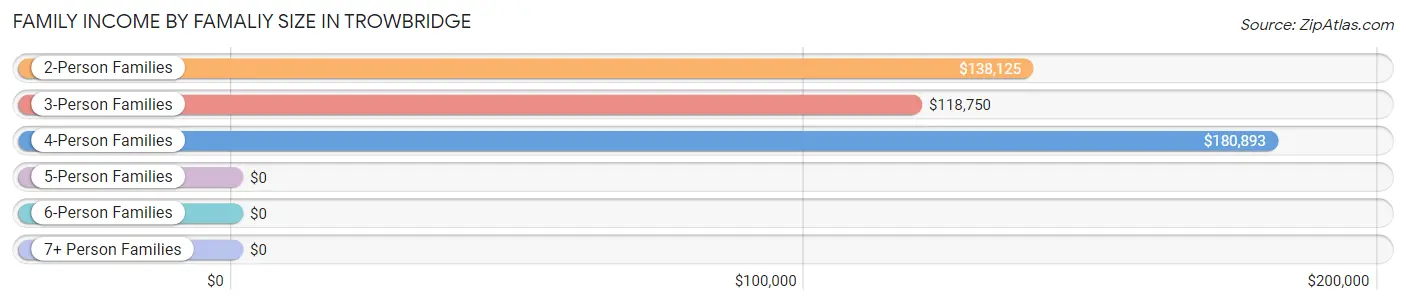
| Income Bracket | # Families | Median Income |
| 2-Person Families | 23 (43.4%) | $138,125 |
| 3-Person Families | 7 (13.2%) | $118,750 |
| 4-Person Families | 21 (39.6%) | $180,893 |
| 5-Person Families | 0 (0.0%) | $0 |
| 6-Person Families | 2 (3.8%) | $0 |
| 7+ Person Families | 0 (0.0%) | $0 |
| Total | 53 (100.0%) | $178,875 |
Family Income by Number of Earners in Trowbridge
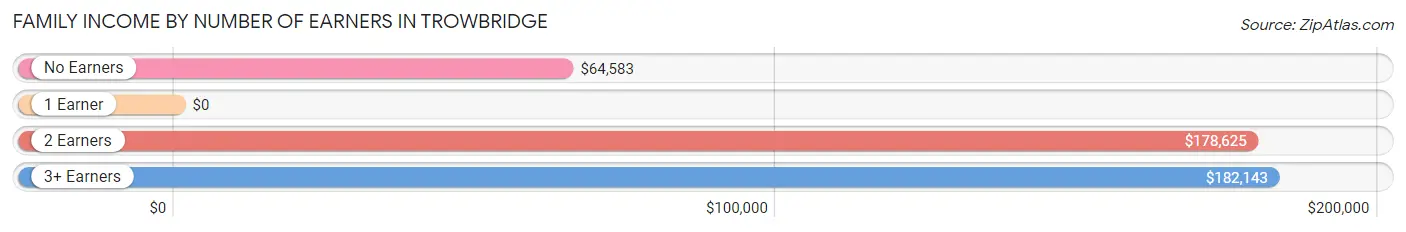
| Number of Earners | # Families | Median Income |
| No Earners | 11 (20.7%) | $64,583 |
| 1 Earner | 3 (5.7%) | $0 |
| 2 Earners | 27 (50.9%) | $178,625 |
| 3+ Earners | 12 (22.6%) | $182,143 |
| Total | 53 (100.0%) | $178,875 |
Household Income in Trowbridge
Household Income Brackets in Trowbridge
With 21 households falling in the category, the $150,000 to $199,999 income range is the most frequent in Trowbridge, accounting for 29.2% of all households.
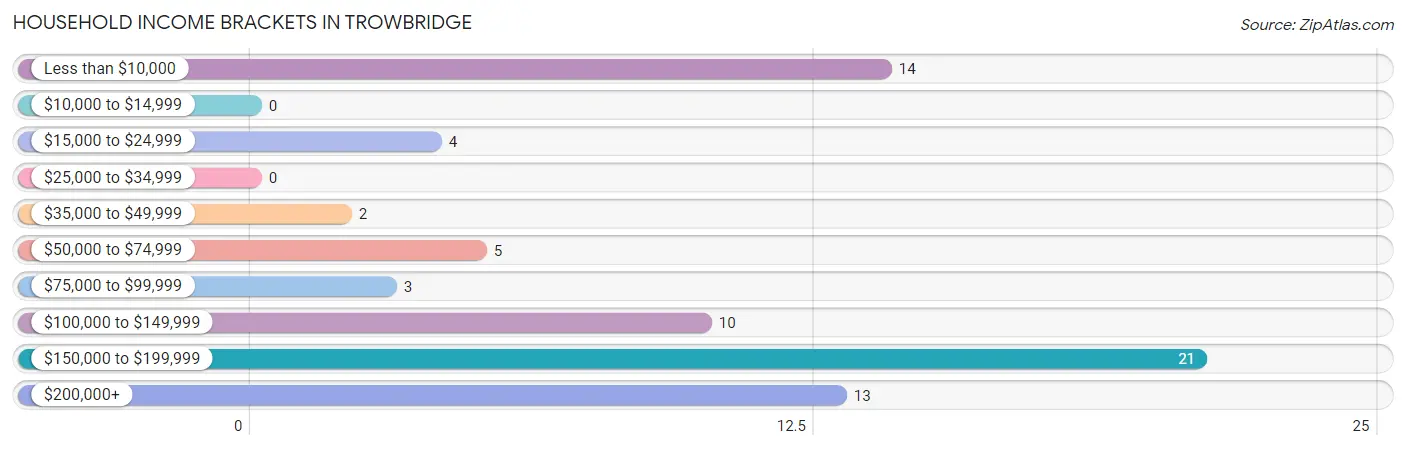
| Income Bracket | # Households | % Households |
| Less than $10,000 | 14 | 19.4% |
| $10,000 to $14,999 | 0 | 0.0% |
| $15,000 to $24,999 | 4 | 5.6% |
| $25,000 to $34,999 | 0 | 0.0% |
| $35,000 to $49,999 | 2 | 2.8% |
| $50,000 to $74,999 | 5 | 6.9% |
| $75,000 to $99,999 | 3 | 4.2% |
| $100,000 to $149,999 | 10 | 13.9% |
| $150,000 to $199,999 | 21 | 29.2% |
| $200,000+ | 13 | 18.1% |
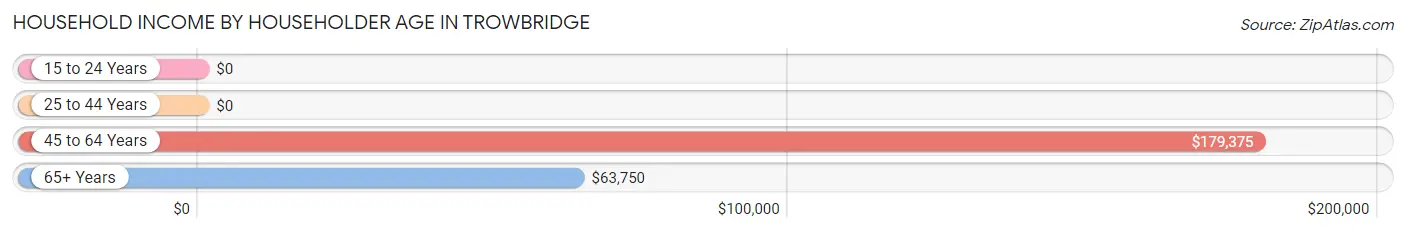
Household Income by Householder Age in Trowbridge
The median household income in Trowbridge is $138,750, with the highest median household income of $179,375 found in the 45 to 64 years age bracket for the primary householder. A total of 37 households (51.4%) fall into this category. Meanwhile, the 15 to 24 years age bracket for the primary householder has the lowest median household income of $0, with 7 households (9.7%) in this group.
| Income Bracket | # Households | Median Income |
| 15 to 24 Years | 7 (9.7%) | $0 |
| 25 to 44 Years | 11 (15.3%) | $0 |
| 45 to 64 Years | 37 (51.4%) | $179,375 |
| 65+ Years | 17 (23.6%) | $63,750 |
| Total | 72 (100.0%) | $138,750 |
Poverty in Trowbridge
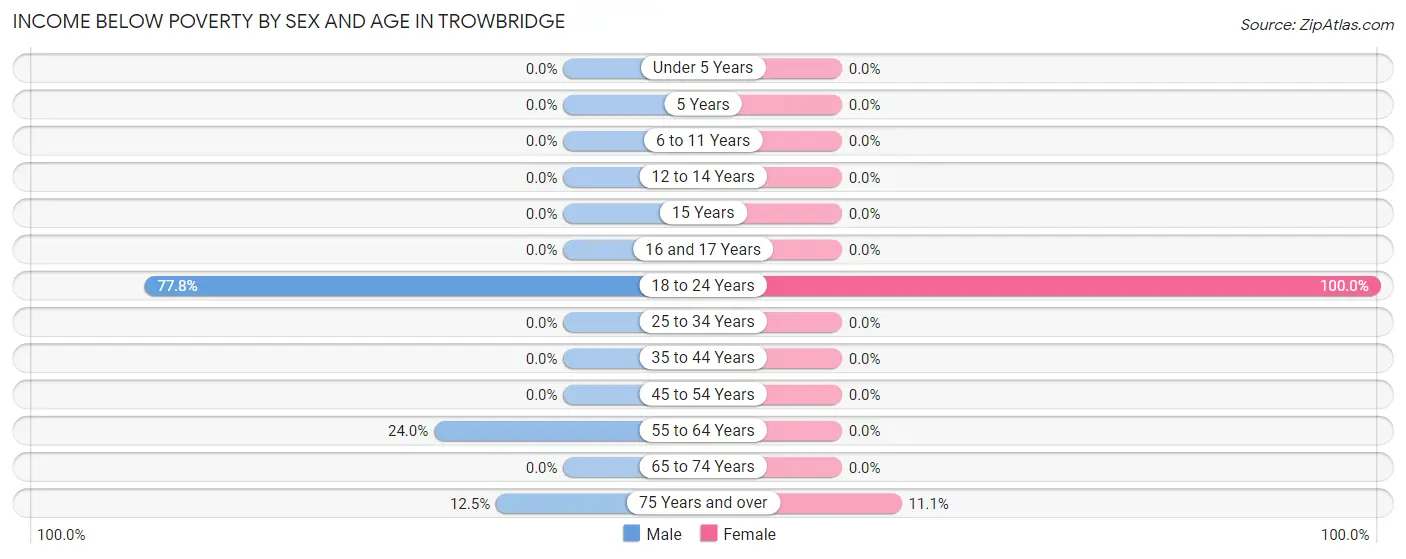
Income Below Poverty by Sex and Age in Trowbridge
With 15.4% poverty level for males and 7.9% for females among the residents of Trowbridge, 18 to 24 year old males and 18 to 24 year old females are the most vulnerable to poverty, with 7 males (77.8%) and 6 females (100.0%) in their respective age groups living below the poverty level.
| Age Bracket | Male | Female |
| Under 5 Years | 0 (0.0%) | 0 (0.0%) |
| 5 Years | 0 (0.0%) | 0 (0.0%) |
| 6 to 11 Years | 0 (0.0%) | 0 (0.0%) |
| 12 to 14 Years | 0 (0.0%) | 0 (0.0%) |
| 15 Years | 0 (0.0%) | 0 (0.0%) |
| 16 and 17 Years | 0 (0.0%) | 0 (0.0%) |
| 18 to 24 Years | 7 (77.8%) | 6 (100.0%) |
| 25 to 34 Years | 0 (0.0%) | 0 (0.0%) |
| 35 to 44 Years | 0 (0.0%) | 0 (0.0%) |
| 45 to 54 Years | 0 (0.0%) | 0 (0.0%) |
| 55 to 64 Years | 6 (24.0%) | 0 (0.0%) |
| 65 to 74 Years | 0 (0.0%) | 0 (0.0%) |
| 75 Years and over | 1 (12.5%) | 2 (11.1%) |
| Total | 14 (15.4%) | 8 (7.9%) |
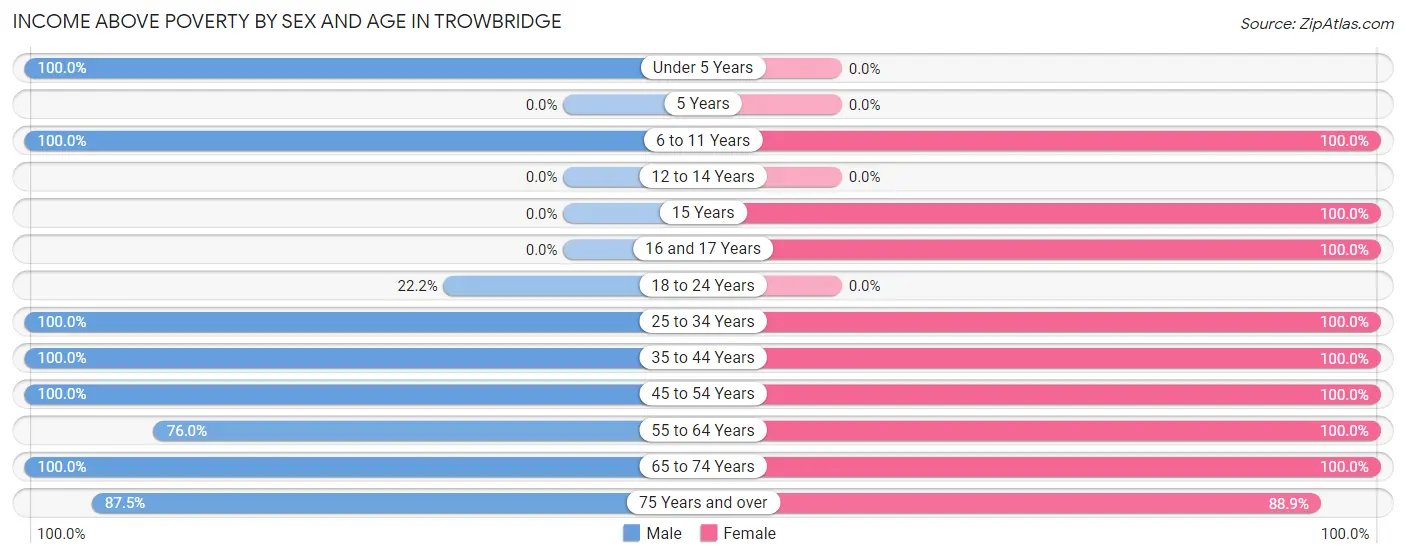
Income Above Poverty by Sex and Age in Trowbridge
According to the poverty statistics in Trowbridge, males aged under 5 years and females aged 6 to 11 years are the age groups that are most secure financially, with 100.0% of males and 100.0% of females in these age groups living above the poverty line.
| Age Bracket | Male | Female |
| Under 5 Years | 6 (100.0%) | 0 (0.0%) |
| 5 Years | 0 (0.0%) | 0 (0.0%) |
| 6 to 11 Years | 2 (100.0%) | 23 (100.0%) |
| 12 to 14 Years | 0 (0.0%) | 0 (0.0%) |
| 15 Years | 0 (0.0%) | 2 (100.0%) |
| 16 and 17 Years | 0 (0.0%) | 7 (100.0%) |
| 18 to 24 Years | 2 (22.2%) | 0 (0.0%) |
| 25 to 34 Years | 13 (100.0%) | 11 (100.0%) |
| 35 to 44 Years | 13 (100.0%) | 3 (100.0%) |
| 45 to 54 Years | 11 (100.0%) | 10 (100.0%) |
| 55 to 64 Years | 19 (76.0%) | 18 (100.0%) |
| 65 to 74 Years | 4 (100.0%) | 3 (100.0%) |
| 75 Years and over | 7 (87.5%) | 16 (88.9%) |
| Total | 77 (84.6%) | 93 (92.1%) |
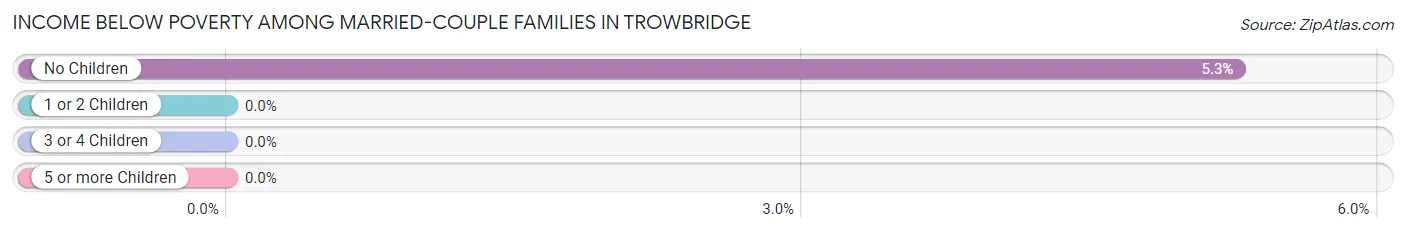
Income Below Poverty Among Married-Couple Families in Trowbridge
The poverty statistics for married-couple families in Trowbridge show that 2.4% or 1 of the total 42 families live below the poverty line. Families with no children have the highest poverty rate of 5.3%, comprising of 1 families. On the other hand, families with 1 or 2 children have the lowest poverty rate of 0.0%, which includes 0 families.
| Children | Above Poverty | Below Poverty |
| No Children | 18 (94.7%) | 1 (5.3%) |
| 1 or 2 Children | 23 (100.0%) | 0 (0.0%) |
| 3 or 4 Children | 0 (0.0%) | 0 (0.0%) |
| 5 or more Children | 0 (0.0%) | 0 (0.0%) |
| Total | 41 (97.6%) | 1 (2.4%) |
Income Below Poverty Among Single-Parent Households in Trowbridge
| Children | Single Father | Single Mother |
| No Children | 0 (0.0%) | 0 (0.0%) |
| 1 or 2 Children | 0 (0.0%) | 0 (0.0%) |
| 3 or 4 Children | 0 (0.0%) | 0 (0.0%) |
| 5 or more Children | 0 (0.0%) | 0 (0.0%) |
| Total | 0 (0.0%) | 0 (0.0%) |
Income Below Poverty Among Married-Couple vs Single-Parent Households in Trowbridge
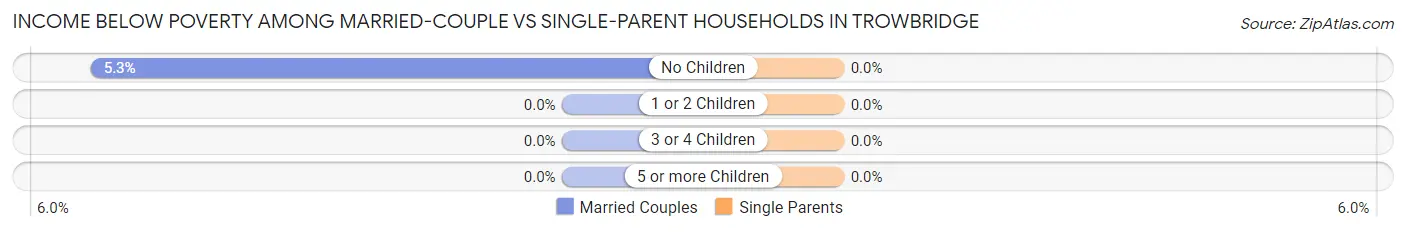
| Children | Married-Couple Families | Single-Parent Households |
| No Children | 1 (5.3%) | 0 (0.0%) |
| 1 or 2 Children | 0 (0.0%) | 0 (0.0%) |
| 3 or 4 Children | 0 (0.0%) | 0 (0.0%) |
| 5 or more Children | 0 (0.0%) | 0 (0.0%) |
| Total | 1 (2.4%) | 0 (0.0%) |
Race in Trowbridge
The most populous races in Trowbridge are White / Caucasian (153 | 79.7%), Two or more Races (29 | 15.1%), and Hispanic or Latino (8 | 4.2%).
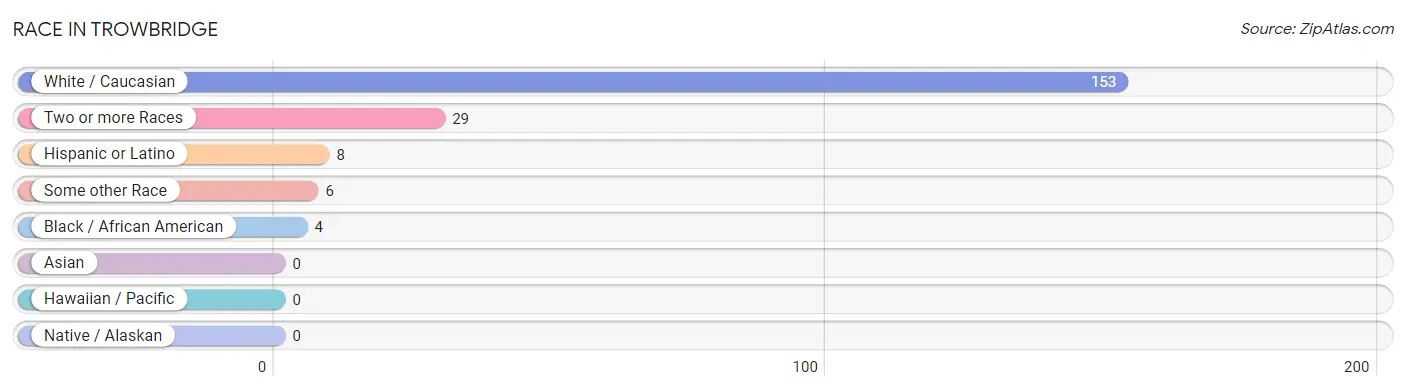
| Race | # Population | % Population |
| Asian | 0 | 0.0% |
| Black / African American | 4 | 2.1% |
| Hawaiian / Pacific | 0 | 0.0% |
| Hispanic or Latino | 8 | 4.2% |
| Native / Alaskan | 0 | 0.0% |
| White / Caucasian | 153 | 79.7% |
| Two or more Races | 29 | 15.1% |
| Some other Race | 6 | 3.1% |
| Total | 192 | 100.0% |
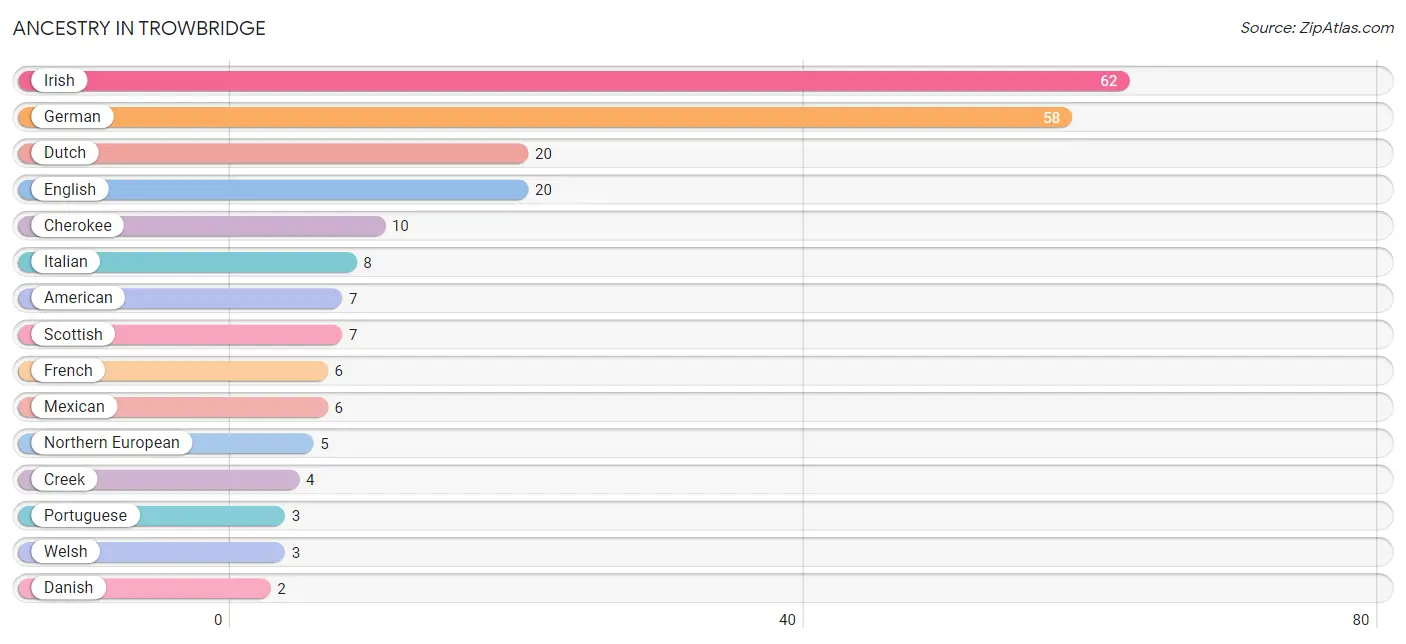
Ancestry in Trowbridge
The most populous ancestries reported in Trowbridge are Irish (62 | 32.3%), German (58 | 30.2%), Dutch (20 | 10.4%), English (20 | 10.4%), and Cherokee (10 | 5.2%), together accounting for 88.5% of all Trowbridge residents.
| Ancestry | # Population | % Population |
| American | 7 | 3.6% |
| Cherokee | 10 | 5.2% |
| Creek | 4 | 2.1% |
| Danish | 2 | 1.0% |
| Dutch | 20 | 10.4% |
| English | 20 | 10.4% |
| Finnish | 2 | 1.0% |
| French | 6 | 3.1% |
| French Canadian | 2 | 1.0% |
| German | 58 | 30.2% |
| Irish | 62 | 32.3% |
| Italian | 8 | 4.2% |
| Mexican | 6 | 3.1% |
| Northern European | 5 | 2.6% |
| Norwegian | 1 | 0.5% |
| Portuguese | 3 | 1.6% |
| Scotch-Irish | 1 | 0.5% |
| Scottish | 7 | 3.6% |
| Spaniard | 2 | 1.0% |
| Swedish | 1 | 0.5% |
| Welsh | 3 | 1.6% | View All 21 Rows |
Immigrants in Trowbridge

| Immigration Origin | # Population | % Population | View All 0 Rows |
Sex and Age in Trowbridge
Sex and Age in Trowbridge
The most populous age groups in Trowbridge are 60 to 64 Years (21 | 23.1%) for men and 5 to 9 Years (19 | 18.8%) for women.
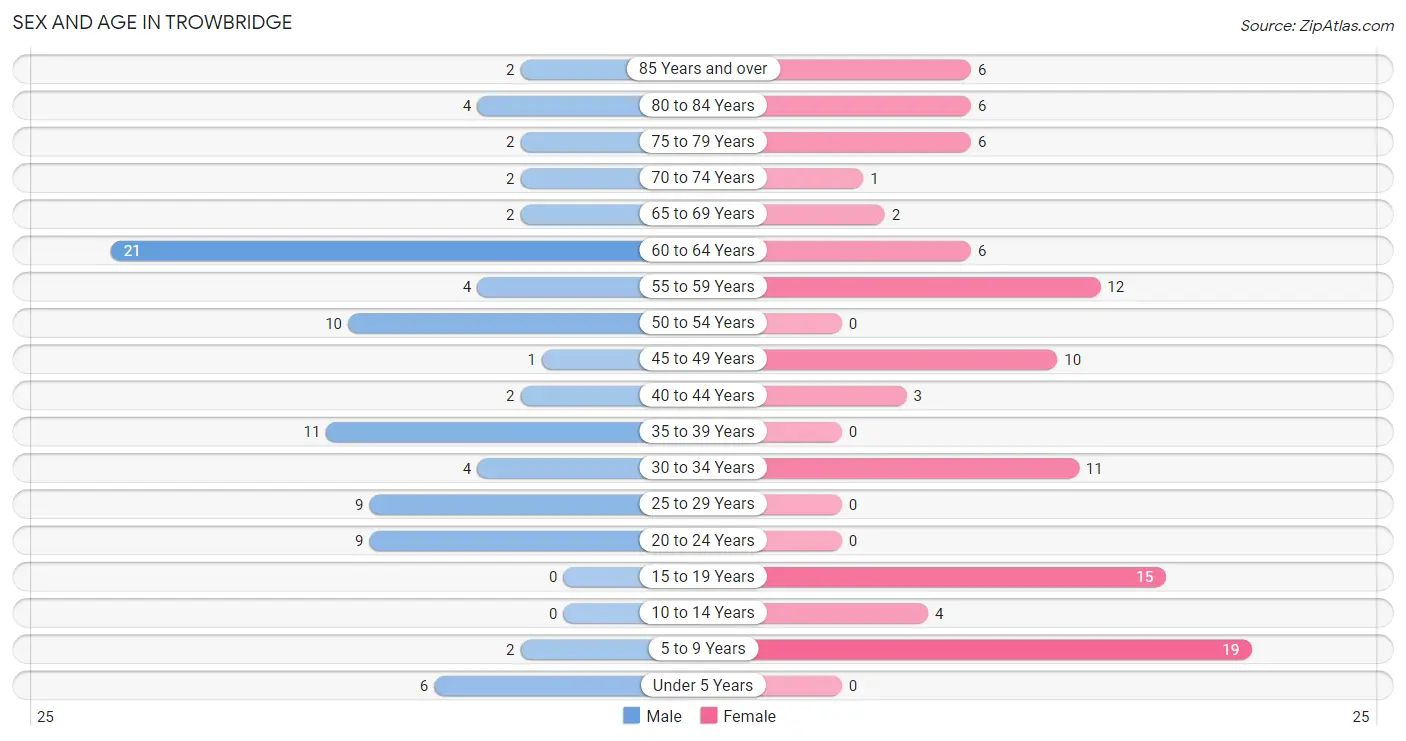
| Age Bracket | Male | Female |
| Under 5 Years | 6 (6.6%) | 0 (0.0%) |
| 5 to 9 Years | 2 (2.2%) | 19 (18.8%) |
| 10 to 14 Years | 0 (0.0%) | 4 (4.0%) |
| 15 to 19 Years | 0 (0.0%) | 15 (14.8%) |
| 20 to 24 Years | 9 (9.9%) | 0 (0.0%) |
| 25 to 29 Years | 9 (9.9%) | 0 (0.0%) |
| 30 to 34 Years | 4 (4.4%) | 11 (10.9%) |
| 35 to 39 Years | 11 (12.1%) | 0 (0.0%) |
| 40 to 44 Years | 2 (2.2%) | 3 (3.0%) |
| 45 to 49 Years | 1 (1.1%) | 10 (9.9%) |
| 50 to 54 Years | 10 (11.0%) | 0 (0.0%) |
| 55 to 59 Years | 4 (4.4%) | 12 (11.9%) |
| 60 to 64 Years | 21 (23.1%) | 6 (5.9%) |
| 65 to 69 Years | 2 (2.2%) | 2 (2.0%) |
| 70 to 74 Years | 2 (2.2%) | 1 (1.0%) |
| 75 to 79 Years | 2 (2.2%) | 6 (5.9%) |
| 80 to 84 Years | 4 (4.4%) | 6 (5.9%) |
| 85 Years and over | 2 (2.2%) | 6 (5.9%) |
| Total | 91 (100.0%) | 101 (100.0%) |
Families and Households in Trowbridge
Median Family Size in Trowbridge
The median family size in Trowbridge is 3.08 persons per family, with married-couple families (42 | 79.2%) accounting for the largest median family size of 3.36 persons per family. On the other hand, single male/father families (5 | 9.4%) represent the smallest median family size with 1.80 persons per family.
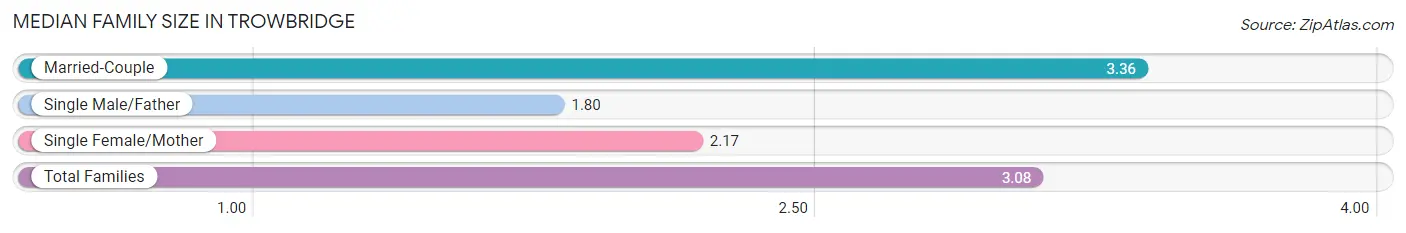
| Family Type | # Families | Family Size |
| Married-Couple | 42 (79.2%) | 3.36 |
| Single Male/Father | 5 (9.4%) | 1.80 |
| Single Female/Mother | 6 (11.3%) | 2.17 |
| Total Families | 53 (100.0%) | 3.08 |
Median Household Size in Trowbridge
The median household size in Trowbridge is 2.67 persons per household, with married-couple households (42 | 58.3%) accounting for the largest median household size of 3.45 persons per household. non-family households (19 | 26.4%) represent the smallest median household size with 1.32 persons per household.
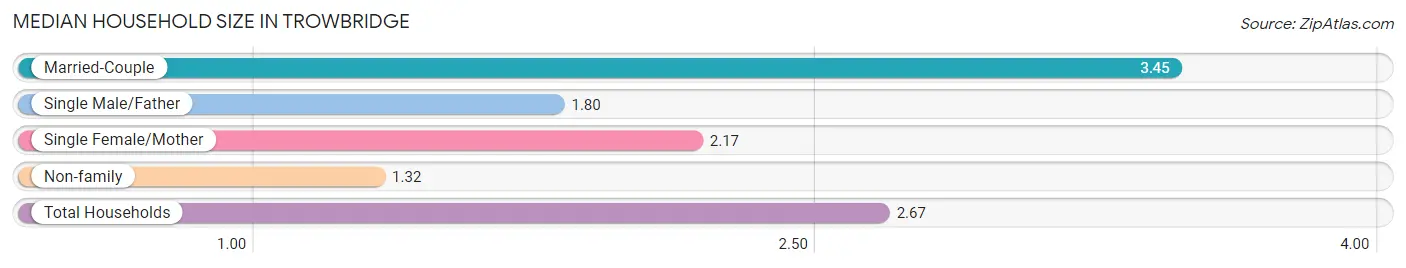
| Household Type | # Households | Household Size |
| Married-Couple | 42 (58.3%) | 3.45 |
| Single Male/Father | 5 (6.9%) | 1.80 |
| Single Female/Mother | 6 (8.3%) | 2.17 |
| Non-family | 19 (26.4%) | 1.32 |
| Total Households | 72 (100.0%) | 2.67 |
Household Size by Marriage Status in Trowbridge
Out of a total of 72 households in Trowbridge, 53 (73.6%) are family households, while 19 (26.4%) are nonfamily households. The most numerous type of family households are 4-person households, comprising 23, and the most common type of nonfamily households are 1-person households, comprising 12.
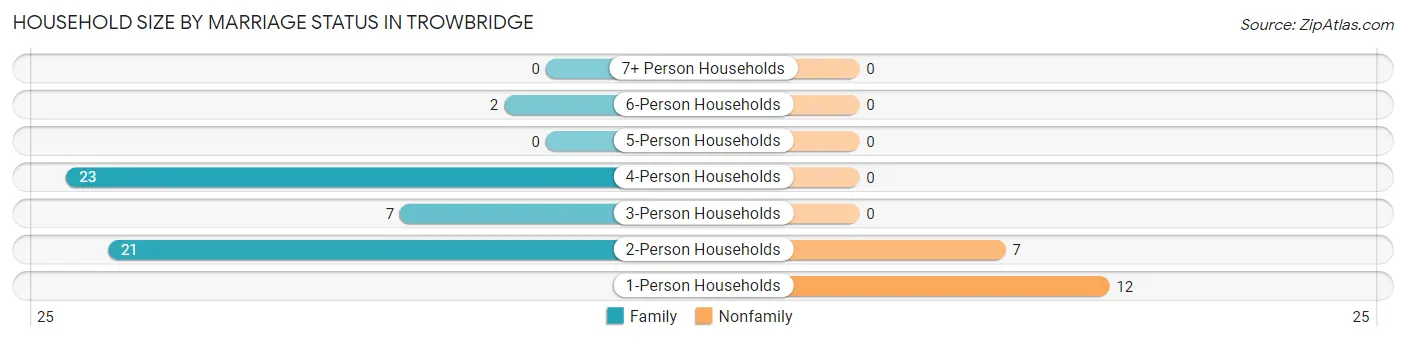
| Household Size | Family Households | Nonfamily Households |
| 1-Person Households | - | 12 (16.7%) |
| 2-Person Households | 21 (29.2%) | 7 (9.7%) |
| 3-Person Households | 7 (9.7%) | 0 (0.0%) |
| 4-Person Households | 23 (31.9%) | 0 (0.0%) |
| 5-Person Households | 0 (0.0%) | 0 (0.0%) |
| 6-Person Households | 2 (2.8%) | 0 (0.0%) |
| 7+ Person Households | 0 (0.0%) | 0 (0.0%) |
| Total | 53 (73.6%) | 19 (26.4%) |
Female Fertility in Trowbridge
Fertility by Age in Trowbridge
| Age Bracket | Women with Births | Births / 1,000 Women |
| 15 to 19 years | 0 (0.0%) | 0.0 |
| 20 to 34 years | 0 (0.0%) | 0.0 |
| 35 to 50 years | 0 (0.0%) | 0.0 |
| Total | 0 (0.0%) | 0.0 |
Fertility by Age by Marriage Status in Trowbridge
| Age Bracket | Married | Unmarried |
| 15 to 19 years | 0 (0.0%) | 0 (0.0%) |
| 20 to 34 years | 0 (0.0%) | 0 (0.0%) |
| 35 to 50 years | 0 (0.0%) | 0 (0.0%) |
| Total | 0 (0.0%) | 0 (0.0%) |
Fertility by Education in Trowbridge
| Educational Attainment | Women with Births | Births / 1,000 Women |
| Less than High School | 0 (0.0%) | 0.0 |
| High School Diploma | 0 (0.0%) | 0.0 |
| College or Associate's Degree | 0 (0.0%) | 0.0 |
| Bachelor's Degree | 0 (0.0%) | 0.0 |
| Graduate Degree | 0 (0.0%) | 0.0 |
| Total | 0 (0.0%) | 0.0 |
Fertility by Education by Marriage Status in Trowbridge
| Educational Attainment | Married | Unmarried |
| Less than High School | 0 (0.0%) | 0 (0.0%) |
| High School Diploma | 0 (0.0%) | 0 (0.0%) |
| College or Associate's Degree | 0 (0.0%) | 0 (0.0%) |
| Bachelor's Degree | 0 (0.0%) | 0 (0.0%) |
| Graduate Degree | 0 (0.0%) | 0 (0.0%) |
| Total | 0 (0.0%) | 0 (0.0%) |
Employment Characteristics in Trowbridge
Employment by Class of Employer in Trowbridge
Among the 88 employed individuals in Trowbridge, private company employees (50 | 56.8%), state government employees (17 | 19.3%), and local government employees (14 | 15.9%) make up the most common classes of employment.
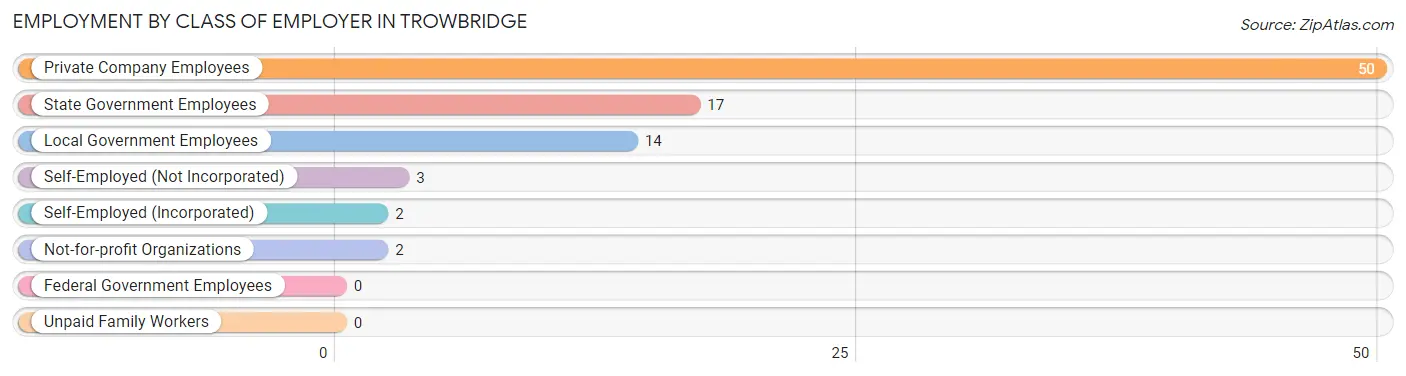
| Employer Class | # Employees | % Employees |
| Private Company Employees | 50 | 56.8% |
| Self-Employed (Incorporated) | 2 | 2.3% |
| Self-Employed (Not Incorporated) | 3 | 3.4% |
| Not-for-profit Organizations | 2 | 2.3% |
| Local Government Employees | 14 | 15.9% |
| State Government Employees | 17 | 19.3% |
| Federal Government Employees | 0 | 0.0% |
| Unpaid Family Workers | 0 | 0.0% |
| Total | 88 | 100.0% |
Employment Status by Age in Trowbridge
According to the labor force statistics for Trowbridge, out of the total population over 16 years of age (159), 64.8% or 103 individuals are in the labor force, with 14.6% or 15 of them unemployed. The age group with the highest labor force participation rate is 20 to 24 years, with 100.0% or 9 individuals in the labor force. Within the labor force, the 16 to 19 years age range has the highest percentage of unemployed individuals, with 100.0% or 6 of them being unemployed.
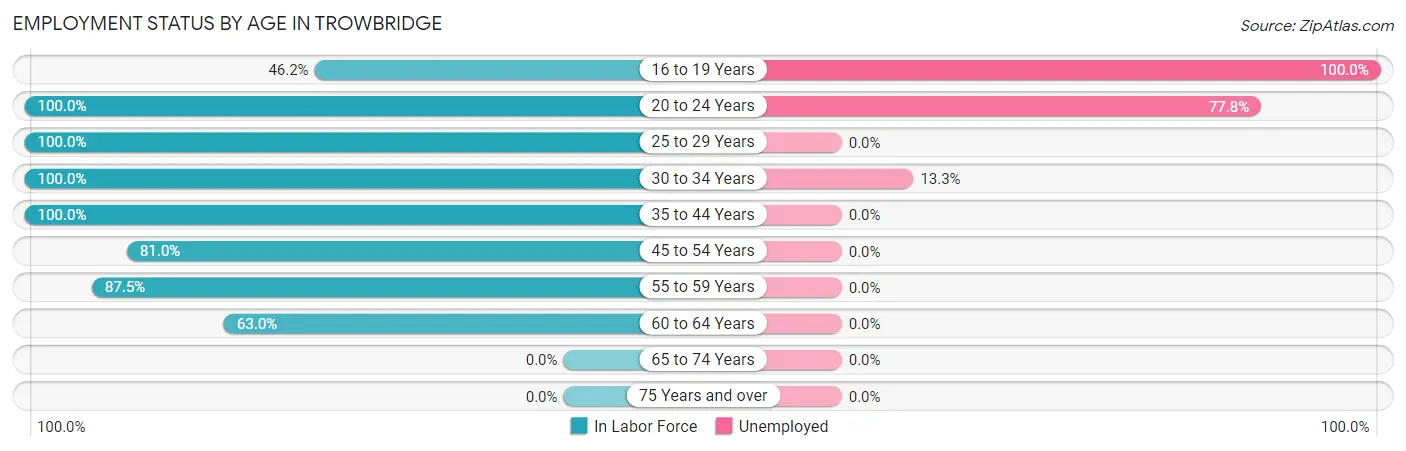
| Age Bracket | In Labor Force | Unemployed |
| 16 to 19 Years | 6 (46.2%) | 6 (100.0%) |
| 20 to 24 Years | 9 (100.0%) | 7 (77.8%) |
| 25 to 29 Years | 9 (100.0%) | 0 (0.0%) |
| 30 to 34 Years | 15 (100.0%) | 2 (13.3%) |
| 35 to 44 Years | 16 (100.0%) | 0 (0.0%) |
| 45 to 54 Years | 17 (81.0%) | 0 (0.0%) |
| 55 to 59 Years | 14 (87.5%) | 0 (0.0%) |
| 60 to 64 Years | 17 (63.0%) | 0 (0.0%) |
| 65 to 74 Years | 0 (0.0%) | 0 (0.0%) |
| 75 Years and over | 0 (0.0%) | 0 (0.0%) |
| Total | 103 (64.8%) | 15 (14.6%) |
Employment Status by Educational Attainment in Trowbridge
According to labor force statistics for Trowbridge, 84.6% of individuals (88) out of the total population between 25 and 64 years of age (104) are in the labor force, with 2.3% or 2 of them being unemployed. The group with the highest labor force participation rate are those with the educational attainment of less than high school, with 100.0% or 3 individuals in the labor force. Within the labor force, individuals with high school diploma education have the highest percentage of unemployment, with 6.1% or 2 of them being unemployed.
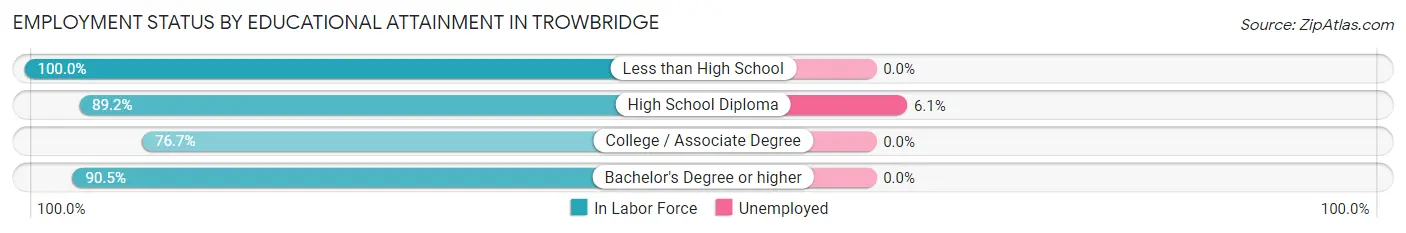
| Educational Attainment | In Labor Force | Unemployed |
| Less than High School | 3 (100.0%) | 0 (0.0%) |
| High School Diploma | 33 (89.2%) | 2 (6.1%) |
| College / Associate Degree | 33 (76.7%) | 0 (0.0%) |
| Bachelor's Degree or higher | 19 (90.5%) | 0 (0.0%) |
| Total | 88 (84.6%) | 2 (2.3%) |
Employment Occupations by Sex in Trowbridge
Management, Business, Science and Arts Occupations
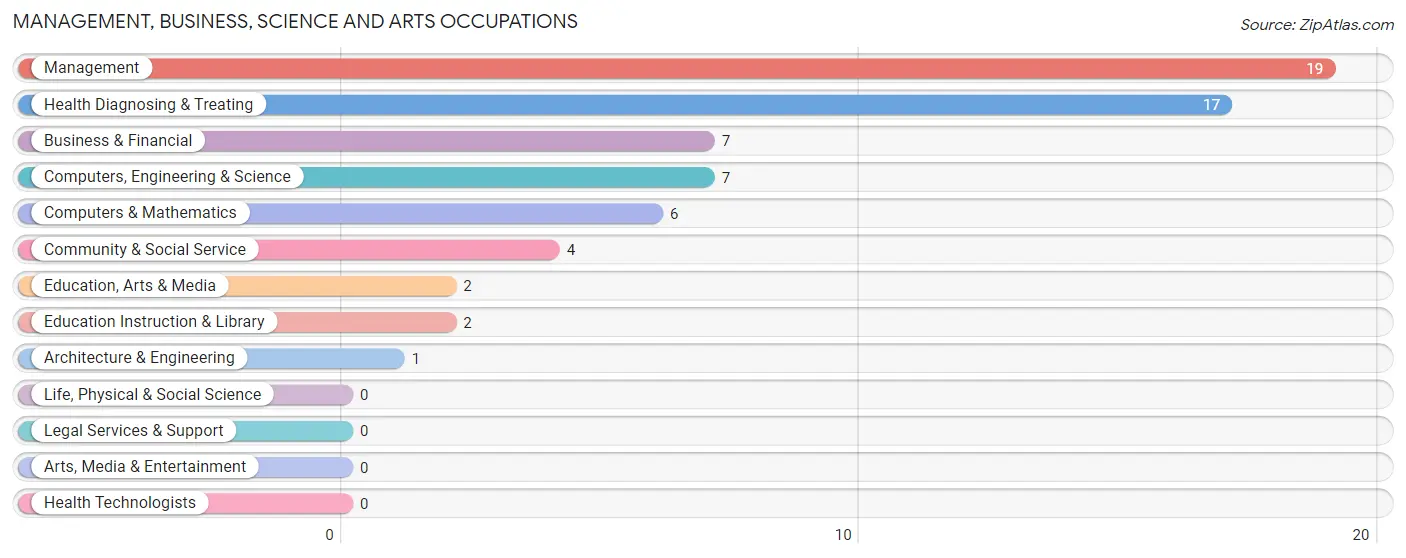
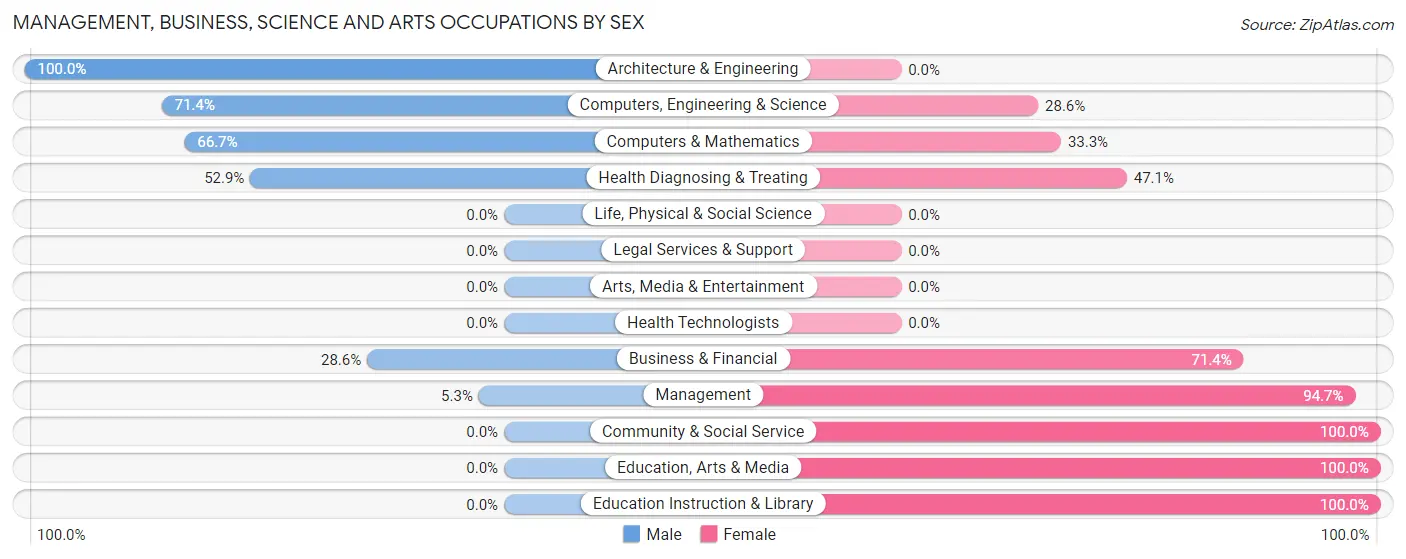
The most common Management, Business, Science and Arts occupations in Trowbridge are Management (19 | 21.6%), Health Diagnosing & Treating (17 | 19.3%), Business & Financial (7 | 8.0%), Computers, Engineering & Science (7 | 8.0%), and Computers & Mathematics (6 | 6.8%).
Management, Business, Science and Arts Occupations by Sex
Within the Management, Business, Science and Arts occupations in Trowbridge, the most male-oriented occupations are Architecture & Engineering (100.0%), Computers, Engineering & Science (71.4%), and Computers & Mathematics (66.7%), while the most female-oriented occupations are Community & Social Service (100.0%), Education, Arts & Media (100.0%), and Education Instruction & Library (100.0%).
| Occupation | Male | Female |
| Management | 1 (5.3%) | 18 (94.7%) |
| Business & Financial | 2 (28.6%) | 5 (71.4%) |
| Computers, Engineering & Science | 5 (71.4%) | 2 (28.6%) |
| Computers & Mathematics | 4 (66.7%) | 2 (33.3%) |
| Architecture & Engineering | 1 (100.0%) | 0 (0.0%) |
| Life, Physical & Social Science | 0 (0.0%) | 0 (0.0%) |
| Community & Social Service | 0 (0.0%) | 4 (100.0%) |
| Education, Arts & Media | 0 (0.0%) | 2 (100.0%) |
| Legal Services & Support | 0 (0.0%) | 0 (0.0%) |
| Education Instruction & Library | 0 (0.0%) | 2 (100.0%) |
| Arts, Media & Entertainment | 0 (0.0%) | 0 (0.0%) |
| Health Diagnosing & Treating | 9 (52.9%) | 8 (47.1%) |
| Health Technologists | 0 (0.0%) | 0 (0.0%) |
| Total (Category) | 17 (31.5%) | 37 (68.5%) |
| Total (Overall) | 48 (54.5%) | 40 (45.5%) |
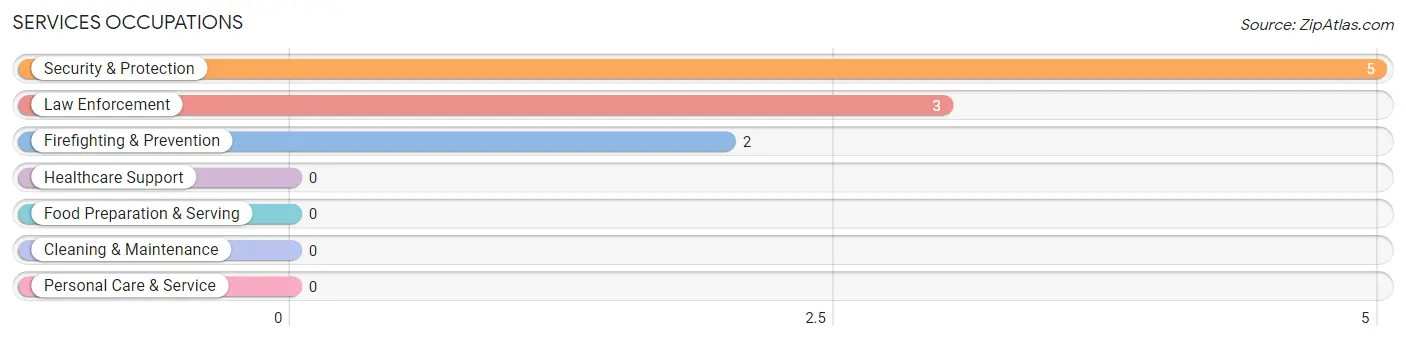
Services Occupations
The most common Services occupations in Trowbridge are Security & Protection (5 | 5.7%), Law Enforcement (3 | 3.4%), and Firefighting & Prevention (2 | 2.3%).
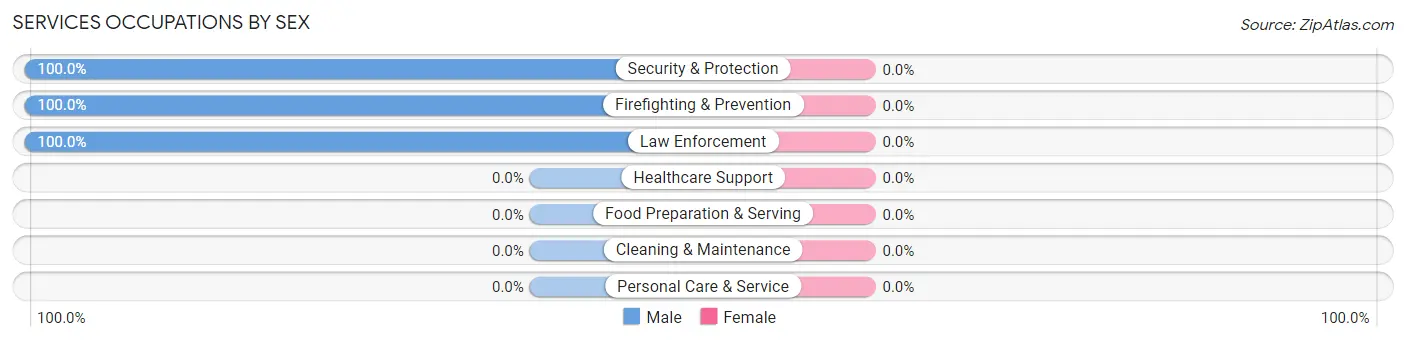
Services Occupations by Sex
| Occupation | Male | Female |
| Healthcare Support | 0 (0.0%) | 0 (0.0%) |
| Security & Protection | 5 (100.0%) | 0 (0.0%) |
| Firefighting & Prevention | 2 (100.0%) | 0 (0.0%) |
| Law Enforcement | 3 (100.0%) | 0 (0.0%) |
| Food Preparation & Serving | 0 (0.0%) | 0 (0.0%) |
| Cleaning & Maintenance | 0 (0.0%) | 0 (0.0%) |
| Personal Care & Service | 0 (0.0%) | 0 (0.0%) |
| Total (Category) | 5 (100.0%) | 0 (0.0%) |
| Total (Overall) | 48 (54.5%) | 40 (45.5%) |
Sales and Office Occupations
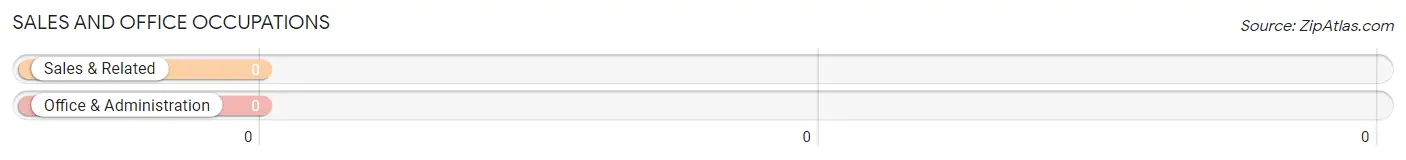
Sales and Office Occupations by Sex
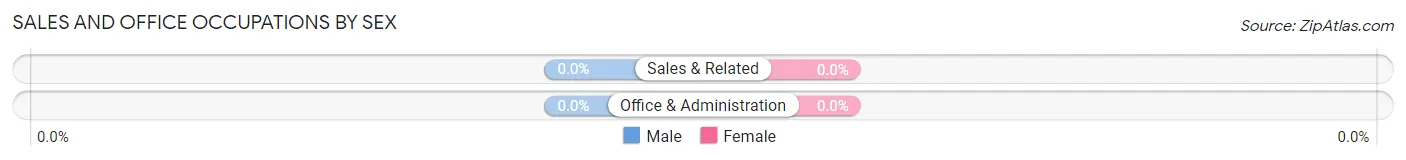
| Occupation | Male | Female |
| Sales & Related | 0 (0.0%) | 0 (0.0%) |
| Office & Administration | 0 (0.0%) | 0 (0.0%) |
| Total (Category) | 0 (0.0%) | 0 (0.0%) |
| Total (Overall) | 48 (54.5%) | 40 (45.5%) |
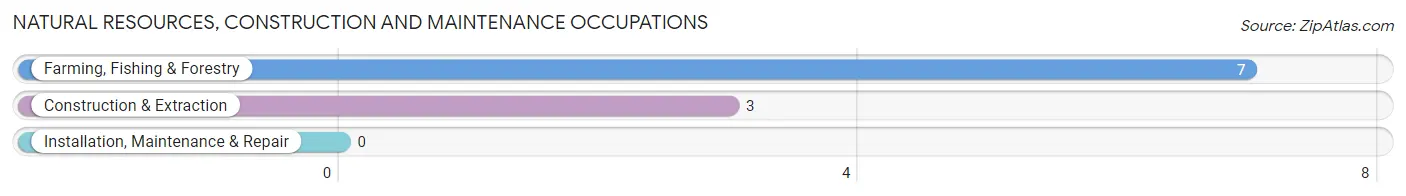
Natural Resources, Construction and Maintenance Occupations
The most common Natural Resources, Construction and Maintenance occupations in Trowbridge are Farming, Fishing & Forestry (7 | 8.0%), and Construction & Extraction (3 | 3.4%).
Natural Resources, Construction and Maintenance Occupations by Sex
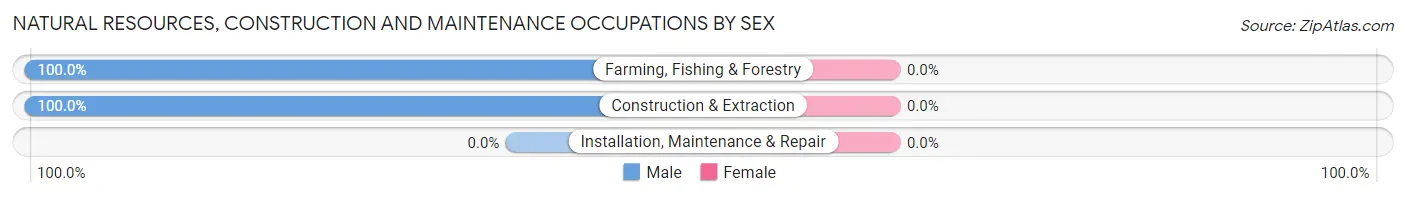
| Occupation | Male | Female |
| Farming, Fishing & Forestry | 7 (100.0%) | 0 (0.0%) |
| Construction & Extraction | 3 (100.0%) | 0 (0.0%) |
| Installation, Maintenance & Repair | 0 (0.0%) | 0 (0.0%) |
| Total (Category) | 10 (100.0%) | 0 (0.0%) |
| Total (Overall) | 48 (54.5%) | 40 (45.5%) |
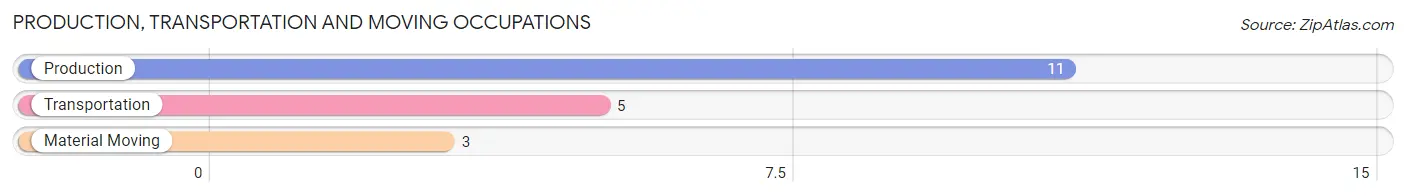
Production, Transportation and Moving Occupations
The most common Production, Transportation and Moving occupations in Trowbridge are Production (11 | 12.5%), Transportation (5 | 5.7%), and Material Moving (3 | 3.4%).
Production, Transportation and Moving Occupations by Sex
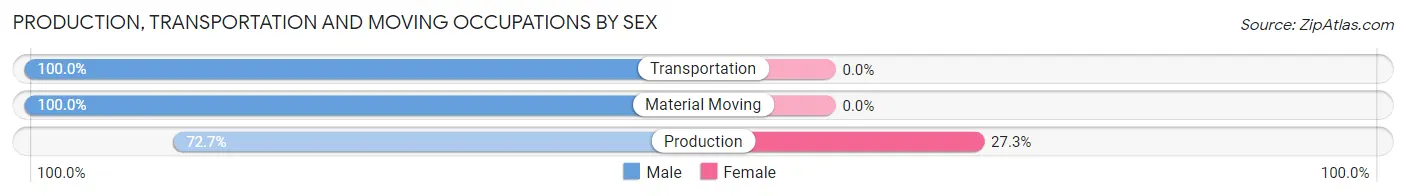
| Occupation | Male | Female |
| Production | 8 (72.7%) | 3 (27.3%) |
| Transportation | 5 (100.0%) | 0 (0.0%) |
| Material Moving | 3 (100.0%) | 0 (0.0%) |
| Total (Category) | 16 (84.2%) | 3 (15.8%) |
| Total (Overall) | 48 (54.5%) | 40 (45.5%) |
Employment Industries by Sex in Trowbridge
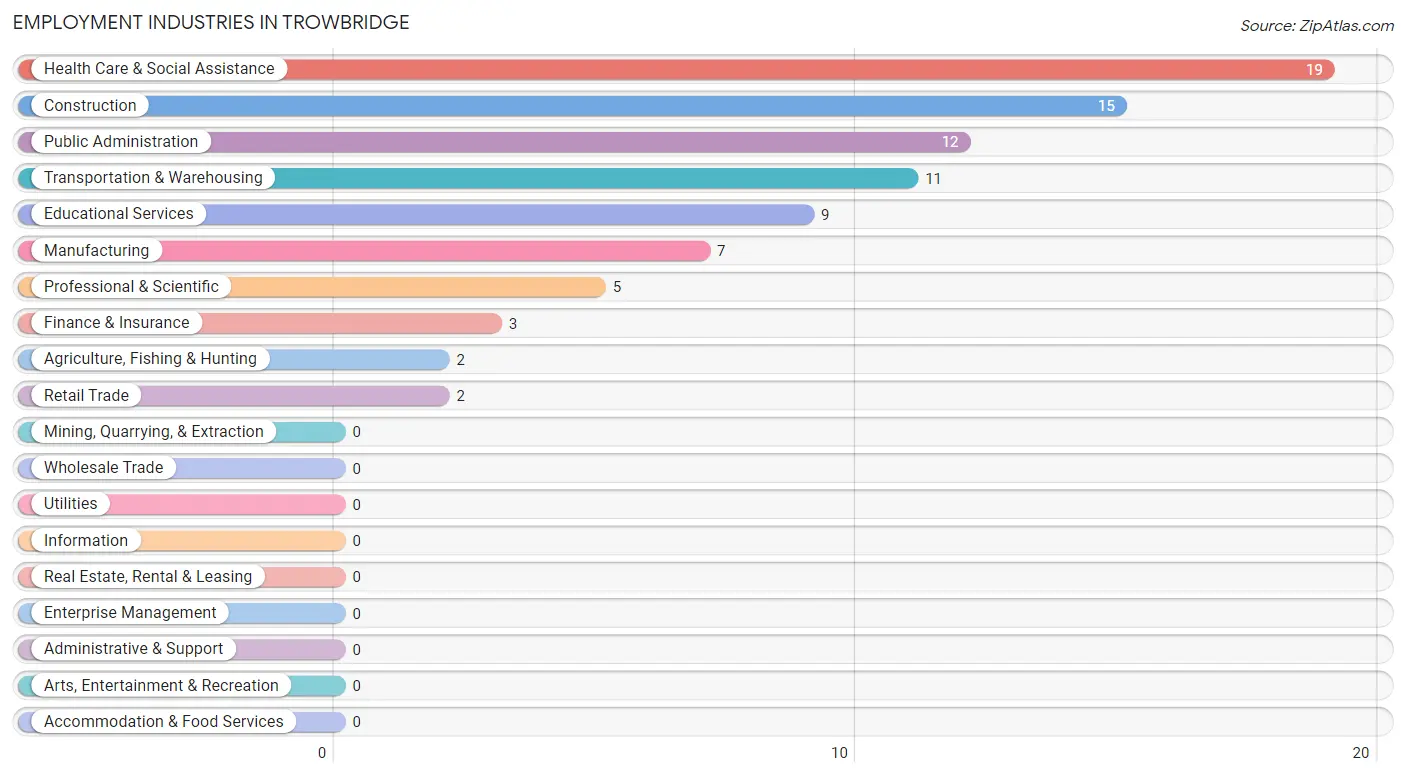
Employment Industries in Trowbridge
The major employment industries in Trowbridge include Health Care & Social Assistance (19 | 21.6%), Construction (15 | 17.1%), Public Administration (12 | 13.6%), Transportation & Warehousing (11 | 12.5%), and Educational Services (9 | 10.2%).
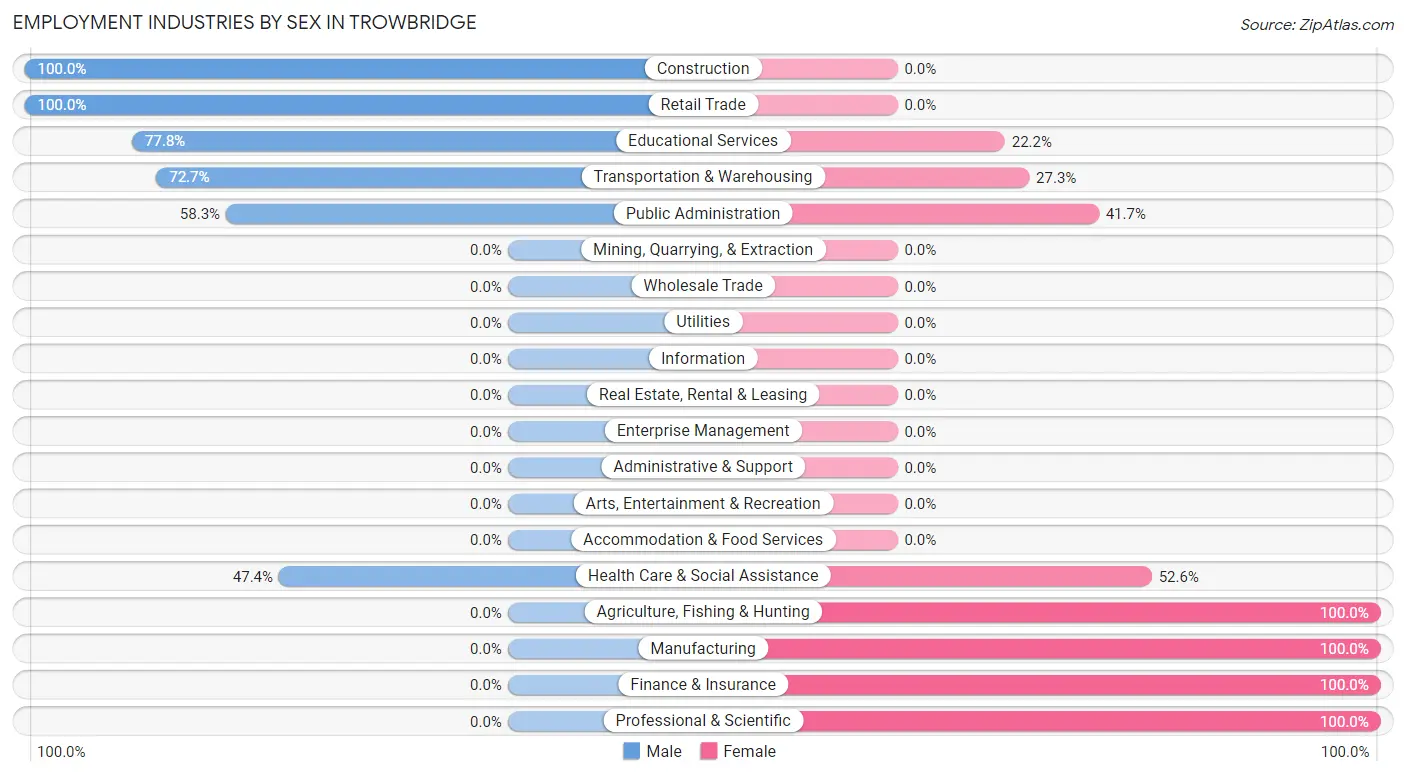
Employment Industries by Sex in Trowbridge
The Trowbridge industries that see more men than women are Construction (100.0%), Retail Trade (100.0%), and Educational Services (77.8%), whereas the industries that tend to have a higher number of women are Agriculture, Fishing & Hunting (100.0%), Manufacturing (100.0%), and Finance & Insurance (100.0%).
| Industry | Male | Female |
| Agriculture, Fishing & Hunting | 0 (0.0%) | 2 (100.0%) |
| Mining, Quarrying, & Extraction | 0 (0.0%) | 0 (0.0%) |
| Construction | 15 (100.0%) | 0 (0.0%) |
| Manufacturing | 0 (0.0%) | 7 (100.0%) |
| Wholesale Trade | 0 (0.0%) | 0 (0.0%) |
| Retail Trade | 2 (100.0%) | 0 (0.0%) |
| Transportation & Warehousing | 8 (72.7%) | 3 (27.3%) |
| Utilities | 0 (0.0%) | 0 (0.0%) |
| Information | 0 (0.0%) | 0 (0.0%) |
| Finance & Insurance | 0 (0.0%) | 3 (100.0%) |
| Real Estate, Rental & Leasing | 0 (0.0%) | 0 (0.0%) |
| Professional & Scientific | 0 (0.0%) | 5 (100.0%) |
| Enterprise Management | 0 (0.0%) | 0 (0.0%) |
| Administrative & Support | 0 (0.0%) | 0 (0.0%) |
| Educational Services | 7 (77.8%) | 2 (22.2%) |
| Health Care & Social Assistance | 9 (47.4%) | 10 (52.6%) |
| Arts, Entertainment & Recreation | 0 (0.0%) | 0 (0.0%) |
| Accommodation & Food Services | 0 (0.0%) | 0 (0.0%) |
| Public Administration | 7 (58.3%) | 5 (41.7%) |
| Total | 48 (54.5%) | 40 (45.5%) |
Education in Trowbridge
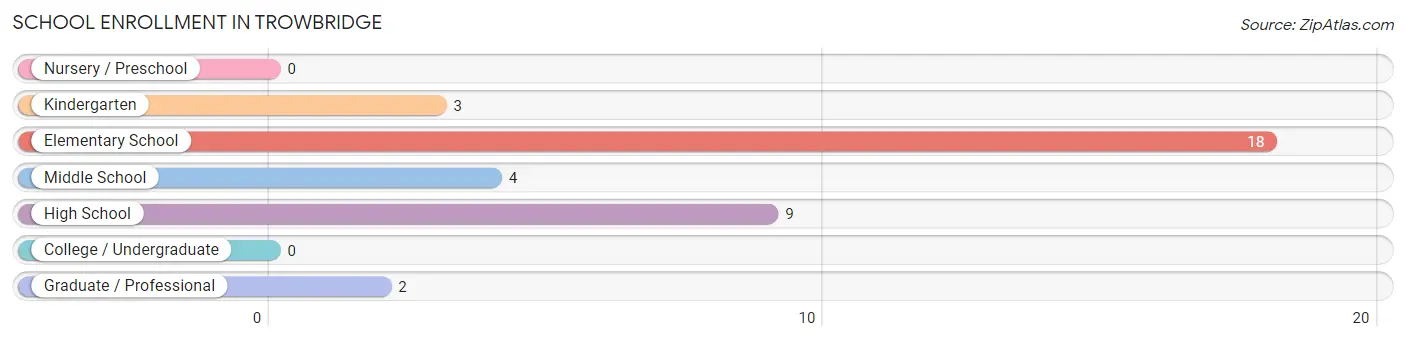
School Enrollment in Trowbridge
The most common levels of schooling among the 36 students in Trowbridge are elementary school (18 | 50.0%), high school (9 | 25.0%), and middle school (4 | 11.1%).
| School Level | # Students | % Students |
| Nursery / Preschool | 0 | 0.0% |
| Kindergarten | 3 | 8.3% |
| Elementary School | 18 | 50.0% |
| Middle School | 4 | 11.1% |
| High School | 9 | 25.0% |
| College / Undergraduate | 0 | 0.0% |
| Graduate / Professional | 2 | 5.6% |
| Total | 36 | 100.0% |
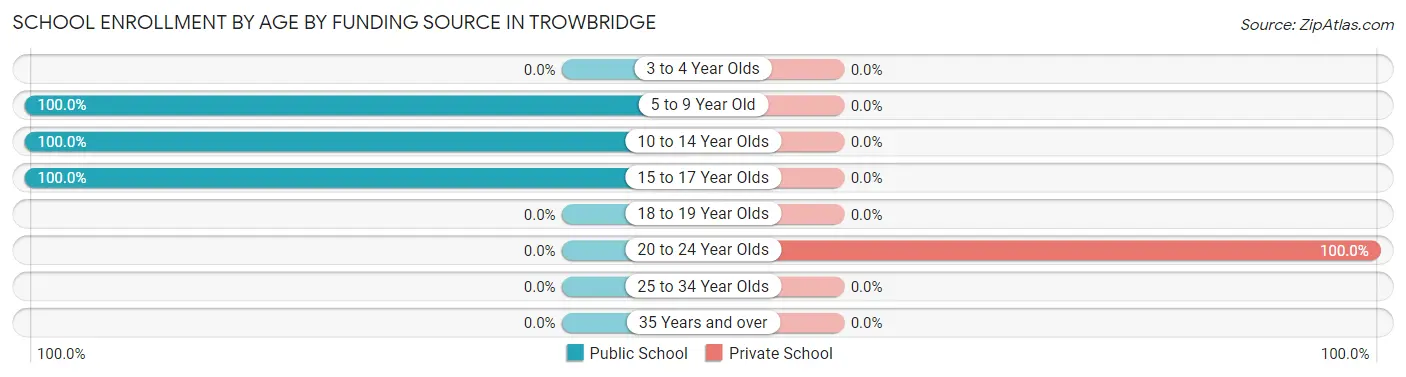
School Enrollment by Age by Funding Source in Trowbridge
Out of a total of 36 students who are enrolled in schools in Trowbridge, 2 (5.6%) attend a private institution, while the remaining 34 (94.4%) are enrolled in public schools. The age group of 20 to 24 year olds has the highest likelihood of being enrolled in private schools, with 2 (100.0% in the age bracket) enrolled. Conversely, the age group of 5 to 9 year old has the lowest likelihood of being enrolled in a private school, with 21 (100.0% in the age bracket) attending a public institution.
| Age Bracket | Public School | Private School |
| 3 to 4 Year Olds | 0 (0.0%) | 0 (0.0%) |
| 5 to 9 Year Old | 21 (100.0%) | 0 (0.0%) |
| 10 to 14 Year Olds | 4 (100.0%) | 0 (0.0%) |
| 15 to 17 Year Olds | 9 (100.0%) | 0 (0.0%) |
| 18 to 19 Year Olds | 0 (0.0%) | 0 (0.0%) |
| 20 to 24 Year Olds | 0 (0.0%) | 2 (100.0%) |
| 25 to 34 Year Olds | 0 (0.0%) | 0 (0.0%) |
| 35 Years and over | 0 (0.0%) | 0 (0.0%) |
| Total | 34 (94.4%) | 2 (5.6%) |
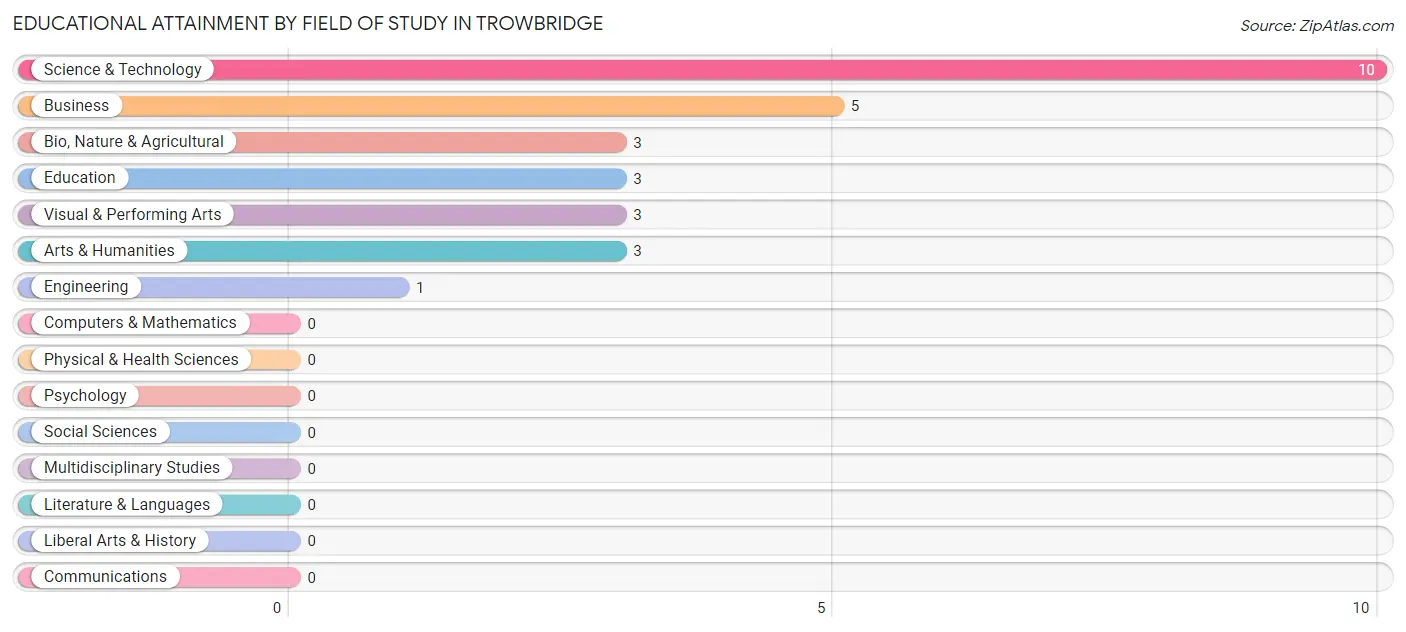
Educational Attainment by Field of Study in Trowbridge
Science & technology (10 | 35.7%), business (5 | 17.9%), bio, nature & agricultural (3 | 10.7%), education (3 | 10.7%), and visual & performing arts (3 | 10.7%) are the most common fields of study among 28 individuals in Trowbridge who have obtained a bachelor's degree or higher.
| Field of Study | # Graduates | % Graduates |
| Computers & Mathematics | 0 | 0.0% |
| Bio, Nature & Agricultural | 3 | 10.7% |
| Physical & Health Sciences | 0 | 0.0% |
| Psychology | 0 | 0.0% |
| Social Sciences | 0 | 0.0% |
| Engineering | 1 | 3.6% |
| Multidisciplinary Studies | 0 | 0.0% |
| Science & Technology | 10 | 35.7% |
| Business | 5 | 17.9% |
| Education | 3 | 10.7% |
| Literature & Languages | 0 | 0.0% |
| Liberal Arts & History | 0 | 0.0% |
| Visual & Performing Arts | 3 | 10.7% |
| Communications | 0 | 0.0% |
| Arts & Humanities | 3 | 10.7% |
| Total | 28 | 100.0% |
Transportation & Commute in Trowbridge
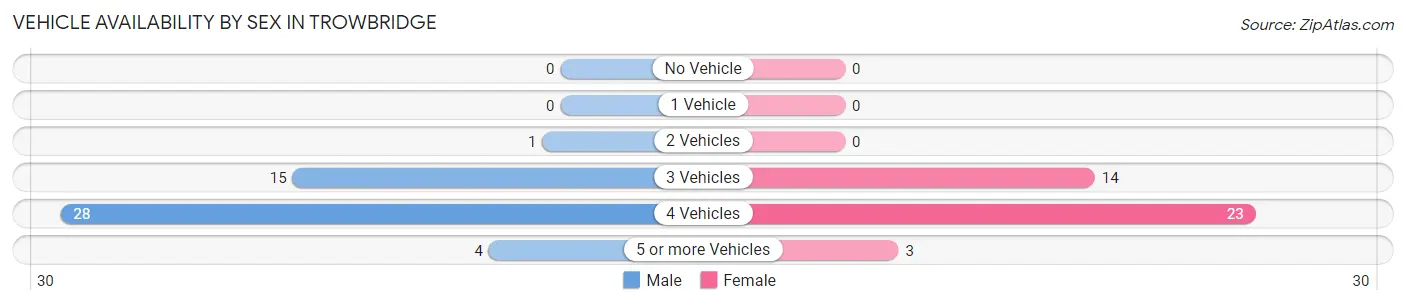
Vehicle Availability by Sex in Trowbridge
The most prevalent vehicle ownership categories in Trowbridge are males with 4 vehicles (28, accounting for 58.3%) and females with 4 vehicles (23, making up 70.0%).
| Vehicles Available | Male | Female |
| No Vehicle | 0 (0.0%) | 0 (0.0%) |
| 1 Vehicle | 0 (0.0%) | 0 (0.0%) |
| 2 Vehicles | 1 (2.1%) | 0 (0.0%) |
| 3 Vehicles | 15 (31.2%) | 14 (35.0%) |
| 4 Vehicles | 28 (58.3%) | 23 (57.5%) |
| 5 or more Vehicles | 4 (8.3%) | 3 (7.5%) |
| Total | 48 (100.0%) | 40 (100.0%) |
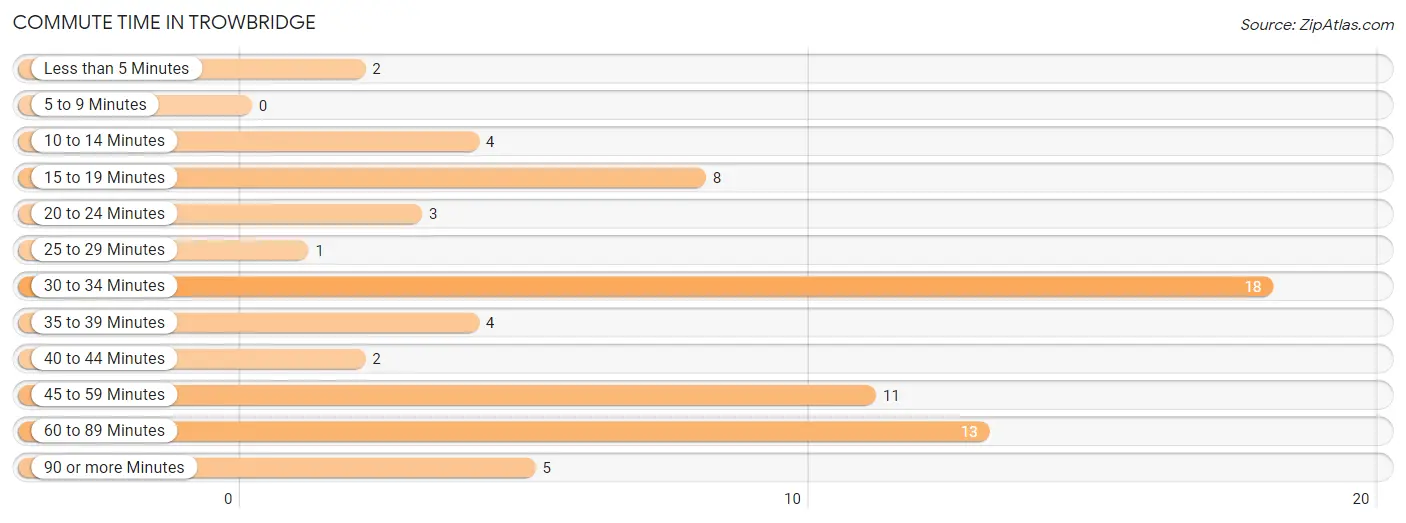
Commute Time in Trowbridge
The most frequently occuring commute durations in Trowbridge are 30 to 34 minutes (18 commuters, 25.4%), 60 to 89 minutes (13 commuters, 18.3%), and 45 to 59 minutes (11 commuters, 15.5%).
| Commute Time | # Commuters | % Commuters |
| Less than 5 Minutes | 2 | 2.8% |
| 5 to 9 Minutes | 0 | 0.0% |
| 10 to 14 Minutes | 4 | 5.6% |
| 15 to 19 Minutes | 8 | 11.3% |
| 20 to 24 Minutes | 3 | 4.2% |
| 25 to 29 Minutes | 1 | 1.4% |
| 30 to 34 Minutes | 18 | 25.4% |
| 35 to 39 Minutes | 4 | 5.6% |
| 40 to 44 Minutes | 2 | 2.8% |
| 45 to 59 Minutes | 11 | 15.5% |
| 60 to 89 Minutes | 13 | 18.3% |
| 90 or more Minutes | 5 | 7.0% |
Commute Time by Sex in Trowbridge
The most common commute times in Trowbridge are 45 to 59 minutes (11 commuters, 22.9%) for males and 60 to 89 minutes (9 commuters, 39.1%) for females.
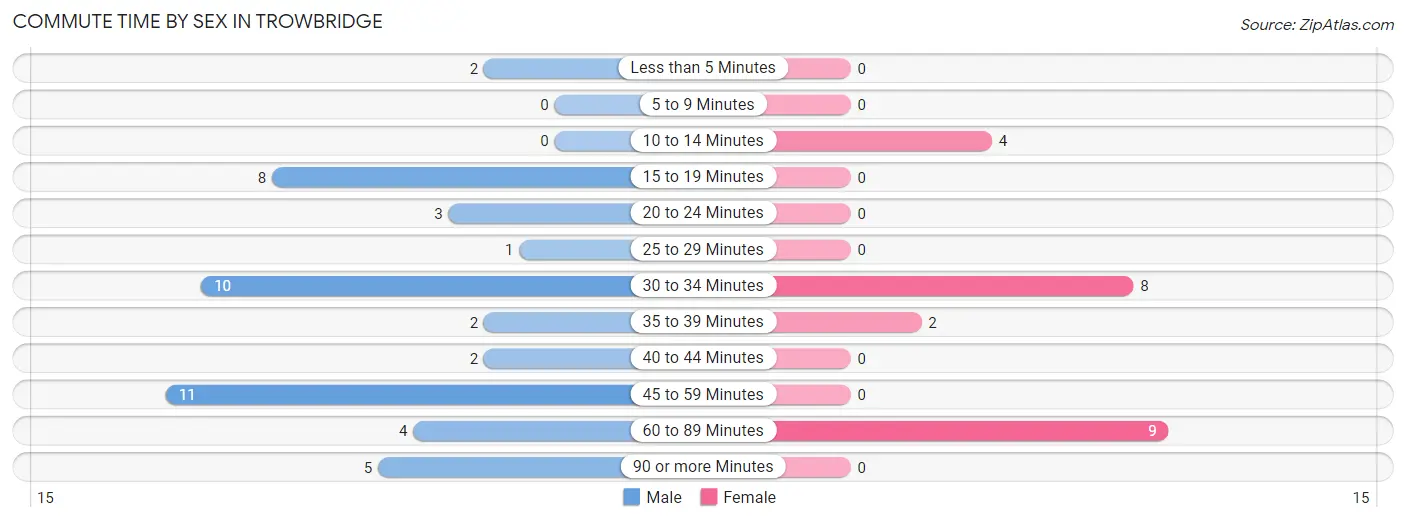
| Commute Time | Male | Female |
| Less than 5 Minutes | 2 (4.2%) | 0 (0.0%) |
| 5 to 9 Minutes | 0 (0.0%) | 0 (0.0%) |
| 10 to 14 Minutes | 0 (0.0%) | 4 (17.4%) |
| 15 to 19 Minutes | 8 (16.7%) | 0 (0.0%) |
| 20 to 24 Minutes | 3 (6.2%) | 0 (0.0%) |
| 25 to 29 Minutes | 1 (2.1%) | 0 (0.0%) |
| 30 to 34 Minutes | 10 (20.8%) | 8 (34.8%) |
| 35 to 39 Minutes | 2 (4.2%) | 2 (8.7%) |
| 40 to 44 Minutes | 2 (4.2%) | 0 (0.0%) |
| 45 to 59 Minutes | 11 (22.9%) | 0 (0.0%) |
| 60 to 89 Minutes | 4 (8.3%) | 9 (39.1%) |
| 90 or more Minutes | 5 (10.4%) | 0 (0.0%) |
Time of Departure to Work by Sex in Trowbridge
The most frequent times of departure to work in Trowbridge are 6:30 AM to 6:59 AM (15, 31.2%) for males and 6:00 AM to 6:29 AM (8, 34.8%) for females.
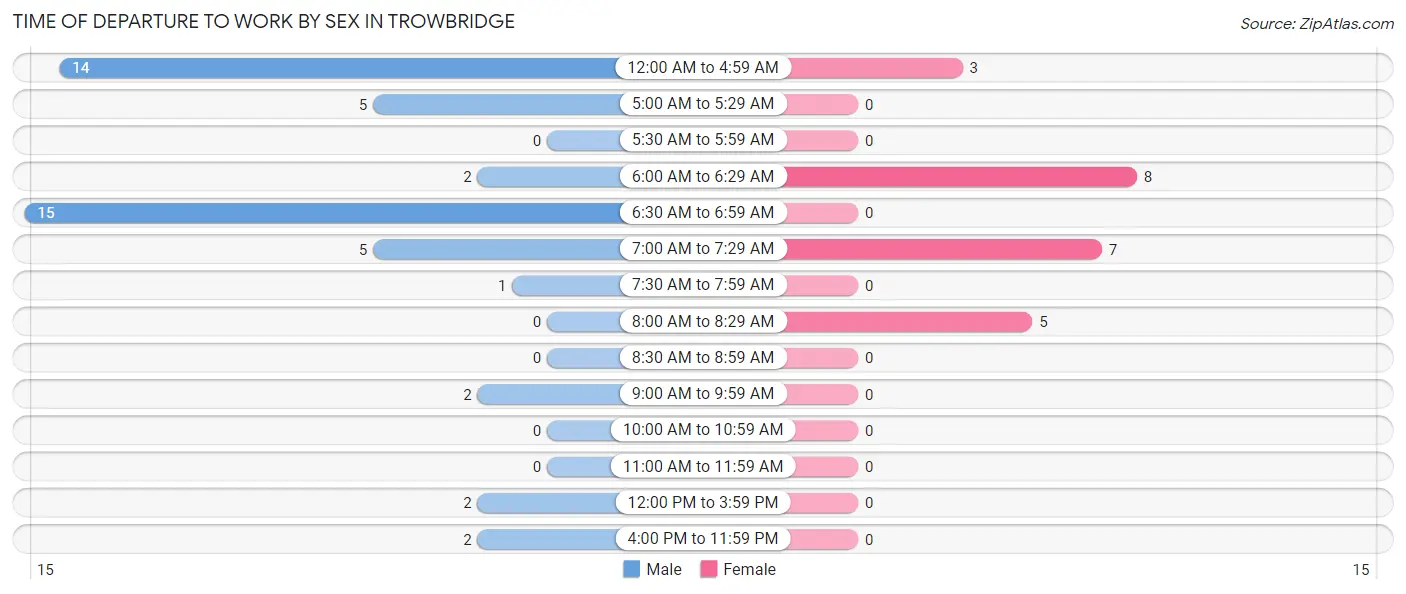
| Time of Departure | Male | Female |
| 12:00 AM to 4:59 AM | 14 (29.2%) | 3 (13.0%) |
| 5:00 AM to 5:29 AM | 5 (10.4%) | 0 (0.0%) |
| 5:30 AM to 5:59 AM | 0 (0.0%) | 0 (0.0%) |
| 6:00 AM to 6:29 AM | 2 (4.2%) | 8 (34.8%) |
| 6:30 AM to 6:59 AM | 15 (31.2%) | 0 (0.0%) |
| 7:00 AM to 7:29 AM | 5 (10.4%) | 7 (30.4%) |
| 7:30 AM to 7:59 AM | 1 (2.1%) | 0 (0.0%) |
| 8:00 AM to 8:29 AM | 0 (0.0%) | 5 (21.7%) |
| 8:30 AM to 8:59 AM | 0 (0.0%) | 0 (0.0%) |
| 9:00 AM to 9:59 AM | 2 (4.2%) | 0 (0.0%) |
| 10:00 AM to 10:59 AM | 0 (0.0%) | 0 (0.0%) |
| 11:00 AM to 11:59 AM | 0 (0.0%) | 0 (0.0%) |
| 12:00 PM to 3:59 PM | 2 (4.2%) | 0 (0.0%) |
| 4:00 PM to 11:59 PM | 2 (4.2%) | 0 (0.0%) |
| Total | 48 (100.0%) | 23 (100.0%) |
Housing Occupancy in Trowbridge
Occupancy by Ownership in Trowbridge
Of the total 72 dwellings in Trowbridge, owner-occupied units account for 65 (90.3%), while renter-occupied units make up 7 (9.7%).
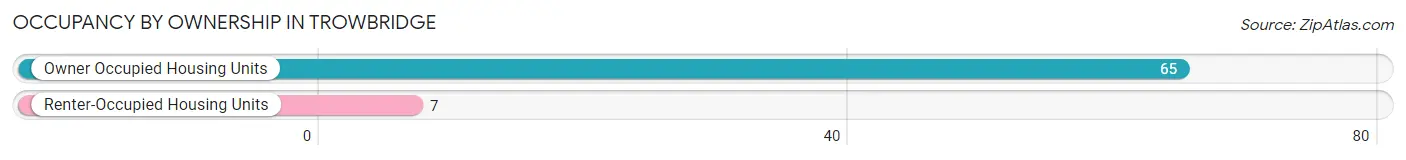
| Occupancy | # Housing Units | % Housing Units |
| Owner Occupied Housing Units | 65 | 90.3% |
| Renter-Occupied Housing Units | 7 | 9.7% |
| Total Occupied Housing Units | 72 | 100.0% |
Occupancy by Household Size in Trowbridge
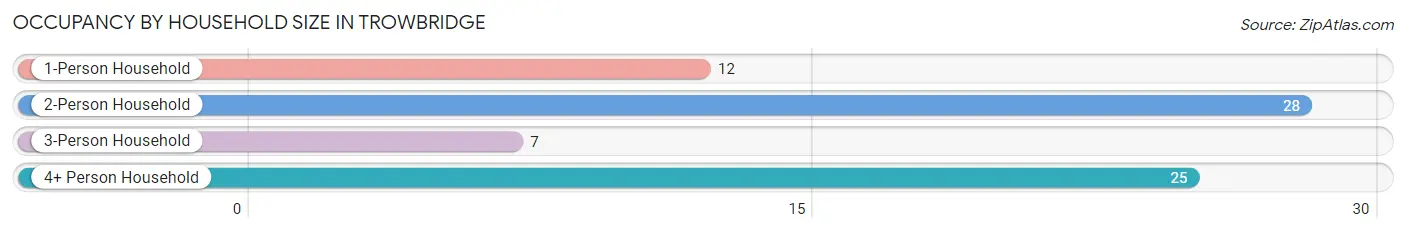
| Household Size | # Housing Units | % Housing Units |
| 1-Person Household | 12 | 16.7% |
| 2-Person Household | 28 | 38.9% |
| 3-Person Household | 7 | 9.7% |
| 4+ Person Household | 25 | 34.7% |
| Total Housing Units | 72 | 100.0% |
Occupancy by Ownership by Household Size in Trowbridge
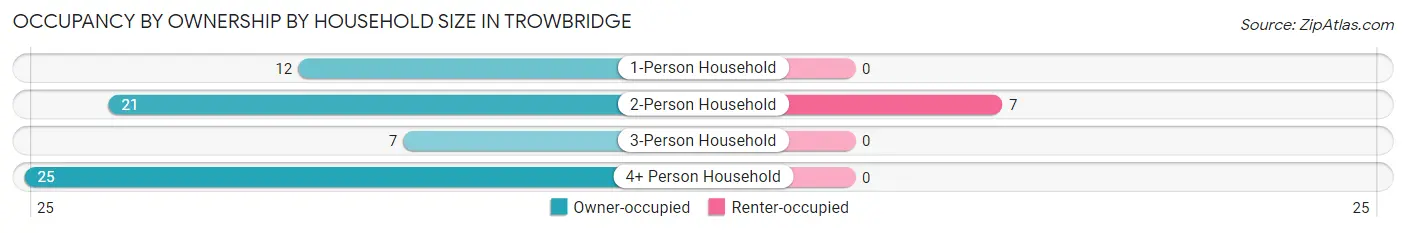
| Household Size | Owner-occupied | Renter-occupied |
| 1-Person Household | 12 (100.0%) | 0 (0.0%) |
| 2-Person Household | 21 (75.0%) | 7 (25.0%) |
| 3-Person Household | 7 (100.0%) | 0 (0.0%) |
| 4+ Person Household | 25 (100.0%) | 0 (0.0%) |
| Total Housing Units | 65 (90.3%) | 7 (9.7%) |
Occupancy by Educational Attainment in Trowbridge
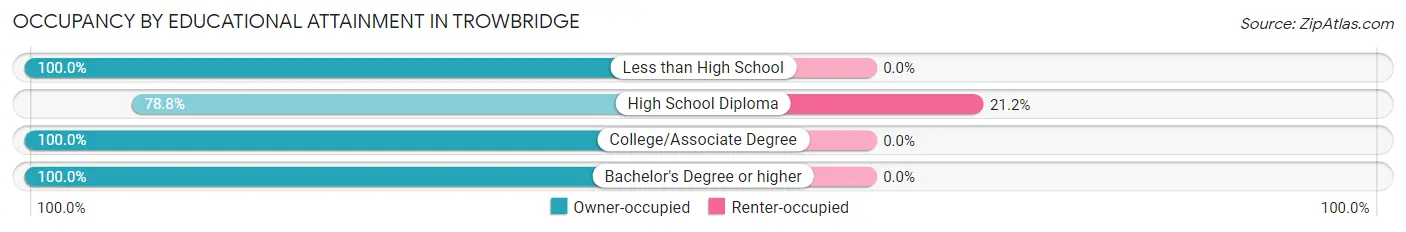
| Household Size | Owner-occupied | Renter-occupied |
| Less than High School | 2 (100.0%) | 0 (0.0%) |
| High School Diploma | 26 (78.8%) | 7 (21.2%) |
| College/Associate Degree | 21 (100.0%) | 0 (0.0%) |
| Bachelor's Degree or higher | 16 (100.0%) | 0 (0.0%) |
Occupancy by Age of Householder in Trowbridge
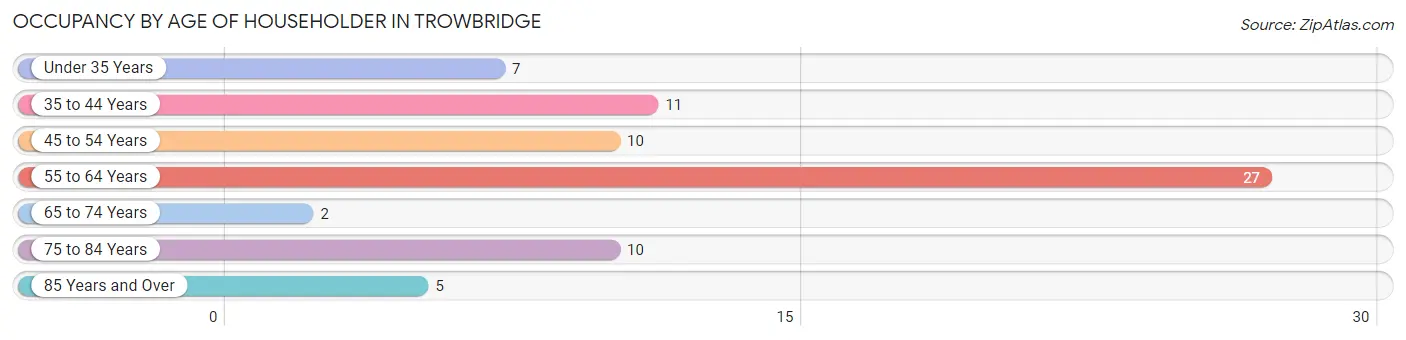
| Age Bracket | # Households | % Households |
| Under 35 Years | 7 | 9.7% |
| 35 to 44 Years | 11 | 15.3% |
| 45 to 54 Years | 10 | 13.9% |
| 55 to 64 Years | 27 | 37.5% |
| 65 to 74 Years | 2 | 2.8% |
| 75 to 84 Years | 10 | 13.9% |
| 85 Years and Over | 5 | 6.9% |
| Total | 72 | 100.0% |
Housing Finances in Trowbridge
Median Income by Occupancy in Trowbridge
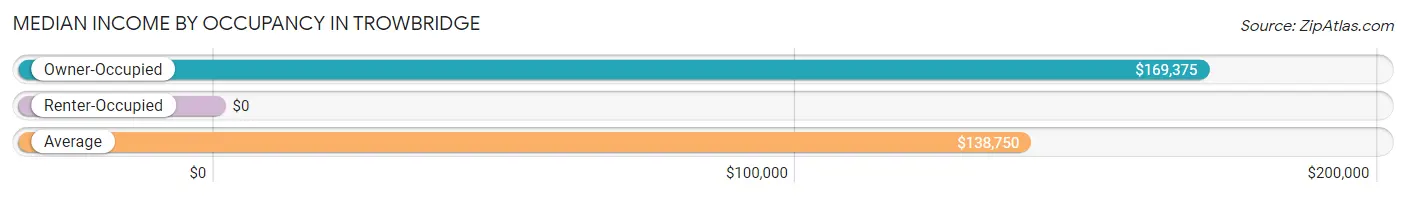
| Occupancy Type | # Households | Median Income |
| Owner-Occupied | 65 (90.3%) | $169,375 |
| Renter-Occupied | 7 (9.7%) | $0 |
| Average | 72 (100.0%) | $138,750 |
Occupancy by Householder Income Bracket in Trowbridge
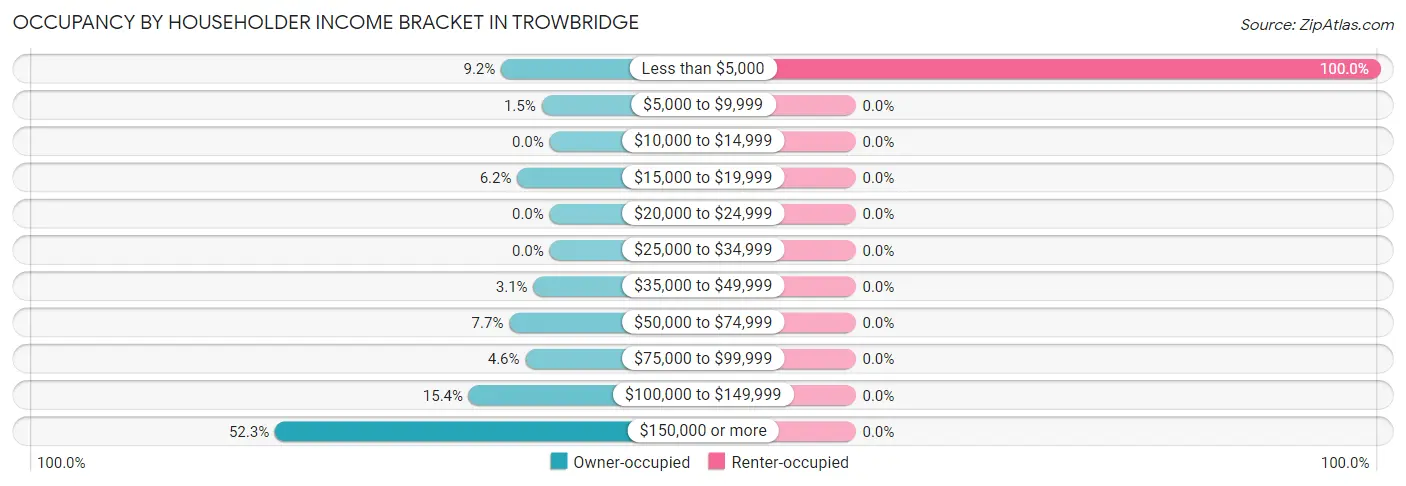
| Income Bracket | Owner-occupied | Renter-occupied |
| Less than $5,000 | 6 (9.2%) | 7 (100.0%) |
| $5,000 to $9,999 | 1 (1.5%) | 0 (0.0%) |
| $10,000 to $14,999 | 0 (0.0%) | 0 (0.0%) |
| $15,000 to $19,999 | 4 (6.1%) | 0 (0.0%) |
| $20,000 to $24,999 | 0 (0.0%) | 0 (0.0%) |
| $25,000 to $34,999 | 0 (0.0%) | 0 (0.0%) |
| $35,000 to $49,999 | 2 (3.1%) | 0 (0.0%) |
| $50,000 to $74,999 | 5 (7.7%) | 0 (0.0%) |
| $75,000 to $99,999 | 3 (4.6%) | 0 (0.0%) |
| $100,000 to $149,999 | 10 (15.4%) | 0 (0.0%) |
| $150,000 or more | 34 (52.3%) | 0 (0.0%) |
| Total | 65 (100.0%) | 7 (100.0%) |
Monthly Housing Cost Tiers in Trowbridge
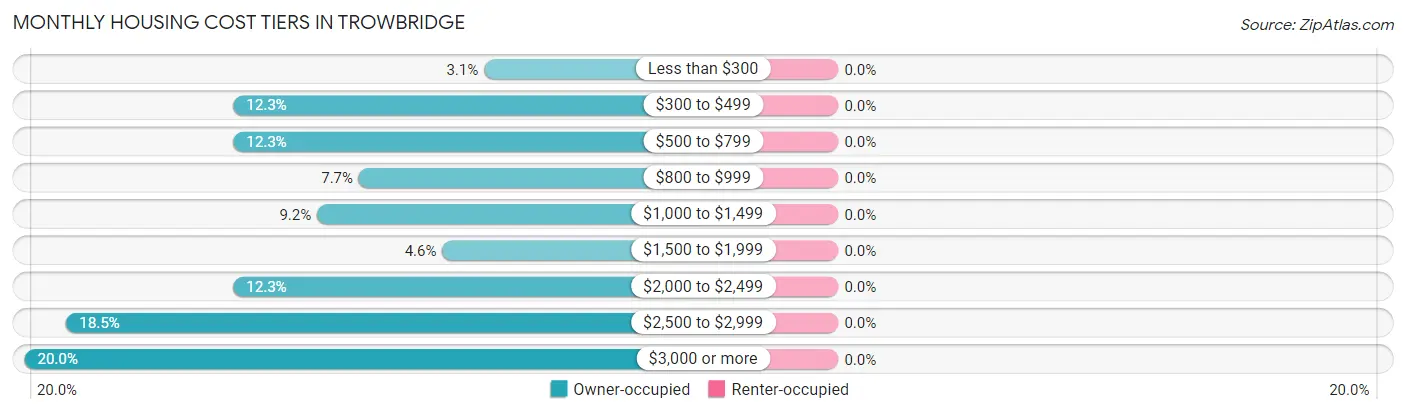
| Monthly Cost | Owner-occupied | Renter-occupied |
| Less than $300 | 2 (3.1%) | 0 (0.0%) |
| $300 to $499 | 8 (12.3%) | 0 (0.0%) |
| $500 to $799 | 8 (12.3%) | 0 (0.0%) |
| $800 to $999 | 5 (7.7%) | 0 (0.0%) |
| $1,000 to $1,499 | 6 (9.2%) | 0 (0.0%) |
| $1,500 to $1,999 | 3 (4.6%) | 0 (0.0%) |
| $2,000 to $2,499 | 8 (12.3%) | 0 (0.0%) |
| $2,500 to $2,999 | 12 (18.5%) | 0 (0.0%) |
| $3,000 or more | 13 (20.0%) | 0 (0.0%) |
| Total | 65 (100.0%) | 7 (100.0%) |
Physical Housing Characteristics in Trowbridge
Housing Structures in Trowbridge
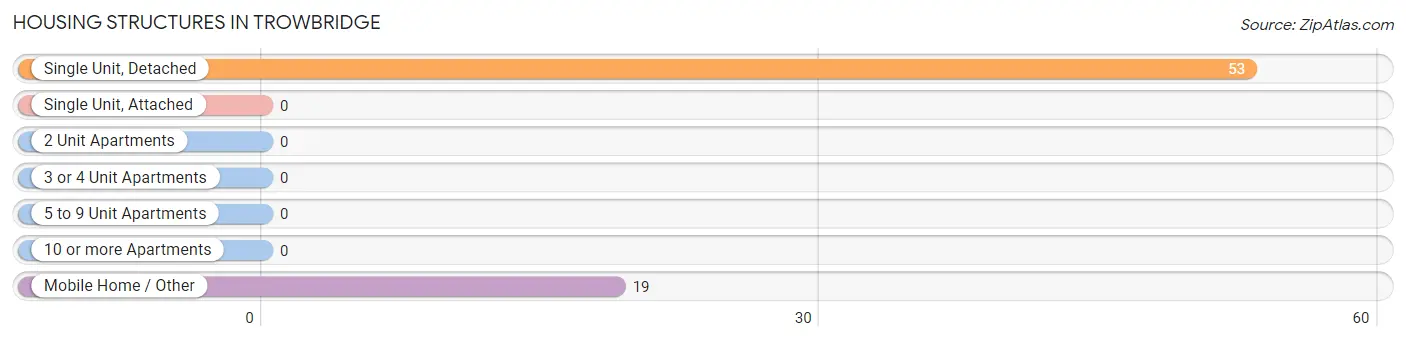
| Structure Type | # Housing Units | % Housing Units |
| Single Unit, Detached | 53 | 73.6% |
| Single Unit, Attached | 0 | 0.0% |
| 2 Unit Apartments | 0 | 0.0% |
| 3 or 4 Unit Apartments | 0 | 0.0% |
| 5 to 9 Unit Apartments | 0 | 0.0% |
| 10 or more Apartments | 0 | 0.0% |
| Mobile Home / Other | 19 | 26.4% |
| Total | 72 | 100.0% |
Housing Structures by Occupancy in Trowbridge
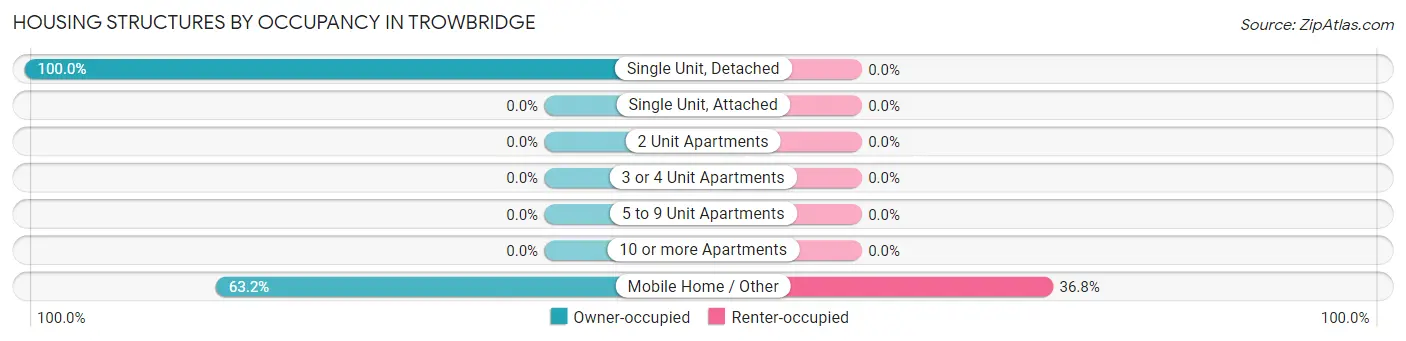
| Structure Type | Owner-occupied | Renter-occupied |
| Single Unit, Detached | 53 (100.0%) | 0 (0.0%) |
| Single Unit, Attached | 0 (0.0%) | 0 (0.0%) |
| 2 Unit Apartments | 0 (0.0%) | 0 (0.0%) |
| 3 or 4 Unit Apartments | 0 (0.0%) | 0 (0.0%) |
| 5 to 9 Unit Apartments | 0 (0.0%) | 0 (0.0%) |
| 10 or more Apartments | 0 (0.0%) | 0 (0.0%) |
| Mobile Home / Other | 12 (63.2%) | 7 (36.8%) |
| Total | 65 (90.3%) | 7 (9.7%) |
Housing Structures by Number of Rooms in Trowbridge
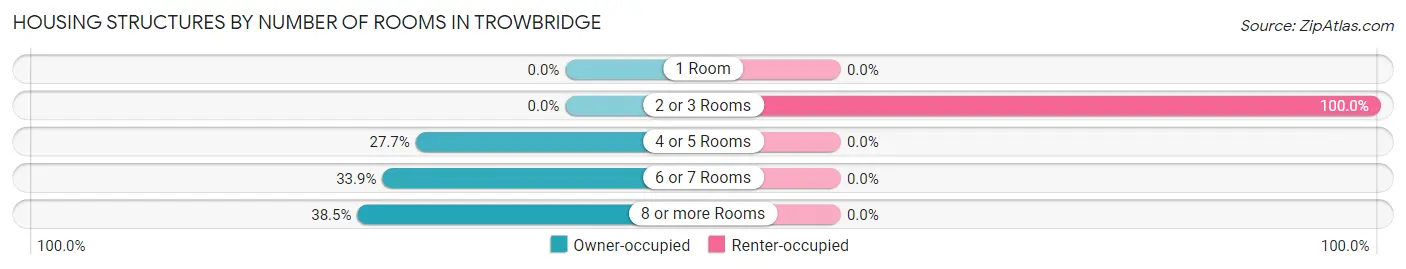
| Number of Rooms | Owner-occupied | Renter-occupied |
| 1 Room | 0 (0.0%) | 0 (0.0%) |
| 2 or 3 Rooms | 0 (0.0%) | 7 (100.0%) |
| 4 or 5 Rooms | 18 (27.7%) | 0 (0.0%) |
| 6 or 7 Rooms | 22 (33.9%) | 0 (0.0%) |
| 8 or more Rooms | 25 (38.5%) | 0 (0.0%) |
| Total | 65 (100.0%) | 7 (100.0%) |
Housing Structure by Heating Type in Trowbridge
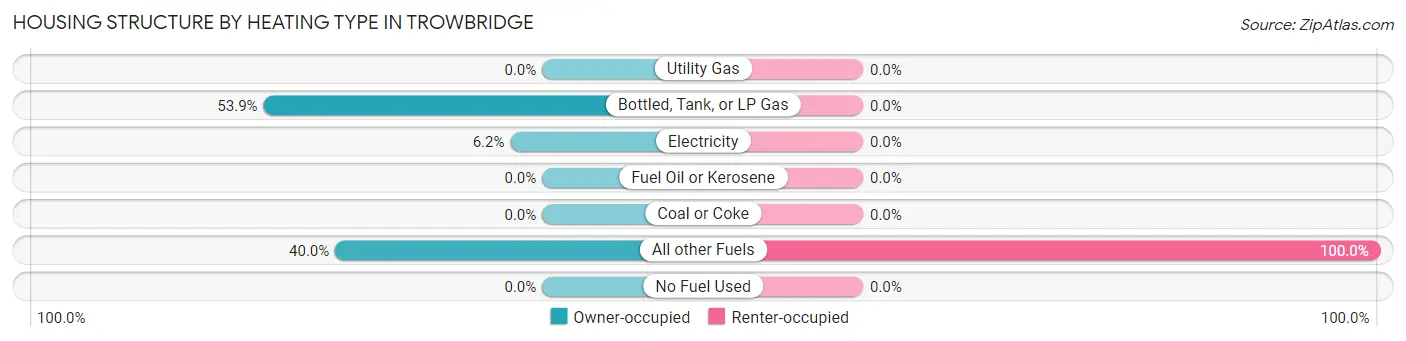
| Heating Type | Owner-occupied | Renter-occupied |
| Utility Gas | 0 (0.0%) | 0 (0.0%) |
| Bottled, Tank, or LP Gas | 35 (53.8%) | 0 (0.0%) |
| Electricity | 4 (6.1%) | 0 (0.0%) |
| Fuel Oil or Kerosene | 0 (0.0%) | 0 (0.0%) |
| Coal or Coke | 0 (0.0%) | 0 (0.0%) |
| All other Fuels | 26 (40.0%) | 7 (100.0%) |
| No Fuel Used | 0 (0.0%) | 0 (0.0%) |
| Total | 65 (100.0%) | 7 (100.0%) |
Household Vehicle Usage in Trowbridge
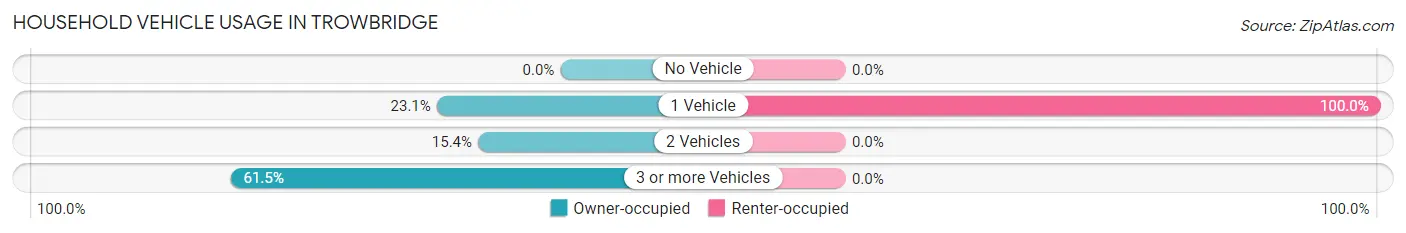
| Vehicles per Household | Owner-occupied | Renter-occupied |
| No Vehicle | 0 (0.0%) | 0 (0.0%) |
| 1 Vehicle | 15 (23.1%) | 7 (100.0%) |
| 2 Vehicles | 10 (15.4%) | 0 (0.0%) |
| 3 or more Vehicles | 40 (61.5%) | 0 (0.0%) |
| Total | 65 (100.0%) | 7 (100.0%) |
Real Estate & Mortgages in Trowbridge
Real Estate and Mortgage Overview in Trowbridge
| Characteristic | Without Mortgage | With Mortgage |
| Housing Units | 19 | 46 |
| Median Property Value | $237,500 | $642,900 |
| Median Household Income | $63,750 | $32 |
| Monthly Housing Costs | $494 | $13 |
| Real Estate Taxes | $1,083 | $0 |
Property Value by Mortgage Status in Trowbridge
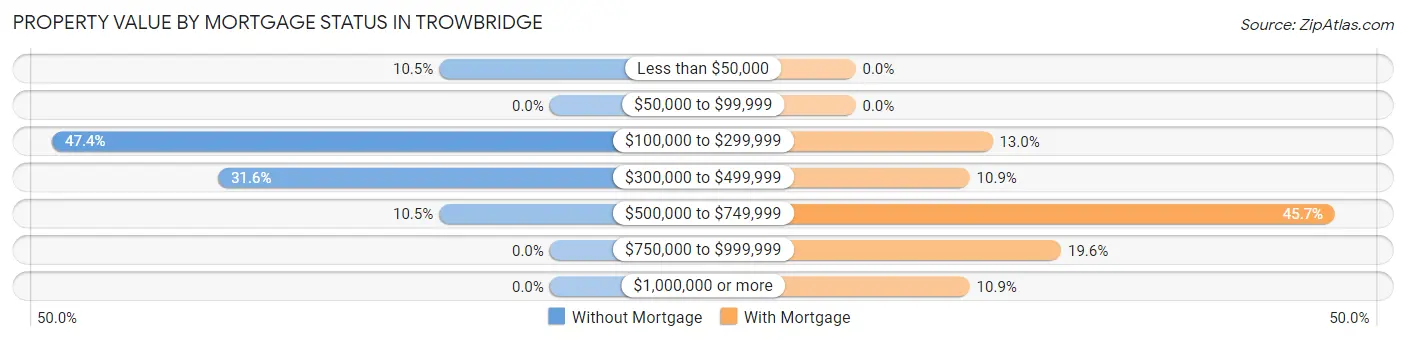
| Property Value | Without Mortgage | With Mortgage |
| Less than $50,000 | 2 (10.5%) | 0 (0.0%) |
| $50,000 to $99,999 | 0 (0.0%) | 0 (0.0%) |
| $100,000 to $299,999 | 9 (47.4%) | 6 (13.0%) |
| $300,000 to $499,999 | 6 (31.6%) | 5 (10.9%) |
| $500,000 to $749,999 | 2 (10.5%) | 21 (45.7%) |
| $750,000 to $999,999 | 0 (0.0%) | 9 (19.6%) |
| $1,000,000 or more | 0 (0.0%) | 5 (10.9%) |
| Total | 19 (100.0%) | 46 (100.0%) |
Household Income by Mortgage Status in Trowbridge
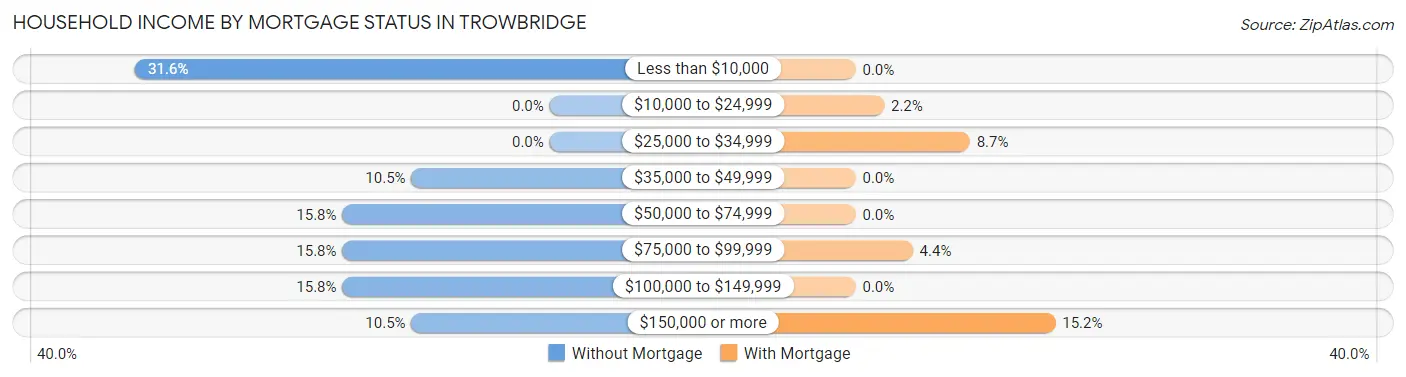
| Household Income | Without Mortgage | With Mortgage |
| Less than $10,000 | 6 (31.6%) | 0 (0.0%) |
| $10,000 to $24,999 | 0 (0.0%) | 1 (2.2%) |
| $25,000 to $34,999 | 0 (0.0%) | 4 (8.7%) |
| $35,000 to $49,999 | 2 (10.5%) | 0 (0.0%) |
| $50,000 to $74,999 | 3 (15.8%) | 0 (0.0%) |
| $75,000 to $99,999 | 3 (15.8%) | 2 (4.3%) |
| $100,000 to $149,999 | 3 (15.8%) | 0 (0.0%) |
| $150,000 or more | 2 (10.5%) | 7 (15.2%) |
| Total | 19 (100.0%) | 46 (100.0%) |
Property Value to Household Income Ratio in Trowbridge
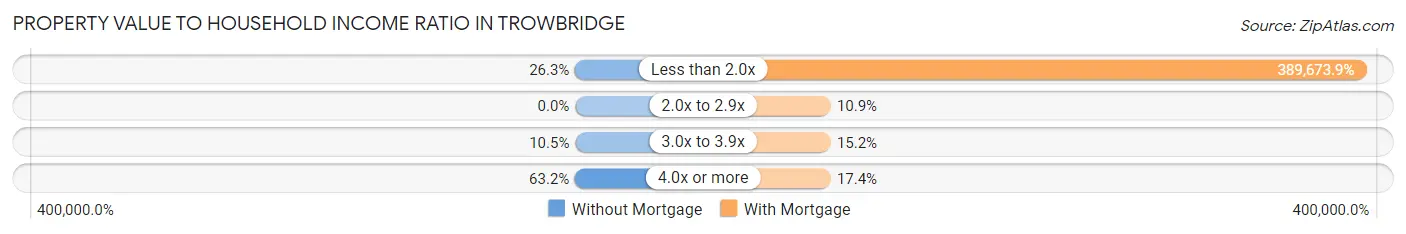
| Value-to-Income Ratio | Without Mortgage | With Mortgage |
| Less than 2.0x | 5 (26.3%) | 179,250 (389,673.9%) |
| 2.0x to 2.9x | 0 (0.0%) | 5 (10.9%) |
| 3.0x to 3.9x | 2 (10.5%) | 7 (15.2%) |
| 4.0x or more | 12 (63.2%) | 8 (17.4%) |
| Total | 19 (100.0%) | 46 (100.0%) |
Real Estate Taxes by Mortgage Status in Trowbridge
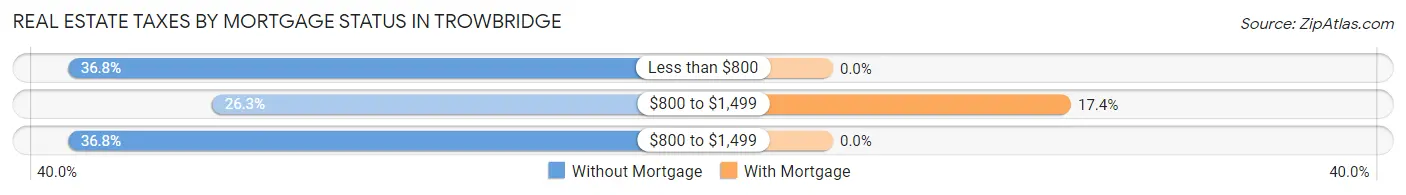
| Property Taxes | Without Mortgage | With Mortgage |
| Less than $800 | 7 (36.8%) | 0 (0.0%) |
| $800 to $1,499 | 5 (26.3%) | 8 (17.4%) |
| $800 to $1,499 | 7 (36.8%) | 0 (0.0%) |
| Total | 19 (100.0%) | 46 (100.0%) |
Health & Disability in Trowbridge
Health Insurance Coverage by Age in Trowbridge
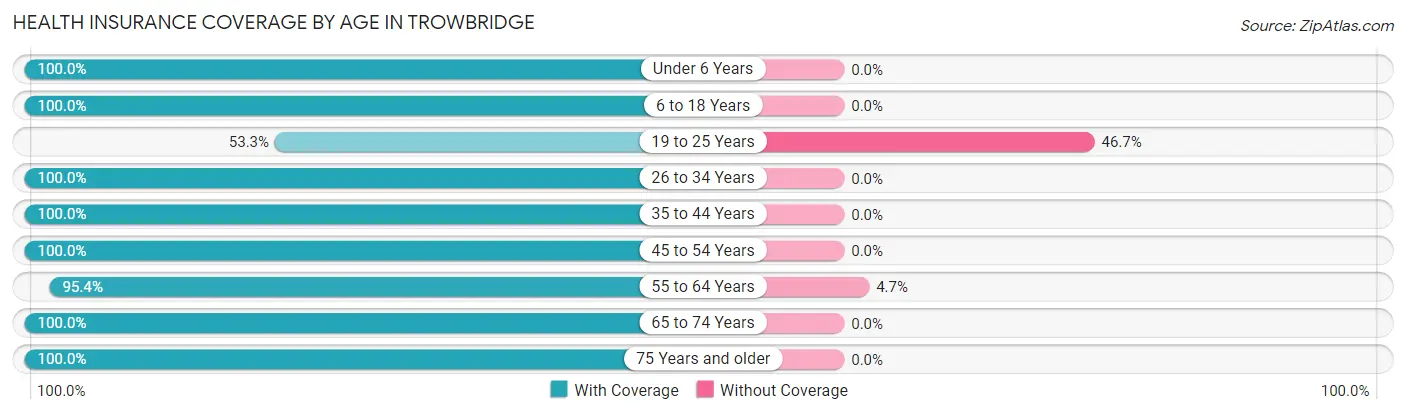
| Age Bracket | With Coverage | Without Coverage |
| Under 6 Years | 6 (100.0%) | 0 (0.0%) |
| 6 to 18 Years | 34 (100.0%) | 0 (0.0%) |
| 19 to 25 Years | 8 (53.3%) | 7 (46.7%) |
| 26 to 34 Years | 24 (100.0%) | 0 (0.0%) |
| 35 to 44 Years | 16 (100.0%) | 0 (0.0%) |
| 45 to 54 Years | 21 (100.0%) | 0 (0.0%) |
| 55 to 64 Years | 41 (95.4%) | 2 (4.6%) |
| 65 to 74 Years | 7 (100.0%) | 0 (0.0%) |
| 75 Years and older | 26 (100.0%) | 0 (0.0%) |
| Total | 183 (95.3%) | 9 (4.7%) |
Health Insurance Coverage by Citizenship Status in Trowbridge
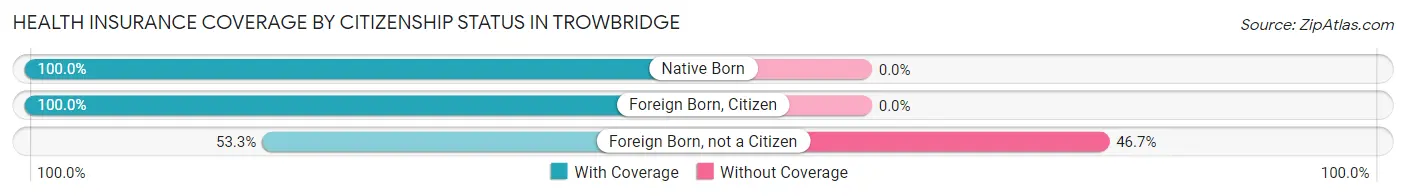
| Citizenship Status | With Coverage | Without Coverage |
| Native Born | 6 (100.0%) | 0 (0.0%) |
| Foreign Born, Citizen | 34 (100.0%) | 0 (0.0%) |
| Foreign Born, not a Citizen | 8 (53.3%) | 7 (46.7%) |
Health Insurance Coverage by Household Income in Trowbridge
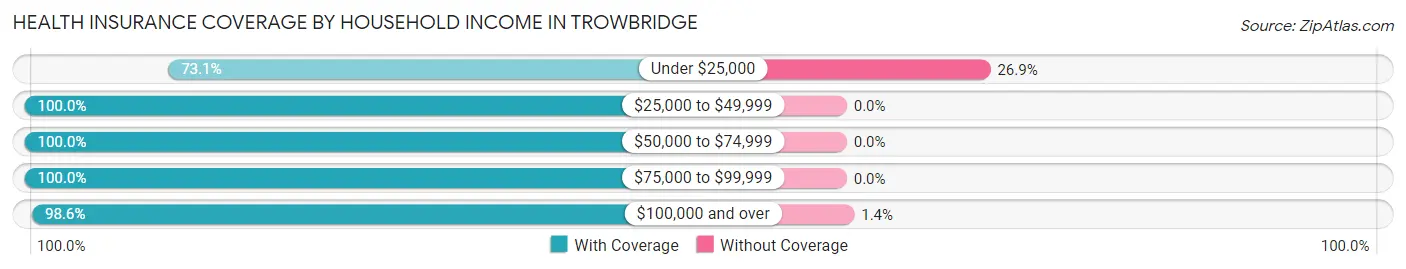
| Household Income | With Coverage | Without Coverage |
| Under $25,000 | 19 (73.1%) | 7 (26.9%) |
| $25,000 to $49,999 | 4 (100.0%) | 0 (0.0%) |
| $50,000 to $74,999 | 14 (100.0%) | 0 (0.0%) |
| $75,000 to $99,999 | 5 (100.0%) | 0 (0.0%) |
| $100,000 and over | 141 (98.6%) | 2 (1.4%) |
Public vs Private Health Insurance Coverage by Age in Trowbridge
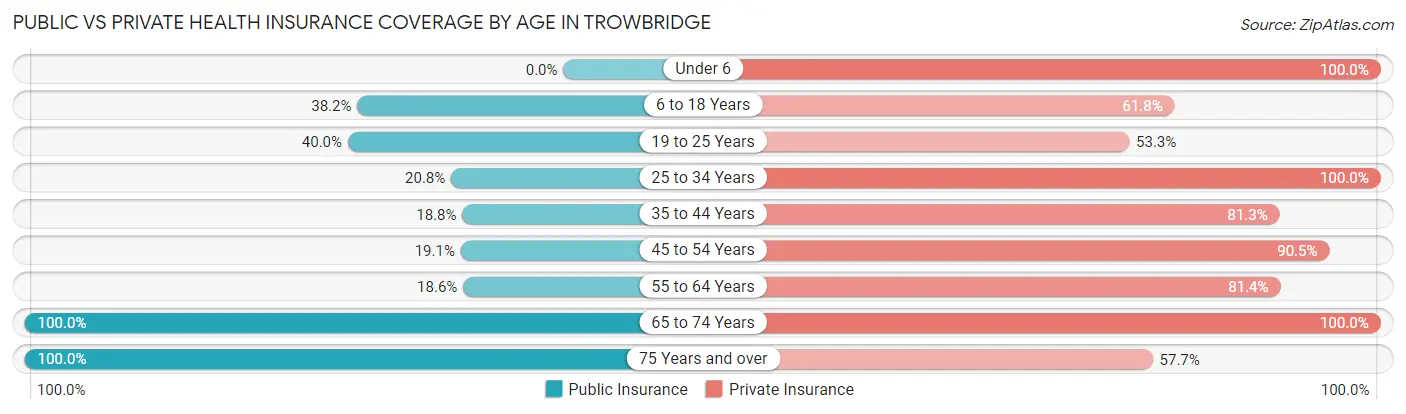
| Age Bracket | Public Insurance | Private Insurance |
| Under 6 | 0 (0.0%) | 6 (100.0%) |
| 6 to 18 Years | 13 (38.2%) | 21 (61.8%) |
| 19 to 25 Years | 6 (40.0%) | 8 (53.3%) |
| 25 to 34 Years | 5 (20.8%) | 24 (100.0%) |
| 35 to 44 Years | 3 (18.8%) | 13 (81.2%) |
| 45 to 54 Years | 4 (19.1%) | 19 (90.5%) |
| 55 to 64 Years | 8 (18.6%) | 35 (81.4%) |
| 65 to 74 Years | 7 (100.0%) | 7 (100.0%) |
| 75 Years and over | 26 (100.0%) | 15 (57.7%) |
| Total | 72 (37.5%) | 148 (77.1%) |
Disability Status by Sex by Age in Trowbridge
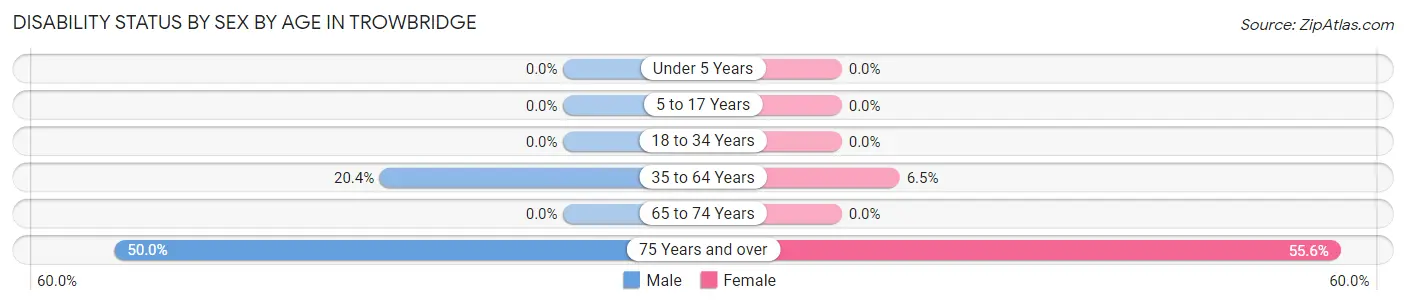
| Age Bracket | Male | Female |
| Under 5 Years | 0 (0.0%) | 0 (0.0%) |
| 5 to 17 Years | 0 (0.0%) | 0 (0.0%) |
| 18 to 34 Years | 0 (0.0%) | 0 (0.0%) |
| 35 to 64 Years | 10 (20.4%) | 2 (6.5%) |
| 65 to 74 Years | 0 (0.0%) | 0 (0.0%) |
| 75 Years and over | 4 (50.0%) | 10 (55.6%) |
Disability Class by Sex by Age in Trowbridge
Disability Class: Hearing Difficulty
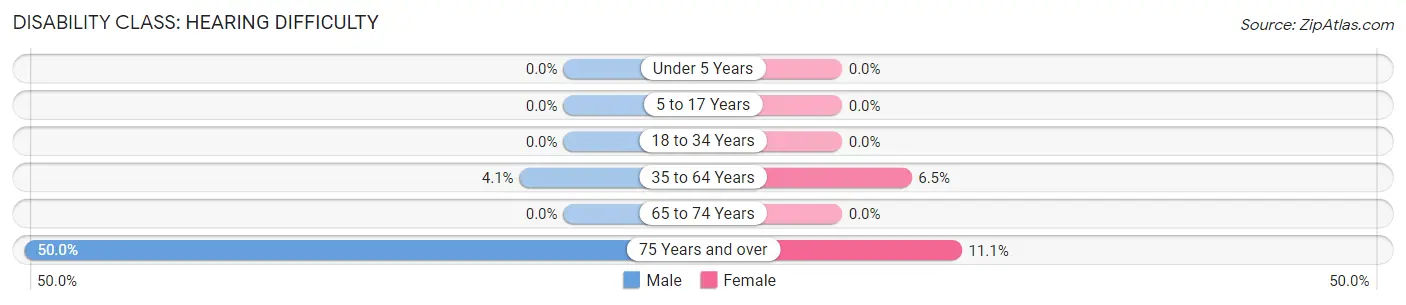
| Age Bracket | Male | Female |
| Under 5 Years | 0 (0.0%) | 0 (0.0%) |
| 5 to 17 Years | 0 (0.0%) | 0 (0.0%) |
| 18 to 34 Years | 0 (0.0%) | 0 (0.0%) |
| 35 to 64 Years | 2 (4.1%) | 2 (6.5%) |
| 65 to 74 Years | 0 (0.0%) | 0 (0.0%) |
| 75 Years and over | 4 (50.0%) | 2 (11.1%) |
Disability Class: Vision Difficulty
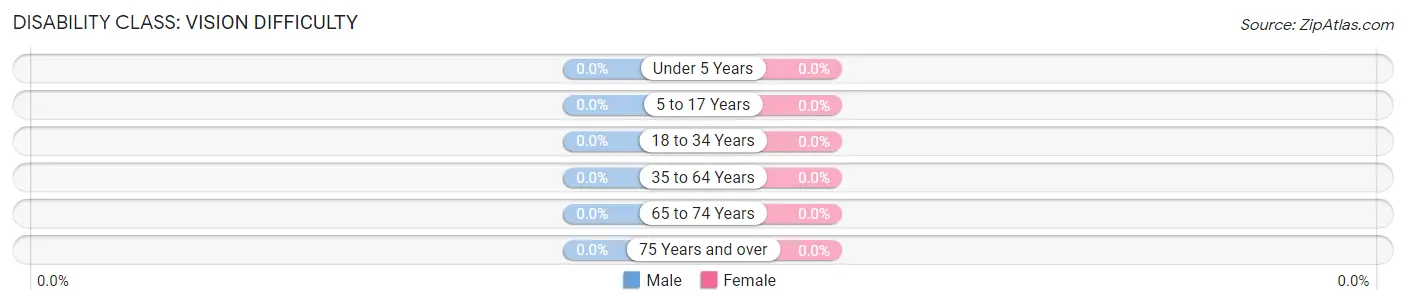
| Age Bracket | Male | Female |
| Under 5 Years | 0 (0.0%) | 0 (0.0%) |
| 5 to 17 Years | 0 (0.0%) | 0 (0.0%) |
| 18 to 34 Years | 0 (0.0%) | 0 (0.0%) |
| 35 to 64 Years | 0 (0.0%) | 0 (0.0%) |
| 65 to 74 Years | 0 (0.0%) | 0 (0.0%) |
| 75 Years and over | 0 (0.0%) | 0 (0.0%) |
Disability Class: Cognitive Difficulty
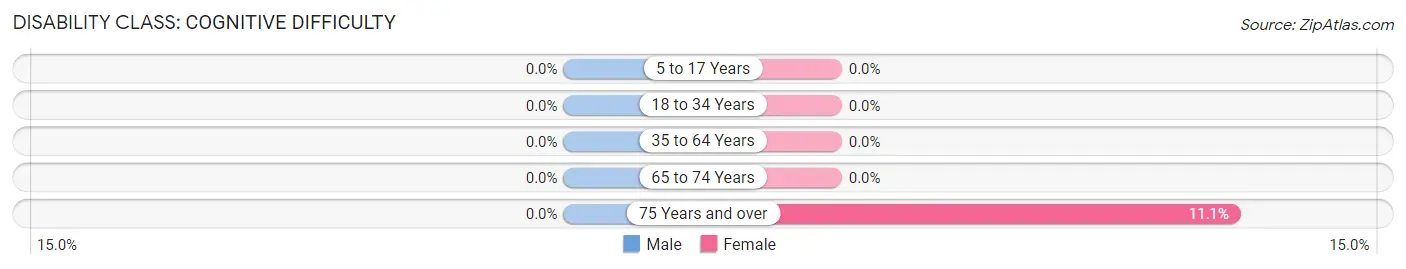
| Age Bracket | Male | Female |
| 5 to 17 Years | 0 (0.0%) | 0 (0.0%) |
| 18 to 34 Years | 0 (0.0%) | 0 (0.0%) |
| 35 to 64 Years | 0 (0.0%) | 0 (0.0%) |
| 65 to 74 Years | 0 (0.0%) | 0 (0.0%) |
| 75 Years and over | 0 (0.0%) | 2 (11.1%) |
Disability Class: Ambulatory Difficulty
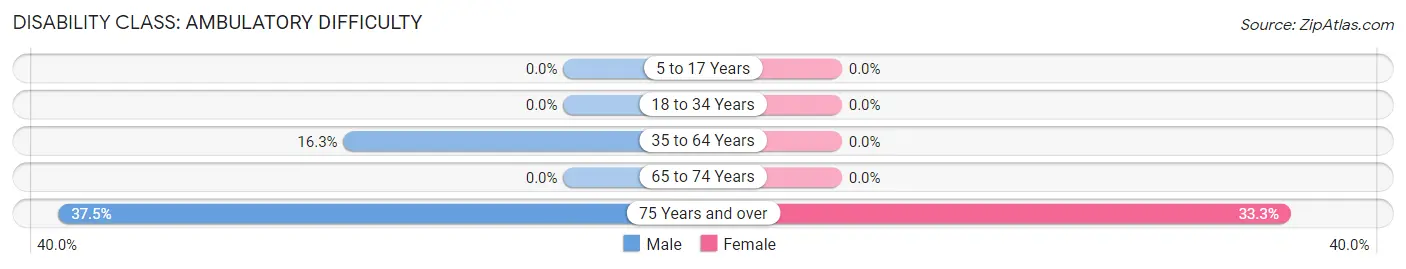
| Age Bracket | Male | Female |
| 5 to 17 Years | 0 (0.0%) | 0 (0.0%) |
| 18 to 34 Years | 0 (0.0%) | 0 (0.0%) |
| 35 to 64 Years | 8 (16.3%) | 0 (0.0%) |
| 65 to 74 Years | 0 (0.0%) | 0 (0.0%) |
| 75 Years and over | 3 (37.5%) | 6 (33.3%) |
Disability Class: Self-Care Difficulty
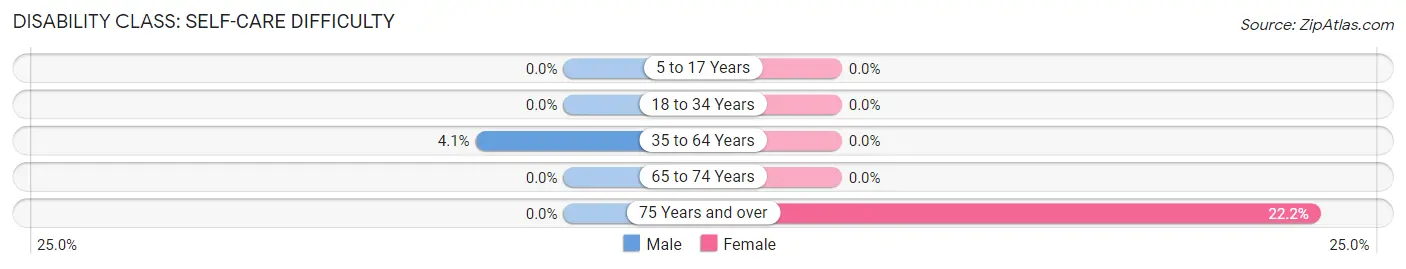
| Age Bracket | Male | Female |
| 5 to 17 Years | 0 (0.0%) | 0 (0.0%) |
| 18 to 34 Years | 0 (0.0%) | 0 (0.0%) |
| 35 to 64 Years | 2 (4.1%) | 0 (0.0%) |
| 65 to 74 Years | 0 (0.0%) | 0 (0.0%) |
| 75 Years and over | 0 (0.0%) | 4 (22.2%) |
Technology Access in Trowbridge
Computing Device Access in Trowbridge

| Device Type | # Households | % Households |
| Desktop or Laptop | 63 | 87.5% |
| Smartphone | 65 | 90.3% |
| Tablet | 49 | 68.1% |
| No Computing Device | 6 | 8.3% |
| Total | 72 | 100.0% |
Internet Access in Trowbridge
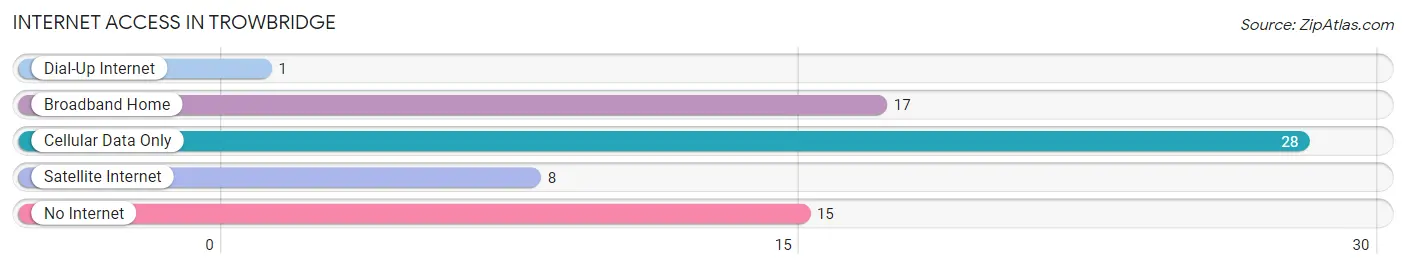
| Internet Type | # Households | % Households |
| Dial-Up Internet | 1 | 1.4% |
| Broadband Home | 17 | 23.6% |
| Cellular Data Only | 28 | 38.9% |
| Satellite Internet | 8 | 11.1% |
| No Internet | 15 | 20.8% |
| Total | 72 | 100.0% |
Trowbridge Summary
Trowbridge is a small town located in the Central Valley of California, approximately 30 miles east of Fresno. It is situated in Fresno County, and is part of the Fresno-Madera Metropolitan Statistical Area. The town has a population of approximately 1,500 people, and is known for its agricultural production and rural lifestyle.
History
Trowbridge was founded in 1891 by William Trowbridge, a rancher from the Midwest. He purchased a large tract of land in the Central Valley and began to develop it for agricultural production. The town was named after him, and it quickly became a hub for the surrounding agricultural communities.
In the early 1900s, Trowbridge was a thriving agricultural center, with a variety of crops being grown in the area. The town was also home to a number of businesses, including a general store, a blacksmith, and a hotel.
In the 1950s, the town began to decline as the agricultural industry shifted away from the Central Valley. Many of the businesses in Trowbridge closed, and the population began to dwindle.
In the late 1990s, the town began to experience a resurgence as new businesses moved into the area. The town is now home to a variety of businesses, including a winery, a brewery, and a number of restaurants.
Geography
Trowbridge is located in the Central Valley of California, approximately 30 miles east of Fresno. The town is situated in Fresno County, and is part of the Fresno-Madera Metropolitan Statistical Area.
The town is located in a flat, open area, with the Sierra Nevada Mountains to the east and the Coast Range to the west. The climate is semi-arid, with hot summers and mild winters.
Economy
Trowbridge’s economy is largely based on agriculture. The town is home to a number of farms, which produce a variety of crops, including grapes, almonds, and olives. The town is also home to a number of businesses, including a winery, a brewery, and a number of restaurants.
Demographics
As of the 2010 census, Trowbridge had a population of 1,500 people. The racial makeup of the town was 75.3% White, 0.7% African American, 0.7% Native American, 0.7% Asian, 0.3% Pacific Islander, and 21.3% from other races. The median household income was $37,500, and the median age was 37.
Conclusion
Trowbridge is a small town located in the Central Valley of California, approximately 30 miles east of Fresno. It is situated in Fresno County, and is part of the Fresno-Madera Metropolitan Statistical Area. The town has a population of approximately 1,500 people, and is known for its agricultural production and rural lifestyle. The town’s economy is largely based on agriculture, and it is home to a number of businesses, including a winery, a brewery, and a number of restaurants. The racial makeup of the town is 75.3% White, 0.7% African American, 0.7% Native American, 0.7% Asian, 0.3% Pacific Islander, and 21.3% from other races. The median household income was $37,500, and the median age was 37.
Common Questions
What is Per Capita Income in Trowbridge?
Per Capita income in Trowbridge is $48,361.
What is the Median Family Income in Trowbridge?
Median Family Income in Trowbridge is $178,875.
What is the Median Household income in Trowbridge?
Median Household Income in Trowbridge is $138,750.
What is Income or Wage Gap in Trowbridge?
Income or Wage Gap in Trowbridge is 28.4%.
Women in Trowbridge earn 71.6 cents for every dollar earned by a man.
What is Inequality or Gini Index in Trowbridge?
Inequality or Gini Index in Trowbridge is 0.41.
What is the Total Population of Trowbridge?
Total Population of Trowbridge is 192.
What is the Total Male Population of Trowbridge?
Total Male Population of Trowbridge is 91.
What is the Total Female Population of Trowbridge?
Total Female Population of Trowbridge is 101.
What is the Ratio of Males per 100 Females in Trowbridge?
There are 90.10 Males per 100 Females in Trowbridge.
What is the Ratio of Females per 100 Males in Trowbridge?
There are 110.99 Females per 100 Males in Trowbridge.
What is the Median Population Age in Trowbridge?
Median Population Age in Trowbridge is 47.3 Years.
What is the Average Family Size in Trowbridge
Average Family Size in Trowbridge is 3.1 People.
What is the Average Household Size in Trowbridge
Average Household Size in Trowbridge is 2.7 People.
How Large is the Labor Force in Trowbridge?
There are 103 People in the Labor Forcein in Trowbridge.
What is the Percentage of People in the Labor Force in Trowbridge?
64.8% of People are in the Labor Force in Trowbridge.
What is the Unemployment Rate in Trowbridge?
Unemployment Rate in Trowbridge is 14.6%.