Comptche, CA Map & Demographics
Comptche Map
Comptche Overview
$61,987
PER CAPITA INCOME
0.24
INEQUALITY / GINI INDEX
128
TOTAL POPULATION
47
MALE POPULATION
81
FEMALE POPULATION
58.02
MALES / 100 FEMALES
172.34
FEMALES / 100 MALES
63.6
MEDIAN AGE
2.2
AVG FAMILY SIZE
2.8
AVG HOUSEHOLD SIZE
80
LABOR FORCE [ PEOPLE ]
62.5%
PERCENT IN LABOR FORCE
Comptche Zip Codes
Comptche Area Codes
Income in Comptche
Income Overview in Comptche
| Characteristic | Number | Measure |
| Per Capita Income | 128 | $61,987 |
| Median Family Income | 46 | $0 |
| Mean Family Income | 46 | $104,630 |
| Median Household Income | 46 | $0 |
| Mean Household Income | 46 | $149,776 |
| Income Deficit | 46 | $0 |
| Wage / Income Gap (%) | 128 | 0.00% |
| Wage / Income Gap ($) | 128 | 100.00¢ per $1 |
| Gini / Inequality Index | 128 | 0.24 |
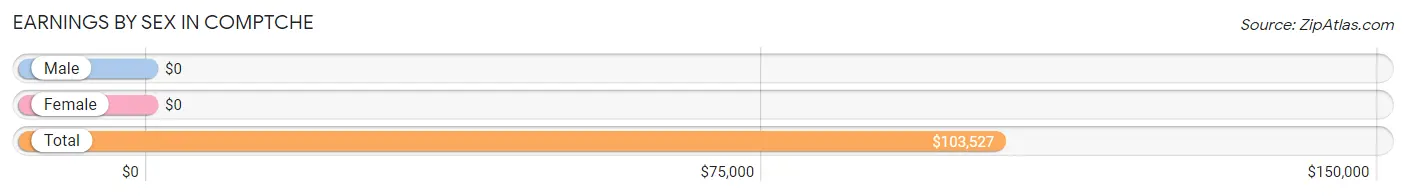
Earnings by Sex in Comptche
| Sex | Number | Average Earnings |
| Male | 27 (41.5%) | $0 |
| Female | 38 (58.5%) | $0 |
| Total | 65 (100.0%) | $103,527 |
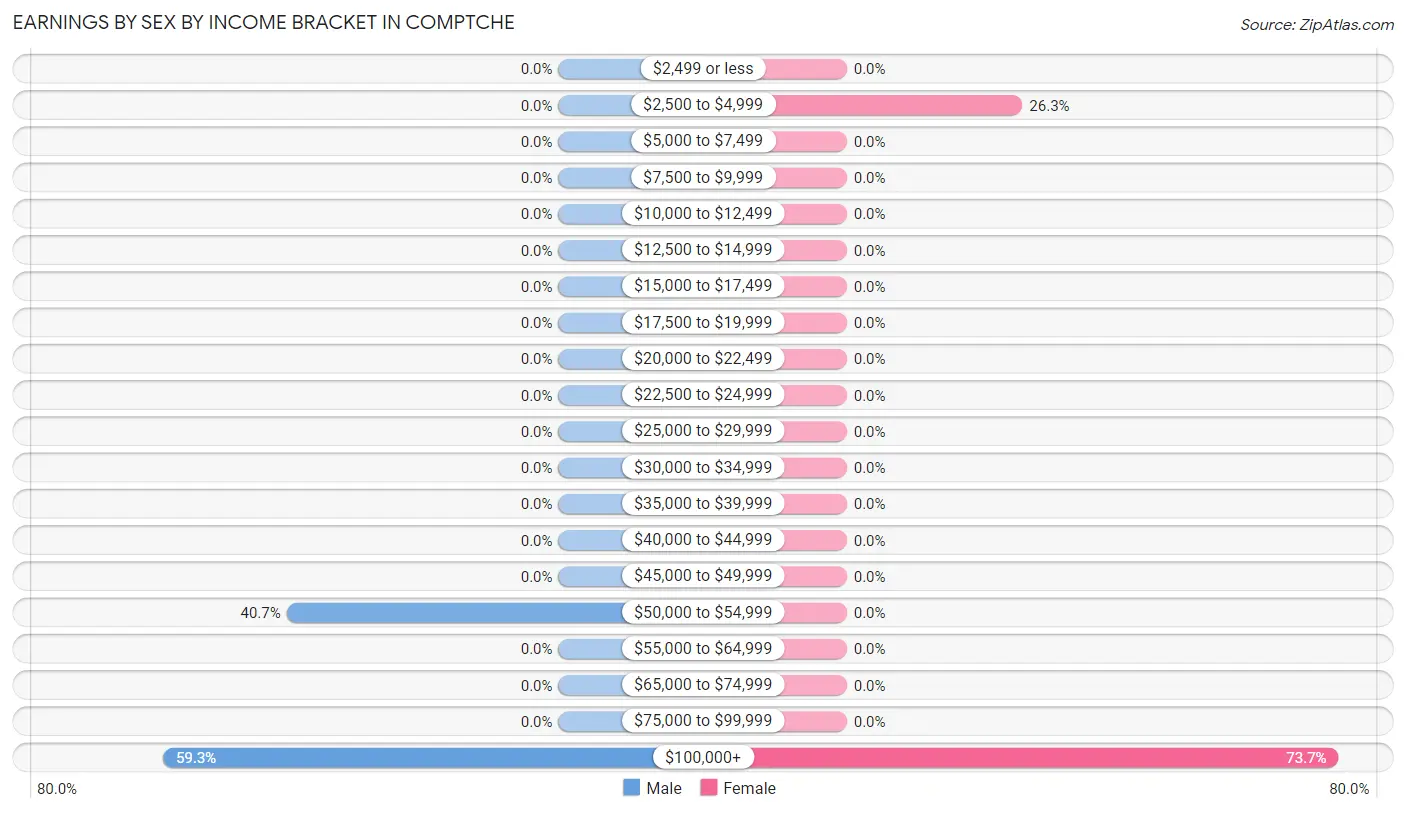
Earnings by Sex by Income Bracket in Comptche
The most common earnings brackets in Comptche are $100,000+ for men (16 | 59.3%) and $100,000+ for women (28 | 73.7%).
| Income | Male | Female |
| $2,499 or less | 0 (0.0%) | 0 (0.0%) |
| $2,500 to $4,999 | 0 (0.0%) | 10 (26.3%) |
| $5,000 to $7,499 | 0 (0.0%) | 0 (0.0%) |
| $7,500 to $9,999 | 0 (0.0%) | 0 (0.0%) |
| $10,000 to $12,499 | 0 (0.0%) | 0 (0.0%) |
| $12,500 to $14,999 | 0 (0.0%) | 0 (0.0%) |
| $15,000 to $17,499 | 0 (0.0%) | 0 (0.0%) |
| $17,500 to $19,999 | 0 (0.0%) | 0 (0.0%) |
| $20,000 to $22,499 | 0 (0.0%) | 0 (0.0%) |
| $22,500 to $24,999 | 0 (0.0%) | 0 (0.0%) |
| $25,000 to $29,999 | 0 (0.0%) | 0 (0.0%) |
| $30,000 to $34,999 | 0 (0.0%) | 0 (0.0%) |
| $35,000 to $39,999 | 0 (0.0%) | 0 (0.0%) |
| $40,000 to $44,999 | 0 (0.0%) | 0 (0.0%) |
| $45,000 to $49,999 | 0 (0.0%) | 0 (0.0%) |
| $50,000 to $54,999 | 11 (40.7%) | 0 (0.0%) |
| $55,000 to $64,999 | 0 (0.0%) | 0 (0.0%) |
| $65,000 to $74,999 | 0 (0.0%) | 0 (0.0%) |
| $75,000 to $99,999 | 0 (0.0%) | 0 (0.0%) |
| $100,000+ | 16 (59.3%) | 28 (73.7%) |
| Total | 27 (100.0%) | 38 (100.0%) |
Earnings by Sex by Educational Attainment in Comptche
| Educational Attainment | Male Income | Female Income |
| Less than High School | - | - |
| High School Diploma | - | - |
| College or Associate's Degree | - | - |
| Bachelor's Degree | - | - |
| Graduate Degree | - | - |
| Total | - | - |
Family Income in Comptche
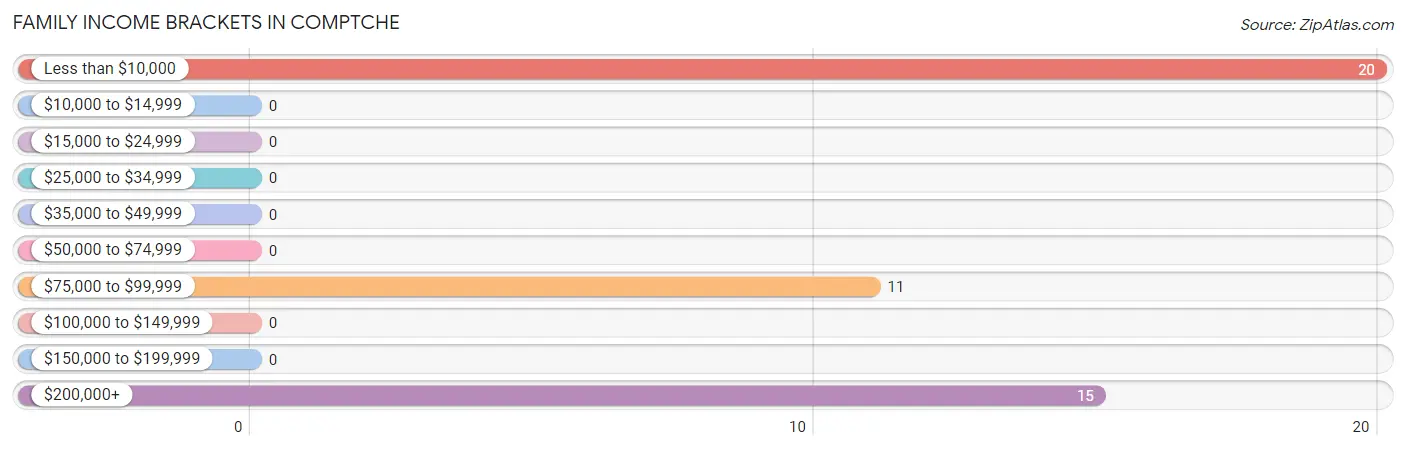
Family Income Brackets in Comptche
According to the Comptche family income data, there are 20 families falling into the less than $10,000 income range, which is the most common income bracket and makes up 43.5% of all families.
| Income Bracket | # Families | % Families |
| Less than $10,000 | 20 | 43.5% |
| $10,000 to $14,999 | 0 | 0.0% |
| $15,000 to $24,999 | 0 | 0.0% |
| $25,000 to $34,999 | 0 | 0.0% |
| $35,000 to $49,999 | 0 | 0.0% |
| $50,000 to $74,999 | 0 | 0.0% |
| $75,000 to $99,999 | 11 | 23.9% |
| $100,000 to $149,999 | 0 | 0.0% |
| $150,000 to $199,999 | 0 | 0.0% |
| $200,000+ | 15 | 32.6% |
Family Income by Famaliy Size in Comptche
| Income Bracket | # Families | Median Income |
| 2-Person Families | 46 (100.0%) | $0 |
| 3-Person Families | 0 (0.0%) | $0 |
| 4-Person Families | 0 (0.0%) | $0 |
| 5-Person Families | 0 (0.0%) | $0 |
| 6-Person Families | 0 (0.0%) | $0 |
| 7+ Person Families | 0 (0.0%) | $0 |
| Total | 46 (100.0%) | $0 |
Family Income by Number of Earners in Comptche
| Number of Earners | # Families | Median Income |
| No Earners | 20 (43.5%) | $0 |
| 1 Earner | 15 (32.6%) | $0 |
| 2 Earners | 11 (23.9%) | $0 |
| 3+ Earners | 0 (0.0%) | $0 |
| Total | 46 (100.0%) | $0 |
Household Income in Comptche
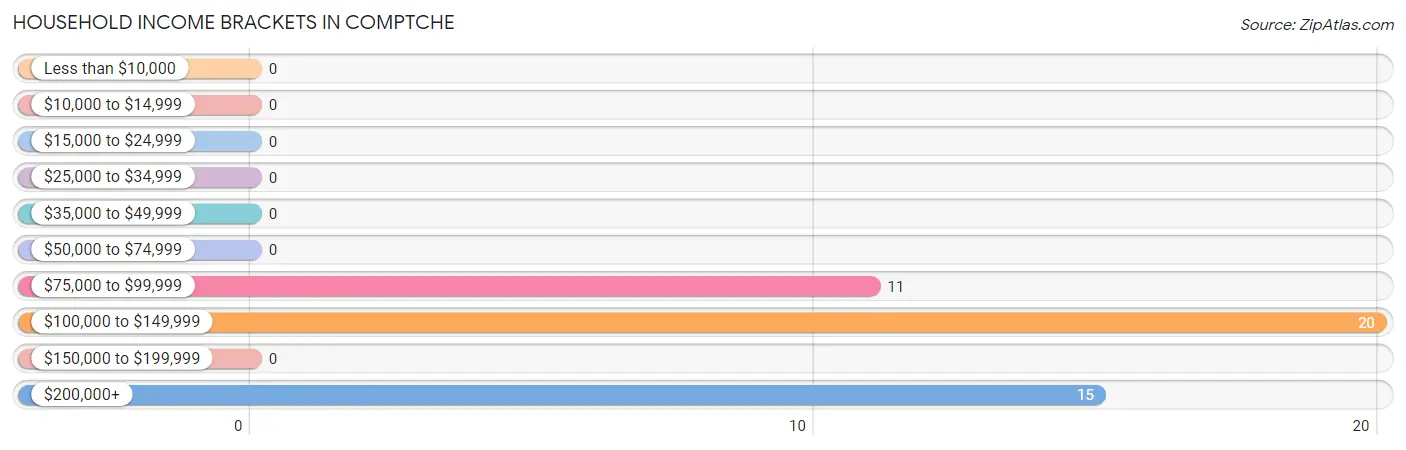
Household Income Brackets in Comptche
With 20 households falling in the category, the $100,000 to $149,999 income range is the most frequent in Comptche, accounting for 43.5% of all households.
| Income Bracket | # Households | % Households |
| Less than $10,000 | 0 | 0.0% |
| $10,000 to $14,999 | 0 | 0.0% |
| $15,000 to $24,999 | 0 | 0.0% |
| $25,000 to $34,999 | 0 | 0.0% |
| $35,000 to $49,999 | 0 | 0.0% |
| $50,000 to $74,999 | 0 | 0.0% |
| $75,000 to $99,999 | 11 | 23.9% |
| $100,000 to $149,999 | 20 | 43.5% |
| $150,000 to $199,999 | 0 | 0.0% |
| $200,000+ | 15 | 32.6% |
Household Income by Householder Age in Comptche
| Income Bracket | # Households | Median Income |
| 15 to 24 Years | 0 (0.0%) | $0 |
| 25 to 44 Years | 0 (0.0%) | $0 |
| 45 to 64 Years | 20 (43.5%) | $0 |
| 65+ Years | 26 (56.5%) | $0 |
| Total | 46 (100.0%) | $0 |
Poverty in Comptche
Income Below Poverty by Sex and Age in Comptche
With 42.5% poverty level for males and 34.6% for females among the residents of Comptche, 55 to 64 year old males and 55 to 64 year old females are the most vulnerable to poverty, with 20 males (100.0%) and 28 females (100.0%) in their respective age groups living below the poverty level.
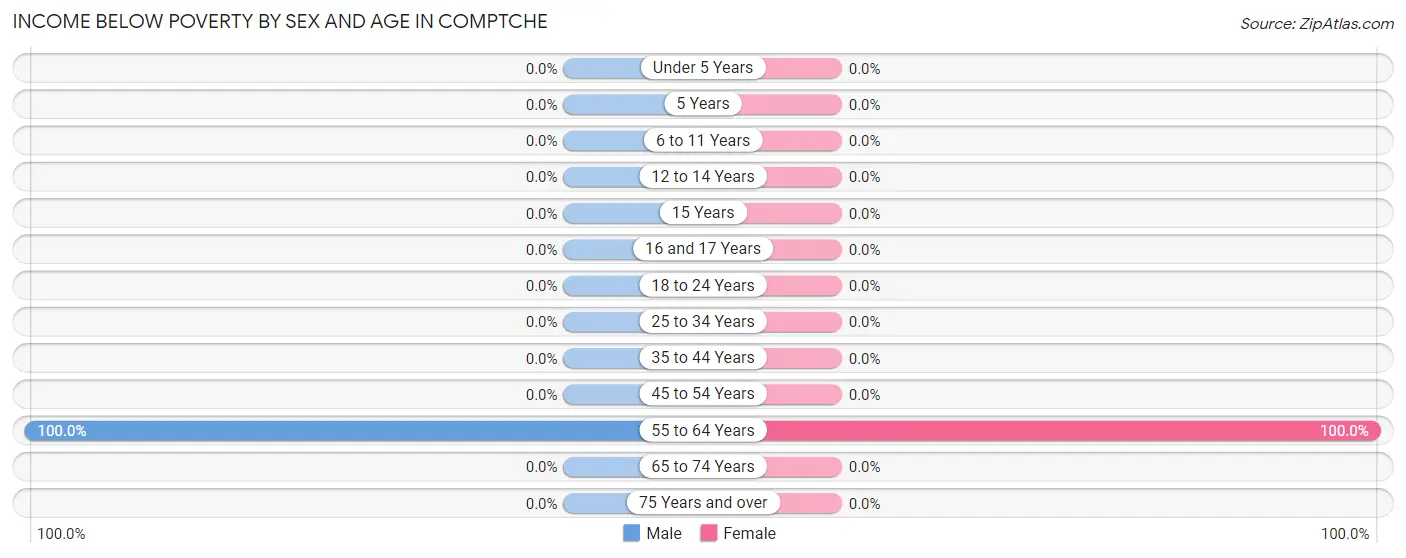
| Age Bracket | Male | Female |
| Under 5 Years | 0 (0.0%) | 0 (0.0%) |
| 5 Years | 0 (0.0%) | 0 (0.0%) |
| 6 to 11 Years | 0 (0.0%) | 0 (0.0%) |
| 12 to 14 Years | 0 (0.0%) | 0 (0.0%) |
| 15 Years | 0 (0.0%) | 0 (0.0%) |
| 16 and 17 Years | 0 (0.0%) | 0 (0.0%) |
| 18 to 24 Years | 0 (0.0%) | 0 (0.0%) |
| 25 to 34 Years | 0 (0.0%) | 0 (0.0%) |
| 35 to 44 Years | 0 (0.0%) | 0 (0.0%) |
| 45 to 54 Years | 0 (0.0%) | 0 (0.0%) |
| 55 to 64 Years | 20 (100.0%) | 28 (100.0%) |
| 65 to 74 Years | 0 (0.0%) | 0 (0.0%) |
| 75 Years and over | 0 (0.0%) | 0 (0.0%) |
| Total | 20 (42.5%) | 28 (34.6%) |
Income Above Poverty by Sex and Age in Comptche
According to the poverty statistics in Comptche, males aged 65 to 74 years and females aged 35 to 44 years are the age groups that are most secure financially, with 100.0% of males and 100.0% of females in these age groups living above the poverty line.
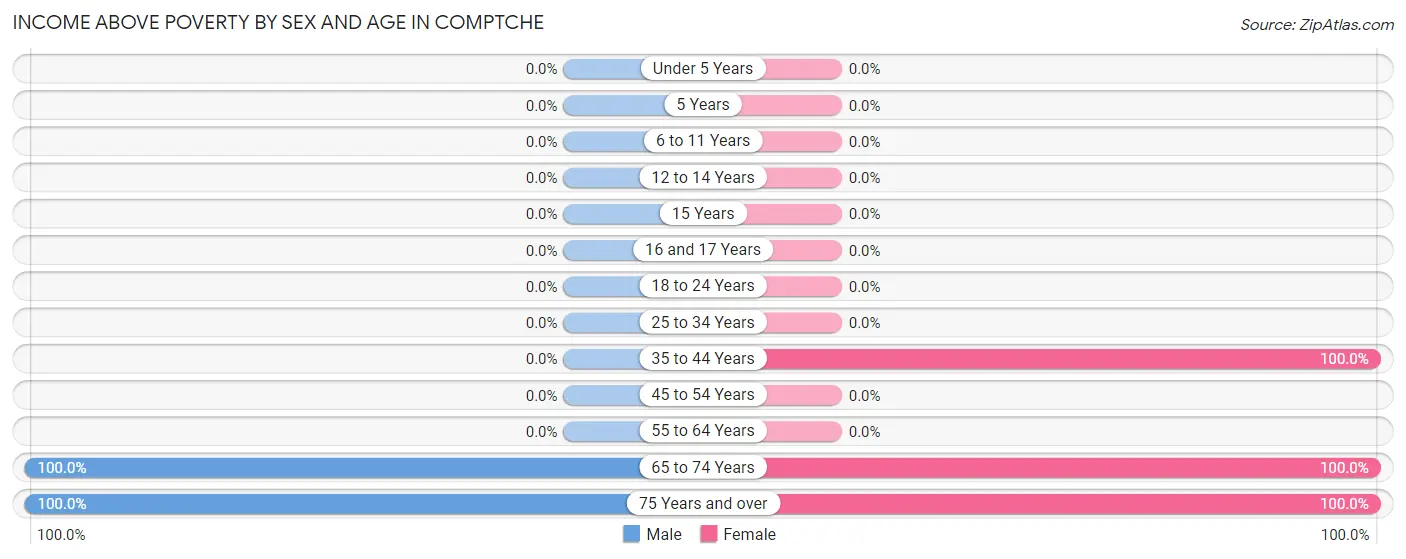
| Age Bracket | Male | Female |
| Under 5 Years | 0 (0.0%) | 0 (0.0%) |
| 5 Years | 0 (0.0%) | 0 (0.0%) |
| 6 to 11 Years | 0 (0.0%) | 0 (0.0%) |
| 12 to 14 Years | 0 (0.0%) | 0 (0.0%) |
| 15 Years | 0 (0.0%) | 0 (0.0%) |
| 16 and 17 Years | 0 (0.0%) | 0 (0.0%) |
| 18 to 24 Years | 0 (0.0%) | 0 (0.0%) |
| 25 to 34 Years | 0 (0.0%) | 0 (0.0%) |
| 35 to 44 Years | 0 (0.0%) | 28 (100.0%) |
| 45 to 54 Years | 0 (0.0%) | 0 (0.0%) |
| 55 to 64 Years | 0 (0.0%) | 0 (0.0%) |
| 65 to 74 Years | 11 (100.0%) | 10 (100.0%) |
| 75 Years and over | 16 (100.0%) | 15 (100.0%) |
| Total | 27 (57.5%) | 53 (65.4%) |
Income Below Poverty Among Married-Couple Families in Comptche
| Children | Above Poverty | Below Poverty |
| No Children | 26 (100.0%) | 0 (0.0%) |
| 1 or 2 Children | 0 (0.0%) | 0 (0.0%) |
| 3 or 4 Children | 0 (0.0%) | 0 (0.0%) |
| 5 or more Children | 0 (0.0%) | 0 (0.0%) |
| Total | 26 (100.0%) | 0 (0.0%) |
Income Below Poverty Among Single-Parent Households in Comptche
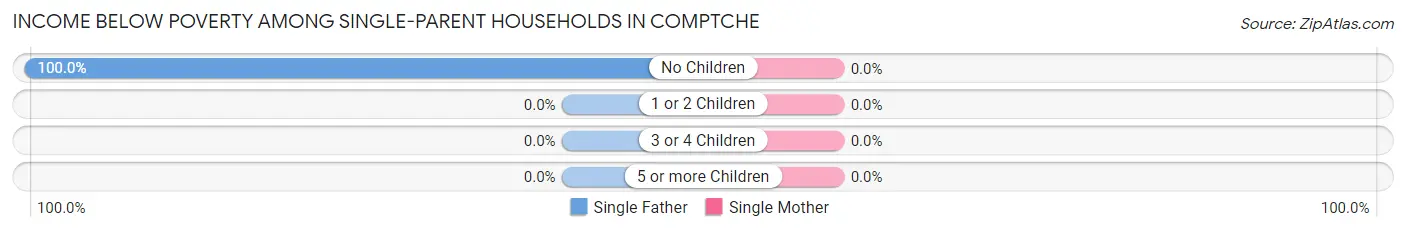
| Children | Single Father | Single Mother |
| No Children | 20 (100.0%) | 0 (0.0%) |
| 1 or 2 Children | 0 (0.0%) | 0 (0.0%) |
| 3 or 4 Children | 0 (0.0%) | 0 (0.0%) |
| 5 or more Children | 0 (0.0%) | 0 (0.0%) |
| Total | 20 (100.0%) | 0 (0.0%) |
Income Below Poverty Among Married-Couple vs Single-Parent Households in Comptche
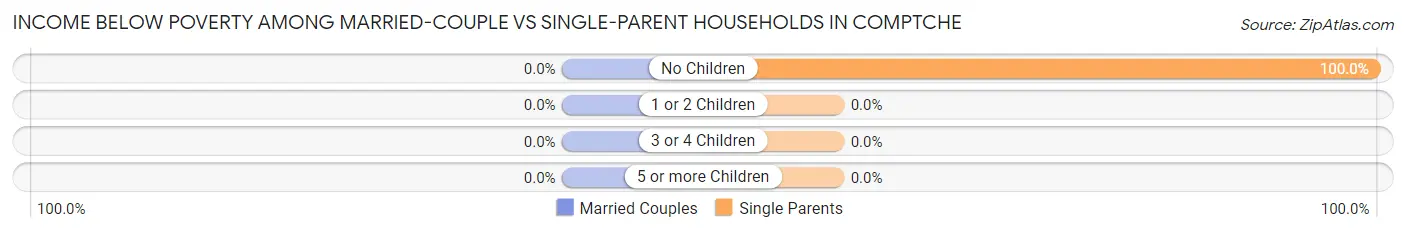
| Children | Married-Couple Families | Single-Parent Households |
| No Children | 0 (0.0%) | 20 (100.0%) |
| 1 or 2 Children | 0 (0.0%) | 0 (0.0%) |
| 3 or 4 Children | 0 (0.0%) | 0 (0.0%) |
| 5 or more Children | 0 (0.0%) | 0 (0.0%) |
| Total | 0 (0.0%) | 20 (100.0%) |
Race in Comptche
The most populous races in Comptche are , and White / Caucasian (128 | 100.0%).
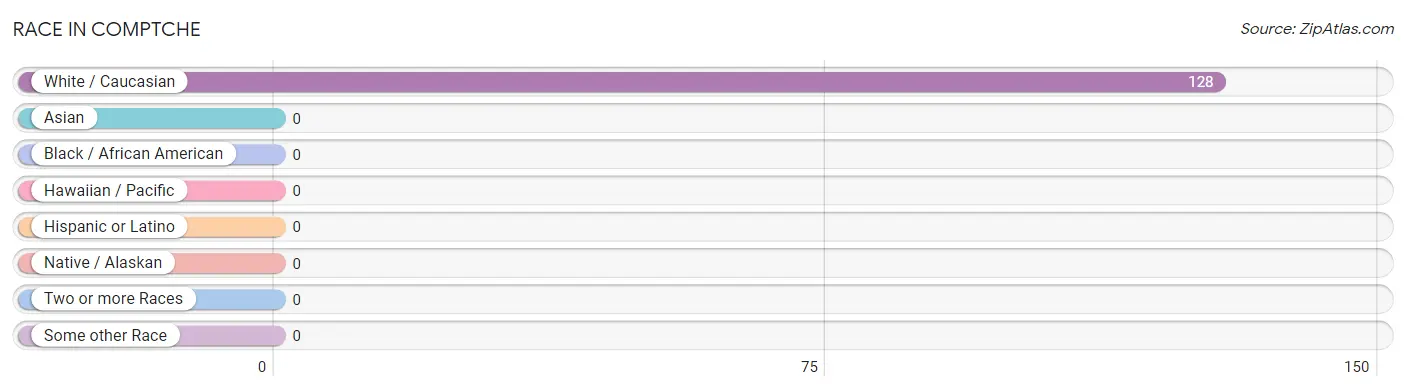
| Race | # Population | % Population |
| Asian | 0 | 0.0% |
| Black / African American | 0 | 0.0% |
| Hawaiian / Pacific | 0 | 0.0% |
| Hispanic or Latino | 0 | 0.0% |
| Native / Alaskan | 0 | 0.0% |
| White / Caucasian | 128 | 100.0% |
| Two or more Races | 0 | 0.0% |
| Some other Race | 0 | 0.0% |
| Total | 128 | 100.0% |
Ancestry in Comptche
The most populous ancestries reported in Comptche are British (31 | 24.2%), German (25 | 19.5%), Scandinavian (16 | 12.5%), English (11 | 8.6%), and Irish (11 | 8.6%), together accounting for 73.4% of all Comptche residents.
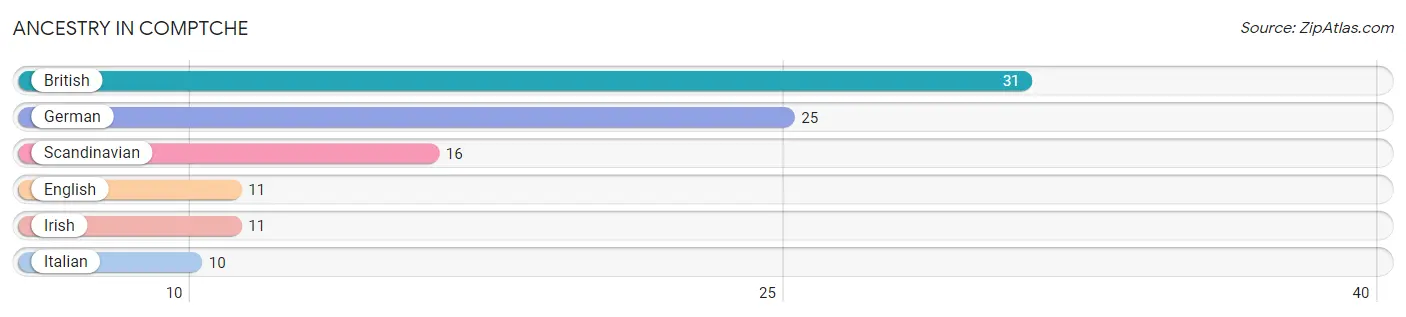
| Ancestry | # Population | % Population |
| British | 31 | 24.2% |
| English | 11 | 8.6% |
| German | 25 | 19.5% |
| Irish | 11 | 8.6% |
| Italian | 10 | 7.8% |
| Scandinavian | 16 | 12.5% | View All 6 Rows |
Immigrants in Comptche
The most numerous immigrant groups reported in Comptche came from , and Canada (16 | 12.5%), together accounting for 12.5% of all Comptche residents.

| Immigration Origin | # Population | % Population |
| Canada | 16 | 12.5% | View All 1 Rows |
Sex and Age in Comptche
Sex and Age in Comptche
The most populous age groups in Comptche are 55 to 59 Years (20 | 42.5%) for men and 35 to 39 Years (28 | 34.6%) for women.
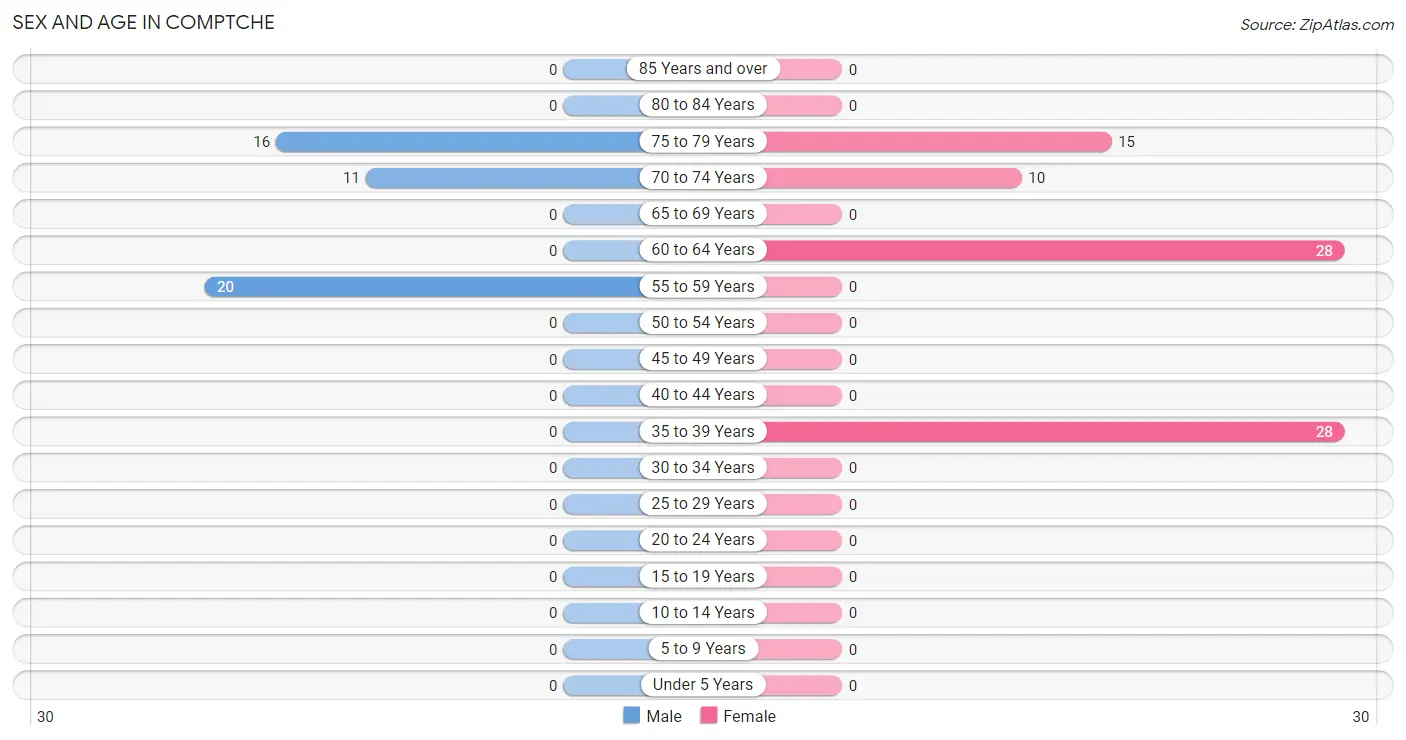
| Age Bracket | Male | Female |
| Under 5 Years | 0 (0.0%) | 0 (0.0%) |
| 5 to 9 Years | 0 (0.0%) | 0 (0.0%) |
| 10 to 14 Years | 0 (0.0%) | 0 (0.0%) |
| 15 to 19 Years | 0 (0.0%) | 0 (0.0%) |
| 20 to 24 Years | 0 (0.0%) | 0 (0.0%) |
| 25 to 29 Years | 0 (0.0%) | 0 (0.0%) |
| 30 to 34 Years | 0 (0.0%) | 0 (0.0%) |
| 35 to 39 Years | 0 (0.0%) | 28 (34.6%) |
| 40 to 44 Years | 0 (0.0%) | 0 (0.0%) |
| 45 to 49 Years | 0 (0.0%) | 0 (0.0%) |
| 50 to 54 Years | 0 (0.0%) | 0 (0.0%) |
| 55 to 59 Years | 20 (42.5%) | 0 (0.0%) |
| 60 to 64 Years | 0 (0.0%) | 28 (34.6%) |
| 65 to 69 Years | 0 (0.0%) | 0 (0.0%) |
| 70 to 74 Years | 11 (23.4%) | 10 (12.3%) |
| 75 to 79 Years | 16 (34.0%) | 15 (18.5%) |
| 80 to 84 Years | 0 (0.0%) | 0 (0.0%) |
| 85 Years and over | 0 (0.0%) | 0 (0.0%) |
| Total | 47 (100.0%) | 81 (100.0%) |
Families and Households in Comptche
Median Family Size in Comptche
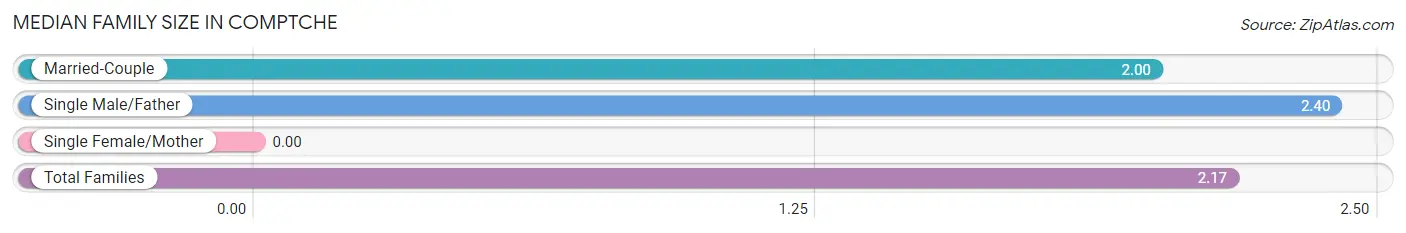
| Family Type | # Families | Family Size |
| Married-Couple | 26 (56.5%) | 2.00 |
| Single Male/Father | 20 (43.5%) | 2.40 |
| Single Female/Mother | 0 (0.0%) | - |
| Total Families | 46 (100.0%) | 2.17 |
Median Household Size in Comptche
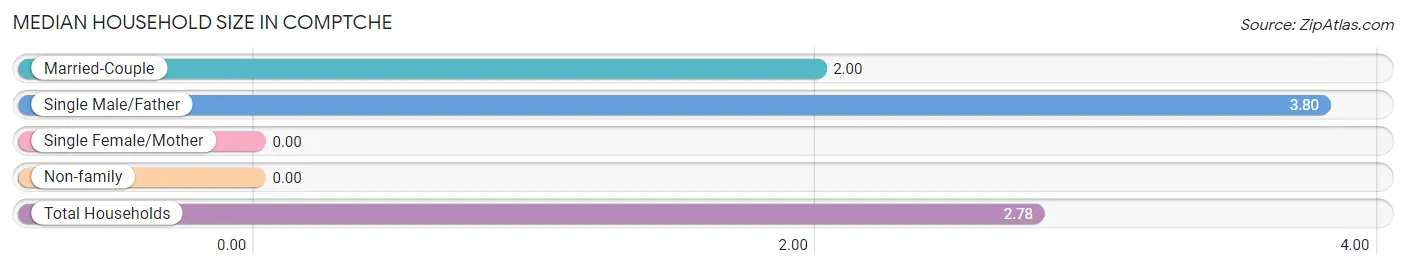
| Household Type | # Households | Household Size |
| Married-Couple | 26 (56.5%) | 2.00 |
| Single Male/Father | 20 (43.5%) | 3.80 |
| Single Female/Mother | 0 (0.0%) | - |
| Non-family | 0 (0.0%) | - |
| Total Households | 46 (100.0%) | 2.78 |
Household Size by Marriage Status in Comptche
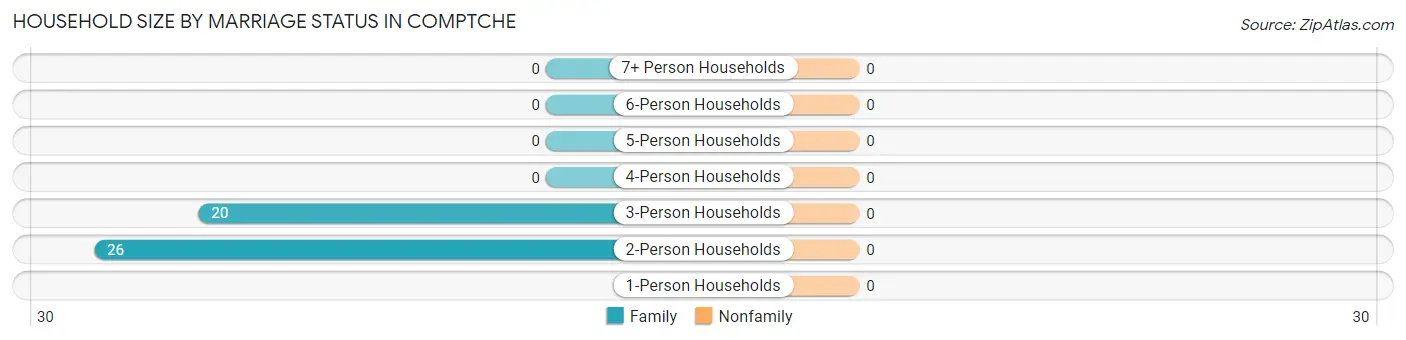
| Household Size | Family Households | Nonfamily Households |
| 1-Person Households | - | 0 (0.0%) |
| 2-Person Households | 26 (56.5%) | 0 (0.0%) |
| 3-Person Households | 20 (43.5%) | 0 (0.0%) |
| 4-Person Households | 0 (0.0%) | 0 (0.0%) |
| 5-Person Households | 0 (0.0%) | 0 (0.0%) |
| 6-Person Households | 0 (0.0%) | 0 (0.0%) |
| 7+ Person Households | 0 (0.0%) | 0 (0.0%) |
| Total | 46 (100.0%) | 0 (0.0%) |
Female Fertility in Comptche
Fertility by Age in Comptche
| Age Bracket | Women with Births | Births / 1,000 Women |
| 15 to 19 years | 0 (0.0%) | 0.0 |
| 20 to 34 years | 0 (0.0%) | 0.0 |
| 35 to 50 years | 0 (0.0%) | 0.0 |
| Total | 0 (0.0%) | 0.0 |
Fertility by Age by Marriage Status in Comptche
| Age Bracket | Married | Unmarried |
| 15 to 19 years | 0 (0.0%) | 0 (0.0%) |
| 20 to 34 years | 0 (0.0%) | 0 (0.0%) |
| 35 to 50 years | 0 (0.0%) | 0 (0.0%) |
| Total | 0 (0.0%) | 0 (0.0%) |
Fertility by Education in Comptche
| Educational Attainment | Women with Births | Births / 1,000 Women |
| Less than High School | 0 (0.0%) | 0.0 |
| High School Diploma | 0 (0.0%) | 0.0 |
| College or Associate's Degree | 0 (0.0%) | 0.0 |
| Bachelor's Degree | 0 (0.0%) | 0.0 |
| Graduate Degree | 0 (0.0%) | 0.0 |
| Total | 0 (0.0%) | 0.0 |
Fertility by Education by Marriage Status in Comptche
| Educational Attainment | Married | Unmarried |
| Less than High School | 0 (0.0%) | 0 (0.0%) |
| High School Diploma | 0 (0.0%) | 0 (0.0%) |
| College or Associate's Degree | 0 (0.0%) | 0 (0.0%) |
| Bachelor's Degree | 0 (0.0%) | 0 (0.0%) |
| Graduate Degree | 0 (0.0%) | 0 (0.0%) |
| Total | 0 (0.0%) | 0 (0.0%) |
Employment Characteristics in Comptche
Employment by Class of Employer in Comptche
Among the 69 employed individuals in Comptche, private company employees (28 | 40.6%), self-employed (not incorporated) (26 | 37.7%), and unpaid family workers (15 | 21.7%) make up the most common classes of employment.
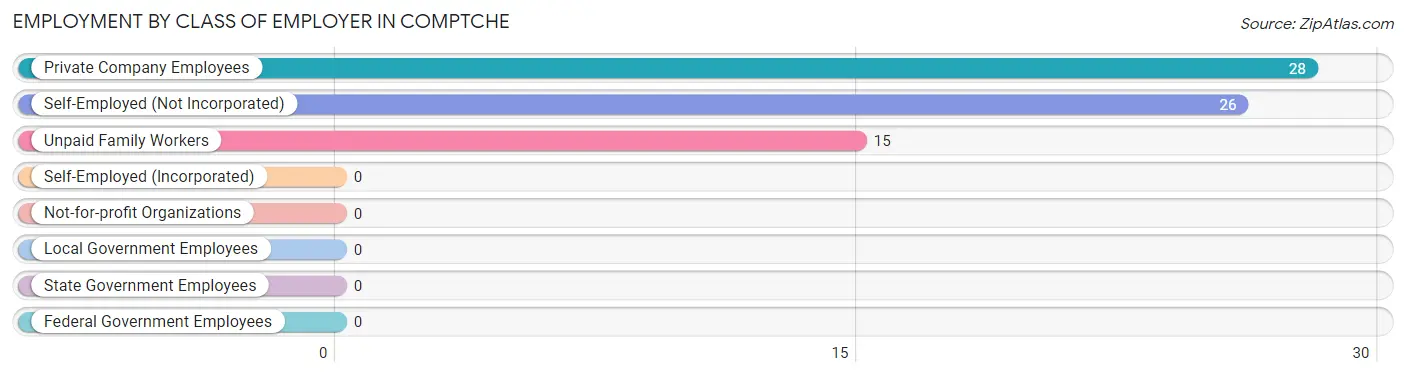
| Employer Class | # Employees | % Employees |
| Private Company Employees | 28 | 40.6% |
| Self-Employed (Incorporated) | 0 | 0.0% |
| Self-Employed (Not Incorporated) | 26 | 37.7% |
| Not-for-profit Organizations | 0 | 0.0% |
| Local Government Employees | 0 | 0.0% |
| State Government Employees | 0 | 0.0% |
| Federal Government Employees | 0 | 0.0% |
| Unpaid Family Workers | 15 | 21.7% |
| Total | 69 | 100.0% |
Employment Status by Age in Comptche
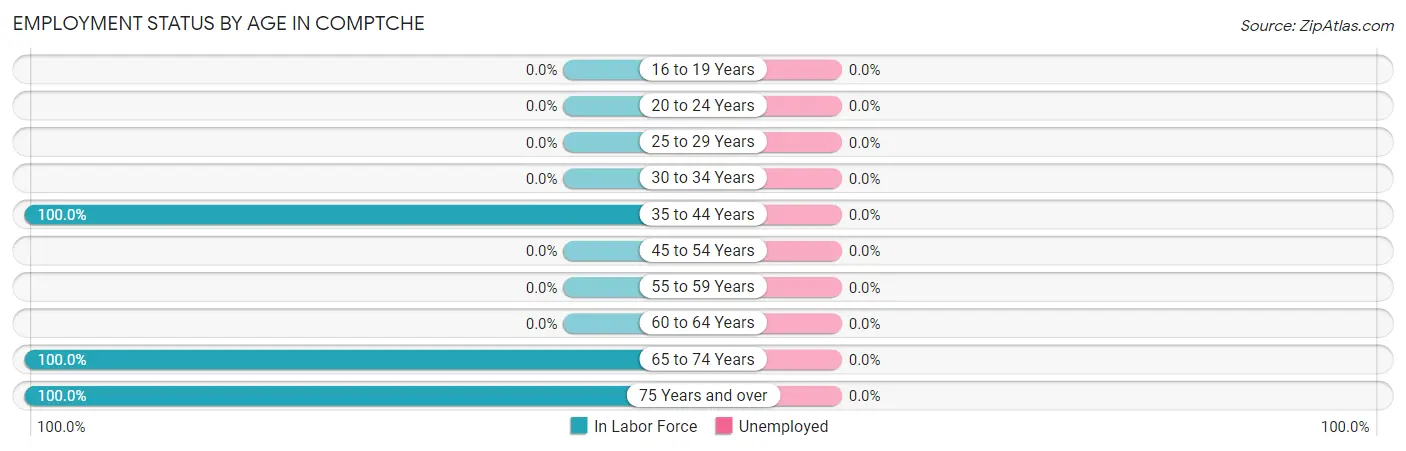
| Age Bracket | In Labor Force | Unemployed |
| 16 to 19 Years | 0 (0.0%) | 0 (0.0%) |
| 20 to 24 Years | 0 (0.0%) | 0 (0.0%) |
| 25 to 29 Years | 0 (0.0%) | 0 (0.0%) |
| 30 to 34 Years | 0 (0.0%) | 0 (0.0%) |
| 35 to 44 Years | 28 (100.0%) | 0 (0.0%) |
| 45 to 54 Years | 0 (0.0%) | 0 (0.0%) |
| 55 to 59 Years | 0 (0.0%) | 0 (0.0%) |
| 60 to 64 Years | 0 (0.0%) | 0 (0.0%) |
| 65 to 74 Years | 21 (100.0%) | 0 (0.0%) |
| 75 Years and over | 31 (100.0%) | 0 (0.0%) |
| Total | 80 (62.5%) | 0 (0.0%) |
Employment Status by Educational Attainment in Comptche
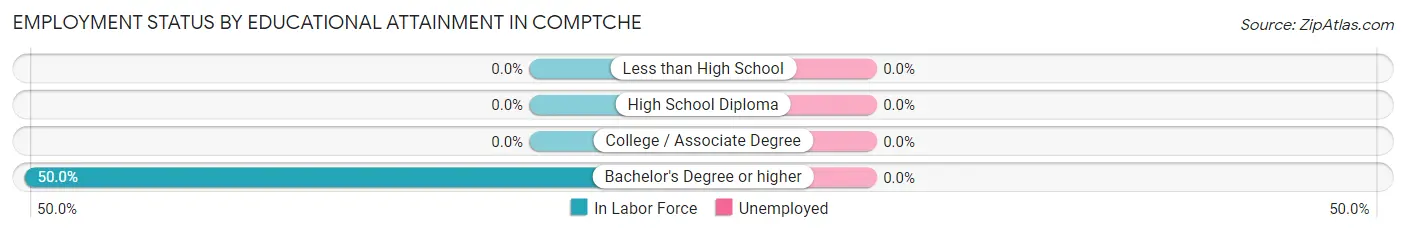
| Educational Attainment | In Labor Force | Unemployed |
| Less than High School | 0 (0.0%) | 0 (0.0%) |
| High School Diploma | 0 (0.0%) | 0 (0.0%) |
| College / Associate Degree | 0 (0.0%) | 0 (0.0%) |
| Bachelor's Degree or higher | 28 (50.0%) | 0 (0.0%) |
| Total | 28 (36.8%) | 0 (0.0%) |
Employment Occupations by Sex in Comptche
Management, Business, Science and Arts Occupations
The most common Management, Business, Science and Arts occupations in Comptche are Health Diagnosing & Treating (16 | 20.0%), Health Technologists (16 | 20.0%), Community & Social Service (10 | 12.5%), and Education Instruction & Library (10 | 12.5%).
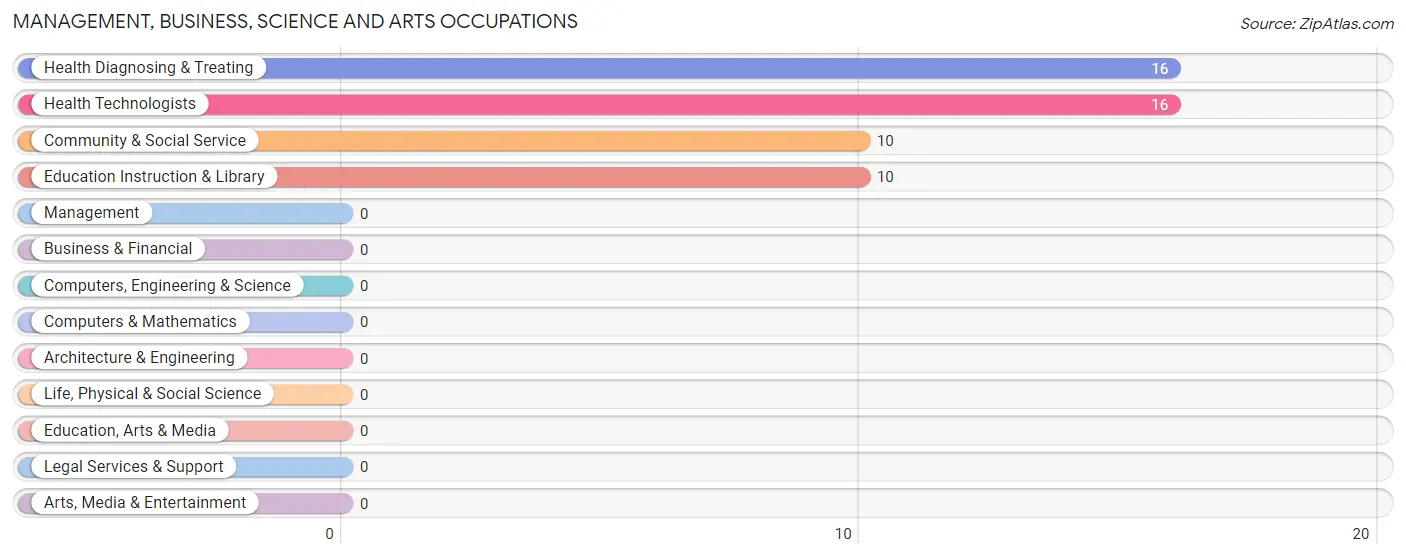
Management, Business, Science and Arts Occupations by Sex
Within the Management, Business, Science and Arts occupations in Comptche, the most male-oriented occupations are Health Diagnosing & Treating (100.0%), and Health Technologists (100.0%), while the most female-oriented occupations are Community & Social Service (100.0%), and Education Instruction & Library (100.0%).
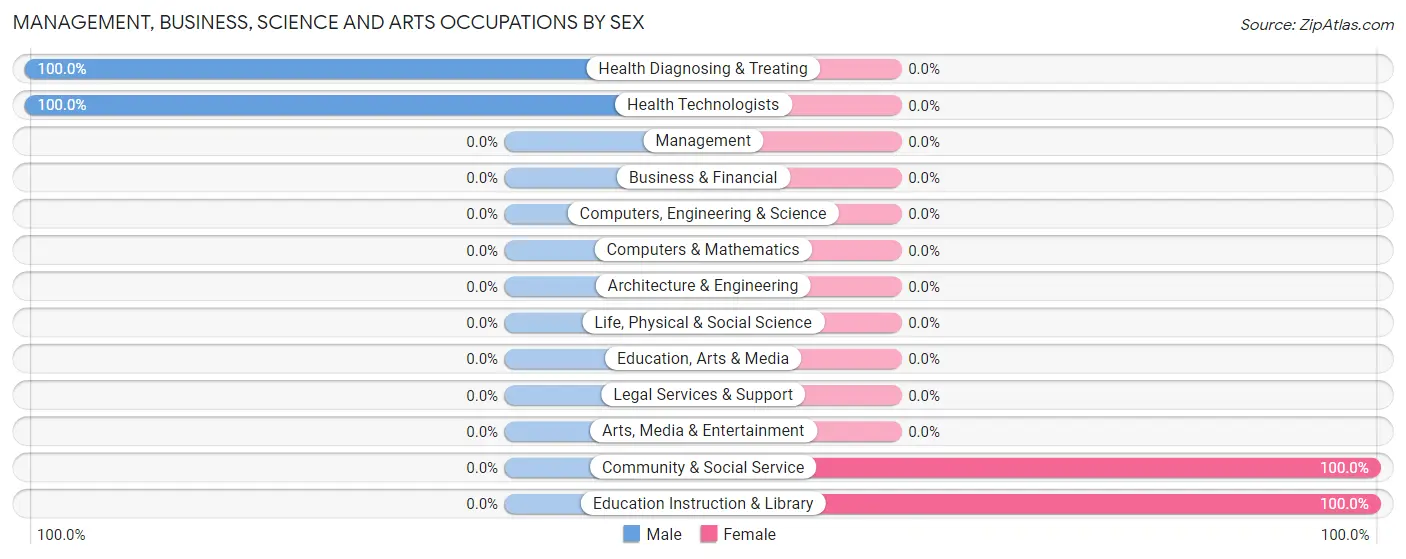
| Occupation | Male | Female |
| Management | 0 (0.0%) | 0 (0.0%) |
| Business & Financial | 0 (0.0%) | 0 (0.0%) |
| Computers, Engineering & Science | 0 (0.0%) | 0 (0.0%) |
| Computers & Mathematics | 0 (0.0%) | 0 (0.0%) |
| Architecture & Engineering | 0 (0.0%) | 0 (0.0%) |
| Life, Physical & Social Science | 0 (0.0%) | 0 (0.0%) |
| Community & Social Service | 0 (0.0%) | 10 (100.0%) |
| Education, Arts & Media | 0 (0.0%) | 0 (0.0%) |
| Legal Services & Support | 0 (0.0%) | 0 (0.0%) |
| Education Instruction & Library | 0 (0.0%) | 10 (100.0%) |
| Arts, Media & Entertainment | 0 (0.0%) | 0 (0.0%) |
| Health Diagnosing & Treating | 16 (100.0%) | 0 (0.0%) |
| Health Technologists | 16 (100.0%) | 0 (0.0%) |
| Total (Category) | 16 (61.5%) | 10 (38.5%) |
| Total (Overall) | 27 (33.8%) | 53 (66.2%) |
Services Occupations
Services Occupations by Sex
| Occupation | Male | Female |
| Healthcare Support | 0 (0.0%) | 0 (0.0%) |
| Security & Protection | 0 (0.0%) | 0 (0.0%) |
| Firefighting & Prevention | 0 (0.0%) | 0 (0.0%) |
| Law Enforcement | 0 (0.0%) | 0 (0.0%) |
| Food Preparation & Serving | 0 (0.0%) | 0 (0.0%) |
| Cleaning & Maintenance | 0 (0.0%) | 0 (0.0%) |
| Personal Care & Service | 0 (0.0%) | 0 (0.0%) |
| Total (Category) | 0 (0.0%) | 0 (0.0%) |
| Total (Overall) | 27 (33.8%) | 53 (66.2%) |
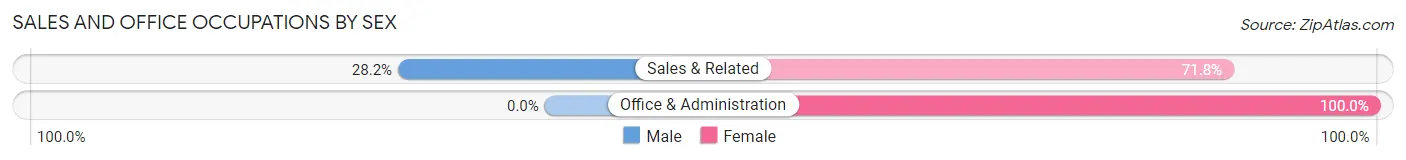
Sales and Office Occupations
The most common Sales and Office occupations in Comptche are Sales & Related (39 | 48.7%), and Office & Administration (15 | 18.8%).
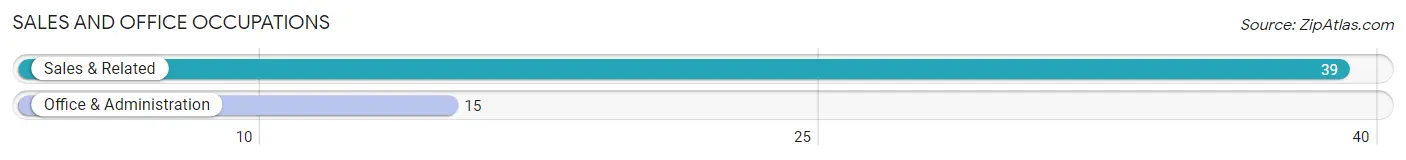
Sales and Office Occupations by Sex
| Occupation | Male | Female |
| Sales & Related | 11 (28.2%) | 28 (71.8%) |
| Office & Administration | 0 (0.0%) | 15 (100.0%) |
| Total (Category) | 11 (20.4%) | 43 (79.6%) |
| Total (Overall) | 27 (33.8%) | 53 (66.2%) |
Natural Resources, Construction and Maintenance Occupations
Natural Resources, Construction and Maintenance Occupations by Sex
| Occupation | Male | Female |
| Farming, Fishing & Forestry | 0 (0.0%) | 0 (0.0%) |
| Construction & Extraction | 0 (0.0%) | 0 (0.0%) |
| Installation, Maintenance & Repair | 0 (0.0%) | 0 (0.0%) |
| Total (Category) | 0 (0.0%) | 0 (0.0%) |
| Total (Overall) | 27 (33.8%) | 53 (66.2%) |
Production, Transportation and Moving Occupations
Production, Transportation and Moving Occupations by Sex
| Occupation | Male | Female |
| Production | 0 (0.0%) | 0 (0.0%) |
| Transportation | 0 (0.0%) | 0 (0.0%) |
| Material Moving | 0 (0.0%) | 0 (0.0%) |
| Total (Category) | 0 (0.0%) | 0 (0.0%) |
| Total (Overall) | 27 (33.8%) | 53 (66.2%) |
Employment Industries by Sex in Comptche
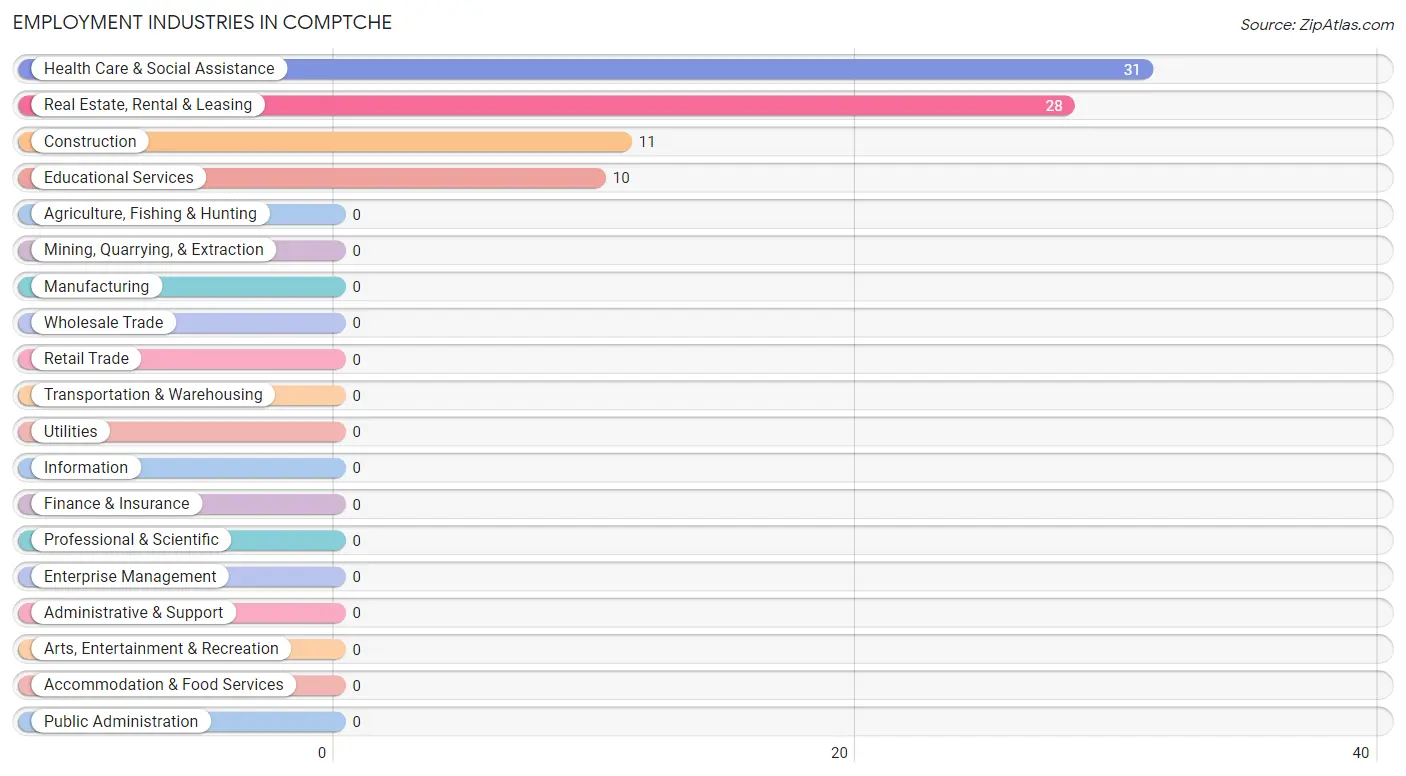
Employment Industries in Comptche
The major employment industries in Comptche include Health Care & Social Assistance (31 | 38.8%), Real Estate, Rental & Leasing (28 | 35.0%), Construction (11 | 13.8%), and Educational Services (10 | 12.5%).
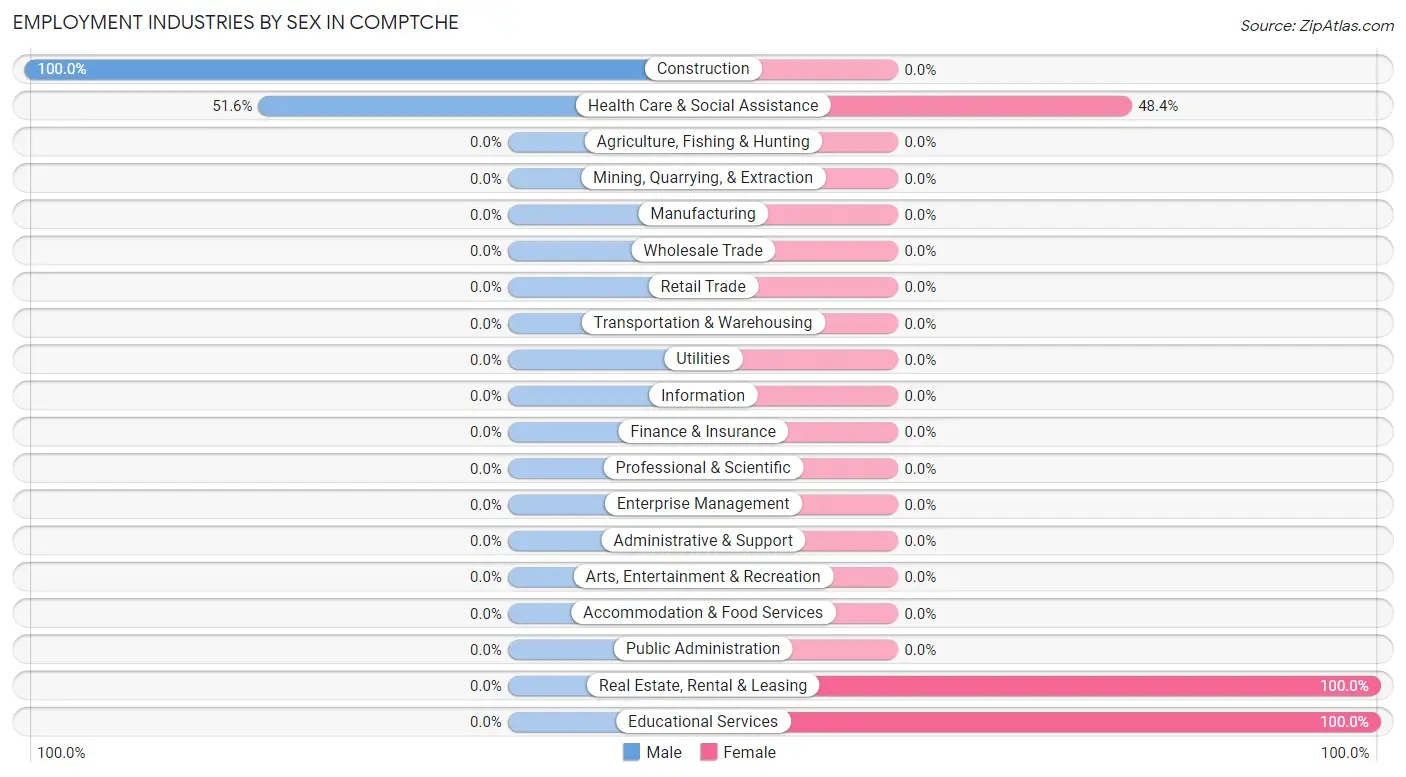
Employment Industries by Sex in Comptche
The Comptche industries that see more men than women are Construction (100.0%), and Health Care & Social Assistance (51.6%), whereas the industries that tend to have a higher number of women are Real Estate, Rental & Leasing (100.0%), Educational Services (100.0%), and Health Care & Social Assistance (48.4%).
| Industry | Male | Female |
| Agriculture, Fishing & Hunting | 0 (0.0%) | 0 (0.0%) |
| Mining, Quarrying, & Extraction | 0 (0.0%) | 0 (0.0%) |
| Construction | 11 (100.0%) | 0 (0.0%) |
| Manufacturing | 0 (0.0%) | 0 (0.0%) |
| Wholesale Trade | 0 (0.0%) | 0 (0.0%) |
| Retail Trade | 0 (0.0%) | 0 (0.0%) |
| Transportation & Warehousing | 0 (0.0%) | 0 (0.0%) |
| Utilities | 0 (0.0%) | 0 (0.0%) |
| Information | 0 (0.0%) | 0 (0.0%) |
| Finance & Insurance | 0 (0.0%) | 0 (0.0%) |
| Real Estate, Rental & Leasing | 0 (0.0%) | 28 (100.0%) |
| Professional & Scientific | 0 (0.0%) | 0 (0.0%) |
| Enterprise Management | 0 (0.0%) | 0 (0.0%) |
| Administrative & Support | 0 (0.0%) | 0 (0.0%) |
| Educational Services | 0 (0.0%) | 10 (100.0%) |
| Health Care & Social Assistance | 16 (51.6%) | 15 (48.4%) |
| Arts, Entertainment & Recreation | 0 (0.0%) | 0 (0.0%) |
| Accommodation & Food Services | 0 (0.0%) | 0 (0.0%) |
| Public Administration | 0 (0.0%) | 0 (0.0%) |
| Total | 27 (33.8%) | 53 (66.2%) |
Education in Comptche
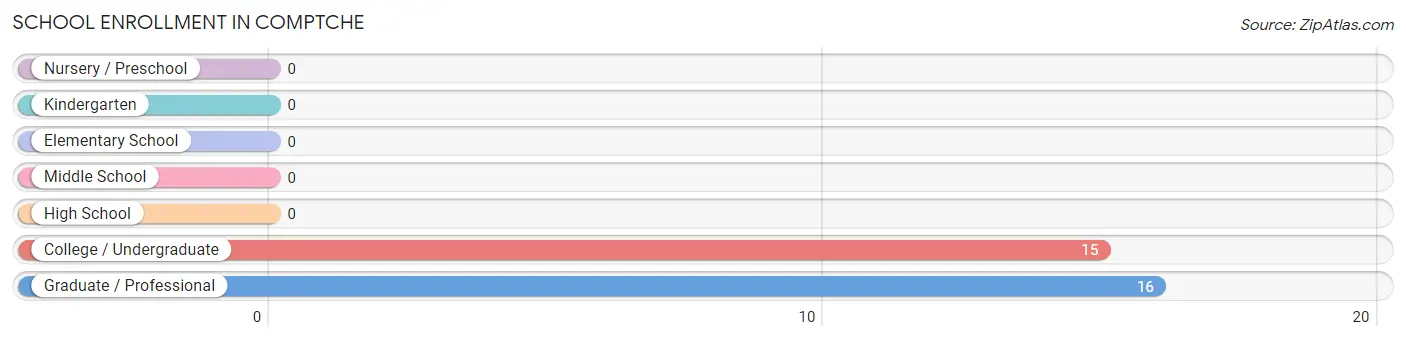
School Enrollment in Comptche
The most common levels of schooling among the 31 students in Comptche are graduate / professional (16 | 51.6%), and college / undergraduate (15 | 48.4%).
| School Level | # Students | % Students |
| Nursery / Preschool | 0 | 0.0% |
| Kindergarten | 0 | 0.0% |
| Elementary School | 0 | 0.0% |
| Middle School | 0 | 0.0% |
| High School | 0 | 0.0% |
| College / Undergraduate | 15 | 48.4% |
| Graduate / Professional | 16 | 51.6% |
| Total | 31 | 100.0% |
School Enrollment by Age by Funding Source in Comptche
Out of a total of 31 students who are enrolled in schools in Comptche, 16 (51.6%) attend a private institution, while the remaining 15 (48.4%) are enrolled in public schools. The age group of 35 years and over has the highest likelihood of being enrolled in private schools, with 16 (51.6% in the age bracket) enrolled. Conversely, the age group of 35 years and over has the lowest likelihood of being enrolled in a private school, with 15 (48.4% in the age bracket) attending a public institution.
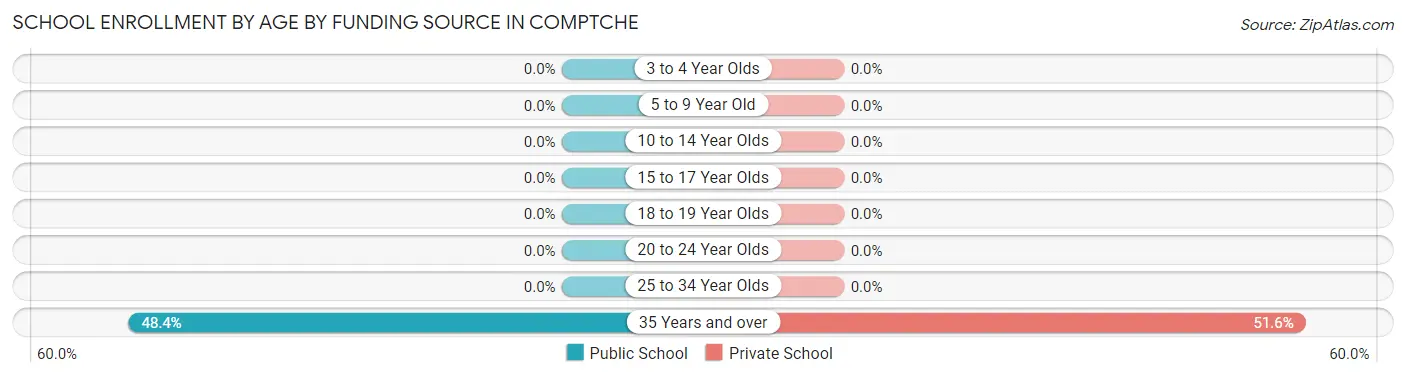
| Age Bracket | Public School | Private School |
| 3 to 4 Year Olds | 0 (0.0%) | 0 (0.0%) |
| 5 to 9 Year Old | 0 (0.0%) | 0 (0.0%) |
| 10 to 14 Year Olds | 0 (0.0%) | 0 (0.0%) |
| 15 to 17 Year Olds | 0 (0.0%) | 0 (0.0%) |
| 18 to 19 Year Olds | 0 (0.0%) | 0 (0.0%) |
| 20 to 24 Year Olds | 0 (0.0%) | 0 (0.0%) |
| 25 to 34 Year Olds | 0 (0.0%) | 0 (0.0%) |
| 35 Years and over | 15 (48.4%) | 16 (51.6%) |
| Total | 15 (48.4%) | 16 (51.6%) |
Educational Attainment by Field of Study in Comptche
Business (28 | 38.9%), literature & languages (28 | 38.9%), and physical & health sciences (16 | 22.2%) are the most common fields of study among 72 individuals in Comptche who have obtained a bachelor's degree or higher.
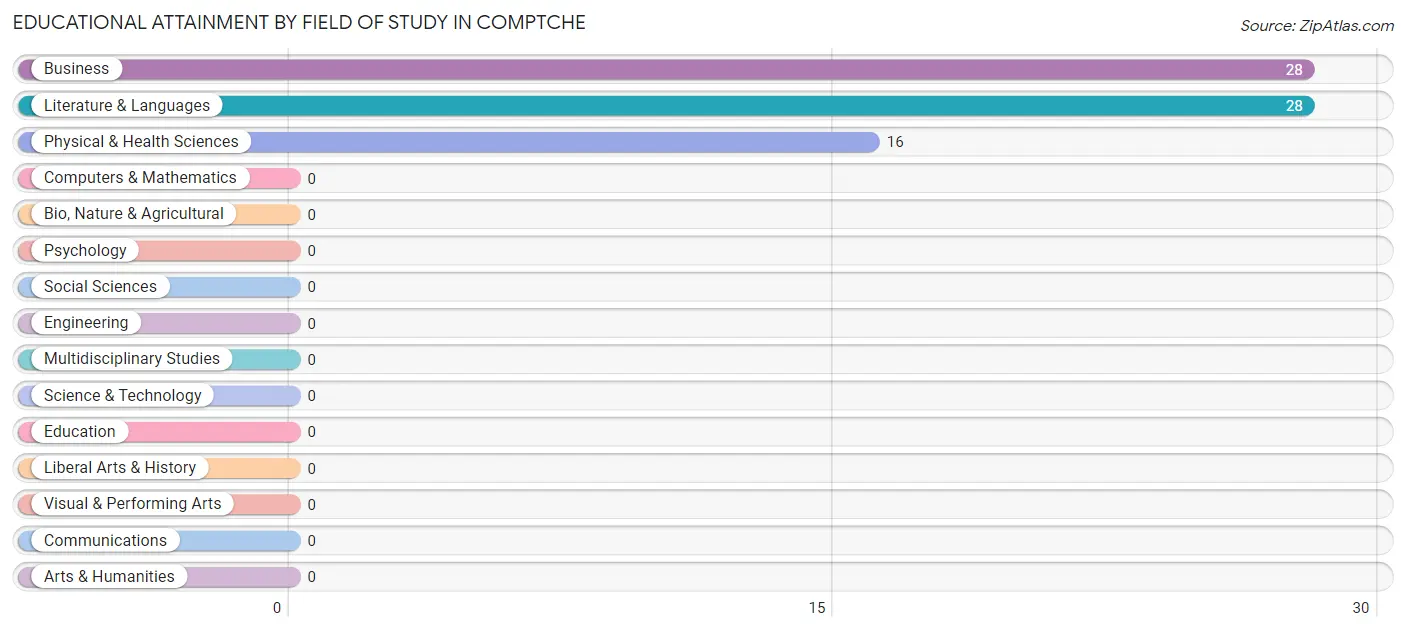
| Field of Study | # Graduates | % Graduates |
| Computers & Mathematics | 0 | 0.0% |
| Bio, Nature & Agricultural | 0 | 0.0% |
| Physical & Health Sciences | 16 | 22.2% |
| Psychology | 0 | 0.0% |
| Social Sciences | 0 | 0.0% |
| Engineering | 0 | 0.0% |
| Multidisciplinary Studies | 0 | 0.0% |
| Science & Technology | 0 | 0.0% |
| Business | 28 | 38.9% |
| Education | 0 | 0.0% |
| Literature & Languages | 28 | 38.9% |
| Liberal Arts & History | 0 | 0.0% |
| Visual & Performing Arts | 0 | 0.0% |
| Communications | 0 | 0.0% |
| Arts & Humanities | 0 | 0.0% |
| Total | 72 | 100.0% |
Transportation & Commute in Comptche
Vehicle Availability by Sex in Comptche
The most prevalent vehicle ownership categories in Comptche are males with 3 vehicles (16, accounting for 100.0%) and females with 3 vehicles (15, making up 30.2%).
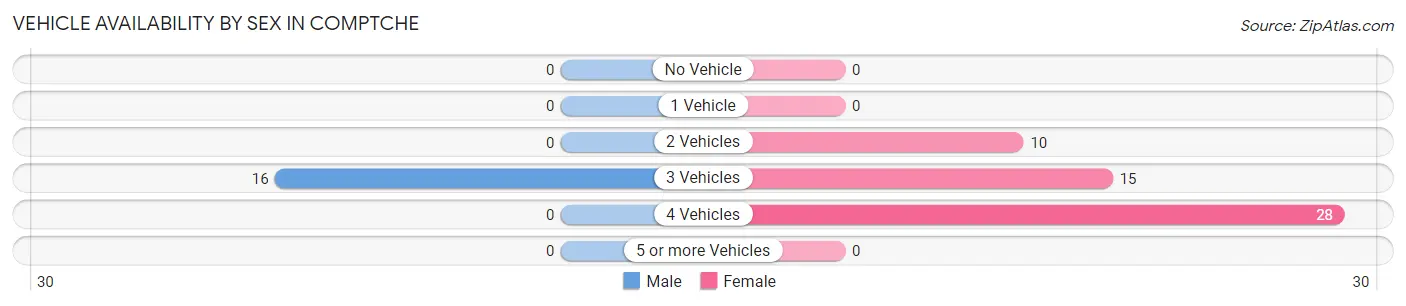
| Vehicles Available | Male | Female |
| No Vehicle | 0 (0.0%) | 0 (0.0%) |
| 1 Vehicle | 0 (0.0%) | 0 (0.0%) |
| 2 Vehicles | 0 (0.0%) | 10 (18.9%) |
| 3 Vehicles | 16 (100.0%) | 15 (28.3%) |
| 4 Vehicles | 0 (0.0%) | 28 (52.8%) |
| 5 or more Vehicles | 0 (0.0%) | 0 (0.0%) |
| Total | 16 (100.0%) | 53 (100.0%) |
Commute Time in Comptche
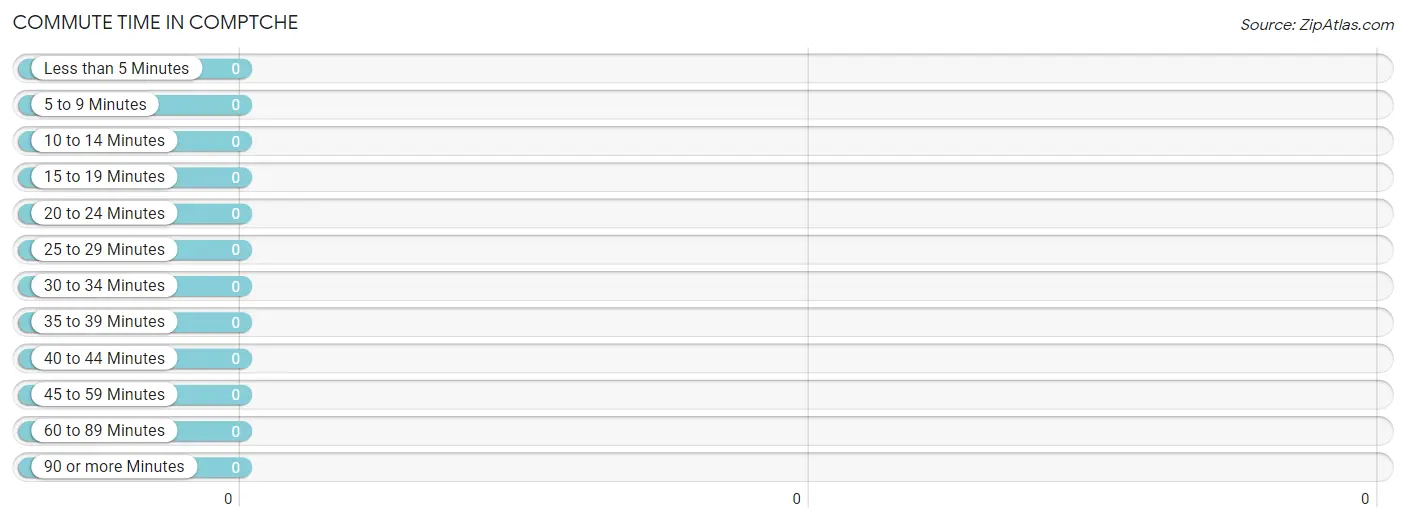
| Commute Time | # Commuters | % Commuters |
| Less than 5 Minutes | 0 | 0.0% |
| 5 to 9 Minutes | 0 | 0.0% |
| 10 to 14 Minutes | 0 | 0.0% |
| 15 to 19 Minutes | 0 | 0.0% |
| 20 to 24 Minutes | 0 | 0.0% |
| 25 to 29 Minutes | 0 | 0.0% |
| 30 to 34 Minutes | 0 | 0.0% |
| 35 to 39 Minutes | 0 | 0.0% |
| 40 to 44 Minutes | 0 | 0.0% |
| 45 to 59 Minutes | 0 | 0.0% |
| 60 to 89 Minutes | 0 | 0.0% |
| 90 or more Minutes | 0 | 0.0% |
Commute Time by Sex in Comptche
| Commute Time | Male | Female |
| Less than 5 Minutes | 0 (0.0%) | 0 (0.0%) |
| 5 to 9 Minutes | 0 (0.0%) | 0 (0.0%) |
| 10 to 14 Minutes | 0 (0.0%) | 0 (0.0%) |
| 15 to 19 Minutes | 0 (0.0%) | 0 (0.0%) |
| 20 to 24 Minutes | 0 (0.0%) | 0 (0.0%) |
| 25 to 29 Minutes | 0 (0.0%) | 0 (0.0%) |
| 30 to 34 Minutes | 0 (0.0%) | 0 (0.0%) |
| 35 to 39 Minutes | 0 (0.0%) | 0 (0.0%) |
| 40 to 44 Minutes | 0 (0.0%) | 0 (0.0%) |
| 45 to 59 Minutes | 0 (0.0%) | 0 (0.0%) |
| 60 to 89 Minutes | 0 (0.0%) | 0 (0.0%) |
| 90 or more Minutes | 0 (0.0%) | 0 (0.0%) |
Time of Departure to Work by Sex in Comptche
| Time of Departure | Male | Female |
| 12:00 AM to 4:59 AM | 0 (0.0%) | 0 (0.0%) |
| 5:00 AM to 5:29 AM | 0 (0.0%) | 0 (0.0%) |
| 5:30 AM to 5:59 AM | 0 (0.0%) | 0 (0.0%) |
| 6:00 AM to 6:29 AM | 0 (0.0%) | 0 (0.0%) |
| 6:30 AM to 6:59 AM | 0 (0.0%) | 0 (0.0%) |
| 7:00 AM to 7:29 AM | 0 (0.0%) | 0 (0.0%) |
| 7:30 AM to 7:59 AM | 0 (0.0%) | 0 (0.0%) |
| 8:00 AM to 8:29 AM | 0 (0.0%) | 0 (0.0%) |
| 8:30 AM to 8:59 AM | 0 (0.0%) | 0 (0.0%) |
| 9:00 AM to 9:59 AM | 0 (0.0%) | 0 (0.0%) |
| 10:00 AM to 10:59 AM | 0 (0.0%) | 0 (0.0%) |
| 11:00 AM to 11:59 AM | 0 (0.0%) | 0 (0.0%) |
| 12:00 PM to 3:59 PM | 0 (0.0%) | 0 (0.0%) |
| 4:00 PM to 11:59 PM | 0 (0.0%) | 0 (0.0%) |
| Total | 0 (0.0%) | 0 (0.0%) |
Housing Occupancy in Comptche
Occupancy by Ownership in Comptche
Of the total 46 dwellings in Comptche, owner-occupied units account for 46 (100.0%), while renter-occupied units make up 0 (0.0%).
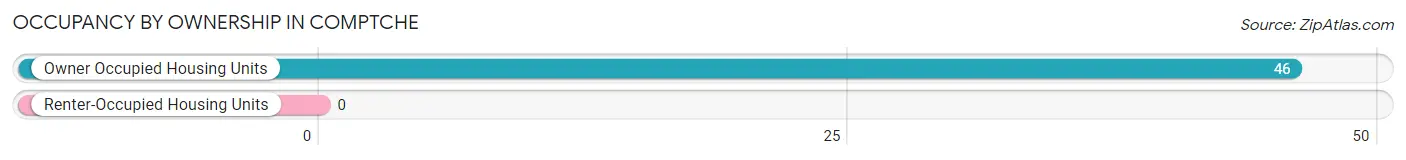
| Occupancy | # Housing Units | % Housing Units |
| Owner Occupied Housing Units | 46 | 100.0% |
| Renter-Occupied Housing Units | 0 | 0.0% |
| Total Occupied Housing Units | 46 | 100.0% |
Occupancy by Household Size in Comptche
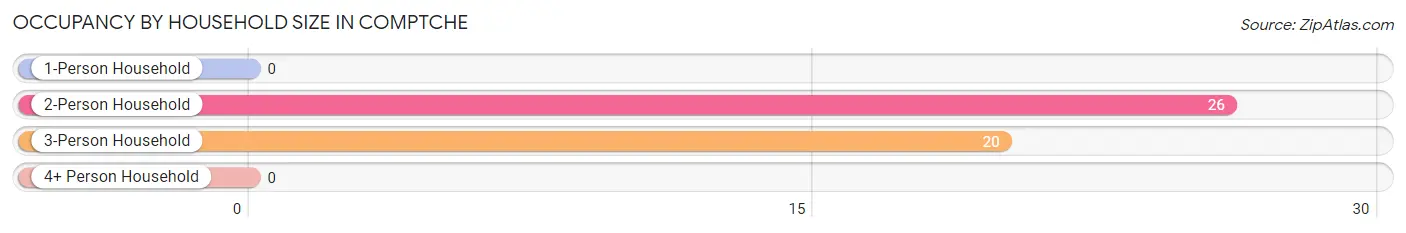
| Household Size | # Housing Units | % Housing Units |
| 1-Person Household | 0 | 0.0% |
| 2-Person Household | 26 | 56.5% |
| 3-Person Household | 20 | 43.5% |
| 4+ Person Household | 0 | 0.0% |
| Total Housing Units | 46 | 100.0% |
Occupancy by Ownership by Household Size in Comptche
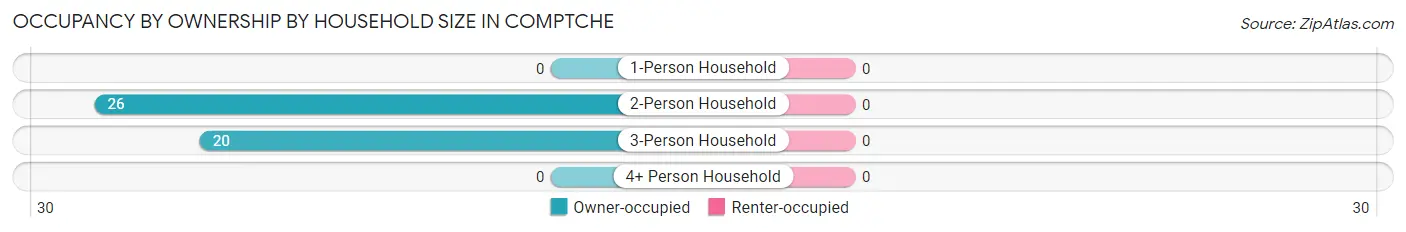
| Household Size | Owner-occupied | Renter-occupied |
| 1-Person Household | 0 (0.0%) | 0 (0.0%) |
| 2-Person Household | 26 (100.0%) | 0 (0.0%) |
| 3-Person Household | 20 (100.0%) | 0 (0.0%) |
| 4+ Person Household | 0 (0.0%) | 0 (0.0%) |
| Total Housing Units | 46 (100.0%) | 0 (0.0%) |
Occupancy by Educational Attainment in Comptche
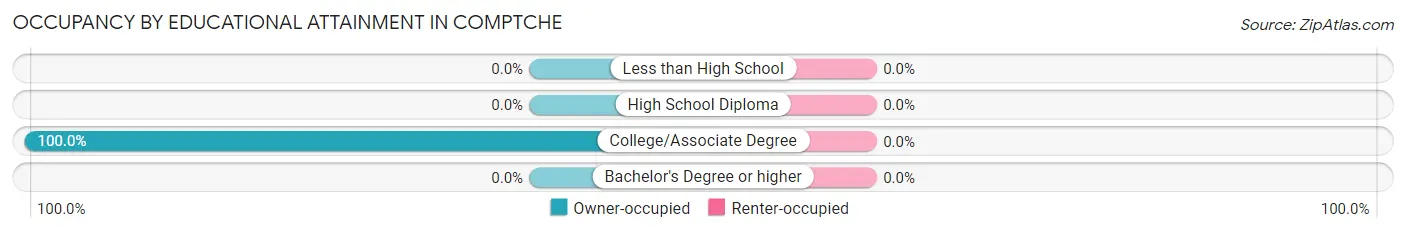
| Household Size | Owner-occupied | Renter-occupied |
| Less than High School | 0 (0.0%) | 0 (0.0%) |
| High School Diploma | 0 (0.0%) | 0 (0.0%) |
| College/Associate Degree | 46 (100.0%) | 0 (0.0%) |
| Bachelor's Degree or higher | 0 (0.0%) | 0 (0.0%) |
Occupancy by Age of Householder in Comptche
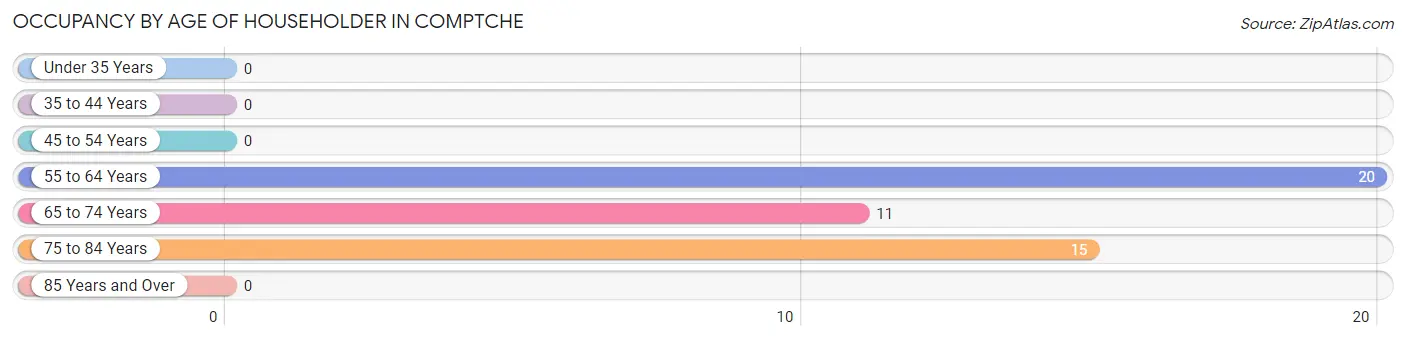
| Age Bracket | # Households | % Households |
| Under 35 Years | 0 | 0.0% |
| 35 to 44 Years | 0 | 0.0% |
| 45 to 54 Years | 0 | 0.0% |
| 55 to 64 Years | 20 | 43.5% |
| 65 to 74 Years | 11 | 23.9% |
| 75 to 84 Years | 15 | 32.6% |
| 85 Years and Over | 0 | 0.0% |
| Total | 46 | 100.0% |
Housing Finances in Comptche
Median Income by Occupancy in Comptche
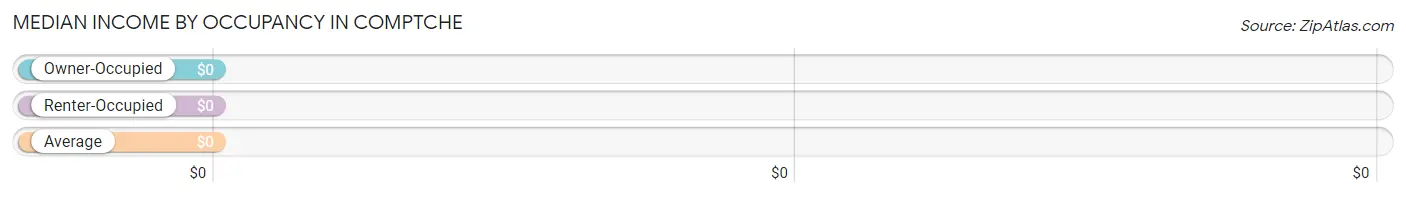
| Occupancy Type | # Households | Median Income |
| Owner-Occupied | 46 (100.0%) | $0 |
| Renter-Occupied | 0 (0.0%) | $0 |
| Average | 46 (100.0%) | $0 |
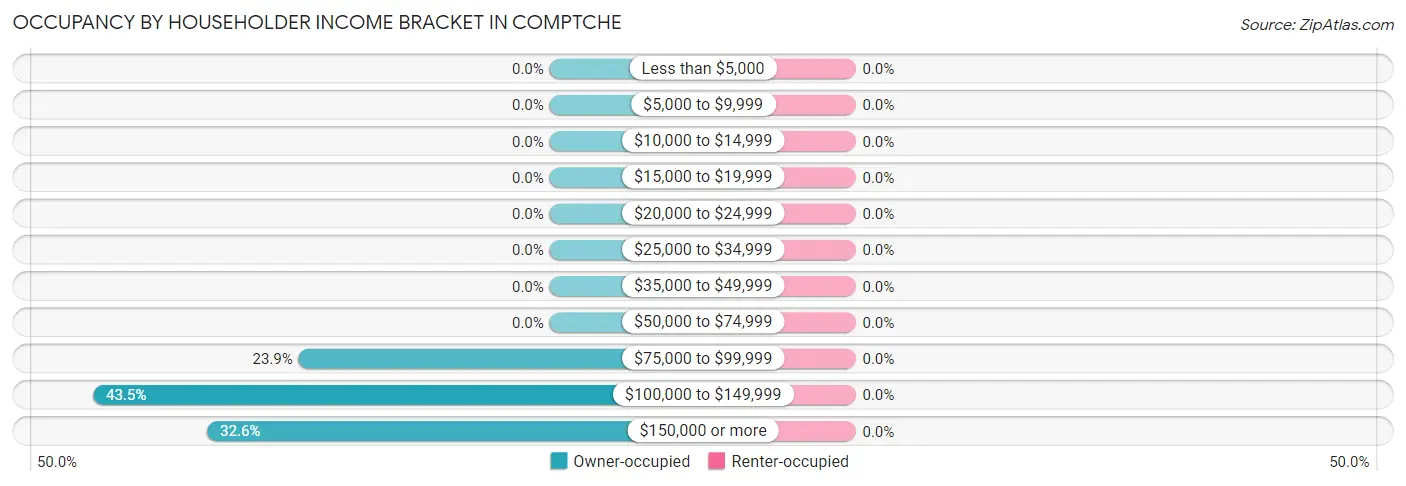
Occupancy by Householder Income Bracket in Comptche
| Income Bracket | Owner-occupied | Renter-occupied |
| Less than $5,000 | 0 (0.0%) | 0 (0.0%) |
| $5,000 to $9,999 | 0 (0.0%) | 0 (0.0%) |
| $10,000 to $14,999 | 0 (0.0%) | 0 (0.0%) |
| $15,000 to $19,999 | 0 (0.0%) | 0 (0.0%) |
| $20,000 to $24,999 | 0 (0.0%) | 0 (0.0%) |
| $25,000 to $34,999 | 0 (0.0%) | 0 (0.0%) |
| $35,000 to $49,999 | 0 (0.0%) | 0 (0.0%) |
| $50,000 to $74,999 | 0 (0.0%) | 0 (0.0%) |
| $75,000 to $99,999 | 11 (23.9%) | 0 (0.0%) |
| $100,000 to $149,999 | 20 (43.5%) | 0 (0.0%) |
| $150,000 or more | 15 (32.6%) | 0 (0.0%) |
| Total | 46 (100.0%) | 0 (0.0%) |
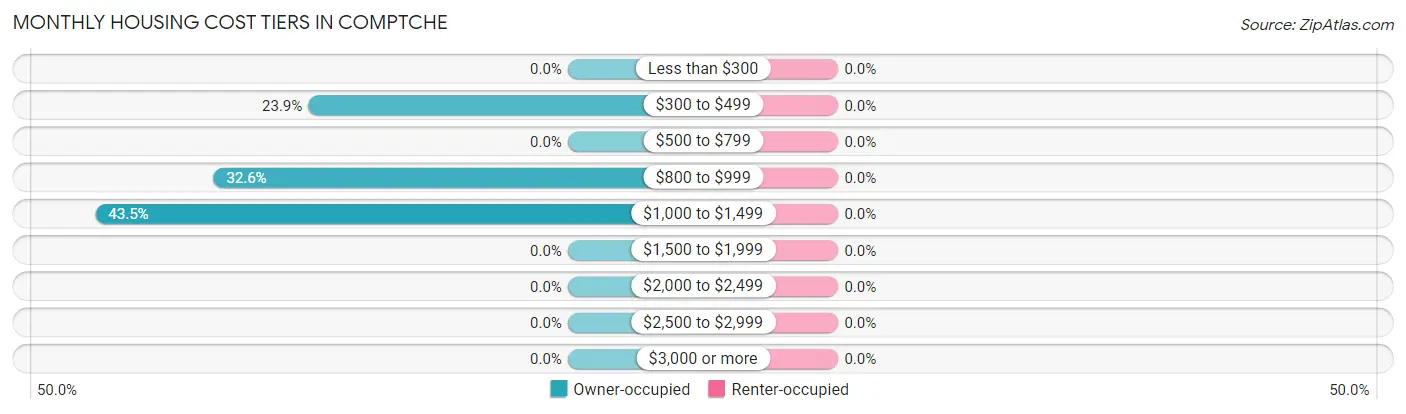
Monthly Housing Cost Tiers in Comptche
| Monthly Cost | Owner-occupied | Renter-occupied |
| Less than $300 | 0 (0.0%) | 0 (0.0%) |
| $300 to $499 | 11 (23.9%) | 0 (0.0%) |
| $500 to $799 | 0 (0.0%) | 0 (0.0%) |
| $800 to $999 | 15 (32.6%) | 0 (0.0%) |
| $1,000 to $1,499 | 20 (43.5%) | 0 (0.0%) |
| $1,500 to $1,999 | 0 (0.0%) | 0 (0.0%) |
| $2,000 to $2,499 | 0 (0.0%) | 0 (0.0%) |
| $2,500 to $2,999 | 0 (0.0%) | 0 (0.0%) |
| $3,000 or more | 0 (0.0%) | 0 (0.0%) |
| Total | 46 (100.0%) | 0 (0.0%) |
Physical Housing Characteristics in Comptche
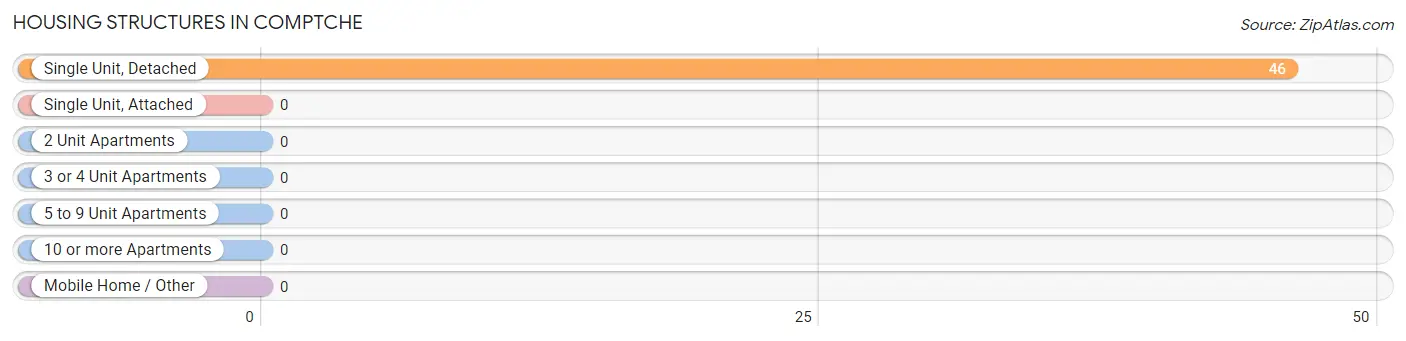
Housing Structures in Comptche
| Structure Type | # Housing Units | % Housing Units |
| Single Unit, Detached | 46 | 100.0% |
| Single Unit, Attached | 0 | 0.0% |
| 2 Unit Apartments | 0 | 0.0% |
| 3 or 4 Unit Apartments | 0 | 0.0% |
| 5 to 9 Unit Apartments | 0 | 0.0% |
| 10 or more Apartments | 0 | 0.0% |
| Mobile Home / Other | 0 | 0.0% |
| Total | 46 | 100.0% |
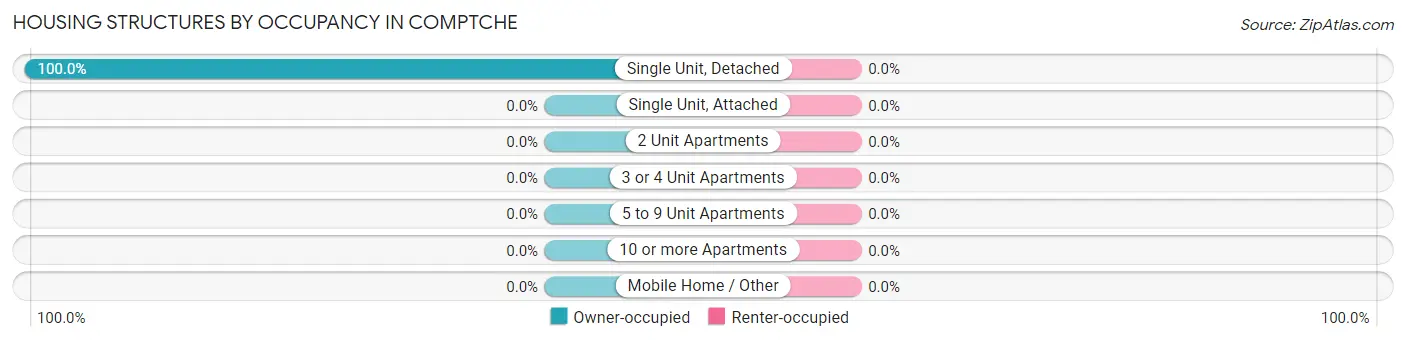
Housing Structures by Occupancy in Comptche
| Structure Type | Owner-occupied | Renter-occupied |
| Single Unit, Detached | 46 (100.0%) | 0 (0.0%) |
| Single Unit, Attached | 0 (0.0%) | 0 (0.0%) |
| 2 Unit Apartments | 0 (0.0%) | 0 (0.0%) |
| 3 or 4 Unit Apartments | 0 (0.0%) | 0 (0.0%) |
| 5 to 9 Unit Apartments | 0 (0.0%) | 0 (0.0%) |
| 10 or more Apartments | 0 (0.0%) | 0 (0.0%) |
| Mobile Home / Other | 0 (0.0%) | 0 (0.0%) |
| Total | 46 (100.0%) | 0 (0.0%) |
Housing Structures by Number of Rooms in Comptche
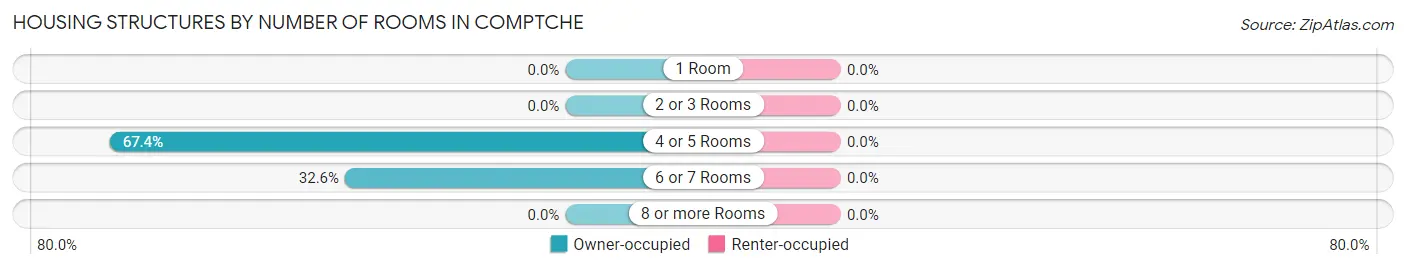
| Number of Rooms | Owner-occupied | Renter-occupied |
| 1 Room | 0 (0.0%) | 0 (0.0%) |
| 2 or 3 Rooms | 0 (0.0%) | 0 (0.0%) |
| 4 or 5 Rooms | 31 (67.4%) | 0 (0.0%) |
| 6 or 7 Rooms | 15 (32.6%) | 0 (0.0%) |
| 8 or more Rooms | 0 (0.0%) | 0 (0.0%) |
| Total | 46 (100.0%) | 0 (0.0%) |
Housing Structure by Heating Type in Comptche
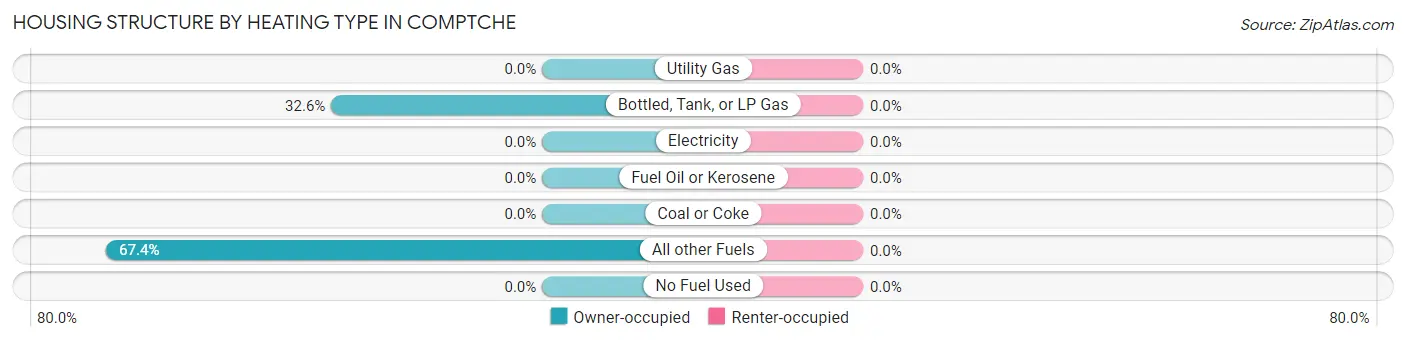
| Heating Type | Owner-occupied | Renter-occupied |
| Utility Gas | 0 (0.0%) | 0 (0.0%) |
| Bottled, Tank, or LP Gas | 15 (32.6%) | 0 (0.0%) |
| Electricity | 0 (0.0%) | 0 (0.0%) |
| Fuel Oil or Kerosene | 0 (0.0%) | 0 (0.0%) |
| Coal or Coke | 0 (0.0%) | 0 (0.0%) |
| All other Fuels | 31 (67.4%) | 0 (0.0%) |
| No Fuel Used | 0 (0.0%) | 0 (0.0%) |
| Total | 46 (100.0%) | 0 (0.0%) |
Household Vehicle Usage in Comptche
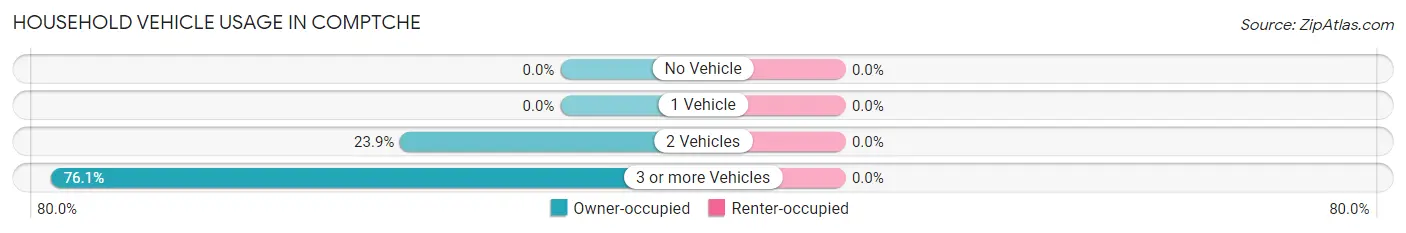
| Vehicles per Household | Owner-occupied | Renter-occupied |
| No Vehicle | 0 (0.0%) | 0 (0.0%) |
| 1 Vehicle | 0 (0.0%) | 0 (0.0%) |
| 2 Vehicles | 11 (23.9%) | 0 (0.0%) |
| 3 or more Vehicles | 35 (76.1%) | 0 (0.0%) |
| Total | 46 (100.0%) | 0 (0.0%) |
Real Estate & Mortgages in Comptche
Real Estate and Mortgage Overview in Comptche
| Characteristic | Without Mortgage | With Mortgage |
| Housing Units | 46 | 0 |
| Median Property Value | - | - |
| Median Household Income | - | - |
| Monthly Housing Costs | $880 | $0 |
| Real Estate Taxes | $1,900 | $0 |
Property Value by Mortgage Status in Comptche
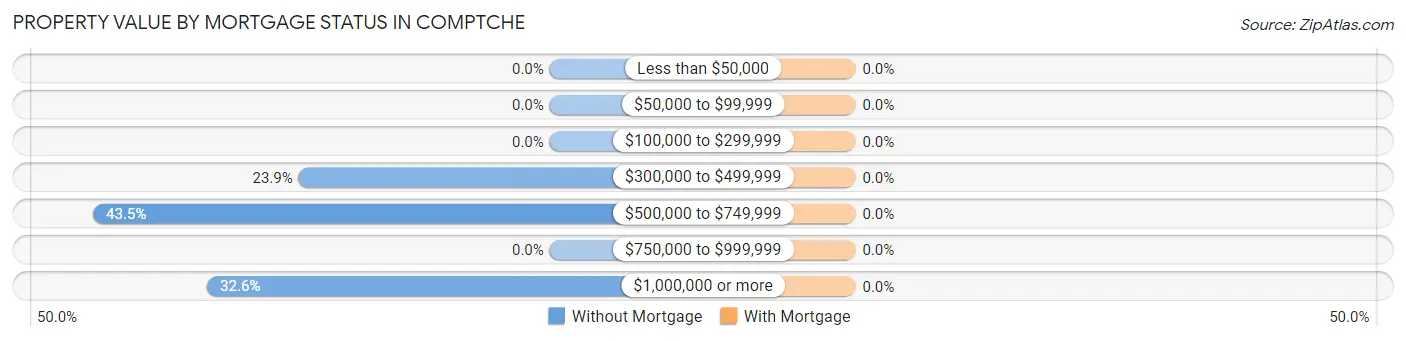
| Property Value | Without Mortgage | With Mortgage |
| Less than $50,000 | 0 (0.0%) | 0 (0.0%) |
| $50,000 to $99,999 | 0 (0.0%) | 0 (0.0%) |
| $100,000 to $299,999 | 0 (0.0%) | 0 (0.0%) |
| $300,000 to $499,999 | 11 (23.9%) | 0 (0.0%) |
| $500,000 to $749,999 | 20 (43.5%) | 0 (0.0%) |
| $750,000 to $999,999 | 0 (0.0%) | 0 (0.0%) |
| $1,000,000 or more | 15 (32.6%) | 0 (0.0%) |
| Total | 46 (100.0%) | 0 (0.0%) |
Household Income by Mortgage Status in Comptche
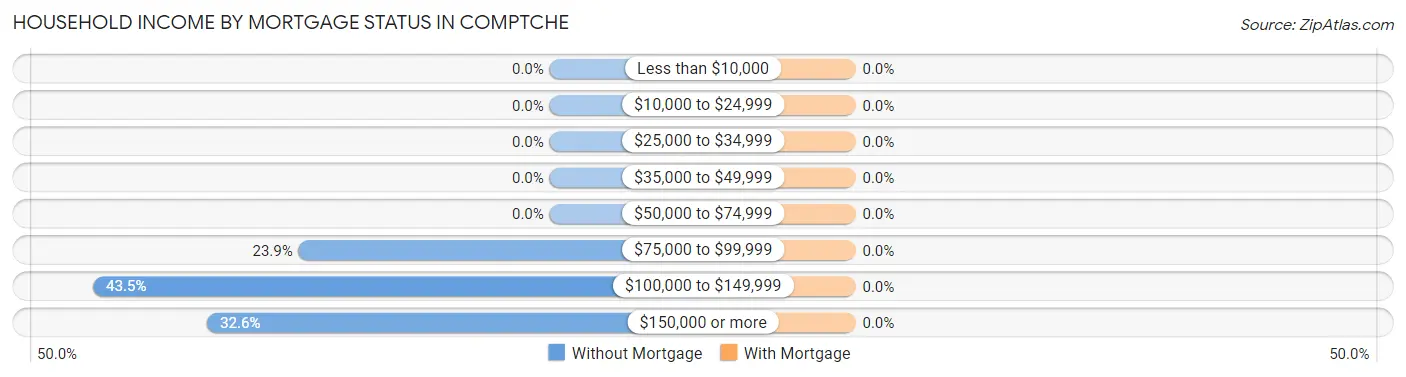
| Household Income | Without Mortgage | With Mortgage |
| Less than $10,000 | 0 (0.0%) | 0 (0.0%) |
| $10,000 to $24,999 | 0 (0.0%) | 0 (0.0%) |
| $25,000 to $34,999 | 0 (0.0%) | 0 (0.0%) |
| $35,000 to $49,999 | 0 (0.0%) | 0 (0.0%) |
| $50,000 to $74,999 | 0 (0.0%) | 0 (0.0%) |
| $75,000 to $99,999 | 11 (23.9%) | 0 (0.0%) |
| $100,000 to $149,999 | 20 (43.5%) | 0 (0.0%) |
| $150,000 or more | 15 (32.6%) | 0 (0.0%) |
| Total | 46 (100.0%) | 0 (0.0%) |
Property Value to Household Income Ratio in Comptche
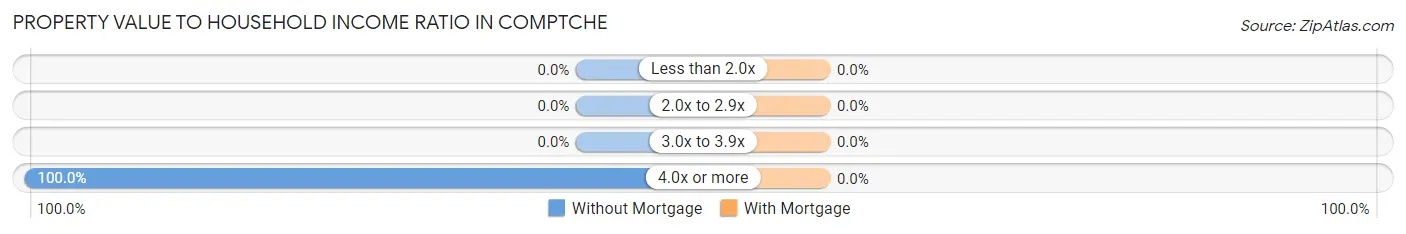
| Value-to-Income Ratio | Without Mortgage | With Mortgage |
| Less than 2.0x | 0 (0.0%) | 0 (0.0%) |
| 2.0x to 2.9x | 0 (0.0%) | 0 (0.0%) |
| 3.0x to 3.9x | 0 (0.0%) | 0 (0.0%) |
| 4.0x or more | 46 (100.0%) | 0 (0.0%) |
| Total | 46 (100.0%) | 0 (0.0%) |
Real Estate Taxes by Mortgage Status in Comptche
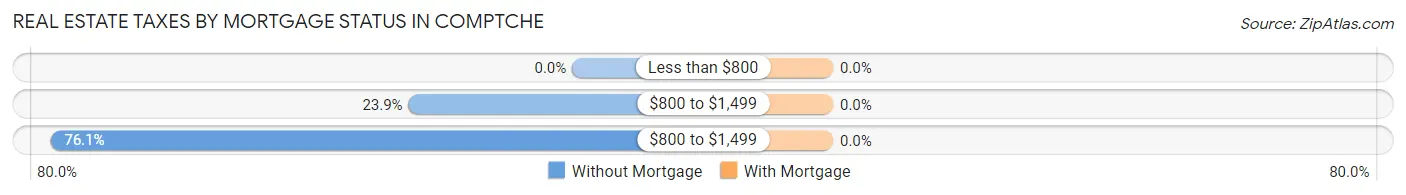
| Property Taxes | Without Mortgage | With Mortgage |
| Less than $800 | 0 (0.0%) | 0 (0.0%) |
| $800 to $1,499 | 11 (23.9%) | 0 (0.0%) |
| $800 to $1,499 | 35 (76.1%) | 0 (0.0%) |
| Total | 46 (100.0%) | 0 (0.0%) |
Health & Disability in Comptche
Health Insurance Coverage by Age in Comptche
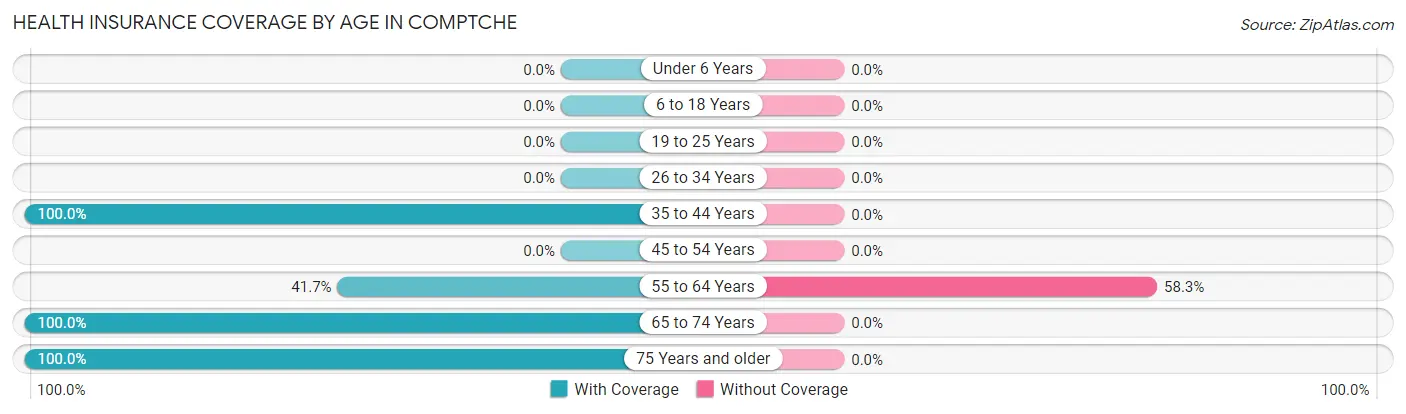
| Age Bracket | With Coverage | Without Coverage |
| Under 6 Years | 0 (0.0%) | 0 (0.0%) |
| 6 to 18 Years | 0 (0.0%) | 0 (0.0%) |
| 19 to 25 Years | 0 (0.0%) | 0 (0.0%) |
| 26 to 34 Years | 0 (0.0%) | 0 (0.0%) |
| 35 to 44 Years | 28 (100.0%) | 0 (0.0%) |
| 45 to 54 Years | 0 (0.0%) | 0 (0.0%) |
| 55 to 64 Years | 20 (41.7%) | 28 (58.3%) |
| 65 to 74 Years | 21 (100.0%) | 0 (0.0%) |
| 75 Years and older | 31 (100.0%) | 0 (0.0%) |
| Total | 100 (78.1%) | 28 (21.9%) |
Health Insurance Coverage by Citizenship Status in Comptche
| Citizenship Status | With Coverage | Without Coverage |
| Native Born | 0 (0.0%) | 0 (0.0%) |
| Foreign Born, Citizen | 0 (0.0%) | 0 (0.0%) |
| Foreign Born, not a Citizen | 0 (0.0%) | 0 (0.0%) |
Health Insurance Coverage by Household Income in Comptche
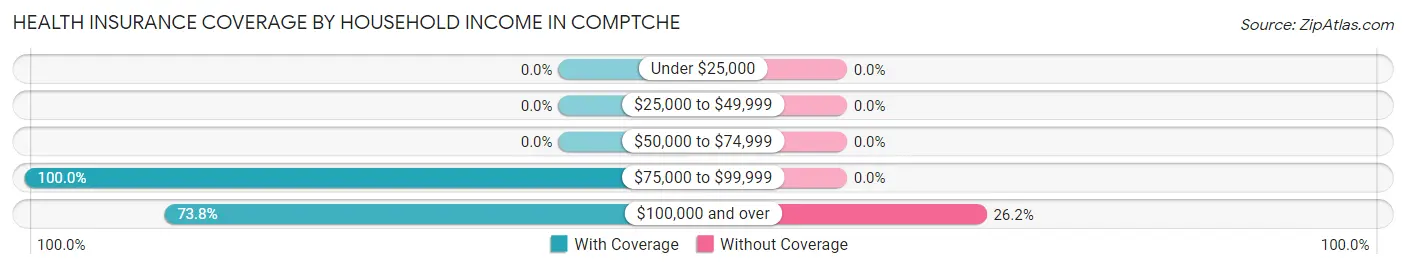
| Household Income | With Coverage | Without Coverage |
| Under $25,000 | 0 (0.0%) | 0 (0.0%) |
| $25,000 to $49,999 | 0 (0.0%) | 0 (0.0%) |
| $50,000 to $74,999 | 0 (0.0%) | 0 (0.0%) |
| $75,000 to $99,999 | 21 (100.0%) | 0 (0.0%) |
| $100,000 and over | 79 (73.8%) | 28 (26.2%) |
Public vs Private Health Insurance Coverage by Age in Comptche
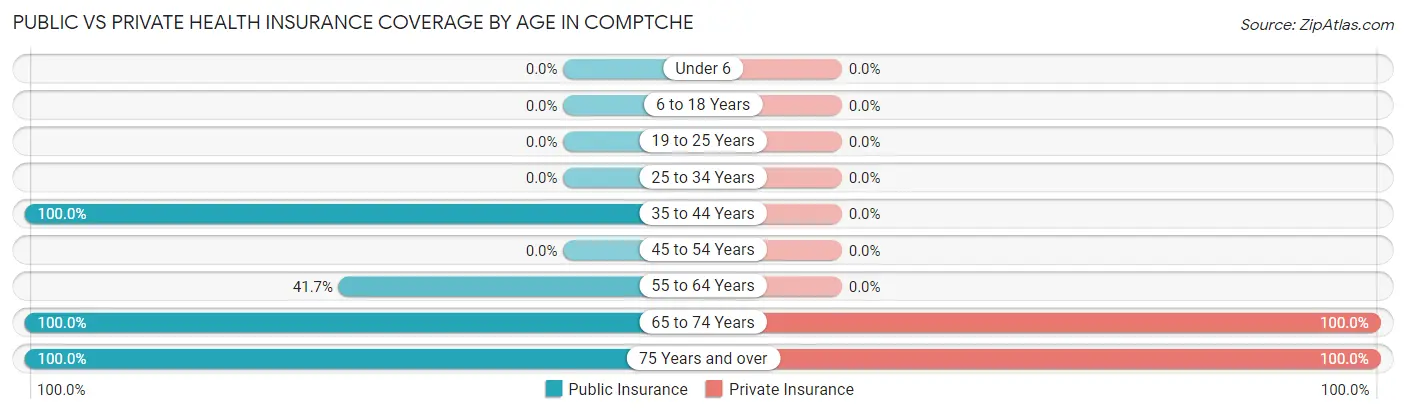
| Age Bracket | Public Insurance | Private Insurance |
| Under 6 | 0 (0.0%) | 0 (0.0%) |
| 6 to 18 Years | 0 (0.0%) | 0 (0.0%) |
| 19 to 25 Years | 0 (0.0%) | 0 (0.0%) |
| 25 to 34 Years | 0 (0.0%) | 0 (0.0%) |
| 35 to 44 Years | 28 (100.0%) | 0 (0.0%) |
| 45 to 54 Years | 0 (0.0%) | 0 (0.0%) |
| 55 to 64 Years | 20 (41.7%) | 0 (0.0%) |
| 65 to 74 Years | 21 (100.0%) | 21 (100.0%) |
| 75 Years and over | 31 (100.0%) | 31 (100.0%) |
| Total | 100 (78.1%) | 52 (40.6%) |
Disability Status by Sex by Age in Comptche
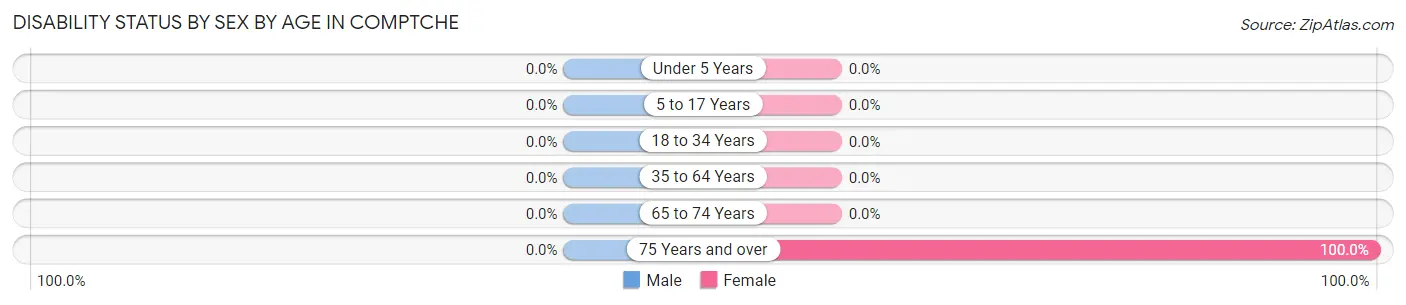
| Age Bracket | Male | Female |
| Under 5 Years | 0 (0.0%) | 0 (0.0%) |
| 5 to 17 Years | 0 (0.0%) | 0 (0.0%) |
| 18 to 34 Years | 0 (0.0%) | 0 (0.0%) |
| 35 to 64 Years | 0 (0.0%) | 0 (0.0%) |
| 65 to 74 Years | 0 (0.0%) | 0 (0.0%) |
| 75 Years and over | 0 (0.0%) | 15 (100.0%) |
Disability Class by Sex by Age in Comptche
Disability Class: Hearing Difficulty
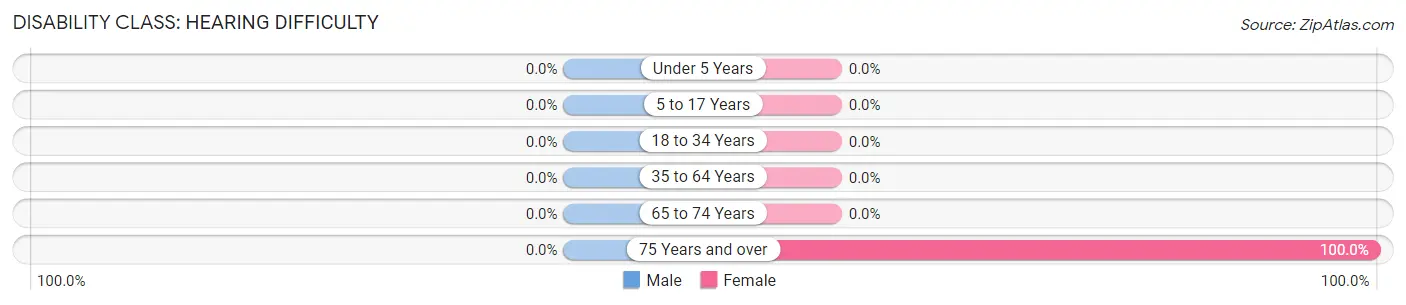
| Age Bracket | Male | Female |
| Under 5 Years | 0 (0.0%) | 0 (0.0%) |
| 5 to 17 Years | 0 (0.0%) | 0 (0.0%) |
| 18 to 34 Years | 0 (0.0%) | 0 (0.0%) |
| 35 to 64 Years | 0 (0.0%) | 0 (0.0%) |
| 65 to 74 Years | 0 (0.0%) | 0 (0.0%) |
| 75 Years and over | 0 (0.0%) | 15 (100.0%) |
Disability Class: Vision Difficulty
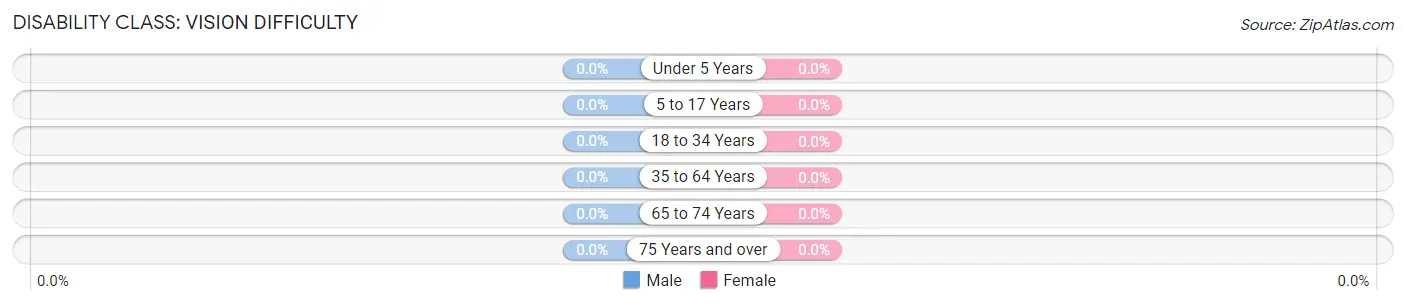
| Age Bracket | Male | Female |
| Under 5 Years | 0 (0.0%) | 0 (0.0%) |
| 5 to 17 Years | 0 (0.0%) | 0 (0.0%) |
| 18 to 34 Years | 0 (0.0%) | 0 (0.0%) |
| 35 to 64 Years | 0 (0.0%) | 0 (0.0%) |
| 65 to 74 Years | 0 (0.0%) | 0 (0.0%) |
| 75 Years and over | 0 (0.0%) | 0 (0.0%) |
Disability Class: Cognitive Difficulty

| Age Bracket | Male | Female |
| 5 to 17 Years | 0 (0.0%) | 0 (0.0%) |
| 18 to 34 Years | 0 (0.0%) | 0 (0.0%) |
| 35 to 64 Years | 0 (0.0%) | 0 (0.0%) |
| 65 to 74 Years | 0 (0.0%) | 0 (0.0%) |
| 75 Years and over | 0 (0.0%) | 0 (0.0%) |
Disability Class: Ambulatory Difficulty
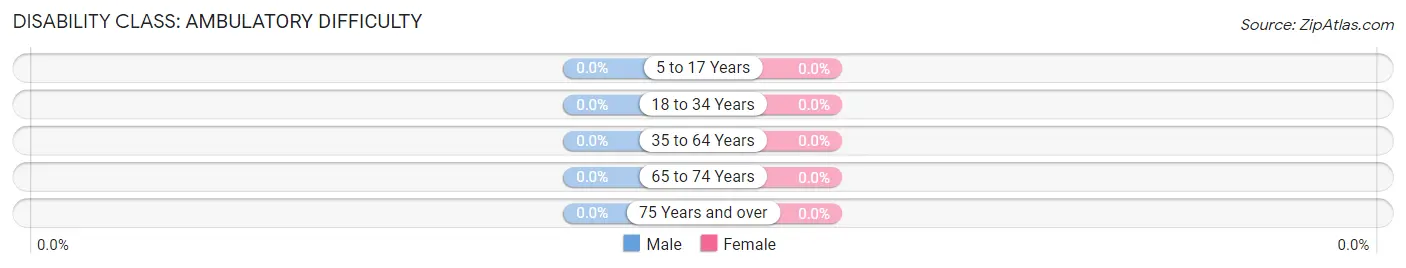
| Age Bracket | Male | Female |
| 5 to 17 Years | 0 (0.0%) | 0 (0.0%) |
| 18 to 34 Years | 0 (0.0%) | 0 (0.0%) |
| 35 to 64 Years | 0 (0.0%) | 0 (0.0%) |
| 65 to 74 Years | 0 (0.0%) | 0 (0.0%) |
| 75 Years and over | 0 (0.0%) | 0 (0.0%) |
Disability Class: Self-Care Difficulty
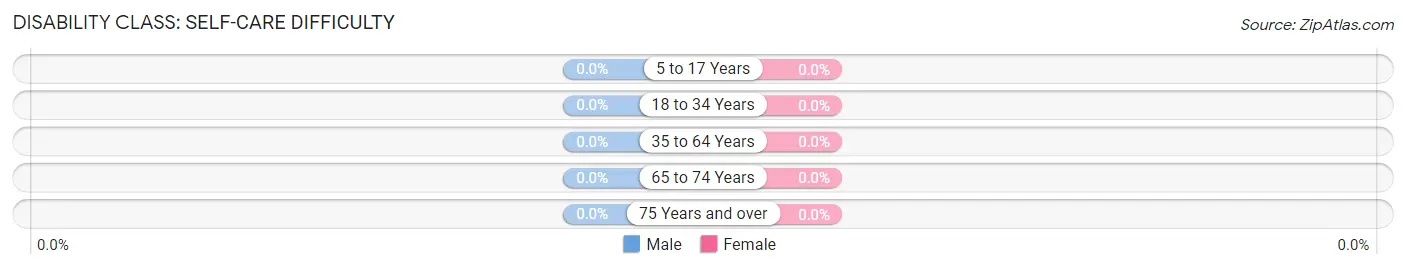
| Age Bracket | Male | Female |
| 5 to 17 Years | 0 (0.0%) | 0 (0.0%) |
| 18 to 34 Years | 0 (0.0%) | 0 (0.0%) |
| 35 to 64 Years | 0 (0.0%) | 0 (0.0%) |
| 65 to 74 Years | 0 (0.0%) | 0 (0.0%) |
| 75 Years and over | 0 (0.0%) | 0 (0.0%) |
Technology Access in Comptche
Computing Device Access in Comptche
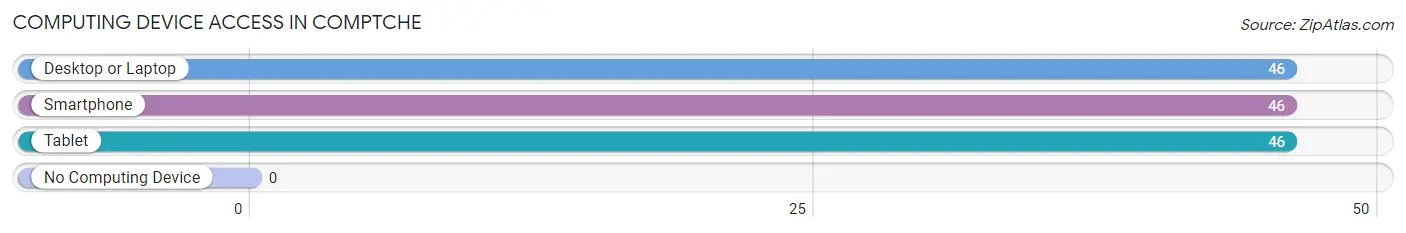
| Device Type | # Households | % Households |
| Desktop or Laptop | 46 | 100.0% |
| Smartphone | 46 | 100.0% |
| Tablet | 46 | 100.0% |
| No Computing Device | 0 | 0.0% |
| Total | 46 | 100.0% |
Internet Access in Comptche
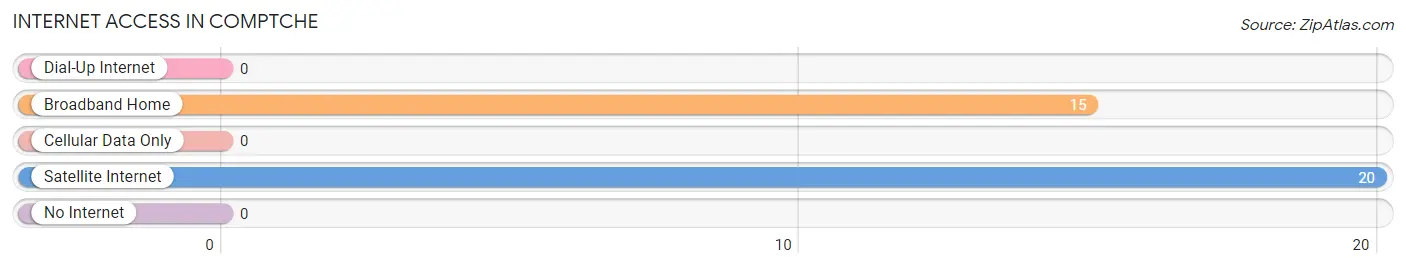
| Internet Type | # Households | % Households |
| Dial-Up Internet | 0 | 0.0% |
| Broadband Home | 15 | 32.6% |
| Cellular Data Only | 0 | 0.0% |
| Satellite Internet | 20 | 43.5% |
| No Internet | 0 | 0.0% |
| Total | 46 | 100.0% |
Comptche Summary
Comptche is a small unincorporated community located in Mendocino County, California. It is situated in the coastal hills of the Anderson Valley, approximately 10 miles east of the town of Mendocino. The population of Comptche was estimated to be around 200 people in 2020.
History
The area that is now Comptche was originally inhabited by the Pomo people, who lived in the area for thousands of years before the arrival of Europeans. The first Europeans to settle in the area were Russian fur traders, who established a trading post in the area in the early 19th century. The area was later settled by American settlers in the 1850s, who established a small logging community. The town was originally known as "Anderson Valley," but was later renamed "Comptche" after a local Pomo chief.
The town of Comptche was officially incorporated in 1876, and the first post office was established in 1877. The town grew slowly over the next several decades, and by the early 20th century, it had become a popular tourist destination. The town was also home to a number of small businesses, including a general store, a blacksmith shop, and a sawmill.
Geography
Comptche is located in the coastal hills of the Anderson Valley, approximately 10 miles east of the town of Mendocino. The town is situated at an elevation of approximately 1,000 feet above sea level. The area is characterized by rolling hills, dense forests, and numerous creeks and streams. The climate in Comptche is mild and temperate, with average temperatures ranging from the mid-50s to the mid-70s throughout the year.
Economy
The economy of Comptche is largely based on tourism and agriculture. The town is home to a number of small businesses, including a general store, a blacksmith shop, and a sawmill. The town is also home to a number of wineries and vineyards, which produce a variety of wines. In addition, the town is home to a number of small farms, which produce a variety of fruits and vegetables.
Demographics
The population of Comptche was estimated to be around 200 people in 2020. The town is predominantly white, with approximately 95% of the population identifying as Caucasian. The median household income in Comptche is approximately $50,000, and the median home value is approximately $400,000. The town is served by a single school district, the Anderson Valley Unified School District.
Conclusion
Comptche is a small unincorporated community located in Mendocino County, California. It is situated in the coastal hills of the Anderson Valley, approximately 10 miles east of the town of Mendocino. The population of Comptche was estimated to be around 200 people in 2020. The economy of Comptche is largely based on tourism and agriculture, and the town is predominantly white, with approximately 95% of the population identifying as Caucasian. The median household income in Comptche is approximately $50,000, and the median home value is approximately $400,000. Comptche is a peaceful and picturesque community, and is a popular destination for tourists and outdoor enthusiasts alike.
Common Questions
What is Per Capita Income in Comptche?
Per Capita income in Comptche is $61,987.
What is Inequality or Gini Index in Comptche?
Inequality or Gini Index in Comptche is 0.24.
What is the Total Population of Comptche?
Total Population of Comptche is 128.
What is the Total Male Population of Comptche?
Total Male Population of Comptche is 47.
What is the Total Female Population of Comptche?
Total Female Population of Comptche is 81.
What is the Ratio of Males per 100 Females in Comptche?
There are 58.02 Males per 100 Females in Comptche.
What is the Ratio of Females per 100 Males in Comptche?
There are 172.34 Females per 100 Males in Comptche.
What is the Median Population Age in Comptche?
Median Population Age in Comptche is 63.6 Years.
What is the Average Family Size in Comptche
Average Family Size in Comptche is 2.2 People.
What is the Average Household Size in Comptche
Average Household Size in Comptche is 2.8 People.
How Large is the Labor Force in Comptche?
There are 80 People in the Labor Forcein in Comptche.
What is the Percentage of People in the Labor Force in Comptche?
62.5% of People are in the Labor Force in Comptche.