Norris Canyon, CA Map & Demographics
Norris Canyon Map
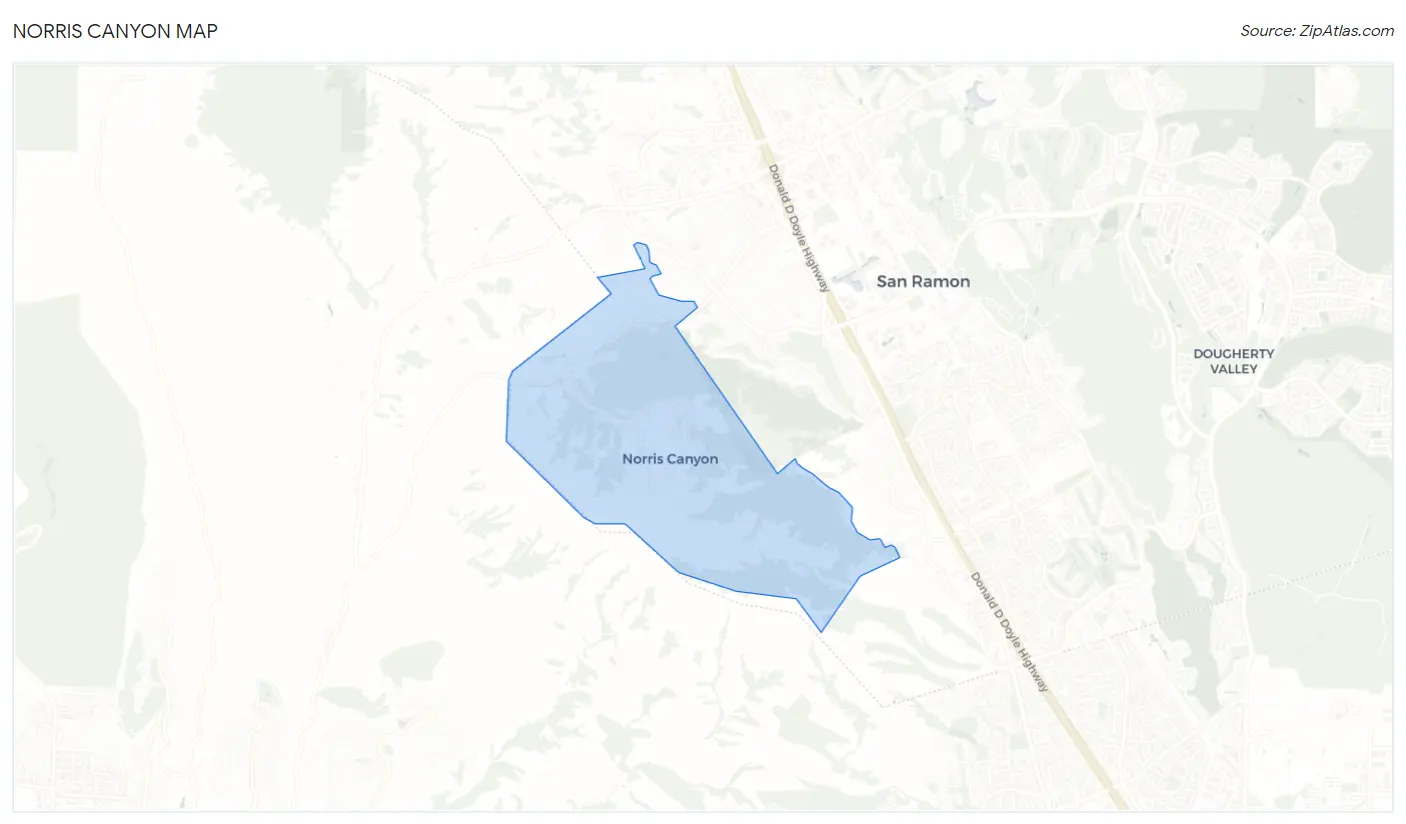
Norris Canyon Overview
$118,914
PER CAPITA INCOME
$250,001
AVG FAMILY INCOME
$250,001
AVG HOUSEHOLD INCOME
67.2%
WAGE / INCOME GAP [ % ]
32.8¢/ $1
WAGE / INCOME GAP [ $ ]
0.42
INEQUALITY / GINI INDEX
954
TOTAL POPULATION
477
MALE POPULATION
477
FEMALE POPULATION
100.00
MALES / 100 FEMALES
100.00
FEMALES / 100 MALES
48.4
MEDIAN AGE
3.8
AVG FAMILY SIZE
3.4
AVG HOUSEHOLD SIZE
485
LABOR FORCE [ PEOPLE ]
60.4%
PERCENT IN LABOR FORCE
6.4%
UNEMPLOYMENT RATE
Income in Norris Canyon
Income Overview in Norris Canyon
Per Capita Income in Norris Canyon is $118,914, while median incomes of families and households are $250,001 and $250,001 respectively.
| Characteristic | Number | Measure |
| Per Capita Income | 954 | $118,914 |
| Median Family Income | 216 | $250,001 |
| Mean Family Income | 216 | $439,818 |
| Median Household Income | 283 | $250,001 |
| Mean Household Income | 283 | $415,803 |
| Income Deficit | 216 | $0 |
| Wage / Income Gap (%) | 954 | 67.24% |
| Wage / Income Gap ($) | 954 | 32.76¢ per $1 |
| Gini / Inequality Index | 954 | 0.42 |
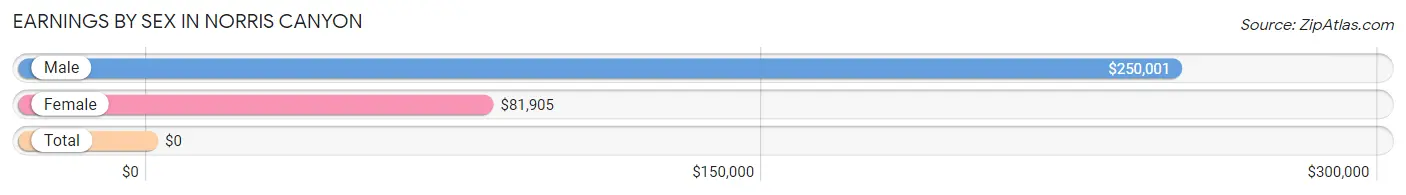
Earnings by Sex in Norris Canyon
| Sex | Number | Average Earnings |
| Male | 211 (44.6%) | $250,001 |
| Female | 262 (55.4%) | $81,905 |
| Total | 473 (100.0%) | $0 |
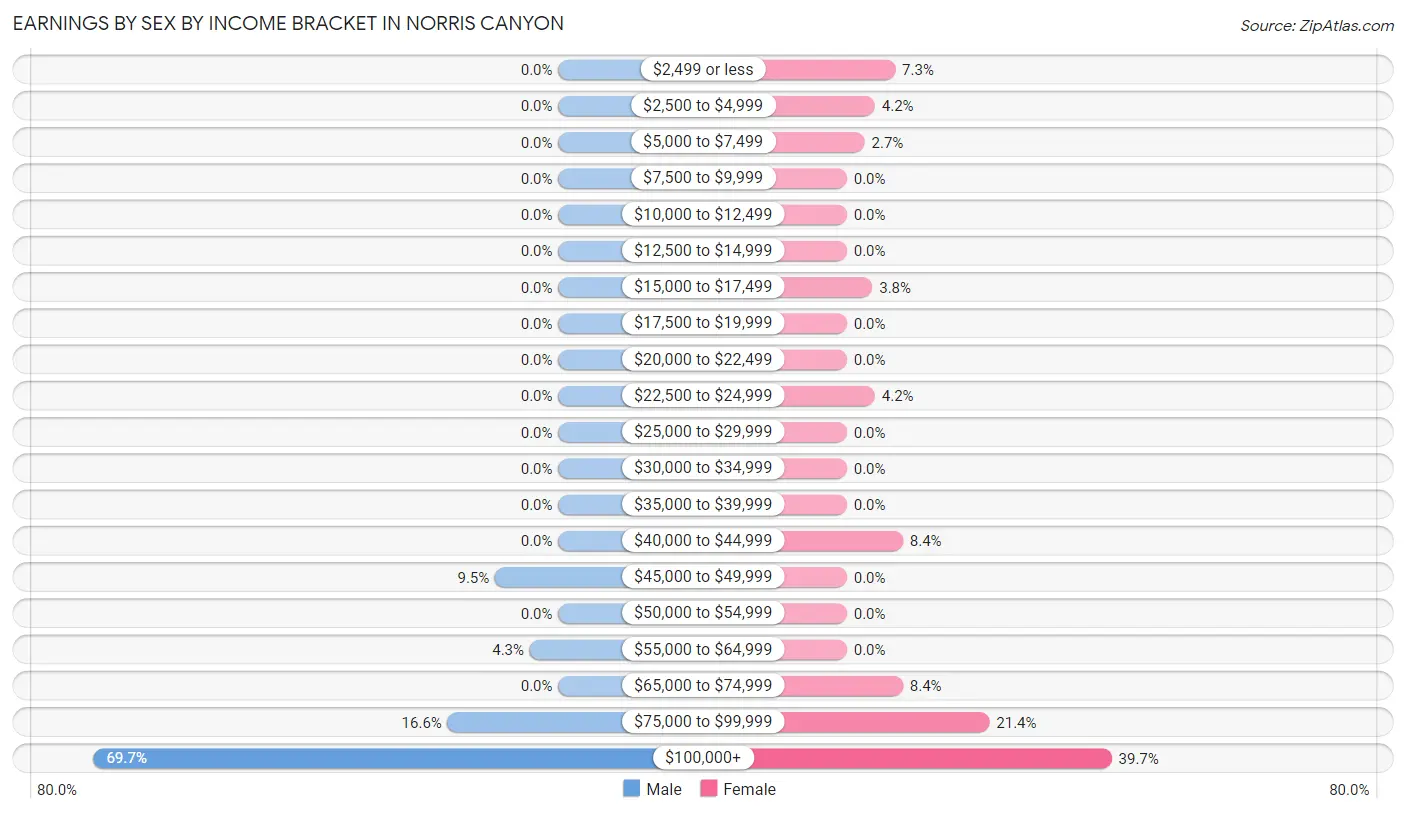
Earnings by Sex by Income Bracket in Norris Canyon
The most common earnings brackets in Norris Canyon are $100,000+ for men (147 | 69.7%) and $100,000+ for women (104 | 39.7%).
| Income | Male | Female |
| $2,499 or less | 0 (0.0%) | 19 (7.2%) |
| $2,500 to $4,999 | 0 (0.0%) | 11 (4.2%) |
| $5,000 to $7,499 | 0 (0.0%) | 7 (2.7%) |
| $7,500 to $9,999 | 0 (0.0%) | 0 (0.0%) |
| $10,000 to $12,499 | 0 (0.0%) | 0 (0.0%) |
| $12,500 to $14,999 | 0 (0.0%) | 0 (0.0%) |
| $15,000 to $17,499 | 0 (0.0%) | 10 (3.8%) |
| $17,500 to $19,999 | 0 (0.0%) | 0 (0.0%) |
| $20,000 to $22,499 | 0 (0.0%) | 0 (0.0%) |
| $22,500 to $24,999 | 0 (0.0%) | 11 (4.2%) |
| $25,000 to $29,999 | 0 (0.0%) | 0 (0.0%) |
| $30,000 to $34,999 | 0 (0.0%) | 0 (0.0%) |
| $35,000 to $39,999 | 0 (0.0%) | 0 (0.0%) |
| $40,000 to $44,999 | 0 (0.0%) | 22 (8.4%) |
| $45,000 to $49,999 | 20 (9.5%) | 0 (0.0%) |
| $50,000 to $54,999 | 0 (0.0%) | 0 (0.0%) |
| $55,000 to $64,999 | 9 (4.3%) | 0 (0.0%) |
| $65,000 to $74,999 | 0 (0.0%) | 22 (8.4%) |
| $75,000 to $99,999 | 35 (16.6%) | 56 (21.4%) |
| $100,000+ | 147 (69.7%) | 104 (39.7%) |
| Total | 211 (100.0%) | 262 (100.0%) |
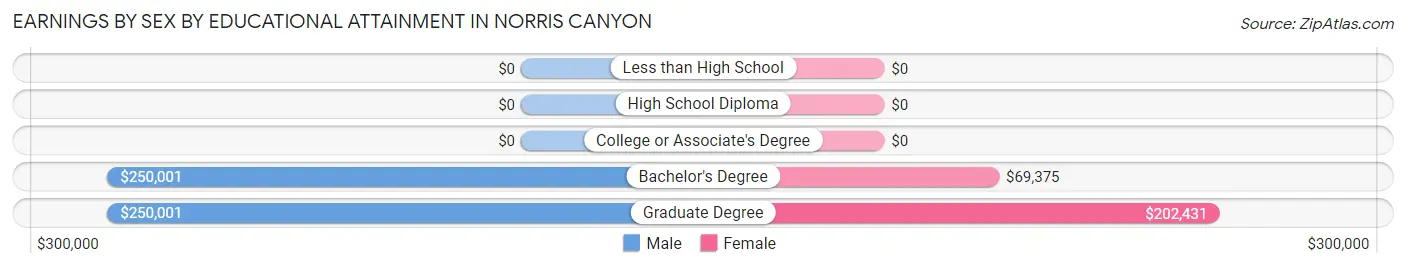
Earnings by Sex by Educational Attainment in Norris Canyon
Average earnings in Norris Canyon are $250,001 for men and $85,057 for women, a difference of 66.0%. Men with an educational attainment of bachelor's degree enjoy the highest average annual earnings of $250,001, while those with bachelor's degree education earn the least with $250,001. Women with an educational attainment of graduate degree earn the most with the average annual earnings of $202,431, while those with bachelor's degree education have the smallest earnings of $69,375.
| Educational Attainment | Male Income | Female Income |
| Less than High School | - | - |
| High School Diploma | - | - |
| College or Associate's Degree | - | - |
| Bachelor's Degree | $250,001 | $69,375 |
| Graduate Degree | $250,001 | $202,431 |
| Total | $250,001 | $85,057 |
Family Income in Norris Canyon
Family Income Brackets in Norris Canyon
According to the Norris Canyon family income data, there are 155 families falling into the $200,000+ income range, which is the most common income bracket and makes up 71.8% of all families.
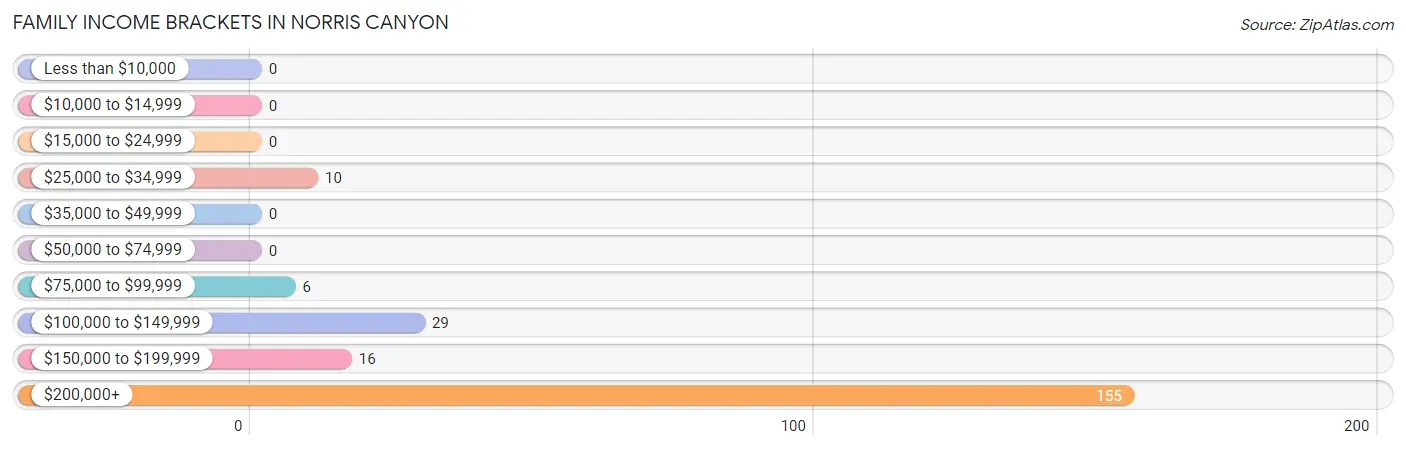
| Income Bracket | # Families | % Families |
| Less than $10,000 | 0 | 0.0% |
| $10,000 to $14,999 | 0 | 0.0% |
| $15,000 to $24,999 | 0 | 0.0% |
| $25,000 to $34,999 | 10 | 4.6% |
| $35,000 to $49,999 | 0 | 0.0% |
| $50,000 to $74,999 | 0 | 0.0% |
| $75,000 to $99,999 | 6 | 2.8% |
| $100,000 to $149,999 | 29 | 13.4% |
| $150,000 to $199,999 | 16 | 7.4% |
| $200,000+ | 155 | 71.8% |
Family Income by Famaliy Size in Norris Canyon
2-person families (46 | 21.3%) account for the highest median family income in Norris Canyon with $250,001 per family, while 2-person families (46 | 21.3%) have the highest median income of $125,000 per family member.
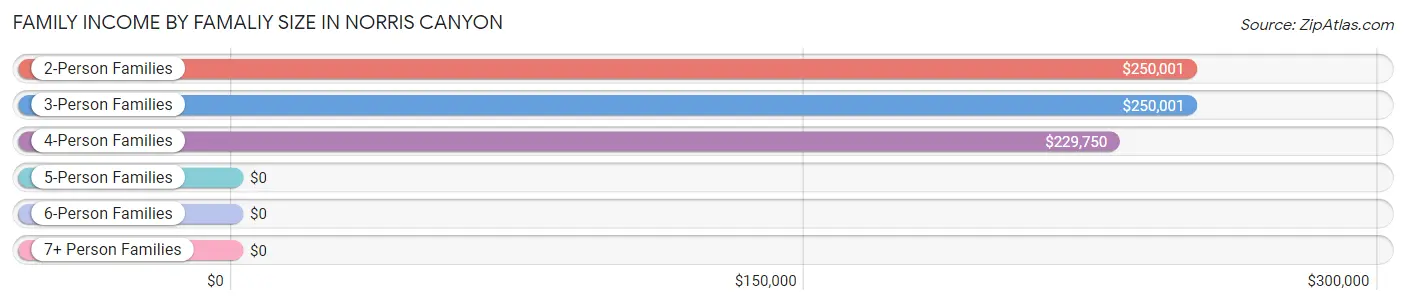
| Income Bracket | # Families | Median Income |
| 2-Person Families | 46 (21.3%) | $250,001 |
| 3-Person Families | 44 (20.4%) | $250,001 |
| 4-Person Families | 58 (26.9%) | $229,750 |
| 5-Person Families | 33 (15.3%) | $0 |
| 6-Person Families | 35 (16.2%) | $0 |
| 7+ Person Families | 0 (0.0%) | $0 |
| Total | 216 (100.0%) | $250,001 |
Family Income by Number of Earners in Norris Canyon
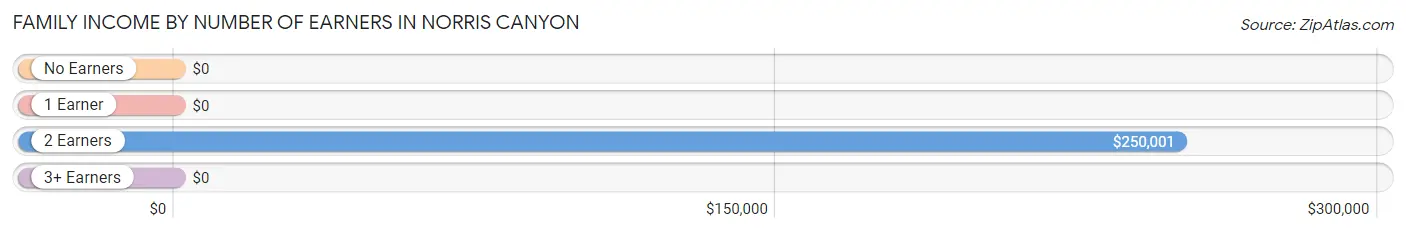
| Number of Earners | # Families | Median Income |
| No Earners | 16 (7.4%) | $0 |
| 1 Earner | 43 (19.9%) | $0 |
| 2 Earners | 132 (61.1%) | $250,001 |
| 3+ Earners | 25 (11.6%) | $0 |
| Total | 216 (100.0%) | $250,001 |
Household Income in Norris Canyon
Household Income Brackets in Norris Canyon
With 222 households falling in the category, the $200,000+ income range is the most frequent in Norris Canyon, accounting for 78.4% of all households.
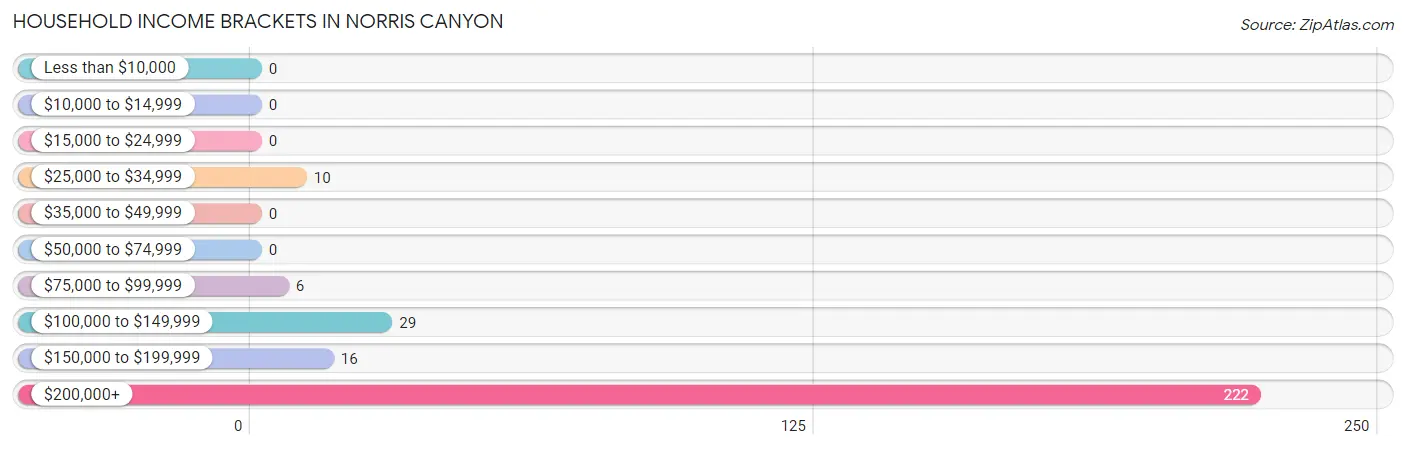
| Income Bracket | # Households | % Households |
| Less than $10,000 | 0 | 0.0% |
| $10,000 to $14,999 | 0 | 0.0% |
| $15,000 to $24,999 | 0 | 0.0% |
| $25,000 to $34,999 | 10 | 3.5% |
| $35,000 to $49,999 | 0 | 0.0% |
| $50,000 to $74,999 | 0 | 0.0% |
| $75,000 to $99,999 | 6 | 2.1% |
| $100,000 to $149,999 | 29 | 10.2% |
| $150,000 to $199,999 | 16 | 5.7% |
| $200,000+ | 222 | 78.4% |
Household Income by Householder Age in Norris Canyon
The median household income in Norris Canyon is $250,001, with the highest median household income of $250,001 found in the 25 to 44 years age bracket for the primary householder. A total of 68 households (24.0%) fall into this category.
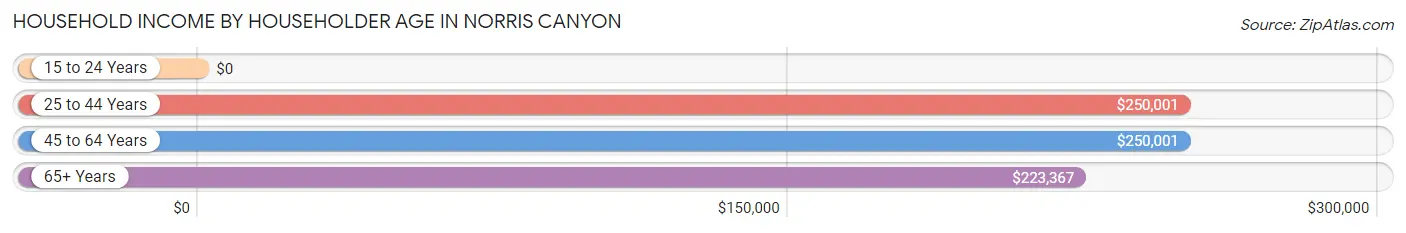
| Income Bracket | # Households | Median Income |
| 15 to 24 Years | 0 (0.0%) | $0 |
| 25 to 44 Years | 68 (24.0%) | $250,001 |
| 45 to 64 Years | 151 (53.4%) | $250,001 |
| 65+ Years | 64 (22.6%) | $223,367 |
| Total | 283 (100.0%) | $250,001 |
Poverty in Norris Canyon
Income Below Poverty by Sex and Age in Norris Canyon
With 4.6% poverty level for males and 2.9% for females among the residents of Norris Canyon, 55 to 64 year old males and 45 to 54 year old females are the most vulnerable to poverty, with 22 males (21.1%) and 14 females (14.9%) in their respective age groups living below the poverty level.
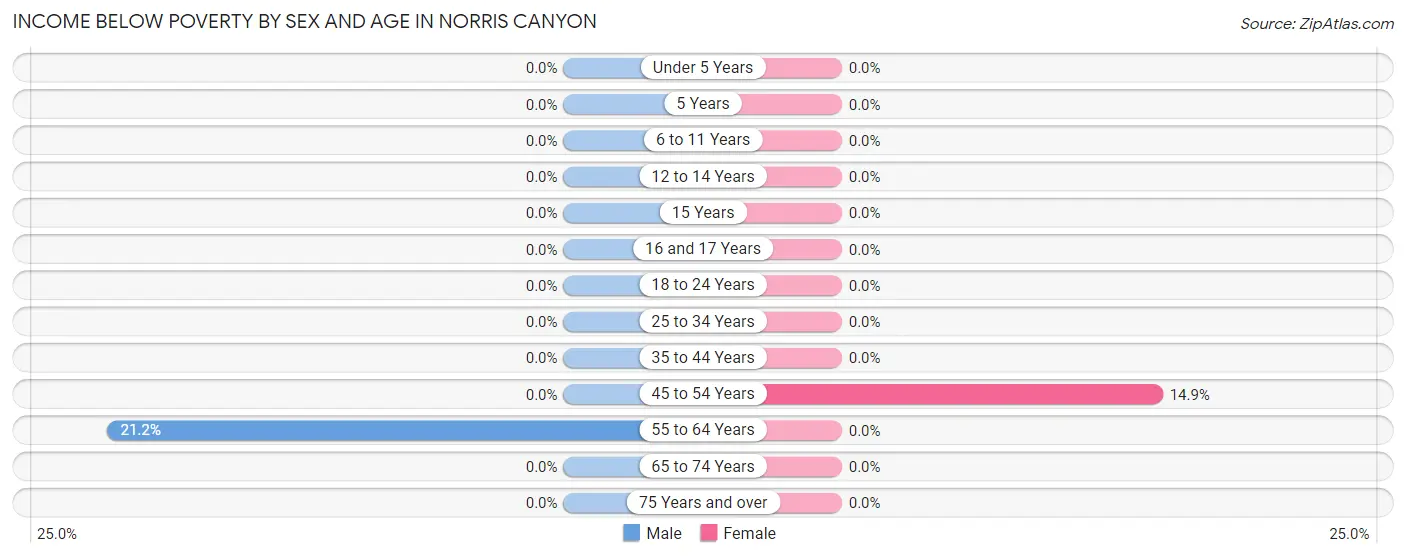
| Age Bracket | Male | Female |
| Under 5 Years | 0 (0.0%) | 0 (0.0%) |
| 5 Years | 0 (0.0%) | 0 (0.0%) |
| 6 to 11 Years | 0 (0.0%) | 0 (0.0%) |
| 12 to 14 Years | 0 (0.0%) | 0 (0.0%) |
| 15 Years | 0 (0.0%) | 0 (0.0%) |
| 16 and 17 Years | 0 (0.0%) | 0 (0.0%) |
| 18 to 24 Years | 0 (0.0%) | 0 (0.0%) |
| 25 to 34 Years | 0 (0.0%) | 0 (0.0%) |
| 35 to 44 Years | 0 (0.0%) | 0 (0.0%) |
| 45 to 54 Years | 0 (0.0%) | 14 (14.9%) |
| 55 to 64 Years | 22 (21.1%) | 0 (0.0%) |
| 65 to 74 Years | 0 (0.0%) | 0 (0.0%) |
| 75 Years and over | 0 (0.0%) | 0 (0.0%) |
| Total | 22 (4.6%) | 14 (2.9%) |
Income Above Poverty by Sex and Age in Norris Canyon
According to the poverty statistics in Norris Canyon, males aged under 5 years and females aged 6 to 11 years are the age groups that are most secure financially, with 100.0% of males and 100.0% of females in these age groups living above the poverty line.
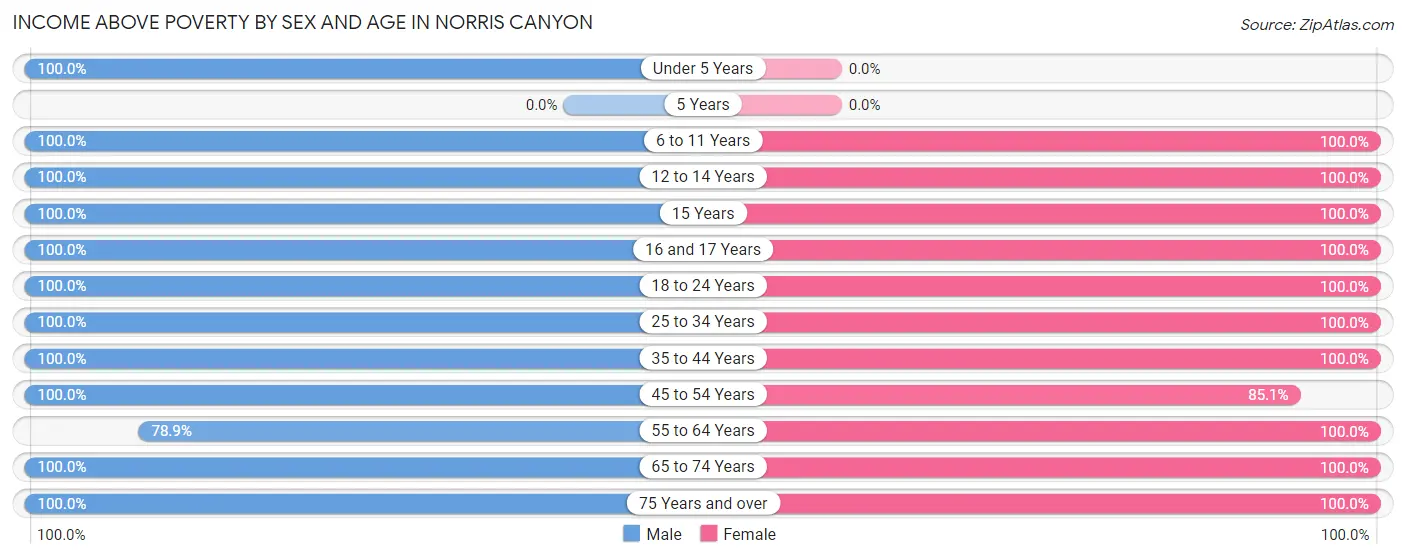
| Age Bracket | Male | Female |
| Under 5 Years | 19 (100.0%) | 0 (0.0%) |
| 5 Years | 0 (0.0%) | 0 (0.0%) |
| 6 to 11 Years | 28 (100.0%) | 16 (100.0%) |
| 12 to 14 Years | 25 (100.0%) | 42 (100.0%) |
| 15 Years | 11 (100.0%) | 10 (100.0%) |
| 16 and 17 Years | 57 (100.0%) | 8 (100.0%) |
| 18 to 24 Years | 26 (100.0%) | 42 (100.0%) |
| 25 to 34 Years | 20 (100.0%) | 33 (100.0%) |
| 35 to 44 Years | 48 (100.0%) | 60 (100.0%) |
| 45 to 54 Years | 91 (100.0%) | 80 (85.1%) |
| 55 to 64 Years | 82 (78.8%) | 78 (100.0%) |
| 65 to 74 Years | 24 (100.0%) | 60 (100.0%) |
| 75 Years and over | 24 (100.0%) | 34 (100.0%) |
| Total | 455 (95.4%) | 463 (97.1%) |
Income Below Poverty Among Married-Couple Families in Norris Canyon
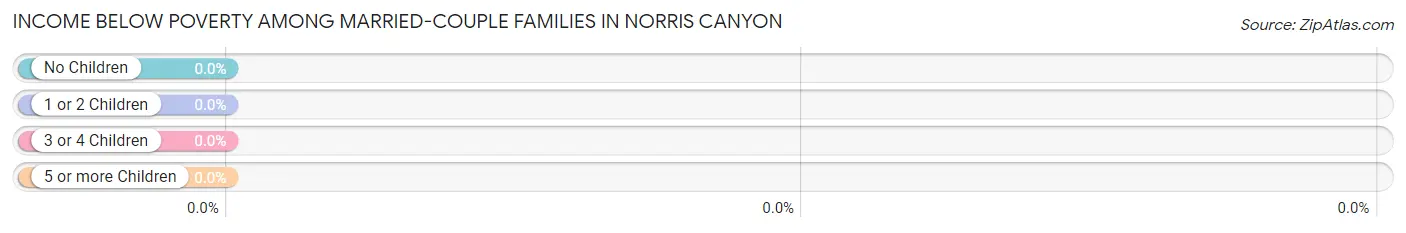
| Children | Above Poverty | Below Poverty |
| No Children | 60 (100.0%) | 0 (0.0%) |
| 1 or 2 Children | 120 (100.0%) | 0 (0.0%) |
| 3 or 4 Children | 0 (0.0%) | 0 (0.0%) |
| 5 or more Children | 0 (0.0%) | 0 (0.0%) |
| Total | 180 (100.0%) | 0 (0.0%) |
Income Below Poverty Among Single-Parent Households in Norris Canyon
| Children | Single Father | Single Mother |
| No Children | 0 (0.0%) | 0 (0.0%) |
| 1 or 2 Children | 0 (0.0%) | 0 (0.0%) |
| 3 or 4 Children | 0 (0.0%) | 0 (0.0%) |
| 5 or more Children | 0 (0.0%) | 0 (0.0%) |
| Total | 0 (0.0%) | 0 (0.0%) |
Income Below Poverty Among Married-Couple vs Single-Parent Households in Norris Canyon
| Children | Married-Couple Families | Single-Parent Households |
| No Children | 0 (0.0%) | 0 (0.0%) |
| 1 or 2 Children | 0 (0.0%) | 0 (0.0%) |
| 3 or 4 Children | 0 (0.0%) | 0 (0.0%) |
| 5 or more Children | 0 (0.0%) | 0 (0.0%) |
| Total | 0 (0.0%) | 0 (0.0%) |
Race in Norris Canyon
The most populous races in Norris Canyon are Asian (755 | 79.1%), White / Caucasian (185 | 19.4%), and Hispanic or Latino (63 | 6.6%).
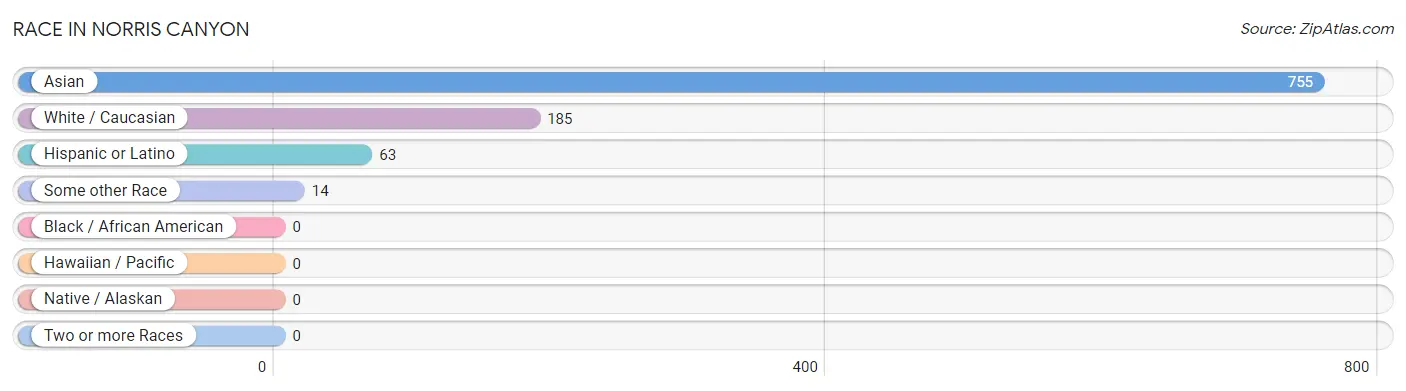
| Race | # Population | % Population |
| Asian | 755 | 79.1% |
| Black / African American | 0 | 0.0% |
| Hawaiian / Pacific | 0 | 0.0% |
| Hispanic or Latino | 63 | 6.6% |
| Native / Alaskan | 0 | 0.0% |
| White / Caucasian | 185 | 19.4% |
| Two or more Races | 0 | 0.0% |
| Some other Race | 14 | 1.5% |
| Total | 954 | 100.0% |
Ancestry in Norris Canyon
The most populous ancestries reported in Norris Canyon are Indian (Asian) (406 | 42.6%), Thai (283 | 29.7%), Irish (71 | 7.4%), Spanish (49 | 5.1%), and Iranian (48 | 5.0%), together accounting for 89.8% of all Norris Canyon residents.
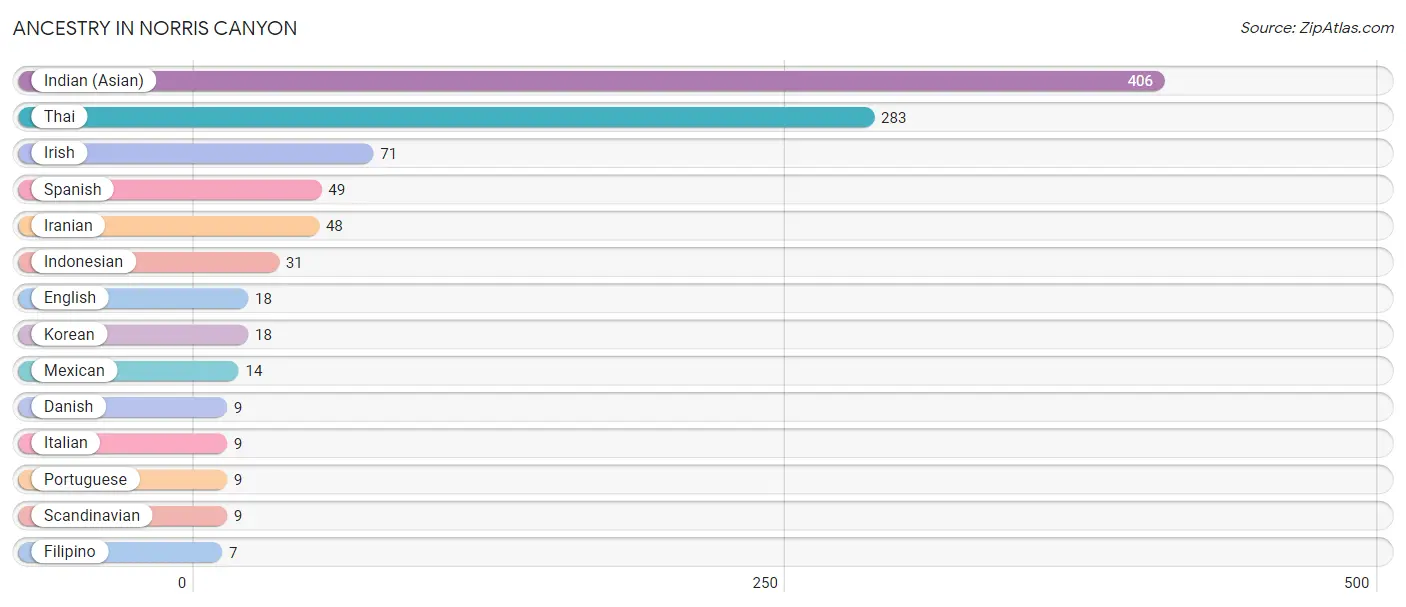
| Ancestry | # Population | % Population |
| Danish | 9 | 0.9% |
| English | 18 | 1.9% |
| Filipino | 7 | 0.7% |
| Indian (Asian) | 406 | 42.6% |
| Indonesian | 31 | 3.3% |
| Iranian | 48 | 5.0% |
| Irish | 71 | 7.4% |
| Italian | 9 | 0.9% |
| Korean | 18 | 1.9% |
| Mexican | 14 | 1.5% |
| Portuguese | 9 | 0.9% |
| Scandinavian | 9 | 0.9% |
| Spanish | 49 | 5.1% |
| Thai | 283 | 29.7% | View All 14 Rows |
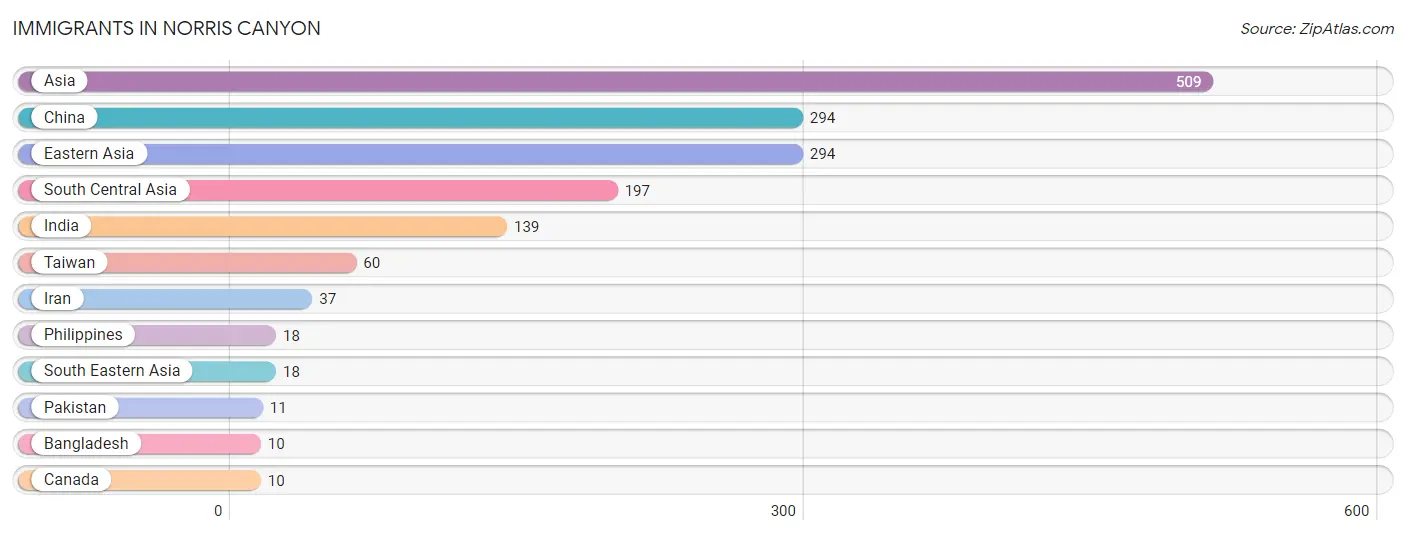
Immigrants in Norris Canyon
The most numerous immigrant groups reported in Norris Canyon came from Asia (509 | 53.3%), China (294 | 30.8%), Eastern Asia (294 | 30.8%), South Central Asia (197 | 20.6%), and India (139 | 14.6%), together accounting for 150.2% of all Norris Canyon residents.
| Immigration Origin | # Population | % Population |
| Asia | 509 | 53.3% |
| Bangladesh | 10 | 1.1% |
| Canada | 10 | 1.1% |
| China | 294 | 30.8% |
| Eastern Asia | 294 | 30.8% |
| India | 139 | 14.6% |
| Iran | 37 | 3.9% |
| Pakistan | 11 | 1.1% |
| Philippines | 18 | 1.9% |
| South Central Asia | 197 | 20.6% |
| South Eastern Asia | 18 | 1.9% |
| Taiwan | 60 | 6.3% | View All 12 Rows |
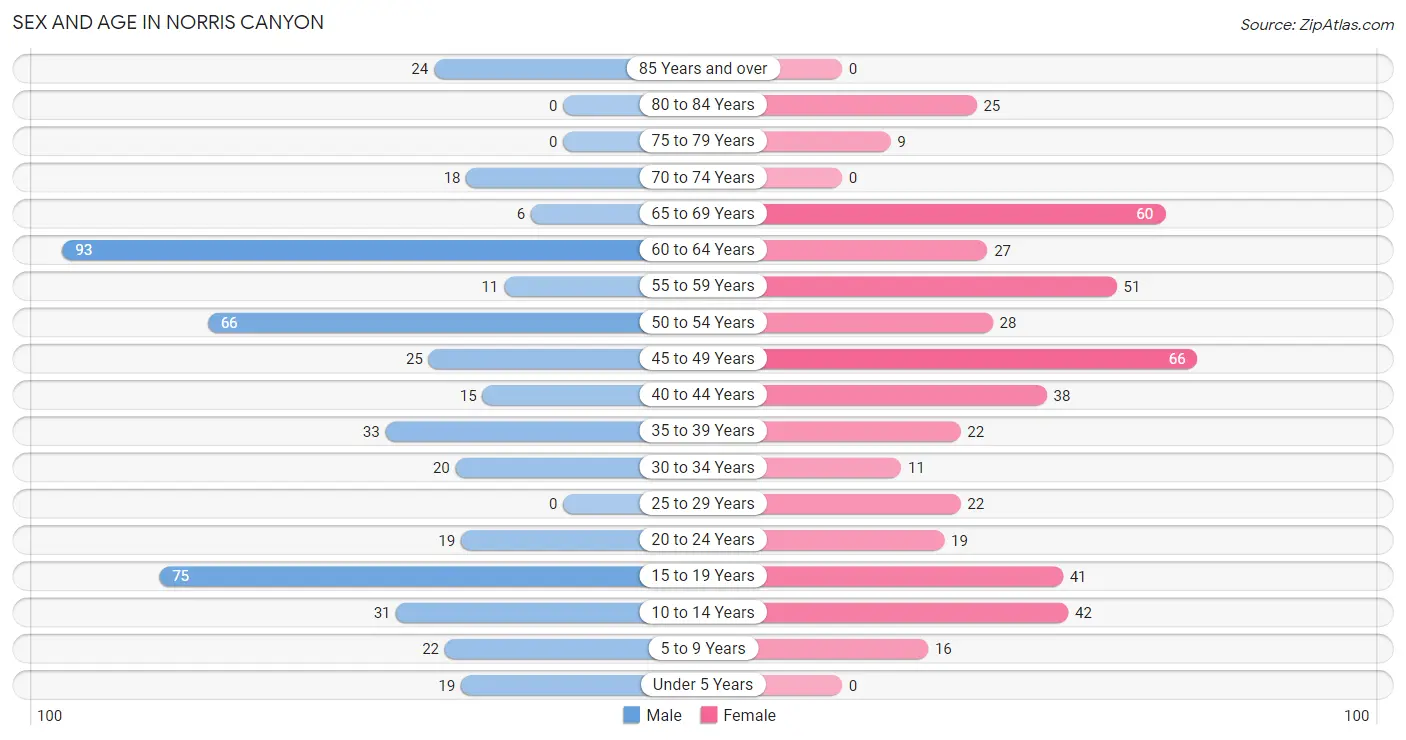
Sex and Age in Norris Canyon
Sex and Age in Norris Canyon
The most populous age groups in Norris Canyon are 60 to 64 Years (93 | 19.5%) for men and 45 to 49 Years (66 | 13.8%) for women.
| Age Bracket | Male | Female |
| Under 5 Years | 19 (4.0%) | 0 (0.0%) |
| 5 to 9 Years | 22 (4.6%) | 16 (3.4%) |
| 10 to 14 Years | 31 (6.5%) | 42 (8.8%) |
| 15 to 19 Years | 75 (15.7%) | 41 (8.6%) |
| 20 to 24 Years | 19 (4.0%) | 19 (4.0%) |
| 25 to 29 Years | 0 (0.0%) | 22 (4.6%) |
| 30 to 34 Years | 20 (4.2%) | 11 (2.3%) |
| 35 to 39 Years | 33 (6.9%) | 22 (4.6%) |
| 40 to 44 Years | 15 (3.1%) | 38 (8.0%) |
| 45 to 49 Years | 25 (5.2%) | 66 (13.8%) |
| 50 to 54 Years | 66 (13.8%) | 28 (5.9%) |
| 55 to 59 Years | 11 (2.3%) | 51 (10.7%) |
| 60 to 64 Years | 93 (19.5%) | 27 (5.7%) |
| 65 to 69 Years | 6 (1.3%) | 60 (12.6%) |
| 70 to 74 Years | 18 (3.8%) | 0 (0.0%) |
| 75 to 79 Years | 0 (0.0%) | 9 (1.9%) |
| 80 to 84 Years | 0 (0.0%) | 25 (5.2%) |
| 85 Years and over | 24 (5.0%) | 0 (0.0%) |
| Total | 477 (100.0%) | 477 (100.0%) |
Families and Households in Norris Canyon
Median Family Size in Norris Canyon
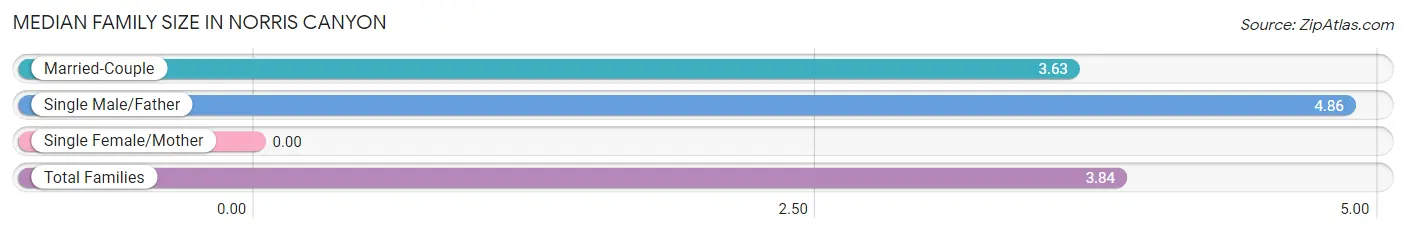
| Family Type | # Families | Family Size |
| Married-Couple | 180 (83.3%) | 3.63 |
| Single Male/Father | 36 (16.7%) | 4.86 |
| Single Female/Mother | 0 (0.0%) | - |
| Total Families | 216 (100.0%) | 3.84 |
Median Household Size in Norris Canyon
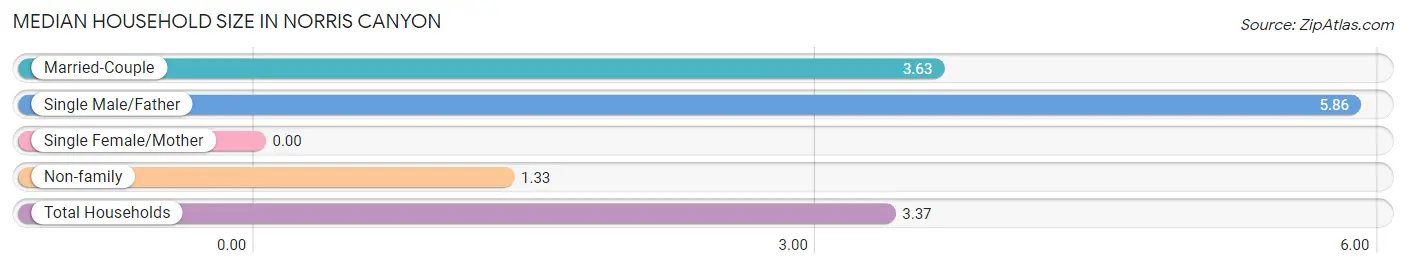
| Household Type | # Households | Household Size |
| Married-Couple | 180 (63.6%) | 3.63 |
| Single Male/Father | 36 (12.7%) | 5.86 |
| Single Female/Mother | 0 (0.0%) | - |
| Non-family | 67 (23.7%) | 1.33 |
| Total Households | 283 (100.0%) | 3.37 |
Household Size by Marriage Status in Norris Canyon
Out of a total of 283 households in Norris Canyon, 216 (76.3%) are family households, while 67 (23.7%) are nonfamily households. The most numerous type of family households are 4-person households, comprising 74, and the most common type of nonfamily households are 1-person households, comprising 49.
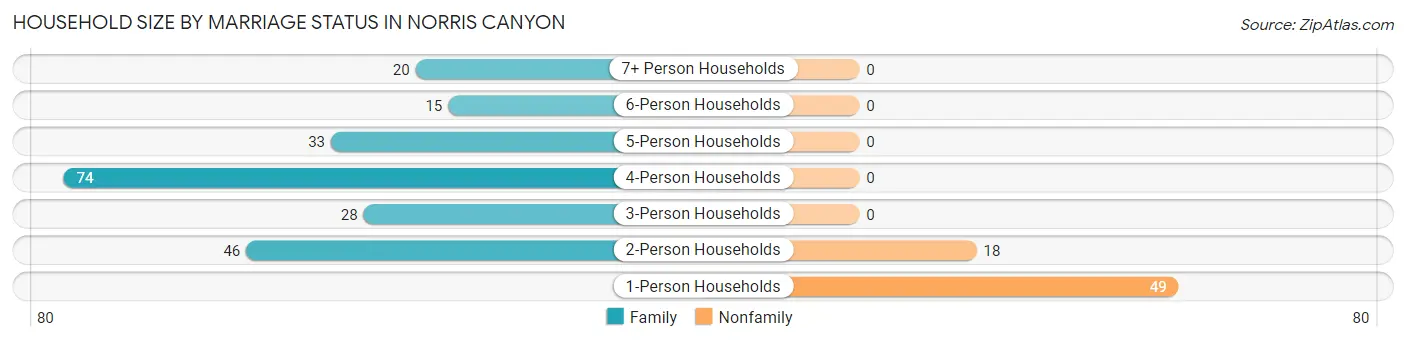
| Household Size | Family Households | Nonfamily Households |
| 1-Person Households | - | 49 (17.3%) |
| 2-Person Households | 46 (16.3%) | 18 (6.4%) |
| 3-Person Households | 28 (9.9%) | 0 (0.0%) |
| 4-Person Households | 74 (26.2%) | 0 (0.0%) |
| 5-Person Households | 33 (11.7%) | 0 (0.0%) |
| 6-Person Households | 15 (5.3%) | 0 (0.0%) |
| 7+ Person Households | 20 (7.1%) | 0 (0.0%) |
| Total | 216 (76.3%) | 67 (23.7%) |
Female Fertility in Norris Canyon
Fertility by Age in Norris Canyon
| Age Bracket | Women with Births | Births / 1,000 Women |
| 15 to 19 years | 0 (0.0%) | 0.0 |
| 20 to 34 years | 0 (0.0%) | 0.0 |
| 35 to 50 years | 0 (0.0%) | 0.0 |
| Total | 0 (0.0%) | 0.0 |
Fertility by Age by Marriage Status in Norris Canyon
| Age Bracket | Married | Unmarried |
| 15 to 19 years | 0 (0.0%) | 0 (0.0%) |
| 20 to 34 years | 0 (0.0%) | 0 (0.0%) |
| 35 to 50 years | 0 (0.0%) | 0 (0.0%) |
| Total | 0 (0.0%) | 0 (0.0%) |
Fertility by Education in Norris Canyon
| Educational Attainment | Women with Births | Births / 1,000 Women |
| Less than High School | 0 (0.0%) | 0.0 |
| High School Diploma | 0 (0.0%) | 0.0 |
| College or Associate's Degree | 0 (0.0%) | 0.0 |
| Bachelor's Degree | 0 (0.0%) | 0.0 |
| Graduate Degree | 0 (0.0%) | 0.0 |
| Total | 0 (0.0%) | 0.0 |
Fertility by Education by Marriage Status in Norris Canyon
| Educational Attainment | Married | Unmarried |
| Less than High School | 0 (0.0%) | 0 (0.0%) |
| High School Diploma | 0 (0.0%) | 0 (0.0%) |
| College or Associate's Degree | 0 (0.0%) | 0 (0.0%) |
| Bachelor's Degree | 0 (0.0%) | 0 (0.0%) |
| Graduate Degree | 0 (0.0%) | 0 (0.0%) |
| Total | 0 (0.0%) | 0 (0.0%) |
Employment Characteristics in Norris Canyon
Employment by Class of Employer in Norris Canyon
Among the 454 employed individuals in Norris Canyon, private company employees (318 | 70.0%), self-employed (incorporated) (99 | 21.8%), and self-employed (not incorporated) (27 | 5.9%) make up the most common classes of employment.
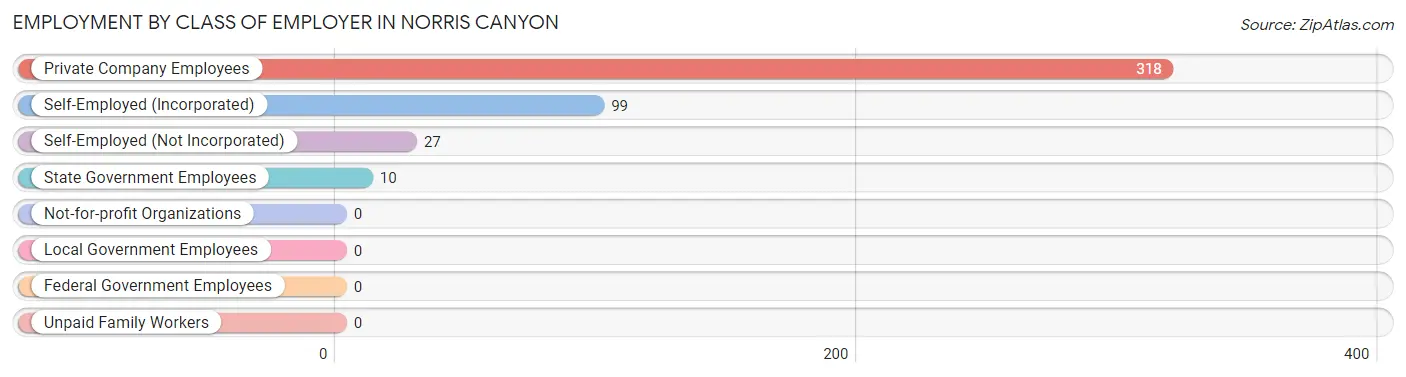
| Employer Class | # Employees | % Employees |
| Private Company Employees | 318 | 70.0% |
| Self-Employed (Incorporated) | 99 | 21.8% |
| Self-Employed (Not Incorporated) | 27 | 5.9% |
| Not-for-profit Organizations | 0 | 0.0% |
| Local Government Employees | 0 | 0.0% |
| State Government Employees | 10 | 2.2% |
| Federal Government Employees | 0 | 0.0% |
| Unpaid Family Workers | 0 | 0.0% |
| Total | 454 | 100.0% |
Employment Status by Age in Norris Canyon
According to the labor force statistics for Norris Canyon, out of the total population over 16 years of age (803), 60.4% or 485 individuals are in the labor force, with 6.4% or 31 of them unemployed. The age group with the highest labor force participation rate is 25 to 29 years, with 100.0% or 22 individuals in the labor force. Within the labor force, the 20 to 24 years age range has the highest percentage of unemployed individuals, with 100.0% or 19 of them being unemployed.
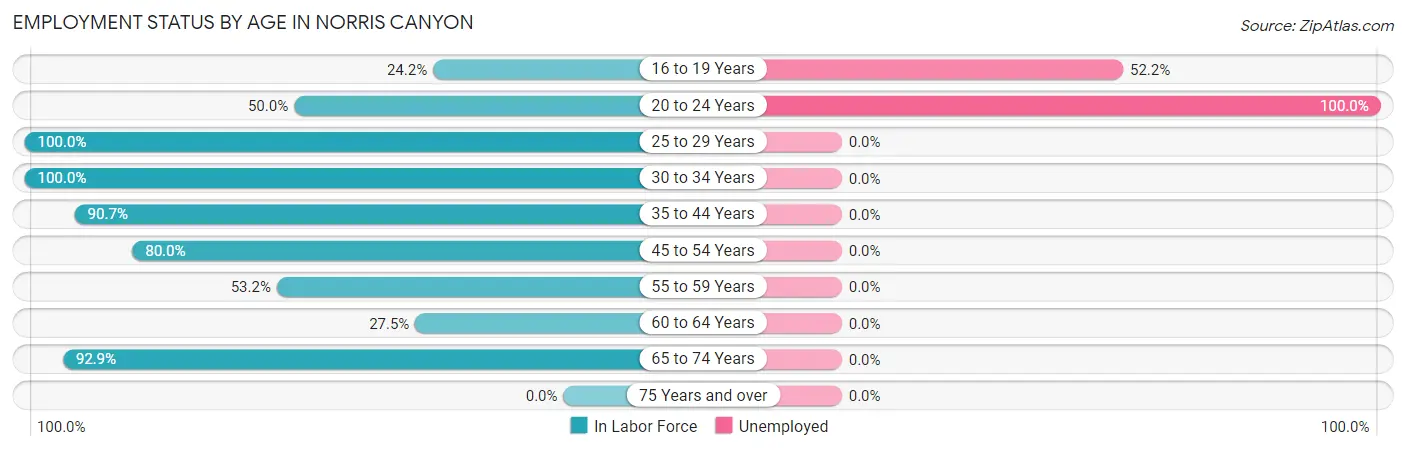
| Age Bracket | In Labor Force | Unemployed |
| 16 to 19 Years | 23 (24.2%) | 12 (52.2%) |
| 20 to 24 Years | 19 (50.0%) | 19 (100.0%) |
| 25 to 29 Years | 22 (100.0%) | 0 (0.0%) |
| 30 to 34 Years | 31 (100.0%) | 0 (0.0%) |
| 35 to 44 Years | 98 (90.7%) | 0 (0.0%) |
| 45 to 54 Years | 148 (80.0%) | 0 (0.0%) |
| 55 to 59 Years | 33 (53.2%) | 0 (0.0%) |
| 60 to 64 Years | 33 (27.5%) | 0 (0.0%) |
| 65 to 74 Years | 78 (92.9%) | 0 (0.0%) |
| 75 Years and over | 0 (0.0%) | 0 (0.0%) |
| Total | 485 (60.4%) | 31 (6.4%) |
Employment Status by Educational Attainment in Norris Canyon
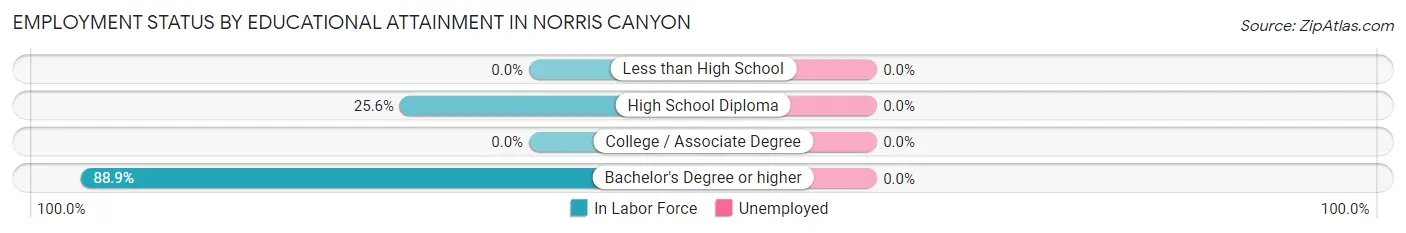
| Educational Attainment | In Labor Force | Unemployed |
| Less than High School | 0 (0.0%) | 0 (0.0%) |
| High School Diploma | 22 (25.6%) | 0 (0.0%) |
| College / Associate Degree | 0 (0.0%) | 0 (0.0%) |
| Bachelor's Degree or higher | 343 (88.9%) | 0 (0.0%) |
| Total | 365 (69.1%) | 0 (0.0%) |
Employment Occupations by Sex in Norris Canyon
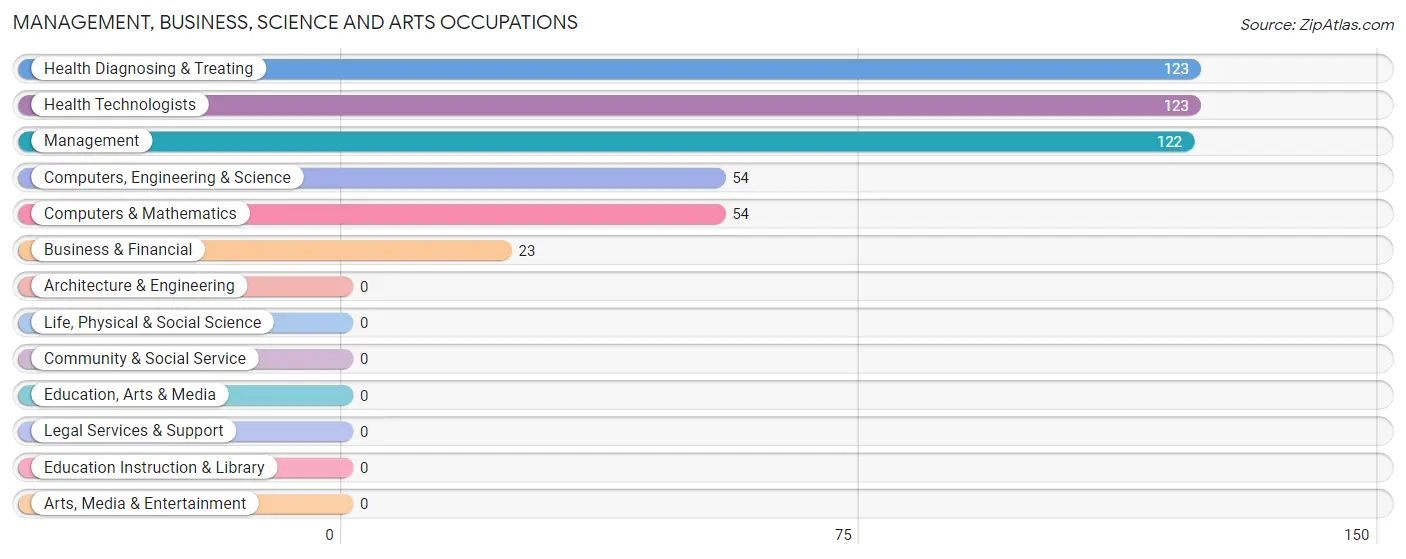
Management, Business, Science and Arts Occupations
The most common Management, Business, Science and Arts occupations in Norris Canyon are Health Diagnosing & Treating (123 | 27.1%), Health Technologists (123 | 27.1%), Management (122 | 26.9%), Computers, Engineering & Science (54 | 11.9%), and Computers & Mathematics (54 | 11.9%).
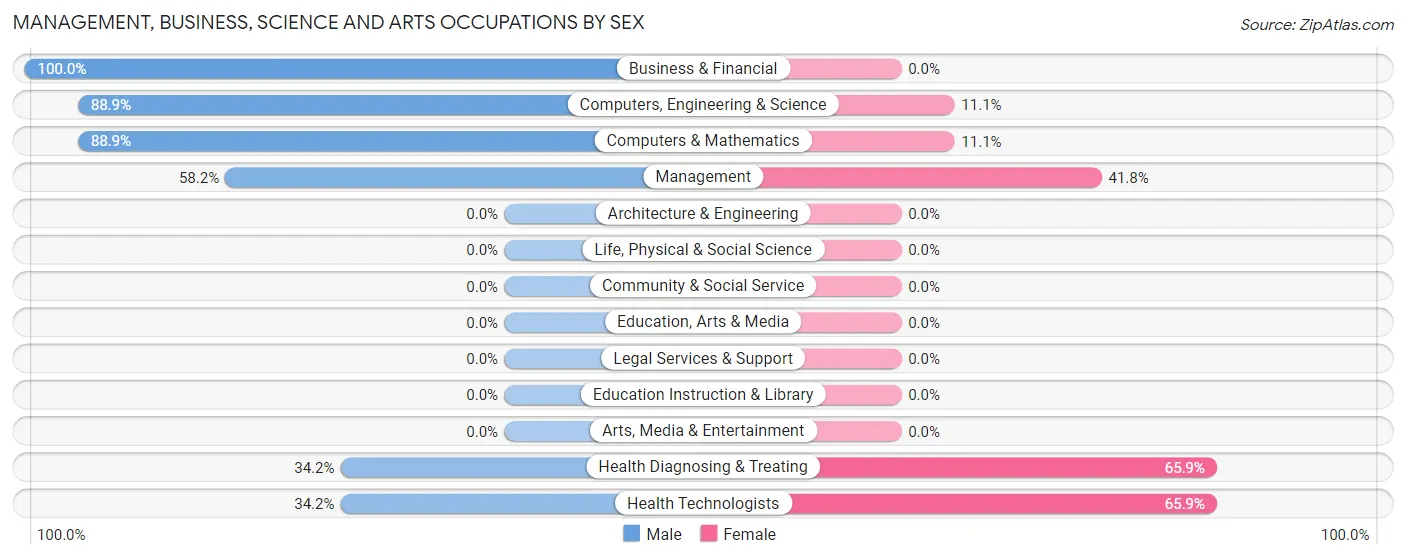
Management, Business, Science and Arts Occupations by Sex
Within the Management, Business, Science and Arts occupations in Norris Canyon, the most male-oriented occupations are Business & Financial (100.0%), Computers, Engineering & Science (88.9%), and Computers & Mathematics (88.9%), while the most female-oriented occupations are Health Diagnosing & Treating (65.8%), Health Technologists (65.8%), and Management (41.8%).
| Occupation | Male | Female |
| Management | 71 (58.2%) | 51 (41.8%) |
| Business & Financial | 23 (100.0%) | 0 (0.0%) |
| Computers, Engineering & Science | 48 (88.9%) | 6 (11.1%) |
| Computers & Mathematics | 48 (88.9%) | 6 (11.1%) |
| Architecture & Engineering | 0 (0.0%) | 0 (0.0%) |
| Life, Physical & Social Science | 0 (0.0%) | 0 (0.0%) |
| Community & Social Service | 0 (0.0%) | 0 (0.0%) |
| Education, Arts & Media | 0 (0.0%) | 0 (0.0%) |
| Legal Services & Support | 0 (0.0%) | 0 (0.0%) |
| Education Instruction & Library | 0 (0.0%) | 0 (0.0%) |
| Arts, Media & Entertainment | 0 (0.0%) | 0 (0.0%) |
| Health Diagnosing & Treating | 42 (34.2%) | 81 (65.8%) |
| Health Technologists | 42 (34.2%) | 81 (65.8%) |
| Total (Category) | 184 (57.1%) | 138 (42.9%) |
| Total (Overall) | 211 (46.5%) | 243 (53.5%) |
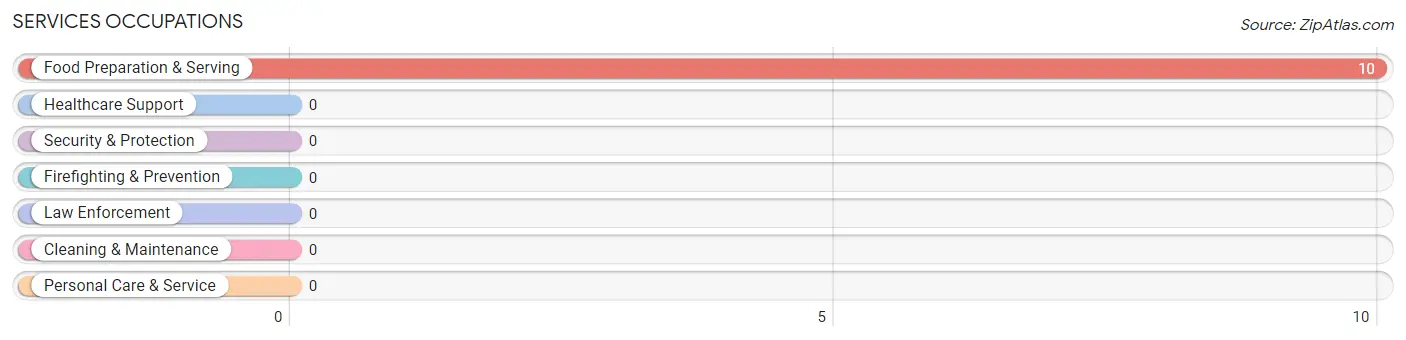
Services Occupations
The most common Services occupations in Norris Canyon are , and Food Preparation & Serving (10 | 2.2%).
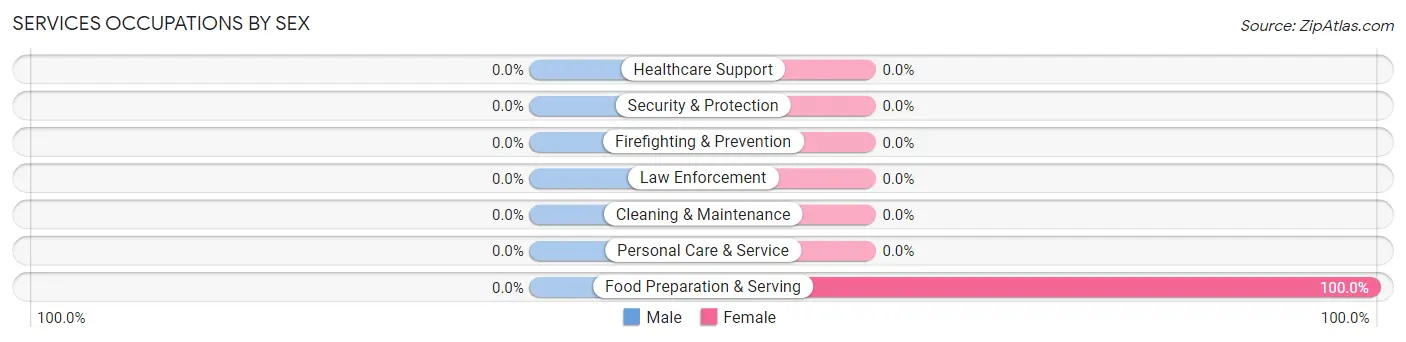
Services Occupations by Sex
| Occupation | Male | Female |
| Healthcare Support | 0 (0.0%) | 0 (0.0%) |
| Security & Protection | 0 (0.0%) | 0 (0.0%) |
| Firefighting & Prevention | 0 (0.0%) | 0 (0.0%) |
| Law Enforcement | 0 (0.0%) | 0 (0.0%) |
| Food Preparation & Serving | 0 (0.0%) | 10 (100.0%) |
| Cleaning & Maintenance | 0 (0.0%) | 0 (0.0%) |
| Personal Care & Service | 0 (0.0%) | 0 (0.0%) |
| Total (Category) | 0 (0.0%) | 10 (100.0%) |
| Total (Overall) | 211 (46.5%) | 243 (53.5%) |
Sales and Office Occupations
The most common Sales and Office occupations in Norris Canyon are Office & Administration (71 | 15.6%), and Sales & Related (20 | 4.4%).
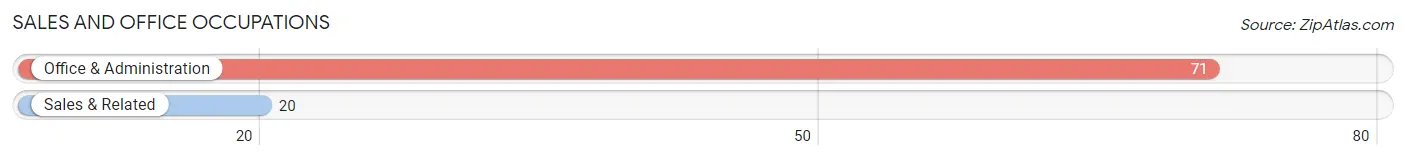
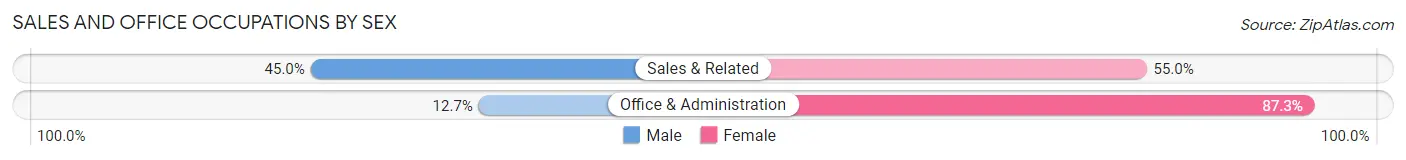
Sales and Office Occupations by Sex
| Occupation | Male | Female |
| Sales & Related | 9 (45.0%) | 11 (55.0%) |
| Office & Administration | 9 (12.7%) | 62 (87.3%) |
| Total (Category) | 18 (19.8%) | 73 (80.2%) |
| Total (Overall) | 211 (46.5%) | 243 (53.5%) |
Natural Resources, Construction and Maintenance Occupations
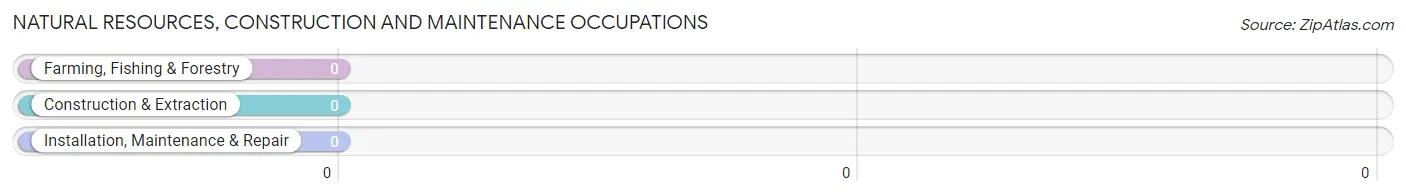
Natural Resources, Construction and Maintenance Occupations by Sex
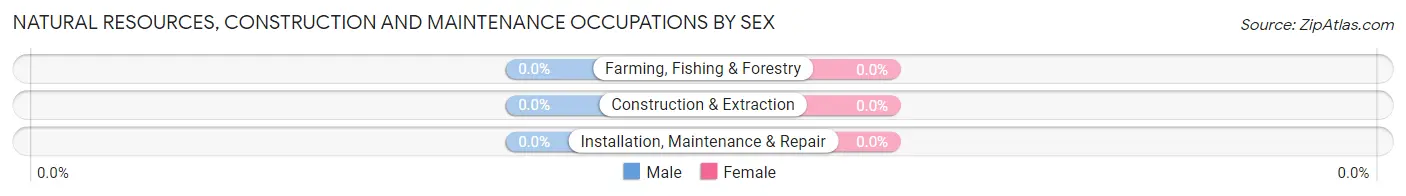
| Occupation | Male | Female |
| Farming, Fishing & Forestry | 0 (0.0%) | 0 (0.0%) |
| Construction & Extraction | 0 (0.0%) | 0 (0.0%) |
| Installation, Maintenance & Repair | 0 (0.0%) | 0 (0.0%) |
| Total (Category) | 0 (0.0%) | 0 (0.0%) |
| Total (Overall) | 211 (46.5%) | 243 (53.5%) |
Production, Transportation and Moving Occupations
The most common Production, Transportation and Moving occupations in Norris Canyon are , and Transportation (31 | 6.8%).
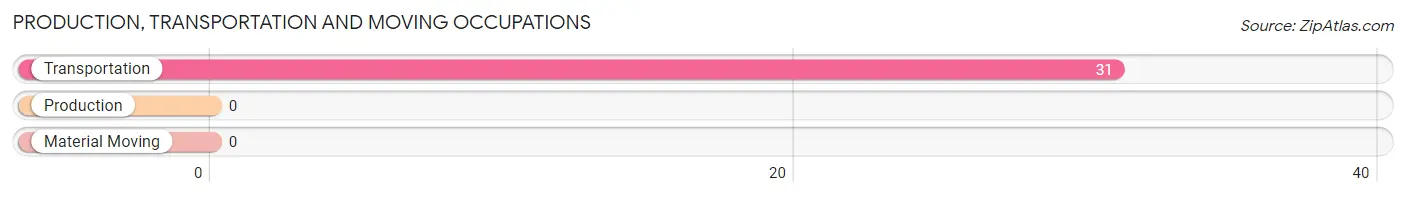
Production, Transportation and Moving Occupations by Sex
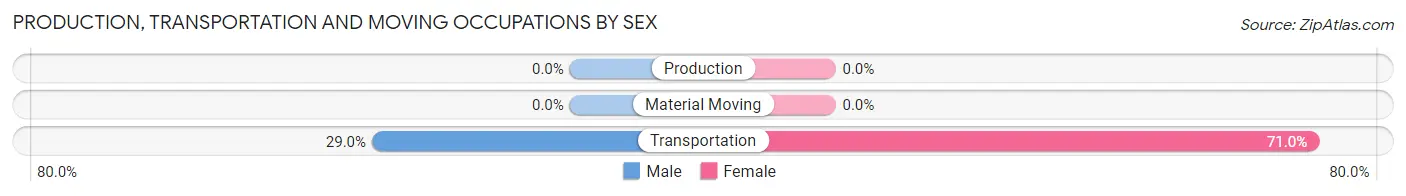
| Occupation | Male | Female |
| Production | 0 (0.0%) | 0 (0.0%) |
| Transportation | 9 (29.0%) | 22 (71.0%) |
| Material Moving | 0 (0.0%) | 0 (0.0%) |
| Total (Category) | 9 (29.0%) | 22 (71.0%) |
| Total (Overall) | 211 (46.5%) | 243 (53.5%) |
Employment Industries by Sex in Norris Canyon
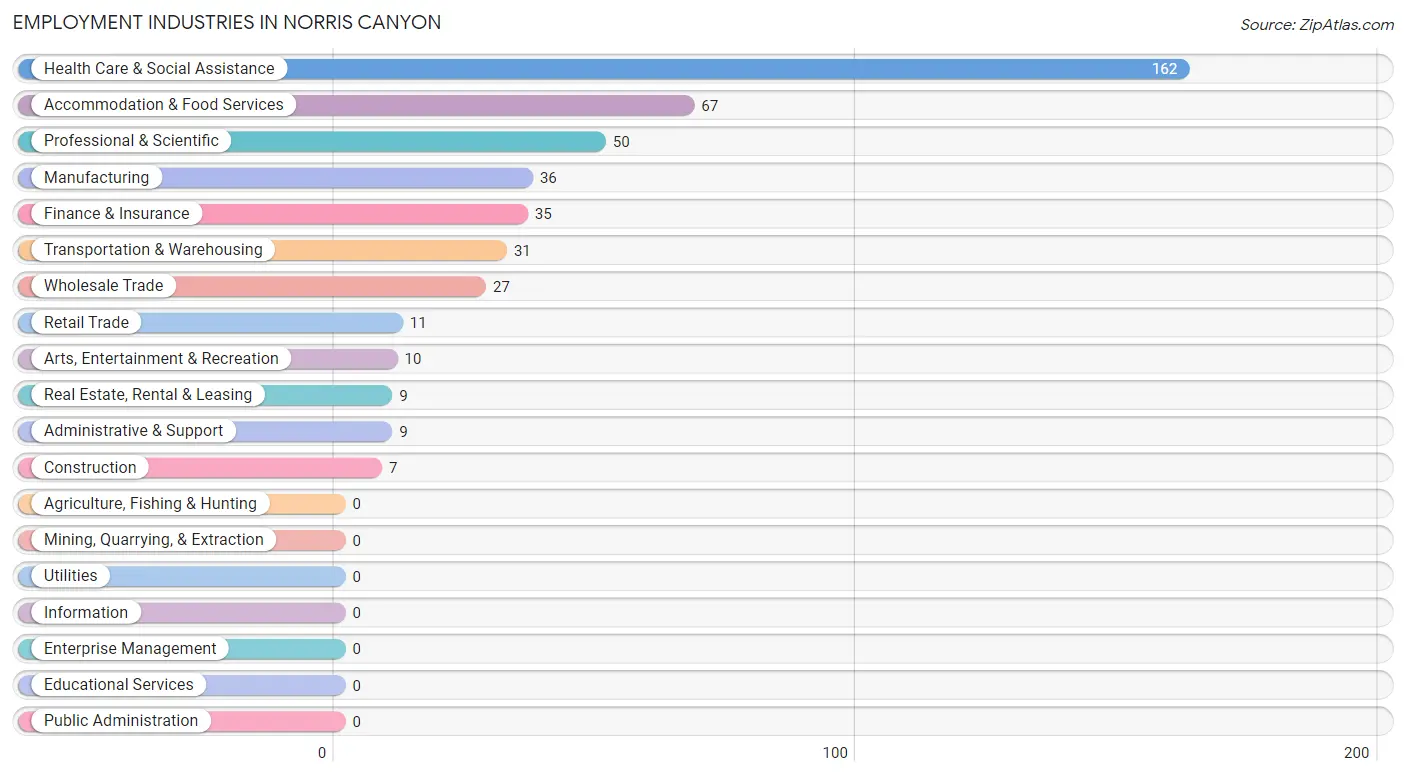
Employment Industries in Norris Canyon
The major employment industries in Norris Canyon include Health Care & Social Assistance (162 | 35.7%), Accommodation & Food Services (67 | 14.8%), Professional & Scientific (50 | 11.0%), Manufacturing (36 | 7.9%), and Finance & Insurance (35 | 7.7%).
Employment Industries by Sex in Norris Canyon
The Norris Canyon industries that see more men than women are Finance & Insurance (100.0%), Real Estate, Rental & Leasing (100.0%), and Professional & Scientific (100.0%), whereas the industries that tend to have a higher number of women are Construction (100.0%), Retail Trade (100.0%), and Administrative & Support (100.0%).
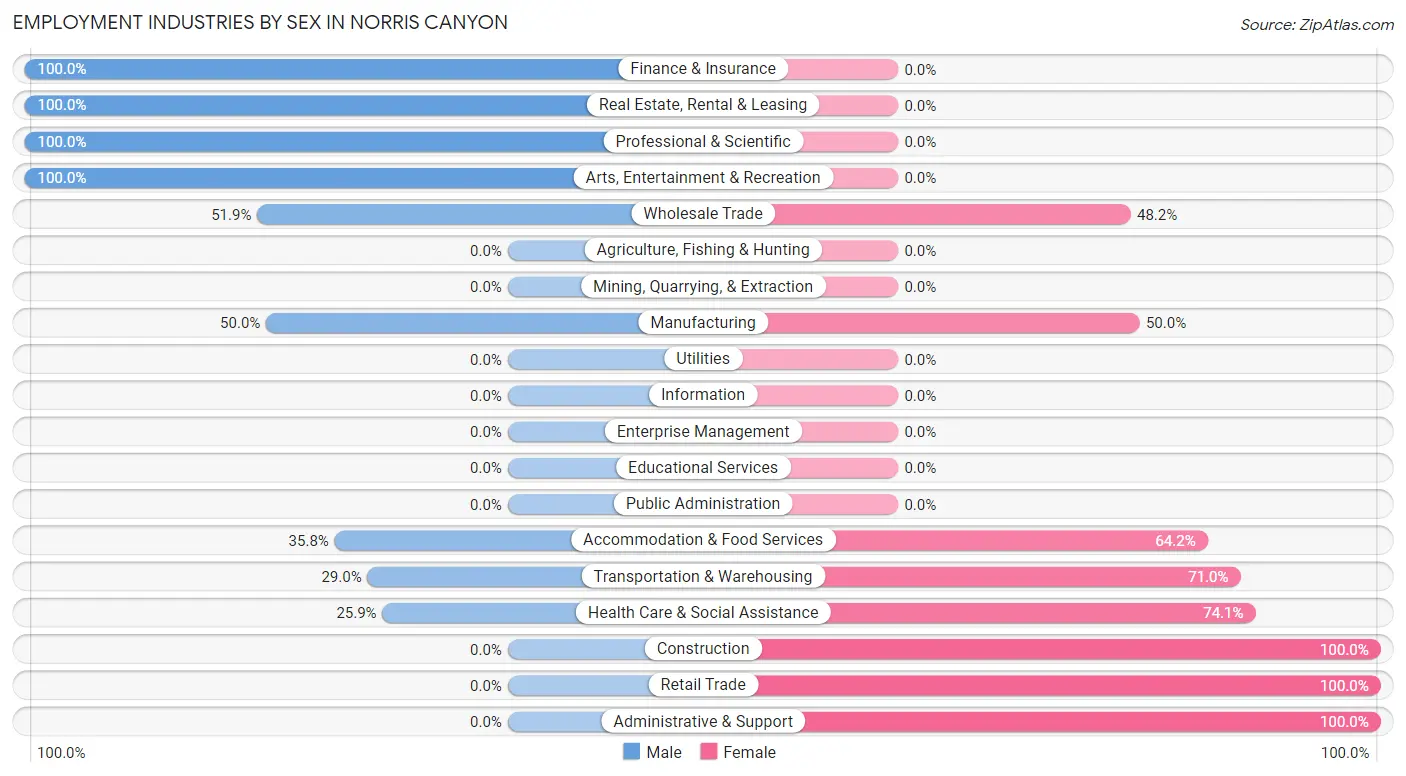
| Industry | Male | Female |
| Agriculture, Fishing & Hunting | 0 (0.0%) | 0 (0.0%) |
| Mining, Quarrying, & Extraction | 0 (0.0%) | 0 (0.0%) |
| Construction | 0 (0.0%) | 7 (100.0%) |
| Manufacturing | 18 (50.0%) | 18 (50.0%) |
| Wholesale Trade | 14 (51.8%) | 13 (48.1%) |
| Retail Trade | 0 (0.0%) | 11 (100.0%) |
| Transportation & Warehousing | 9 (29.0%) | 22 (71.0%) |
| Utilities | 0 (0.0%) | 0 (0.0%) |
| Information | 0 (0.0%) | 0 (0.0%) |
| Finance & Insurance | 35 (100.0%) | 0 (0.0%) |
| Real Estate, Rental & Leasing | 9 (100.0%) | 0 (0.0%) |
| Professional & Scientific | 50 (100.0%) | 0 (0.0%) |
| Enterprise Management | 0 (0.0%) | 0 (0.0%) |
| Administrative & Support | 0 (0.0%) | 9 (100.0%) |
| Educational Services | 0 (0.0%) | 0 (0.0%) |
| Health Care & Social Assistance | 42 (25.9%) | 120 (74.1%) |
| Arts, Entertainment & Recreation | 10 (100.0%) | 0 (0.0%) |
| Accommodation & Food Services | 24 (35.8%) | 43 (64.2%) |
| Public Administration | 0 (0.0%) | 0 (0.0%) |
| Total | 211 (46.5%) | 243 (53.5%) |
Education in Norris Canyon
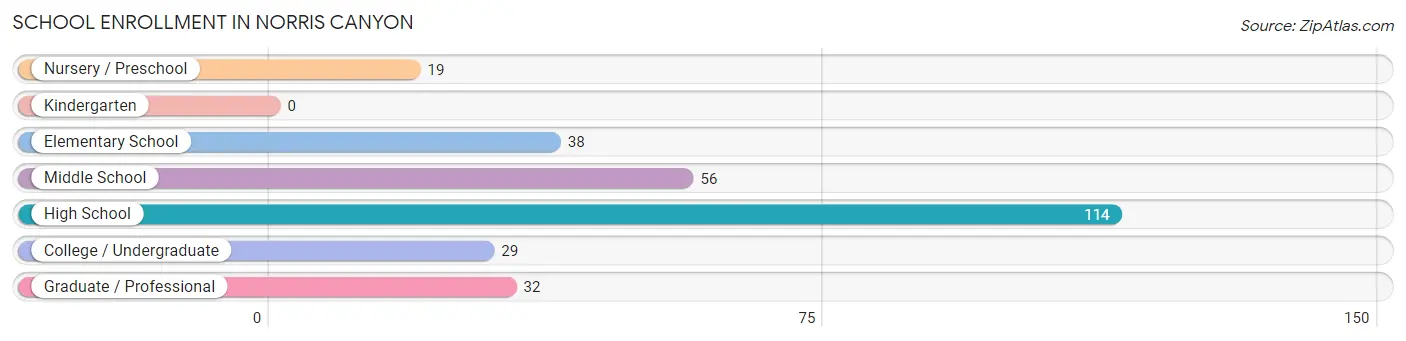
School Enrollment in Norris Canyon
The most common levels of schooling among the 288 students in Norris Canyon are high school (114 | 39.6%), middle school (56 | 19.4%), and elementary school (38 | 13.2%).
| School Level | # Students | % Students |
| Nursery / Preschool | 19 | 6.6% |
| Kindergarten | 0 | 0.0% |
| Elementary School | 38 | 13.2% |
| Middle School | 56 | 19.4% |
| High School | 114 | 39.6% |
| College / Undergraduate | 29 | 10.1% |
| Graduate / Professional | 32 | 11.1% |
| Total | 288 | 100.0% |
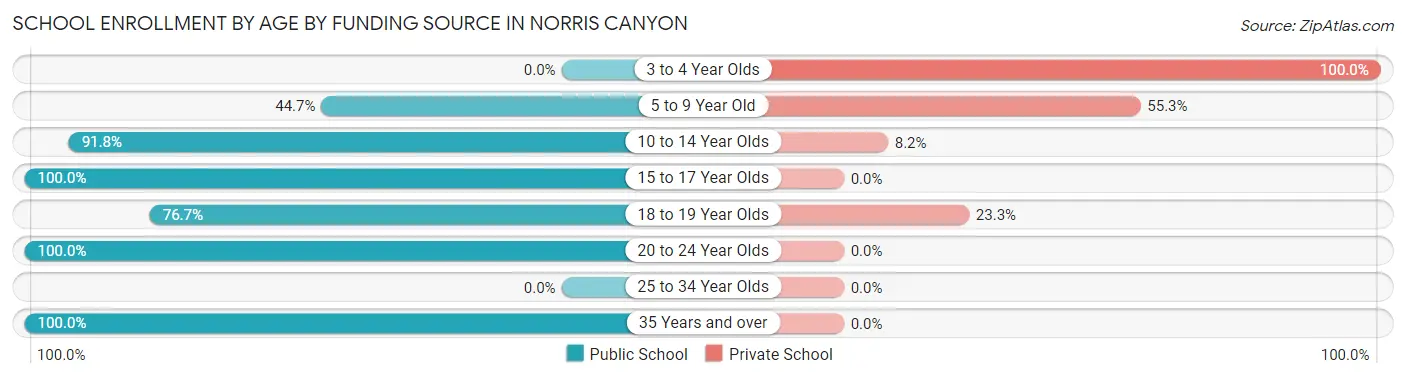
School Enrollment by Age by Funding Source in Norris Canyon
Out of a total of 288 students who are enrolled in schools in Norris Canyon, 53 (18.4%) attend a private institution, while the remaining 235 (81.6%) are enrolled in public schools. The age group of 3 to 4 year olds has the highest likelihood of being enrolled in private schools, with 19 (100.0% in the age bracket) enrolled. Conversely, the age group of 15 to 17 year olds has the lowest likelihood of being enrolled in a private school, with 86 (100.0% in the age bracket) attending a public institution.
| Age Bracket | Public School | Private School |
| 3 to 4 Year Olds | 0 (0.0%) | 19 (100.0%) |
| 5 to 9 Year Old | 17 (44.7%) | 21 (55.3%) |
| 10 to 14 Year Olds | 67 (91.8%) | 6 (8.2%) |
| 15 to 17 Year Olds | 86 (100.0%) | 0 (0.0%) |
| 18 to 19 Year Olds | 23 (76.7%) | 7 (23.3%) |
| 20 to 24 Year Olds | 19 (100.0%) | 0 (0.0%) |
| 25 to 34 Year Olds | 0 (0.0%) | 0 (0.0%) |
| 35 Years and over | 23 (100.0%) | 0 (0.0%) |
| Total | 235 (81.6%) | 53 (18.4%) |
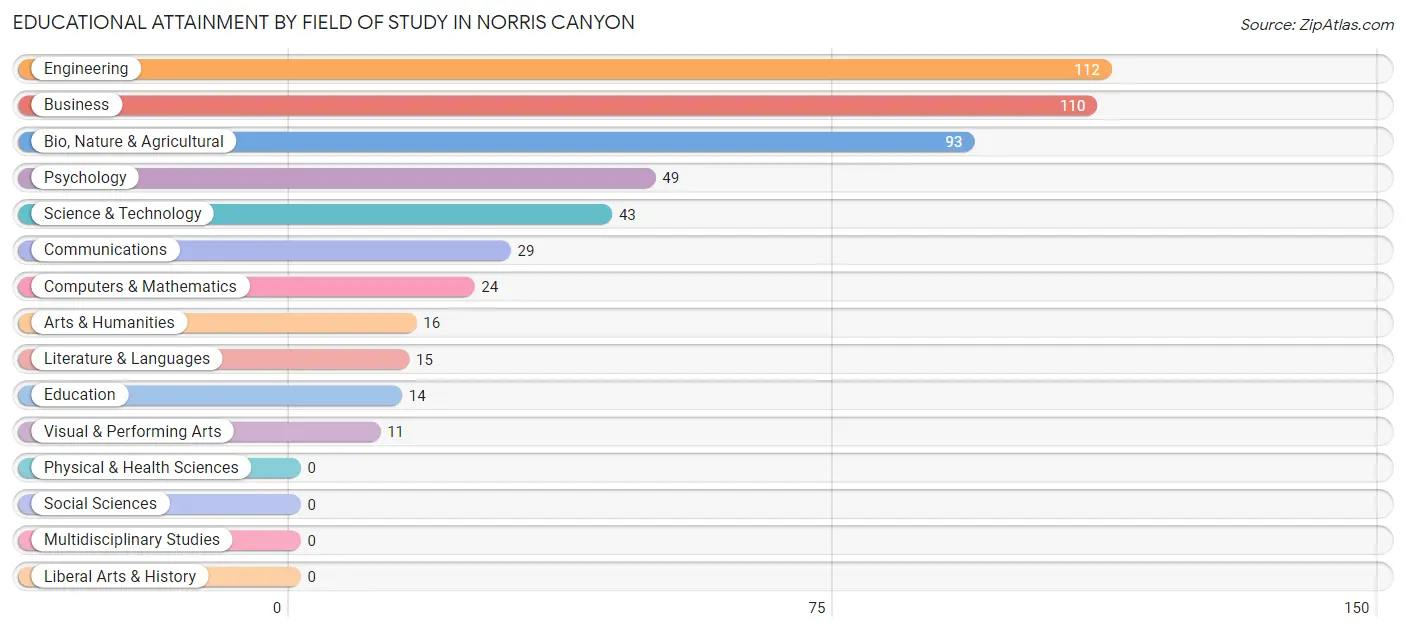
Educational Attainment by Field of Study in Norris Canyon
Engineering (112 | 21.7%), business (110 | 21.3%), bio, nature & agricultural (93 | 18.0%), psychology (49 | 9.5%), and science & technology (43 | 8.3%) are the most common fields of study among 516 individuals in Norris Canyon who have obtained a bachelor's degree or higher.
| Field of Study | # Graduates | % Graduates |
| Computers & Mathematics | 24 | 4.6% |
| Bio, Nature & Agricultural | 93 | 18.0% |
| Physical & Health Sciences | 0 | 0.0% |
| Psychology | 49 | 9.5% |
| Social Sciences | 0 | 0.0% |
| Engineering | 112 | 21.7% |
| Multidisciplinary Studies | 0 | 0.0% |
| Science & Technology | 43 | 8.3% |
| Business | 110 | 21.3% |
| Education | 14 | 2.7% |
| Literature & Languages | 15 | 2.9% |
| Liberal Arts & History | 0 | 0.0% |
| Visual & Performing Arts | 11 | 2.1% |
| Communications | 29 | 5.6% |
| Arts & Humanities | 16 | 3.1% |
| Total | 516 | 100.0% |
Transportation & Commute in Norris Canyon
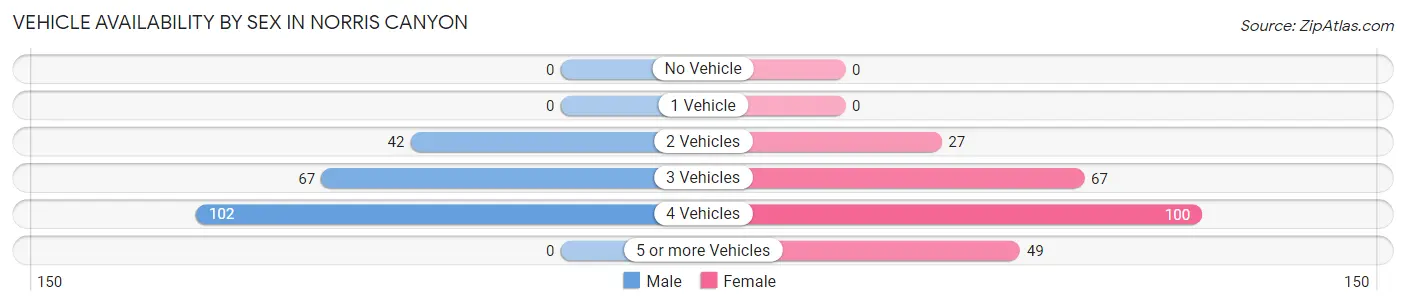
Vehicle Availability by Sex in Norris Canyon
The most prevalent vehicle ownership categories in Norris Canyon are males with 4 vehicles (102, accounting for 48.3%) and females with 4 vehicles (100, making up 42.0%).
| Vehicles Available | Male | Female |
| No Vehicle | 0 (0.0%) | 0 (0.0%) |
| 1 Vehicle | 0 (0.0%) | 0 (0.0%) |
| 2 Vehicles | 42 (19.9%) | 27 (11.1%) |
| 3 Vehicles | 67 (31.8%) | 67 (27.6%) |
| 4 Vehicles | 102 (48.3%) | 100 (41.1%) |
| 5 or more Vehicles | 0 (0.0%) | 49 (20.2%) |
| Total | 211 (100.0%) | 243 (100.0%) |
Commute Time in Norris Canyon
The most frequently occuring commute durations in Norris Canyon are 45 to 59 minutes (86 commuters, 26.0%), 20 to 24 minutes (45 commuters, 13.6%), and 10 to 14 minutes (42 commuters, 12.7%).
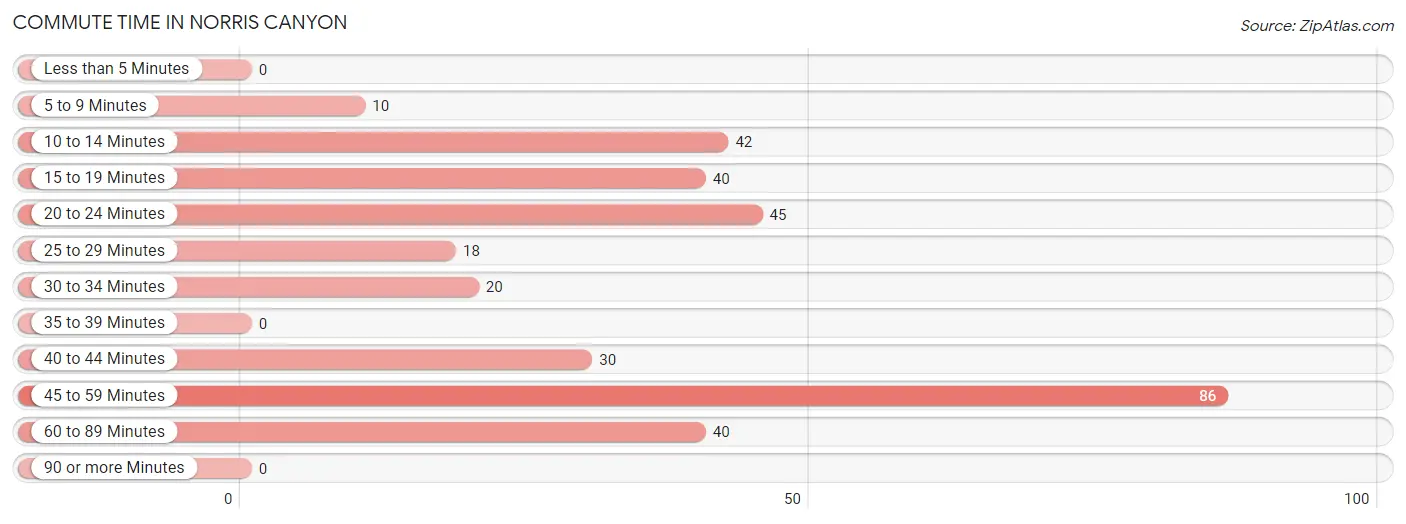
| Commute Time | # Commuters | % Commuters |
| Less than 5 Minutes | 0 | 0.0% |
| 5 to 9 Minutes | 10 | 3.0% |
| 10 to 14 Minutes | 42 | 12.7% |
| 15 to 19 Minutes | 40 | 12.1% |
| 20 to 24 Minutes | 45 | 13.6% |
| 25 to 29 Minutes | 18 | 5.4% |
| 30 to 34 Minutes | 20 | 6.0% |
| 35 to 39 Minutes | 0 | 0.0% |
| 40 to 44 Minutes | 30 | 9.1% |
| 45 to 59 Minutes | 86 | 26.0% |
| 60 to 89 Minutes | 40 | 12.1% |
| 90 or more Minutes | 0 | 0.0% |
Commute Time by Sex in Norris Canyon
The most common commute times in Norris Canyon are 10 to 14 minutes (21 commuters, 16.4%) for males and 45 to 59 minutes (71 commuters, 35.0%) for females.
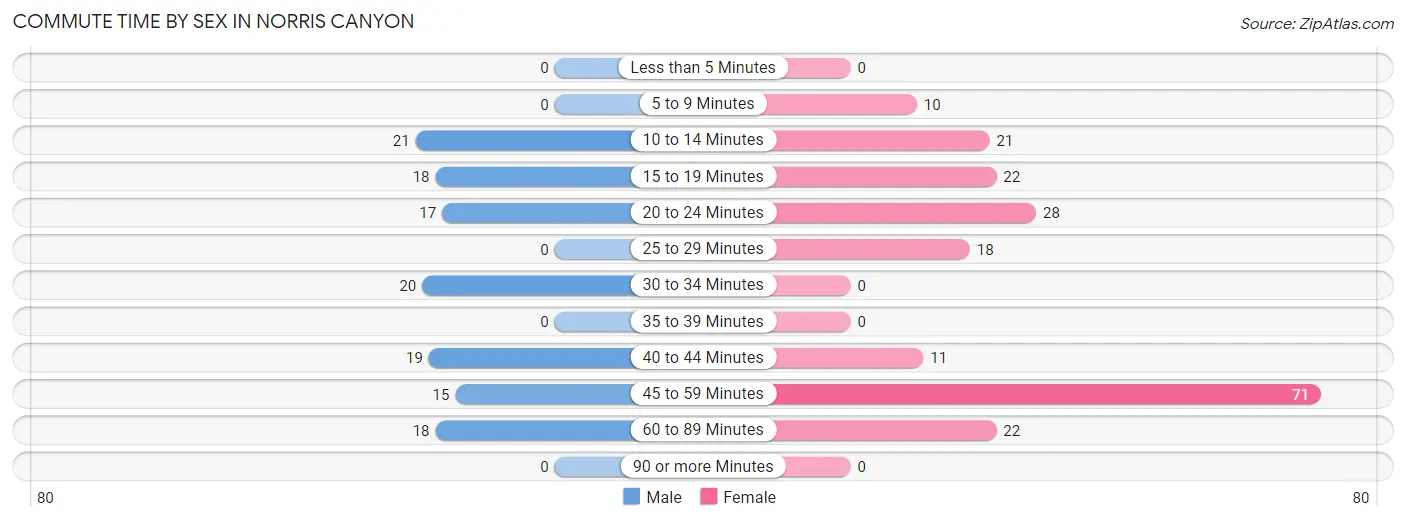
| Commute Time | Male | Female |
| Less than 5 Minutes | 0 (0.0%) | 0 (0.0%) |
| 5 to 9 Minutes | 0 (0.0%) | 10 (4.9%) |
| 10 to 14 Minutes | 21 (16.4%) | 21 (10.3%) |
| 15 to 19 Minutes | 18 (14.1%) | 22 (10.8%) |
| 20 to 24 Minutes | 17 (13.3%) | 28 (13.8%) |
| 25 to 29 Minutes | 0 (0.0%) | 18 (8.9%) |
| 30 to 34 Minutes | 20 (15.6%) | 0 (0.0%) |
| 35 to 39 Minutes | 0 (0.0%) | 0 (0.0%) |
| 40 to 44 Minutes | 19 (14.8%) | 11 (5.4%) |
| 45 to 59 Minutes | 15 (11.7%) | 71 (35.0%) |
| 60 to 89 Minutes | 18 (14.1%) | 22 (10.8%) |
| 90 or more Minutes | 0 (0.0%) | 0 (0.0%) |
Time of Departure to Work by Sex in Norris Canyon
The most frequent times of departure to work in Norris Canyon are 8:00 AM to 8:29 AM (53, 41.4%) for males and 8:00 AM to 8:29 AM (60, 29.6%) for females.
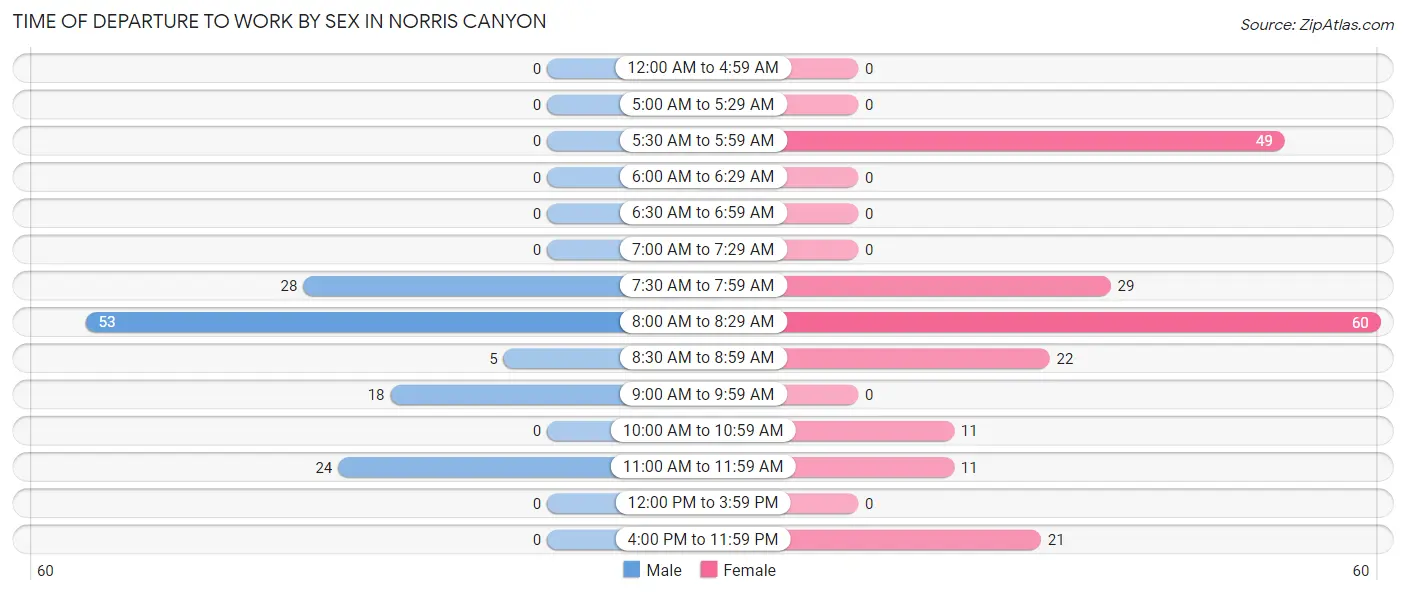
| Time of Departure | Male | Female |
| 12:00 AM to 4:59 AM | 0 (0.0%) | 0 (0.0%) |
| 5:00 AM to 5:29 AM | 0 (0.0%) | 0 (0.0%) |
| 5:30 AM to 5:59 AM | 0 (0.0%) | 49 (24.1%) |
| 6:00 AM to 6:29 AM | 0 (0.0%) | 0 (0.0%) |
| 6:30 AM to 6:59 AM | 0 (0.0%) | 0 (0.0%) |
| 7:00 AM to 7:29 AM | 0 (0.0%) | 0 (0.0%) |
| 7:30 AM to 7:59 AM | 28 (21.9%) | 29 (14.3%) |
| 8:00 AM to 8:29 AM | 53 (41.4%) | 60 (29.6%) |
| 8:30 AM to 8:59 AM | 5 (3.9%) | 22 (10.8%) |
| 9:00 AM to 9:59 AM | 18 (14.1%) | 0 (0.0%) |
| 10:00 AM to 10:59 AM | 0 (0.0%) | 11 (5.4%) |
| 11:00 AM to 11:59 AM | 24 (18.8%) | 11 (5.4%) |
| 12:00 PM to 3:59 PM | 0 (0.0%) | 0 (0.0%) |
| 4:00 PM to 11:59 PM | 0 (0.0%) | 21 (10.3%) |
| Total | 128 (100.0%) | 203 (100.0%) |
Housing Occupancy in Norris Canyon
Occupancy by Ownership in Norris Canyon
Of the total 283 dwellings in Norris Canyon, owner-occupied units account for 283 (100.0%), while renter-occupied units make up 0 (0.0%).
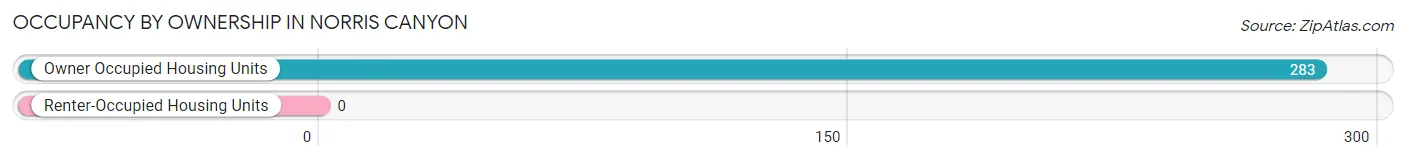
| Occupancy | # Housing Units | % Housing Units |
| Owner Occupied Housing Units | 283 | 100.0% |
| Renter-Occupied Housing Units | 0 | 0.0% |
| Total Occupied Housing Units | 283 | 100.0% |
Occupancy by Household Size in Norris Canyon
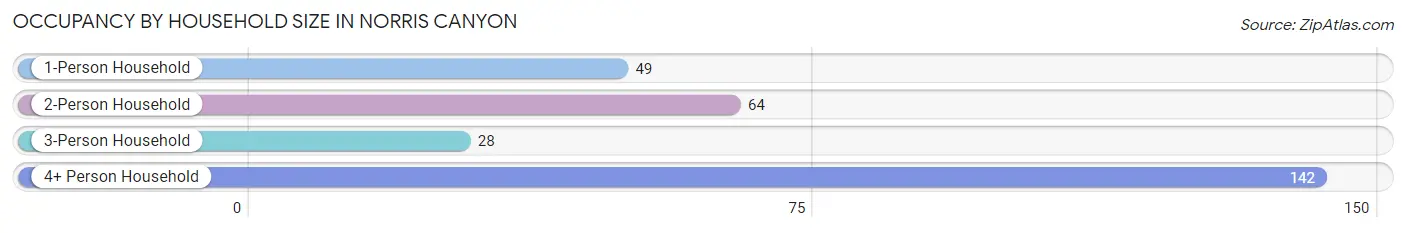
| Household Size | # Housing Units | % Housing Units |
| 1-Person Household | 49 | 17.3% |
| 2-Person Household | 64 | 22.6% |
| 3-Person Household | 28 | 9.9% |
| 4+ Person Household | 142 | 50.2% |
| Total Housing Units | 283 | 100.0% |
Occupancy by Ownership by Household Size in Norris Canyon
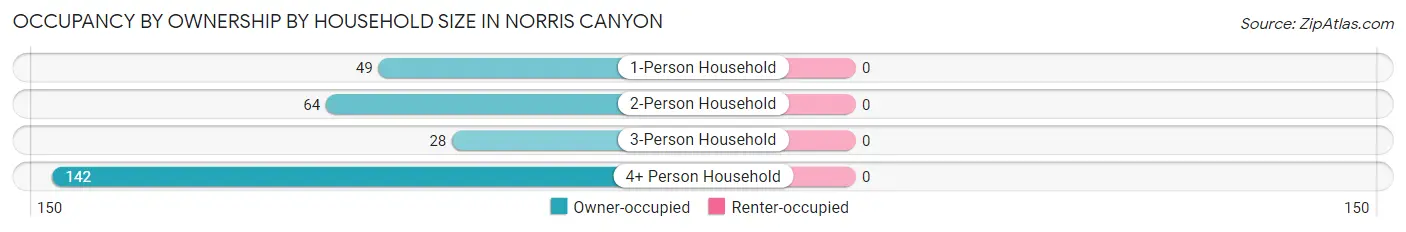
| Household Size | Owner-occupied | Renter-occupied |
| 1-Person Household | 49 (100.0%) | 0 (0.0%) |
| 2-Person Household | 64 (100.0%) | 0 (0.0%) |
| 3-Person Household | 28 (100.0%) | 0 (0.0%) |
| 4+ Person Household | 142 (100.0%) | 0 (0.0%) |
| Total Housing Units | 283 (100.0%) | 0 (0.0%) |
Occupancy by Educational Attainment in Norris Canyon
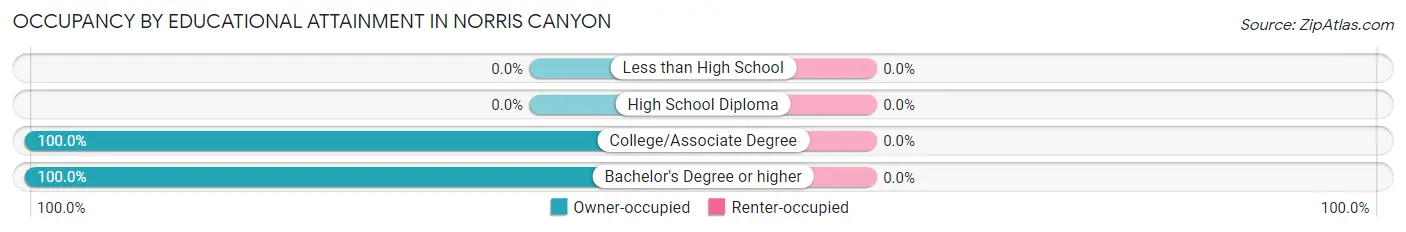
| Household Size | Owner-occupied | Renter-occupied |
| Less than High School | 0 (0.0%) | 0 (0.0%) |
| High School Diploma | 0 (0.0%) | 0 (0.0%) |
| College/Associate Degree | 9 (100.0%) | 0 (0.0%) |
| Bachelor's Degree or higher | 274 (100.0%) | 0 (0.0%) |
Occupancy by Age of Householder in Norris Canyon
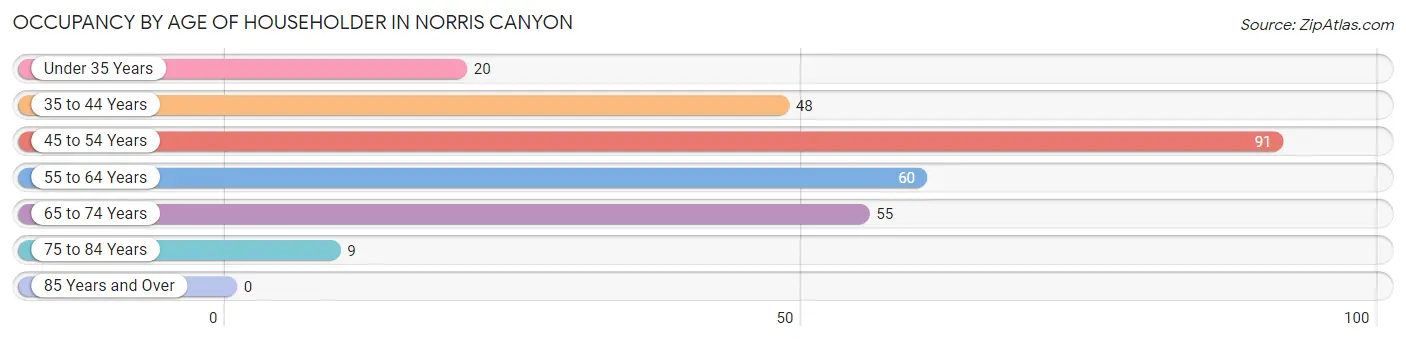
| Age Bracket | # Households | % Households |
| Under 35 Years | 20 | 7.1% |
| 35 to 44 Years | 48 | 17.0% |
| 45 to 54 Years | 91 | 32.2% |
| 55 to 64 Years | 60 | 21.2% |
| 65 to 74 Years | 55 | 19.4% |
| 75 to 84 Years | 9 | 3.2% |
| 85 Years and Over | 0 | 0.0% |
| Total | 283 | 100.0% |
Housing Finances in Norris Canyon
Median Income by Occupancy in Norris Canyon
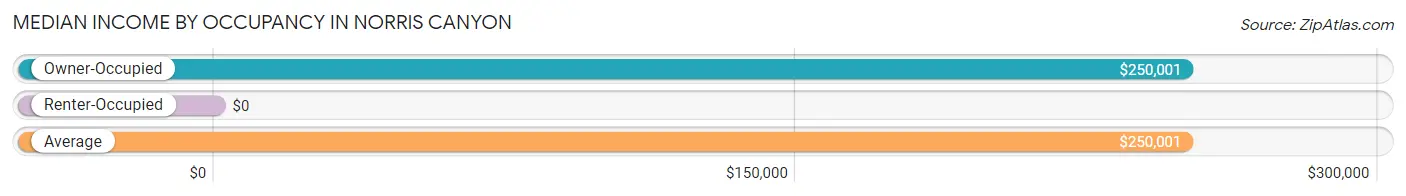
| Occupancy Type | # Households | Median Income |
| Owner-Occupied | 283 (100.0%) | $250,001 |
| Renter-Occupied | 0 (0.0%) | $0 |
| Average | 283 (100.0%) | $250,001 |
Occupancy by Householder Income Bracket in Norris Canyon
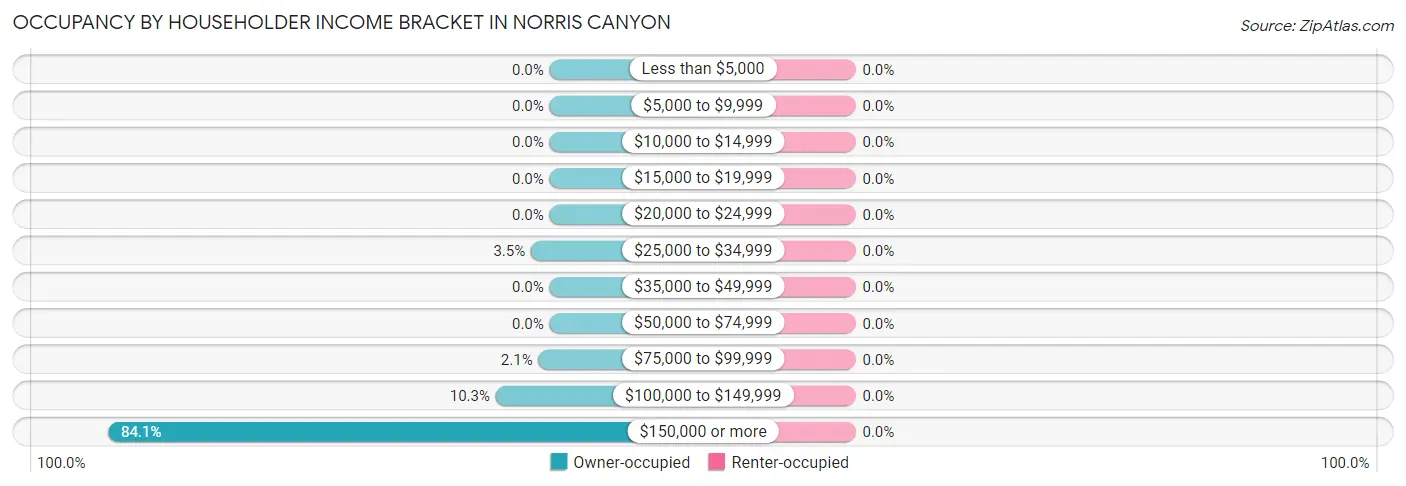
| Income Bracket | Owner-occupied | Renter-occupied |
| Less than $5,000 | 0 (0.0%) | 0 (0.0%) |
| $5,000 to $9,999 | 0 (0.0%) | 0 (0.0%) |
| $10,000 to $14,999 | 0 (0.0%) | 0 (0.0%) |
| $15,000 to $19,999 | 0 (0.0%) | 0 (0.0%) |
| $20,000 to $24,999 | 0 (0.0%) | 0 (0.0%) |
| $25,000 to $34,999 | 10 (3.5%) | 0 (0.0%) |
| $35,000 to $49,999 | 0 (0.0%) | 0 (0.0%) |
| $50,000 to $74,999 | 0 (0.0%) | 0 (0.0%) |
| $75,000 to $99,999 | 6 (2.1%) | 0 (0.0%) |
| $100,000 to $149,999 | 29 (10.2%) | 0 (0.0%) |
| $150,000 or more | 238 (84.1%) | 0 (0.0%) |
| Total | 283 (100.0%) | 0 (0.0%) |
Monthly Housing Cost Tiers in Norris Canyon
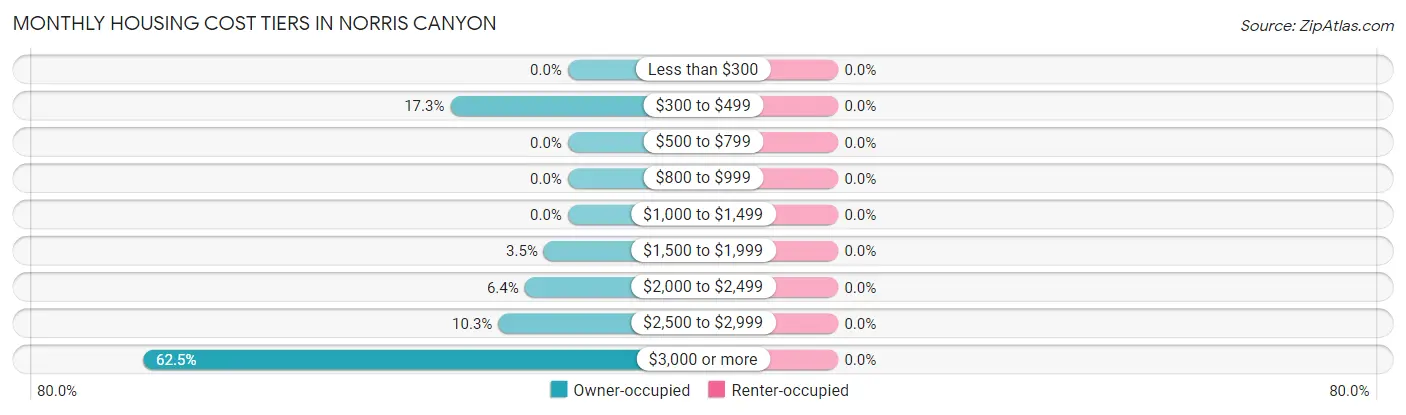
| Monthly Cost | Owner-occupied | Renter-occupied |
| Less than $300 | 0 (0.0%) | 0 (0.0%) |
| $300 to $499 | 49 (17.3%) | 0 (0.0%) |
| $500 to $799 | 0 (0.0%) | 0 (0.0%) |
| $800 to $999 | 0 (0.0%) | 0 (0.0%) |
| $1,000 to $1,499 | 0 (0.0%) | 0 (0.0%) |
| $1,500 to $1,999 | 10 (3.5%) | 0 (0.0%) |
| $2,000 to $2,499 | 18 (6.4%) | 0 (0.0%) |
| $2,500 to $2,999 | 29 (10.2%) | 0 (0.0%) |
| $3,000 or more | 177 (62.5%) | 0 (0.0%) |
| Total | 283 (100.0%) | 0 (0.0%) |
Physical Housing Characteristics in Norris Canyon
Housing Structures in Norris Canyon
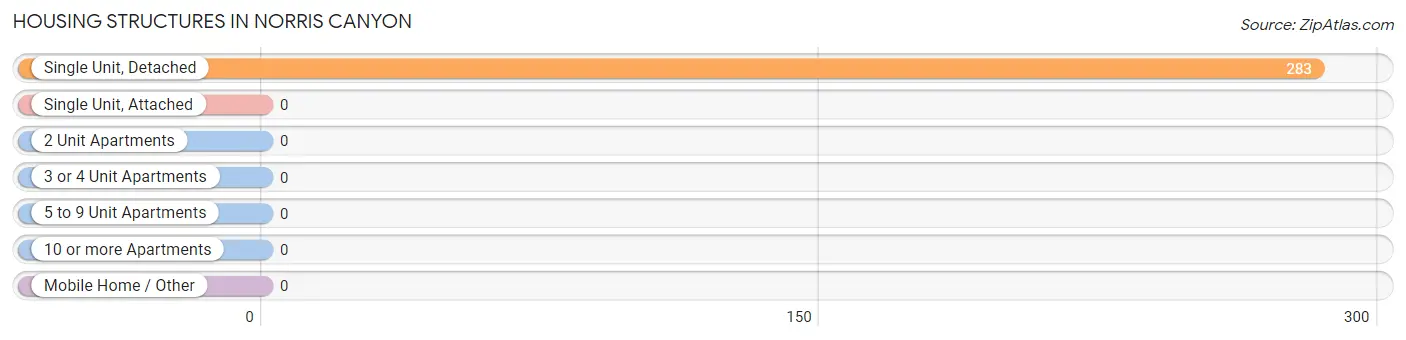
| Structure Type | # Housing Units | % Housing Units |
| Single Unit, Detached | 283 | 100.0% |
| Single Unit, Attached | 0 | 0.0% |
| 2 Unit Apartments | 0 | 0.0% |
| 3 or 4 Unit Apartments | 0 | 0.0% |
| 5 to 9 Unit Apartments | 0 | 0.0% |
| 10 or more Apartments | 0 | 0.0% |
| Mobile Home / Other | 0 | 0.0% |
| Total | 283 | 100.0% |
Housing Structures by Occupancy in Norris Canyon
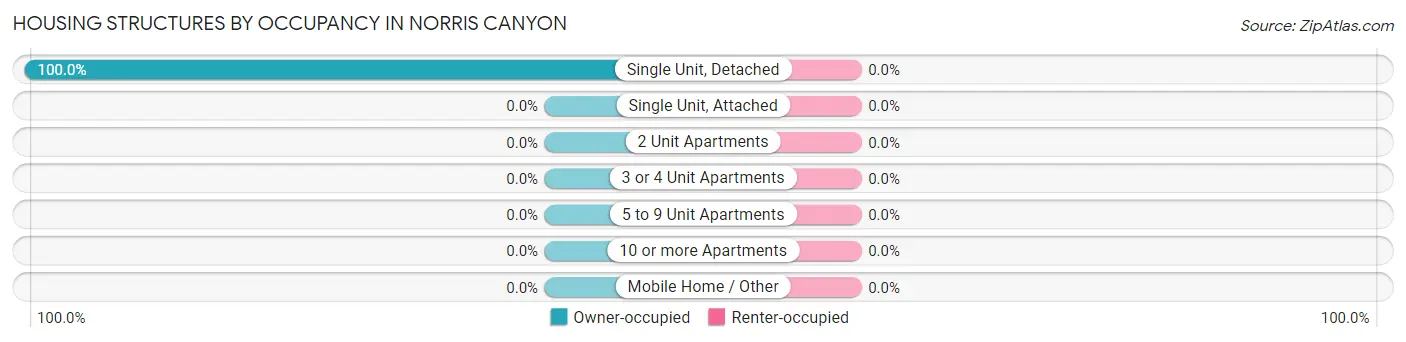
| Structure Type | Owner-occupied | Renter-occupied |
| Single Unit, Detached | 283 (100.0%) | 0 (0.0%) |
| Single Unit, Attached | 0 (0.0%) | 0 (0.0%) |
| 2 Unit Apartments | 0 (0.0%) | 0 (0.0%) |
| 3 or 4 Unit Apartments | 0 (0.0%) | 0 (0.0%) |
| 5 to 9 Unit Apartments | 0 (0.0%) | 0 (0.0%) |
| 10 or more Apartments | 0 (0.0%) | 0 (0.0%) |
| Mobile Home / Other | 0 (0.0%) | 0 (0.0%) |
| Total | 283 (100.0%) | 0 (0.0%) |
Housing Structures by Number of Rooms in Norris Canyon
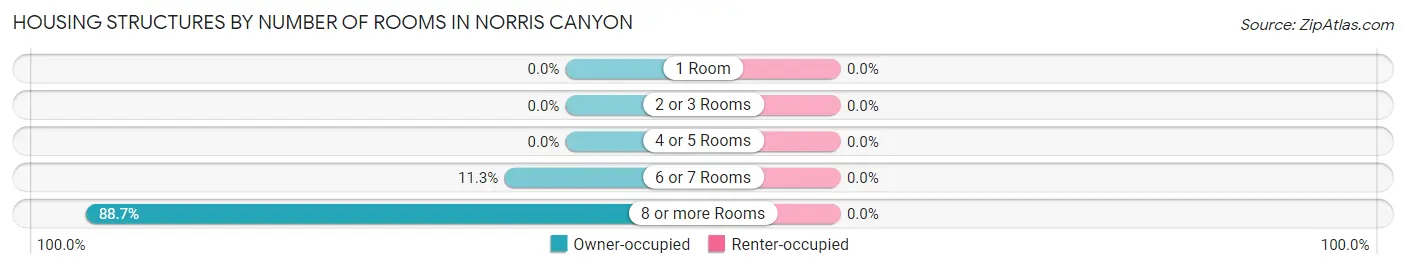
| Number of Rooms | Owner-occupied | Renter-occupied |
| 1 Room | 0 (0.0%) | 0 (0.0%) |
| 2 or 3 Rooms | 0 (0.0%) | 0 (0.0%) |
| 4 or 5 Rooms | 0 (0.0%) | 0 (0.0%) |
| 6 or 7 Rooms | 32 (11.3%) | 0 (0.0%) |
| 8 or more Rooms | 251 (88.7%) | 0 (0.0%) |
| Total | 283 (100.0%) | 0 (0.0%) |
Housing Structure by Heating Type in Norris Canyon
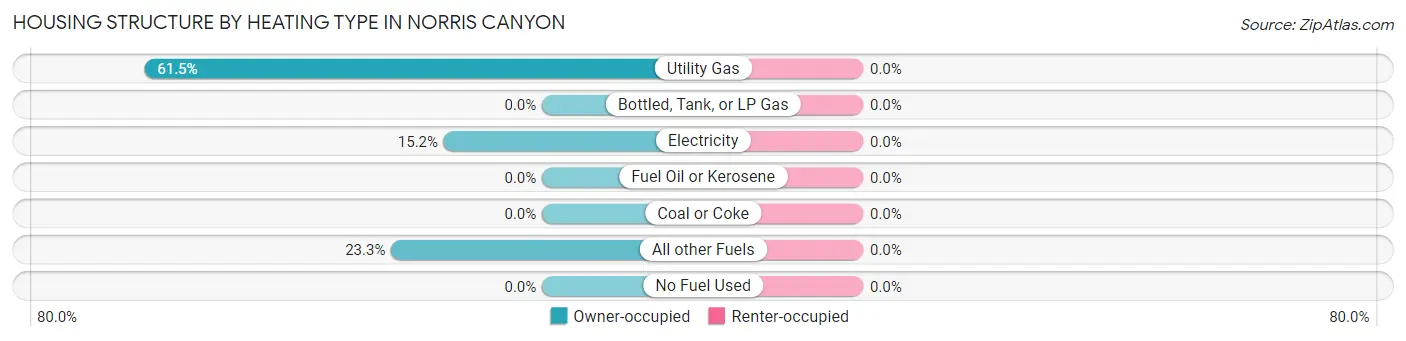
| Heating Type | Owner-occupied | Renter-occupied |
| Utility Gas | 174 (61.5%) | 0 (0.0%) |
| Bottled, Tank, or LP Gas | 0 (0.0%) | 0 (0.0%) |
| Electricity | 43 (15.2%) | 0 (0.0%) |
| Fuel Oil or Kerosene | 0 (0.0%) | 0 (0.0%) |
| Coal or Coke | 0 (0.0%) | 0 (0.0%) |
| All other Fuels | 66 (23.3%) | 0 (0.0%) |
| No Fuel Used | 0 (0.0%) | 0 (0.0%) |
| Total | 283 (100.0%) | 0 (0.0%) |
Household Vehicle Usage in Norris Canyon
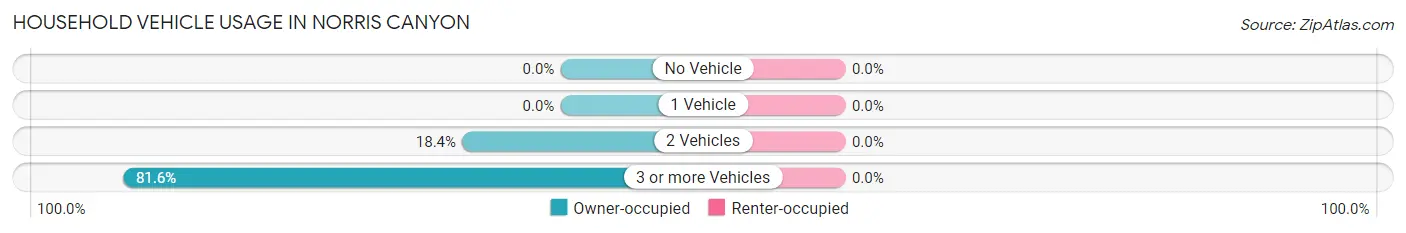
| Vehicles per Household | Owner-occupied | Renter-occupied |
| No Vehicle | 0 (0.0%) | 0 (0.0%) |
| 1 Vehicle | 0 (0.0%) | 0 (0.0%) |
| 2 Vehicles | 52 (18.4%) | 0 (0.0%) |
| 3 or more Vehicles | 231 (81.6%) | 0 (0.0%) |
| Total | 283 (100.0%) | 0 (0.0%) |
Real Estate & Mortgages in Norris Canyon
Real Estate and Mortgage Overview in Norris Canyon
| Characteristic | Without Mortgage | With Mortgage |
| Housing Units | 111 | 172 |
| Median Property Value | $2,000,001 | $2,000,001 |
| Median Household Income | $223,087 | $157 |
| Monthly Housing Costs | $1,501 | $163 |
| Real Estate Taxes | - | - |
Property Value by Mortgage Status in Norris Canyon
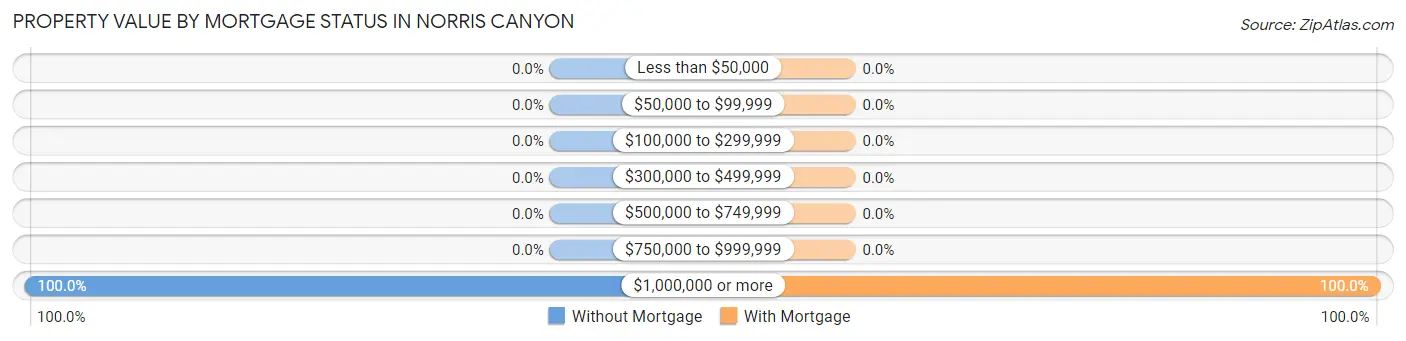
| Property Value | Without Mortgage | With Mortgage |
| Less than $50,000 | 0 (0.0%) | 0 (0.0%) |
| $50,000 to $99,999 | 0 (0.0%) | 0 (0.0%) |
| $100,000 to $299,999 | 0 (0.0%) | 0 (0.0%) |
| $300,000 to $499,999 | 0 (0.0%) | 0 (0.0%) |
| $500,000 to $749,999 | 0 (0.0%) | 0 (0.0%) |
| $750,000 to $999,999 | 0 (0.0%) | 0 (0.0%) |
| $1,000,000 or more | 111 (100.0%) | 172 (100.0%) |
| Total | 111 (100.0%) | 172 (100.0%) |
Household Income by Mortgage Status in Norris Canyon
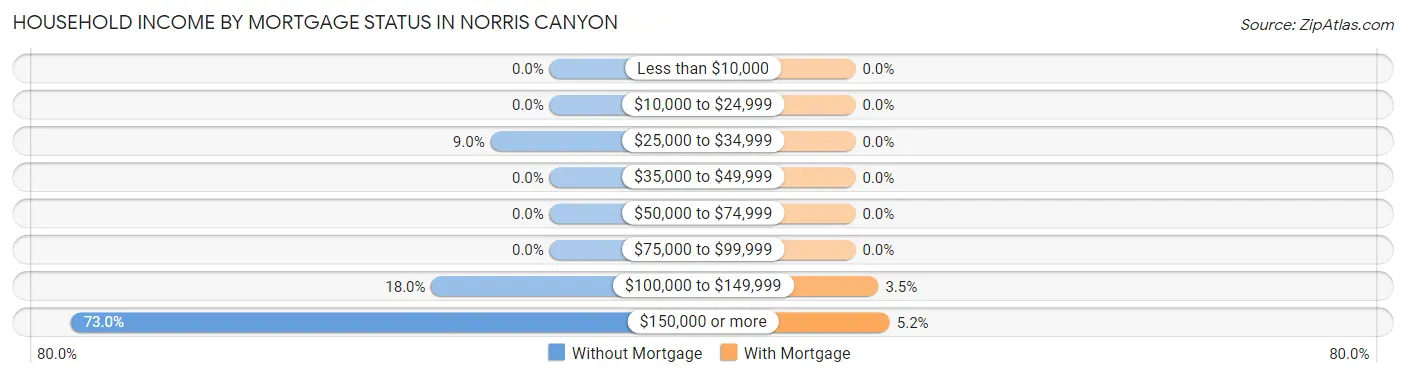
| Household Income | Without Mortgage | With Mortgage |
| Less than $10,000 | 0 (0.0%) | 0 (0.0%) |
| $10,000 to $24,999 | 0 (0.0%) | 0 (0.0%) |
| $25,000 to $34,999 | 10 (9.0%) | 0 (0.0%) |
| $35,000 to $49,999 | 0 (0.0%) | 0 (0.0%) |
| $50,000 to $74,999 | 0 (0.0%) | 0 (0.0%) |
| $75,000 to $99,999 | 0 (0.0%) | 0 (0.0%) |
| $100,000 to $149,999 | 20 (18.0%) | 6 (3.5%) |
| $150,000 or more | 81 (73.0%) | 9 (5.2%) |
| Total | 111 (100.0%) | 172 (100.0%) |
Property Value to Household Income Ratio in Norris Canyon
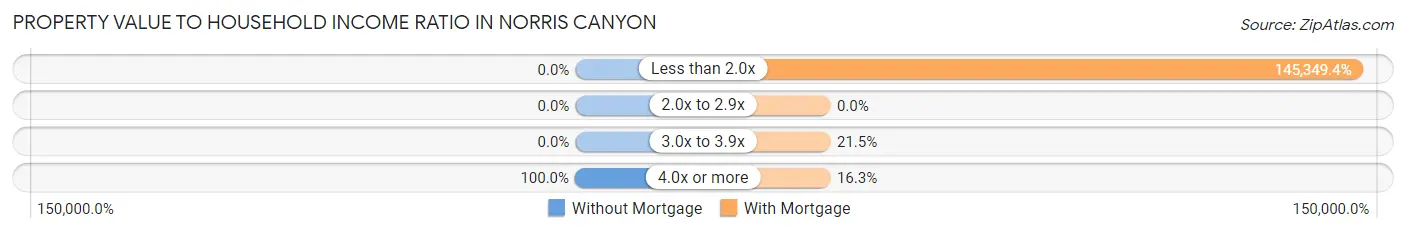
| Value-to-Income Ratio | Without Mortgage | With Mortgage |
| Less than 2.0x | 0 (0.0%) | 250,001 (145,349.4%) |
| 2.0x to 2.9x | 0 (0.0%) | 0 (0.0%) |
| 3.0x to 3.9x | 0 (0.0%) | 37 (21.5%) |
| 4.0x or more | 111 (100.0%) | 28 (16.3%) |
| Total | 111 (100.0%) | 172 (100.0%) |
Real Estate Taxes by Mortgage Status in Norris Canyon
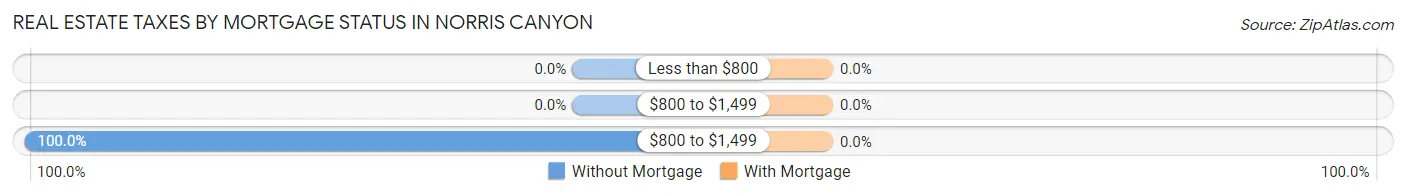
| Property Taxes | Without Mortgage | With Mortgage |
| Less than $800 | 0 (0.0%) | 0 (0.0%) |
| $800 to $1,499 | 0 (0.0%) | 0 (0.0%) |
| $800 to $1,499 | 111 (100.0%) | 0 (0.0%) |
| Total | 111 (100.0%) | 172 (100.0%) |
Health & Disability in Norris Canyon
Health Insurance Coverage by Age in Norris Canyon
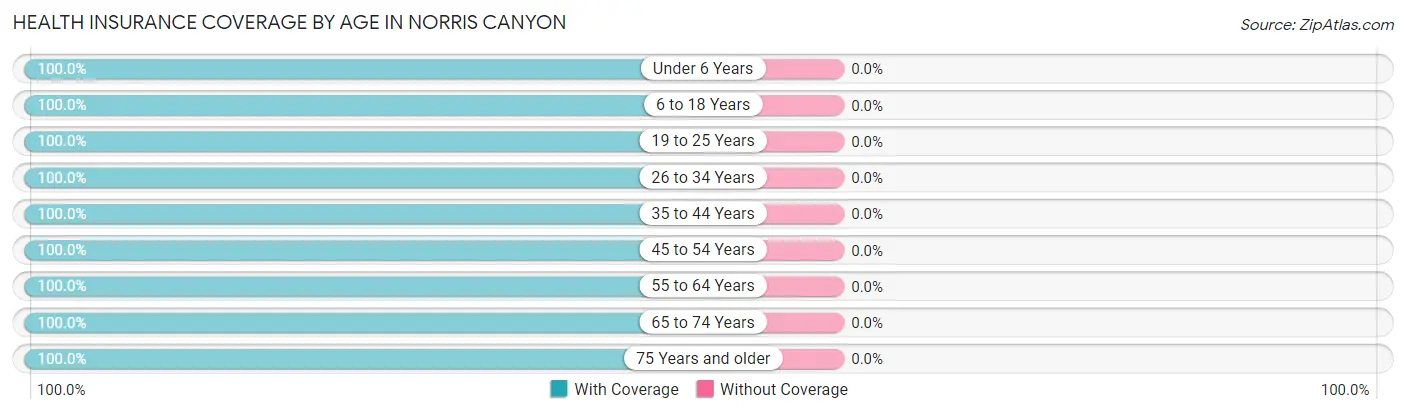
| Age Bracket | With Coverage | Without Coverage |
| Under 6 Years | 19 (100.0%) | 0 (0.0%) |
| 6 to 18 Years | 215 (100.0%) | 0 (0.0%) |
| 19 to 25 Years | 50 (100.0%) | 0 (0.0%) |
| 26 to 34 Years | 53 (100.0%) | 0 (0.0%) |
| 35 to 44 Years | 108 (100.0%) | 0 (0.0%) |
| 45 to 54 Years | 185 (100.0%) | 0 (0.0%) |
| 55 to 64 Years | 182 (100.0%) | 0 (0.0%) |
| 65 to 74 Years | 84 (100.0%) | 0 (0.0%) |
| 75 Years and older | 58 (100.0%) | 0 (0.0%) |
| Total | 954 (100.0%) | 0 (0.0%) |
Health Insurance Coverage by Citizenship Status in Norris Canyon
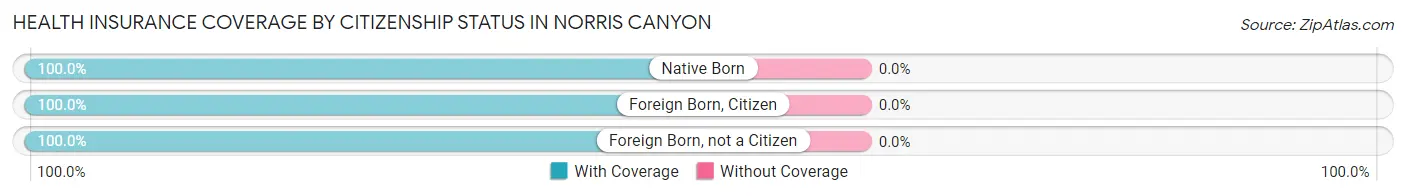
| Citizenship Status | With Coverage | Without Coverage |
| Native Born | 19 (100.0%) | 0 (0.0%) |
| Foreign Born, Citizen | 215 (100.0%) | 0 (0.0%) |
| Foreign Born, not a Citizen | 50 (100.0%) | 0 (0.0%) |
Health Insurance Coverage by Household Income in Norris Canyon
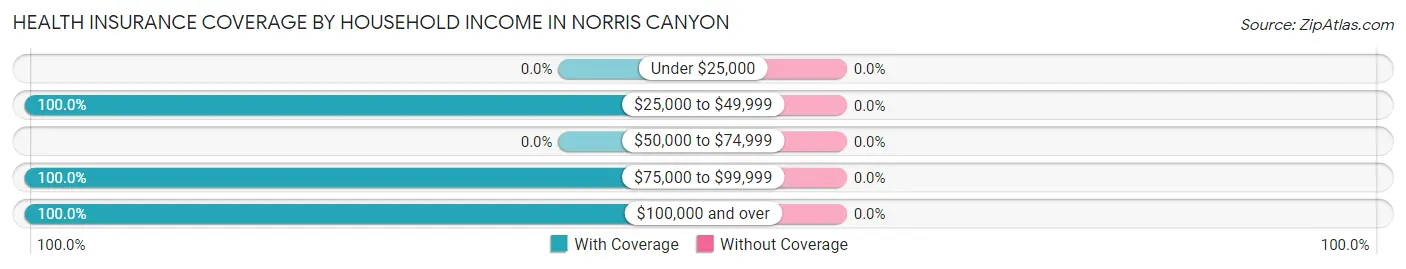
| Household Income | With Coverage | Without Coverage |
| Under $25,000 | 0 (0.0%) | 0 (0.0%) |
| $25,000 to $49,999 | 20 (100.0%) | 0 (0.0%) |
| $50,000 to $74,999 | 0 (0.0%) | 0 (0.0%) |
| $75,000 to $99,999 | 28 (100.0%) | 0 (0.0%) |
| $100,000 and over | 906 (100.0%) | 0 (0.0%) |
Public vs Private Health Insurance Coverage by Age in Norris Canyon
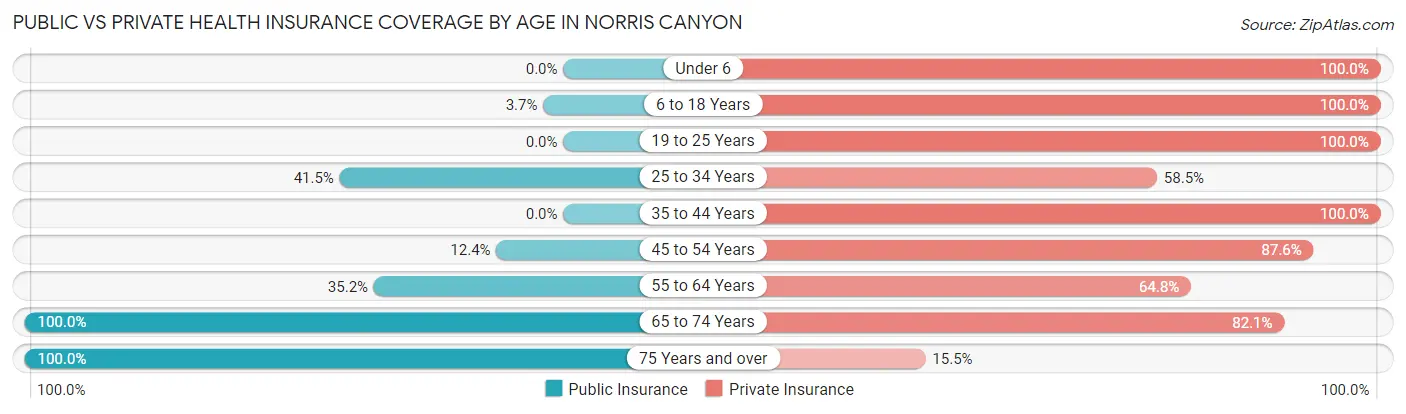
| Age Bracket | Public Insurance | Private Insurance |
| Under 6 | 0 (0.0%) | 19 (100.0%) |
| 6 to 18 Years | 8 (3.7%) | 215 (100.0%) |
| 19 to 25 Years | 0 (0.0%) | 50 (100.0%) |
| 25 to 34 Years | 22 (41.5%) | 31 (58.5%) |
| 35 to 44 Years | 0 (0.0%) | 108 (100.0%) |
| 45 to 54 Years | 23 (12.4%) | 162 (87.6%) |
| 55 to 64 Years | 64 (35.2%) | 118 (64.8%) |
| 65 to 74 Years | 84 (100.0%) | 69 (82.1%) |
| 75 Years and over | 58 (100.0%) | 9 (15.5%) |
| Total | 259 (27.2%) | 781 (81.9%) |
Disability Status by Sex by Age in Norris Canyon
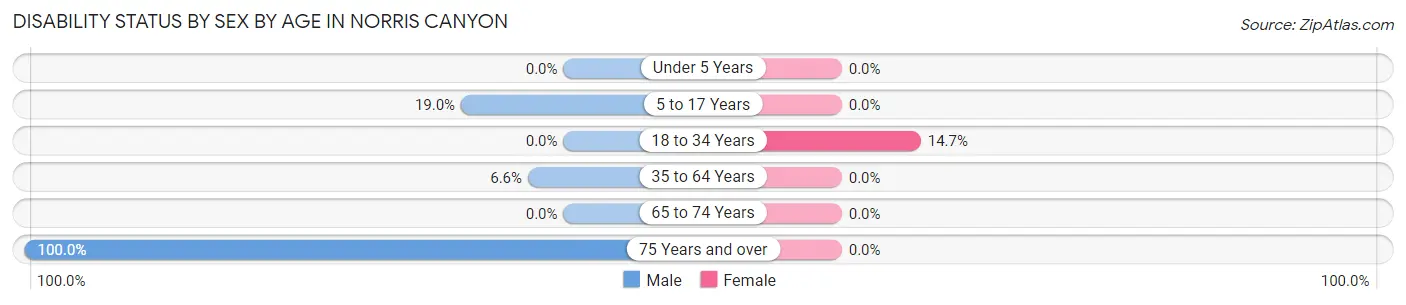
| Age Bracket | Male | Female |
| Under 5 Years | 0 (0.0%) | 0 (0.0%) |
| 5 to 17 Years | 23 (19.0%) | 0 (0.0%) |
| 18 to 34 Years | 0 (0.0%) | 11 (14.7%) |
| 35 to 64 Years | 16 (6.6%) | 0 (0.0%) |
| 65 to 74 Years | 0 (0.0%) | 0 (0.0%) |
| 75 Years and over | 24 (100.0%) | 0 (0.0%) |
Disability Class by Sex by Age in Norris Canyon
Disability Class: Hearing Difficulty
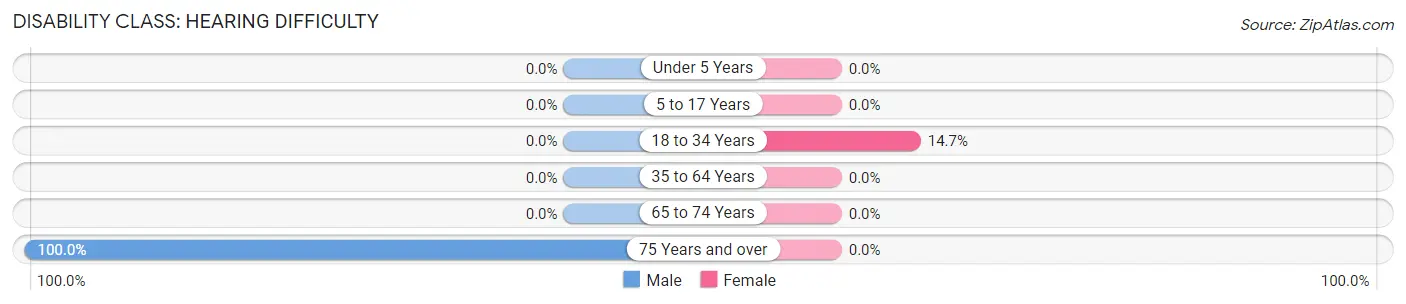
| Age Bracket | Male | Female |
| Under 5 Years | 0 (0.0%) | 0 (0.0%) |
| 5 to 17 Years | 0 (0.0%) | 0 (0.0%) |
| 18 to 34 Years | 0 (0.0%) | 11 (14.7%) |
| 35 to 64 Years | 0 (0.0%) | 0 (0.0%) |
| 65 to 74 Years | 0 (0.0%) | 0 (0.0%) |
| 75 Years and over | 24 (100.0%) | 0 (0.0%) |
Disability Class: Vision Difficulty
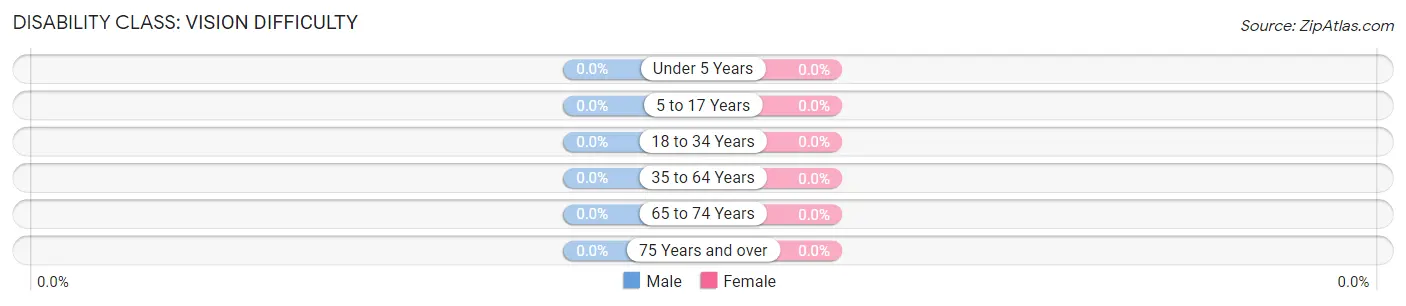
| Age Bracket | Male | Female |
| Under 5 Years | 0 (0.0%) | 0 (0.0%) |
| 5 to 17 Years | 0 (0.0%) | 0 (0.0%) |
| 18 to 34 Years | 0 (0.0%) | 0 (0.0%) |
| 35 to 64 Years | 0 (0.0%) | 0 (0.0%) |
| 65 to 74 Years | 0 (0.0%) | 0 (0.0%) |
| 75 Years and over | 0 (0.0%) | 0 (0.0%) |
Disability Class: Cognitive Difficulty
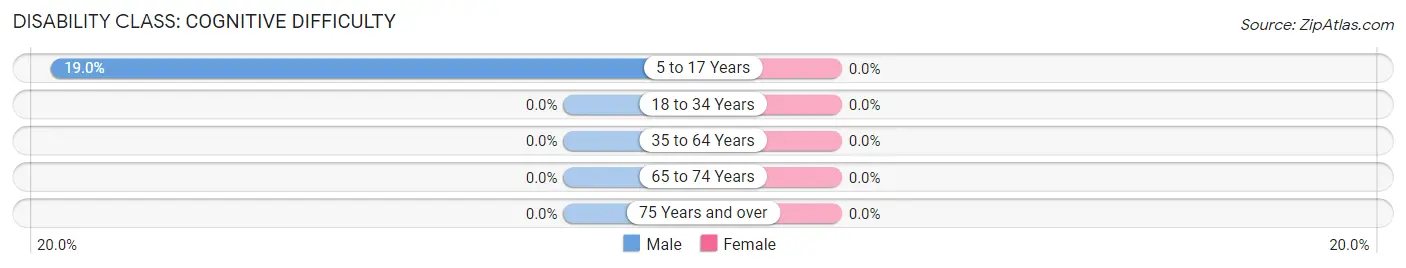
| Age Bracket | Male | Female |
| 5 to 17 Years | 23 (19.0%) | 0 (0.0%) |
| 18 to 34 Years | 0 (0.0%) | 0 (0.0%) |
| 35 to 64 Years | 0 (0.0%) | 0 (0.0%) |
| 65 to 74 Years | 0 (0.0%) | 0 (0.0%) |
| 75 Years and over | 0 (0.0%) | 0 (0.0%) |
Disability Class: Ambulatory Difficulty
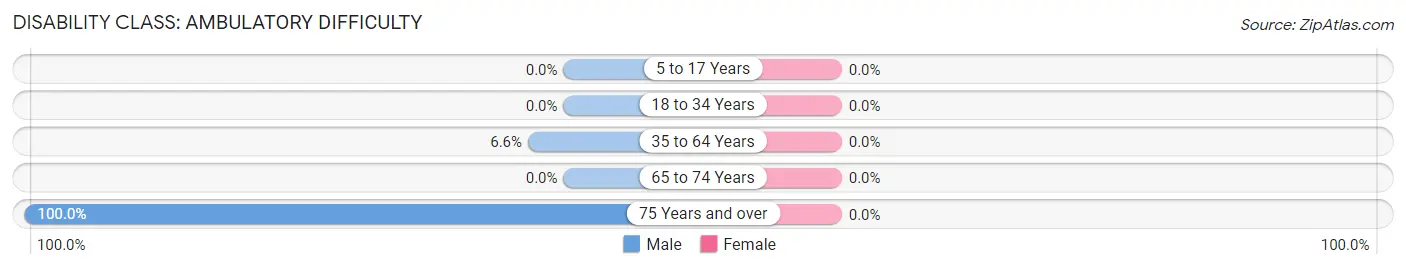
| Age Bracket | Male | Female |
| 5 to 17 Years | 0 (0.0%) | 0 (0.0%) |
| 18 to 34 Years | 0 (0.0%) | 0 (0.0%) |
| 35 to 64 Years | 16 (6.6%) | 0 (0.0%) |
| 65 to 74 Years | 0 (0.0%) | 0 (0.0%) |
| 75 Years and over | 24 (100.0%) | 0 (0.0%) |
Disability Class: Self-Care Difficulty
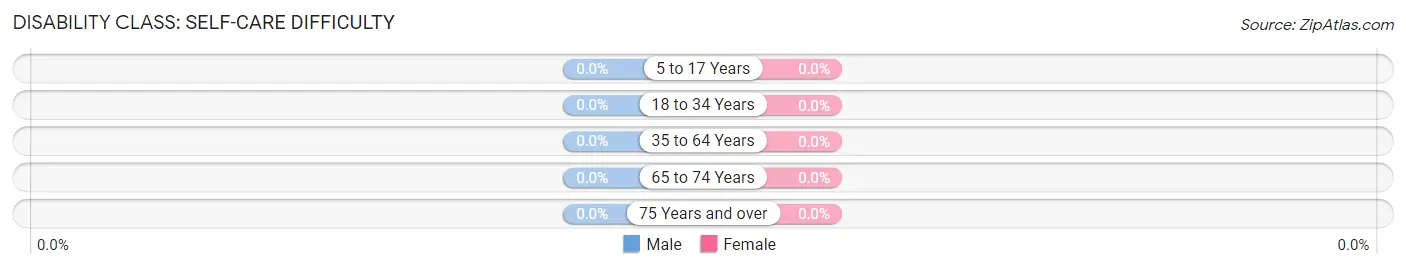
| Age Bracket | Male | Female |
| 5 to 17 Years | 0 (0.0%) | 0 (0.0%) |
| 18 to 34 Years | 0 (0.0%) | 0 (0.0%) |
| 35 to 64 Years | 0 (0.0%) | 0 (0.0%) |
| 65 to 74 Years | 0 (0.0%) | 0 (0.0%) |
| 75 Years and over | 0 (0.0%) | 0 (0.0%) |
Technology Access in Norris Canyon
Computing Device Access in Norris Canyon
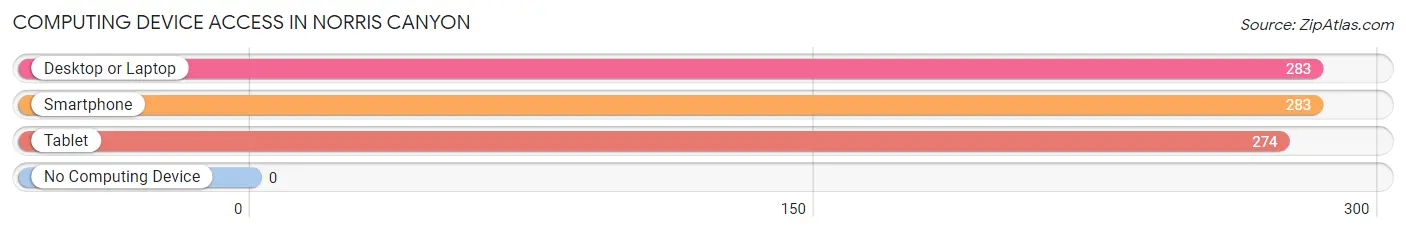
| Device Type | # Households | % Households |
| Desktop or Laptop | 283 | 100.0% |
| Smartphone | 283 | 100.0% |
| Tablet | 274 | 96.8% |
| No Computing Device | 0 | 0.0% |
| Total | 283 | 100.0% |
Internet Access in Norris Canyon
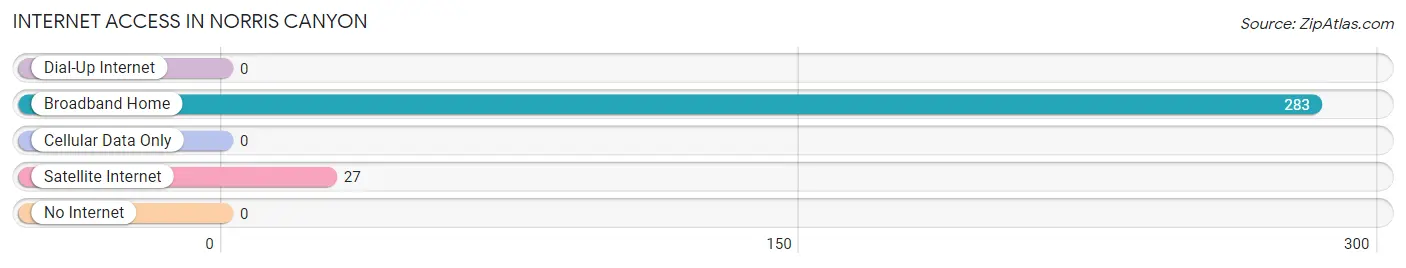
| Internet Type | # Households | % Households |
| Dial-Up Internet | 0 | 0.0% |
| Broadband Home | 283 | 100.0% |
| Cellular Data Only | 0 | 0.0% |
| Satellite Internet | 27 | 9.5% |
| No Internet | 0 | 0.0% |
| Total | 283 | 100.0% |
Norris Canyon Summary
Norris Canyon is a small unincorporated community located in the San Ramon Valley of Contra Costa County, California. It is situated in the foothills of the Diablo Range, approximately 25 miles east of San Francisco. The community is bordered by the cities of San Ramon and Danville, and is home to a population of approximately 1,000 people.
History
The area now known as Norris Canyon was originally inhabited by the Ohlone people, who lived in the area for thousands of years before the arrival of Europeans. The first Europeans to settle in the area were Spanish missionaries, who established the Mission San Jose in 1797. The mission was the first of its kind in California, and was responsible for the conversion of many Native Americans to Christianity.
In the mid-1800s, the area was settled by American pioneers, who established farms and ranches in the area. The community was named after William Norris, who was one of the first settlers in the area. In the late 1800s, the area was home to a number of small businesses, including a blacksmith shop, a general store, and a post office.
Geography
Norris Canyon is located in the San Ramon Valley of Contra Costa County, California. It is situated in the foothills of the Diablo Range, approximately 25 miles east of San Francisco. The community is bordered by the cities of San Ramon and Danville. The area is characterized by rolling hills, oak woodlands, and grasslands. The climate is mild, with temperatures ranging from the mid-50s to the mid-80s throughout the year.
Economy
The economy of Norris Canyon is largely based on the service industry. The area is home to a number of small businesses, including restaurants, retail stores, and professional services. The community is also home to a number of technology companies, including Oracle Corporation and Chevron Corporation.
Demographics
As of the 2010 census, the population of Norris Canyon was 1,000 people. The racial makeup of the community was 79.2% White, 8.2% Asian, 6.2% Hispanic or Latino, and 4.2% African American. The median household income was $107,000, and the median home value was $1,000,000.
Conclusion
Norris Canyon is a small unincorporated community located in the San Ramon Valley of Contra Costa County, California. It is situated in the foothills of the Diablo Range, approximately 25 miles east of San Francisco. The community is bordered by the cities of San Ramon and Danville, and is home to a population of approximately 1,000 people. The economy of Norris Canyon is largely based on the service industry, and the area is home to a number of small businesses, including restaurants, retail stores, and professional services. The racial makeup of the community is 79.2% White, 8.2% Asian, 6.2% Hispanic or Latino, and 4.2% African American. The median household income is $107,000, and the median home value is $1,000,000.
Common Questions
What is Per Capita Income in Norris Canyon?
Per Capita income in Norris Canyon is $118,914.
What is the Median Family Income in Norris Canyon?
Median Family Income in Norris Canyon is $250,001.
What is the Median Household income in Norris Canyon?
Median Household Income in Norris Canyon is $250,001.
What is Income or Wage Gap in Norris Canyon?
Income or Wage Gap in Norris Canyon is 67.2%.
Women in Norris Canyon earn 32.8 cents for every dollar earned by a man.
What is Inequality or Gini Index in Norris Canyon?
Inequality or Gini Index in Norris Canyon is 0.42.
What is the Total Population of Norris Canyon?
Total Population of Norris Canyon is 954.
What is the Total Male Population of Norris Canyon?
Total Male Population of Norris Canyon is 477.
What is the Total Female Population of Norris Canyon?
Total Female Population of Norris Canyon is 477.
What is the Ratio of Males per 100 Females in Norris Canyon?
There are 100.00 Males per 100 Females in Norris Canyon.
What is the Ratio of Females per 100 Males in Norris Canyon?
There are 100.00 Females per 100 Males in Norris Canyon.
What is the Median Population Age in Norris Canyon?
Median Population Age in Norris Canyon is 48.4 Years.
What is the Average Family Size in Norris Canyon
Average Family Size in Norris Canyon is 3.8 People.
What is the Average Household Size in Norris Canyon
Average Household Size in Norris Canyon is 3.4 People.
How Large is the Labor Force in Norris Canyon?
There are 485 People in the Labor Forcein in Norris Canyon.
What is the Percentage of People in the Labor Force in Norris Canyon?
60.4% of People are in the Labor Force in Norris Canyon.
What is the Unemployment Rate in Norris Canyon?
Unemployment Rate in Norris Canyon is 6.4%.