Cities with the Highest Percentage of Population Employed in Health Diagnosing & Treating in South Carolina
RELATED REPORTS & OPTIONS
Health Diagnosing & Treating
South Carolina
Compare Cities
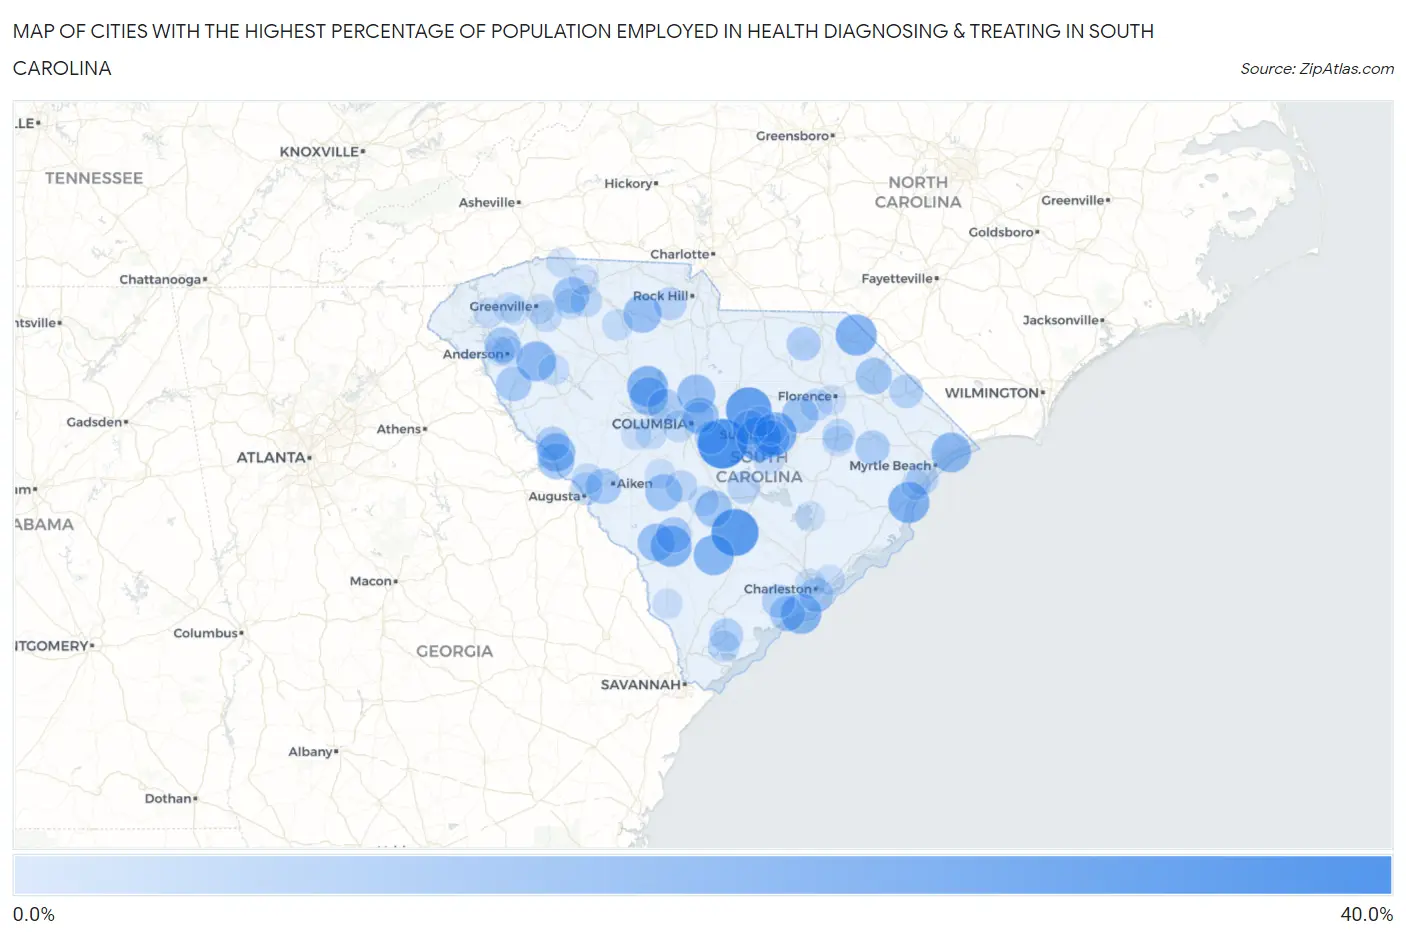
Map of Cities with the Highest Percentage of Population Employed in Health Diagnosing & Treating in South Carolina
0.0%
40.0%
Cities with the Highest Percentage of Population Employed in Health Diagnosing & Treating in South Carolina
| City | % Employed | vs State | vs National | |
| 1. | Gadsden | 31.4% | 6.7%(+24.7)#1 | 6.2%(+25.2)#283 |
| 2. | Reevesville | 28.4% | 6.7%(+21.7)#2 | 6.2%(+22.2)#342 |
| 3. | Rembert | 26.7% | 6.7%(+20.0)#3 | 6.2%(+20.5)#381 |
| 4. | Cane Savannah | 25.1% | 6.7%(+18.4)#4 | 6.2%(+18.9)#434 |
| 5. | East Sumter | 23.6% | 6.7%(+16.9)#5 | 6.2%(+17.4)#513 |
| 6. | Pawleys Island | 21.4% | 6.7%(+14.7)#6 | 6.2%(+15.2)#632 |
| 7. | Tatum | 21.4% | 6.7%(+14.7)#7 | 6.2%(+15.2)#634 |
| 8. | Ulmer | 21.1% | 6.7%(+14.3)#8 | 6.2%(+14.8)#658 |
| 9. | Pomaria | 20.9% | 6.7%(+14.2)#9 | 6.2%(+14.7)#666 |
| 10. | Kiawah Island | 20.5% | 6.7%(+13.8)#10 | 6.2%(+14.3)#699 |
| 11. | Williams | 20.4% | 6.7%(+13.6)#11 | 6.2%(+14.1)#714 |
| 12. | Briarcliffe Acres | 19.7% | 6.7%(+13.0)#12 | 6.2%(+13.5)#773 |
| 13. | Honea Path | 19.6% | 6.7%(+12.9)#13 | 6.2%(+13.4)#786 |
| 14. | Debordieu Colony | 19.3% | 6.7%(+12.6)#14 | 6.2%(+13.1)#806 |
| 15. | Manville | 19.0% | 6.7%(+12.3)#15 | 6.2%(+12.8)#832 |
| 16. | Little Mountain | 18.1% | 6.7%(+11.3)#16 | 6.2%(+11.8)#951 |
| 17. | Parksville | 17.9% | 6.7%(+11.2)#17 | 6.2%(+11.7)#961 |
| 18. | Blythewood | 17.8% | 6.7%(+11.1)#18 | 6.2%(+11.6)#974 |
| 19. | Lockhart | 17.7% | 6.7%(+11.0)#19 | 6.2%(+11.5)#983 |
| 20. | Arcadia Lakes | 17.3% | 6.7%(+10.6)#20 | 6.2%(+11.1)#1,034 |
| 21. | Kline | 17.1% | 6.7%(+10.4)#21 | 6.2%(+10.9)#1,062 |
| 22. | South Sumter | 16.9% | 6.7%(+10.2)#22 | 6.2%(+10.7)#1,092 |
| 23. | Springfield | 16.3% | 6.7%(+9.57)#23 | 6.2%(+10.1)#1,216 |
| 24. | Rowesville | 16.2% | 6.7%(+9.49)#24 | 6.2%(+9.97)#1,237 |
| 25. | Latta | 15.8% | 6.7%(+9.09)#25 | 6.2%(+9.57)#1,322 |
| 26. | Lynchburg | 15.8% | 6.7%(+9.07)#26 | 6.2%(+9.54)#1,324 |
| 27. | Modoc | 15.7% | 6.7%(+9.00)#27 | 6.2%(+9.48)#1,348 |
| 28. | Startex | 15.7% | 6.7%(+9.00)#28 | 6.2%(+9.48)#1,349 |
| 29. | Sandy Springs | 15.6% | 6.7%(+8.90)#29 | 6.2%(+9.37)#1,369 |
| 30. | Northlake | 15.0% | 6.7%(+8.29)#30 | 6.2%(+8.76)#1,501 |
| 31. | Olar | 14.8% | 6.7%(+8.09)#31 | 6.2%(+8.57)#1,550 |
| 32. | Hamer | 14.7% | 6.7%(+7.98)#32 | 6.2%(+8.46)#1,574 |
| 33. | Rockville | 14.6% | 6.7%(+7.91)#33 | 6.2%(+8.39)#1,601 |
| 34. | Warrenville | 14.5% | 6.7%(+7.82)#34 | 6.2%(+8.29)#1,639 |
| 35. | Stateburg | 14.2% | 6.7%(+7.43)#35 | 6.2%(+7.91)#1,760 |
| 36. | Lake Secession | 14.1% | 6.7%(+7.40)#36 | 6.2%(+7.88)#1,769 |
| 37. | Lake Murray Of Richland | 14.0% | 6.7%(+7.32)#37 | 6.2%(+7.80)#1,794 |
| 38. | Arthurtown | 14.0% | 6.7%(+7.28)#38 | 6.2%(+7.76)#1,807 |
| 39. | La France | 13.6% | 6.7%(+6.84)#39 | 6.2%(+7.32)#1,953 |
| 40. | Johnsonville | 13.5% | 6.7%(+6.82)#40 | 6.2%(+7.30)#1,961 |
| 41. | Fairview Crossroads | 13.5% | 6.7%(+6.77)#41 | 6.2%(+7.25)#1,983 |
| 42. | James Island | 13.4% | 6.7%(+6.71)#42 | 6.2%(+7.19)#2,010 |
| 43. | Plum Branch | 13.3% | 6.7%(+6.61)#43 | 6.2%(+7.09)#2,054 |
| 44. | Patrick | 13.3% | 6.7%(+6.57)#44 | 6.2%(+7.05)#2,070 |
| 45. | East Camden | 12.9% | 6.7%(+6.14)#45 | 6.2%(+6.61)#2,258 |
| 46. | Nichols | 12.9% | 6.7%(+6.13)#46 | 6.2%(+6.61)#2,260 |
| 47. | Beaufort | 12.7% | 6.7%(+5.99)#47 | 6.2%(+6.47)#2,324 |
| 48. | Glenn Springs | 12.7% | 6.7%(+5.98)#48 | 6.2%(+6.45)#2,334 |
| 49. | Meggett | 12.6% | 6.7%(+5.88)#49 | 6.2%(+6.36)#2,377 |
| 50. | Hopkins | 12.2% | 6.7%(+5.50)#50 | 6.2%(+5.98)#2,568 |
| 51. | Mcconnells | 11.9% | 6.7%(+5.23)#51 | 6.2%(+5.70)#2,701 |
| 52. | Edmund | 11.9% | 6.7%(+5.14)#52 | 6.2%(+5.62)#2,736 |
| 53. | White Knoll | 11.7% | 6.7%(+5.00)#53 | 6.2%(+5.48)#2,816 |
| 54. | North Augusta | 11.4% | 6.7%(+4.69)#54 | 6.2%(+5.17)#3,051 |
| 55. | Gillisonville | 11.3% | 6.7%(+4.56)#55 | 6.2%(+5.03)#3,133 |
| 56. | Elloree | 11.2% | 6.7%(+4.44)#56 | 6.2%(+4.92)#3,212 |
| 57. | Scranton | 11.1% | 6.7%(+4.42)#57 | 6.2%(+4.90)#3,227 |
| 58. | Timmonsville | 10.8% | 6.7%(+4.09)#58 | 6.2%(+4.57)#3,467 |
| 59. | Danwood | 10.8% | 6.7%(+4.07)#59 | 6.2%(+4.54)#3,480 |
| 60. | Garden City | 10.7% | 6.7%(+3.99)#60 | 6.2%(+4.47)#3,543 |
| 61. | Neeses | 10.7% | 6.7%(+3.99)#61 | 6.2%(+4.47)#3,546 |
| 62. | Roebuck | 10.7% | 6.7%(+3.96)#62 | 6.2%(+4.44)#3,564 |
| 63. | Port Royal | 10.6% | 6.7%(+3.89)#63 | 6.2%(+4.37)#3,624 |
| 64. | Paxville | 10.6% | 6.7%(+3.87)#64 | 6.2%(+4.34)#3,655 |
| 65. | Oak Grove | 10.6% | 6.7%(+3.86)#65 | 6.2%(+4.34)#3,659 |
| 66. | Forest Acres | 10.4% | 6.7%(+3.67)#66 | 6.2%(+4.15)#3,825 |
| 67. | Mauldin | 10.4% | 6.7%(+3.63)#67 | 6.2%(+4.11)#3,863 |
| 68. | Floydale | 10.2% | 6.7%(+3.50)#68 | 6.2%(+3.98)#3,991 |
| 69. | Wyboo | 10.2% | 6.7%(+3.50)#69 | 6.2%(+3.98)#3,992 |
| 70. | Murphys Estates | 10.1% | 6.7%(+3.34)#70 | 6.2%(+3.82)#4,142 |
| 71. | Baxter | 10.1% | 6.7%(+3.34)#71 | 6.2%(+3.81)#4,143 |
| 72. | Unity | 10.0% | 6.7%(+3.32)#72 | 6.2%(+3.80)#4,155 |
| 73. | Gilbert | 10.0% | 6.7%(+3.31)#73 | 6.2%(+3.79)#4,167 |
| 74. | Buffalo | 10.0% | 6.7%(+3.25)#74 | 6.2%(+3.73)#4,248 |
| 75. | Reidville | 9.9% | 6.7%(+3.17)#75 | 6.2%(+3.65)#4,322 |
| 76. | Ware Shoals | 9.8% | 6.7%(+3.11)#76 | 6.2%(+3.59)#4,395 |
| 77. | Lake City | 9.6% | 6.7%(+2.92)#77 | 6.2%(+3.40)#4,599 |
| 78. | Cordova | 9.5% | 6.7%(+2.80)#78 | 6.2%(+3.28)#4,737 |
| 79. | Mulberry | 9.5% | 6.7%(+2.80)#79 | 6.2%(+3.28)#4,738 |
| 80. | Arial | 9.5% | 6.7%(+2.78)#80 | 6.2%(+3.25)#4,766 |
| 81. | Anderson | 9.4% | 6.7%(+2.72)#81 | 6.2%(+3.20)#4,834 |
| 82. | Harbor Island | 9.4% | 6.7%(+2.65)#82 | 6.2%(+3.13)#4,924 |
| 83. | Six Mile | 9.2% | 6.7%(+2.48)#83 | 6.2%(+2.96)#5,122 |
| 84. | Charleston | 9.1% | 6.7%(+2.42)#84 | 6.2%(+2.90)#5,200 |
| 85. | Boiling Springs | 9.1% | 6.7%(+2.38)#85 | 6.2%(+2.86)#5,257 |
| 86. | Florence | 9.1% | 6.7%(+2.37)#86 | 6.2%(+2.85)#5,267 |
| 87. | Scotia | 9.1% | 6.7%(+2.37)#87 | 6.2%(+2.85)#5,304 |
| 88. | Batesburg Leesville | 9.0% | 6.7%(+2.30)#88 | 6.2%(+2.78)#5,389 |
| 89. | Dalzell | 9.0% | 6.7%(+2.27)#89 | 6.2%(+2.75)#5,443 |
| 90. | Mount Pleasant | 9.0% | 6.7%(+2.26)#90 | 6.2%(+2.74)#5,455 |
| 91. | Perry | 8.8% | 6.7%(+2.13)#91 | 6.2%(+2.60)#5,635 |
| 92. | Landrum | 8.8% | 6.7%(+2.05)#92 | 6.2%(+2.53)#5,736 |
| 93. | Centerville | 8.8% | 6.7%(+2.05)#93 | 6.2%(+2.53)#5,743 |
| 94. | Murrells Inlet | 8.7% | 6.7%(+1.99)#94 | 6.2%(+2.47)#5,821 |
| 95. | Easley | 8.7% | 6.7%(+1.99)#95 | 6.2%(+2.47)#5,831 |
| 96. | Bonneau Beach | 8.6% | 6.7%(+1.88)#96 | 6.2%(+2.36)#6,000 |
| 97. | Dovesville | 8.6% | 6.7%(+1.88)#97 | 6.2%(+2.36)#6,001 |
| 98. | Greenville | 8.6% | 6.7%(+1.86)#98 | 6.2%(+2.34)#6,034 |
| 99. | Dacusville | 8.6% | 6.7%(+1.85)#99 | 6.2%(+2.33)#6,058 |
| 100. | Capitol View | 8.6% | 6.7%(+1.84)#100 | 6.2%(+2.32)#6,067 |
Common Questions
What are the Top 10 Cities with the Highest Percentage of Population Employed in Health Diagnosing & Treating in South Carolina?
Top 10 Cities with the Highest Percentage of Population Employed in Health Diagnosing & Treating in South Carolina are:
#1
31.4%
#2
28.4%
#3
26.7%
#4
25.1%
#5
23.6%
#6
21.4%
#7
21.4%
#8
21.1%
#9
20.9%
#10
20.5%
What city has the Highest Percentage of Population Employed in Health Diagnosing & Treating in South Carolina?
Gadsden has the Highest Percentage of Population Employed in Health Diagnosing & Treating in South Carolina with 31.4%.
What is the Percentage of Population Employed in Health Diagnosing & Treating in the State of South Carolina?
Percentage of Population Employed in Health Diagnosing & Treating in South Carolina is 6.7%.
What is the Percentage of Population Employed in Health Diagnosing & Treating in the United States?
Percentage of Population Employed in Health Diagnosing & Treating in the United States is 6.2%.