Gerber, CA Map & Demographics
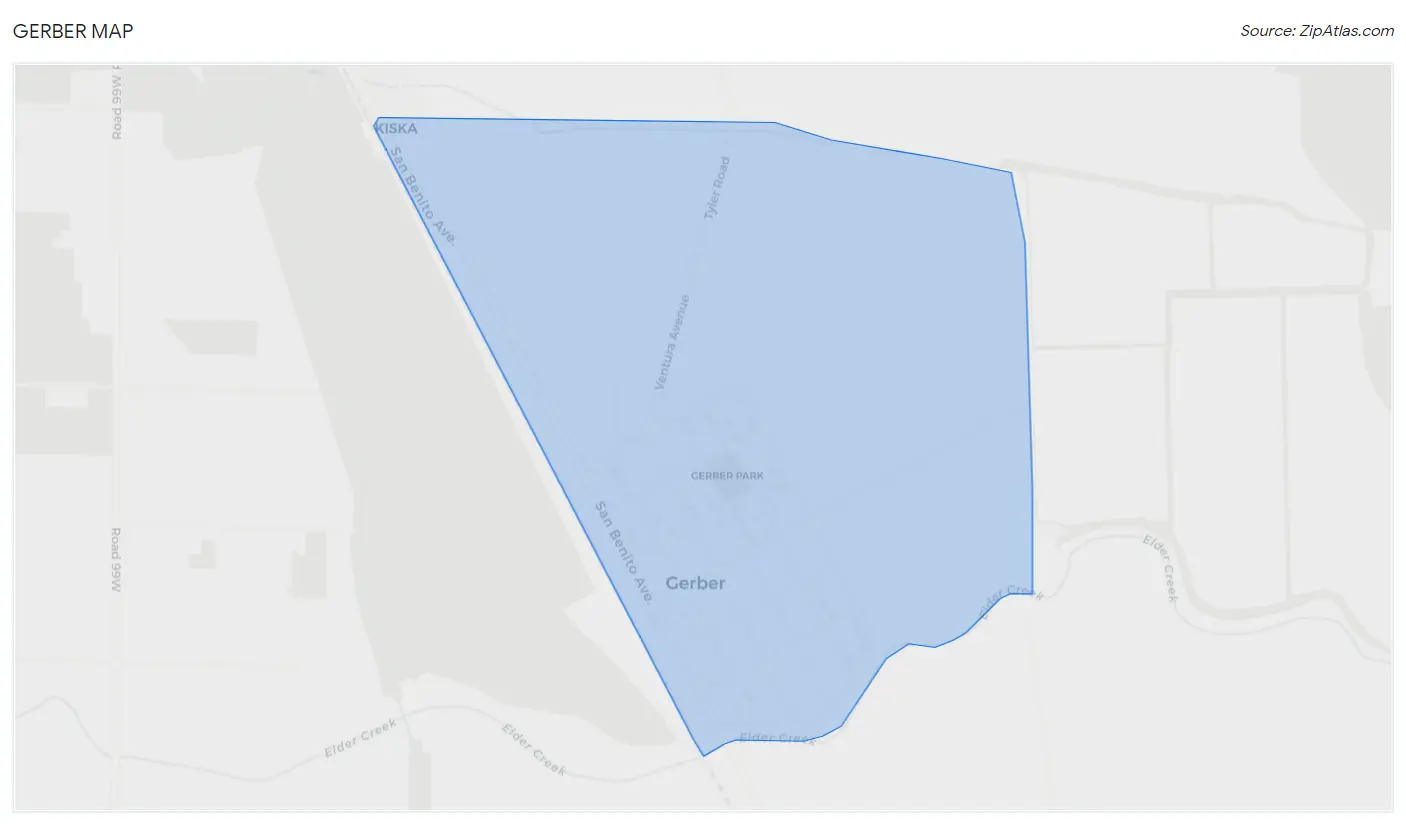
Gerber Map
Gerber Overview
$31,043
PER CAPITA INCOME
$50,636
AVG FAMILY INCOME
$31,324
AVG HOUSEHOLD INCOME
17.4%
WAGE / INCOME GAP [ % ]
82.6¢/ $1
WAGE / INCOME GAP [ $ ]
0.58
INEQUALITY / GINI INDEX
1,084
TOTAL POPULATION
636
MALE POPULATION
448
FEMALE POPULATION
141.96
MALES / 100 FEMALES
70.44
FEMALES / 100 MALES
48.2
MEDIAN AGE
3.0
AVG FAMILY SIZE
2.0
AVG HOUSEHOLD SIZE
420
LABOR FORCE [ PEOPLE ]
48.5%
PERCENT IN LABOR FORCE
3.8%
UNEMPLOYMENT RATE
Gerber Zip Codes
Gerber Area Codes
Income in Gerber
Income Overview in Gerber
Per Capita Income in Gerber is $31,043, while median incomes of families and households are $50,636 and $31,324 respectively.
| Characteristic | Number | Measure |
| Per Capita Income | 1,084 | $31,043 |
| Median Family Income | 262 | $50,636 |
| Mean Family Income | 262 | $99,953 |
| Median Household Income | 554 | $31,324 |
| Mean Household Income | 554 | $61,026 |
| Income Deficit | 262 | $0 |
| Wage / Income Gap (%) | 1,084 | 17.41% |
| Wage / Income Gap ($) | 1,084 | 82.59¢ per $1 |
| Gini / Inequality Index | 1,084 | 0.58 |
Earnings by Sex in Gerber
Average Earnings in Gerber are $28,539, $29,432 for men and $24,309 for women, a difference of 17.4%.
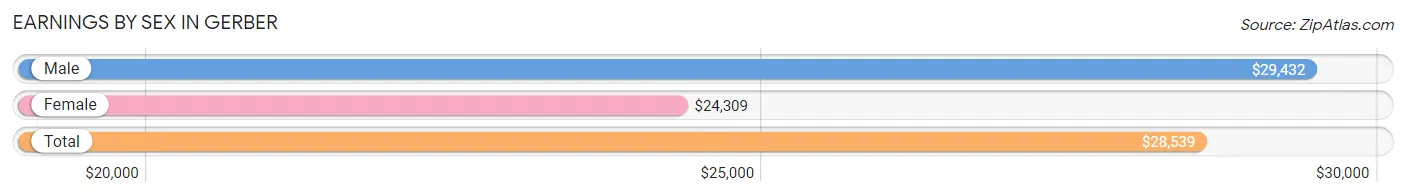
| Sex | Number | Average Earnings |
| Male | 235 (52.3%) | $29,432 |
| Female | 214 (47.7%) | $24,309 |
| Total | 449 (100.0%) | $28,539 |
Earnings by Sex by Income Bracket in Gerber
The most common earnings brackets in Gerber are $25,000 to $29,999 for men (79 | 33.6%) and $22,500 to $24,999 for women (47 | 22.0%).
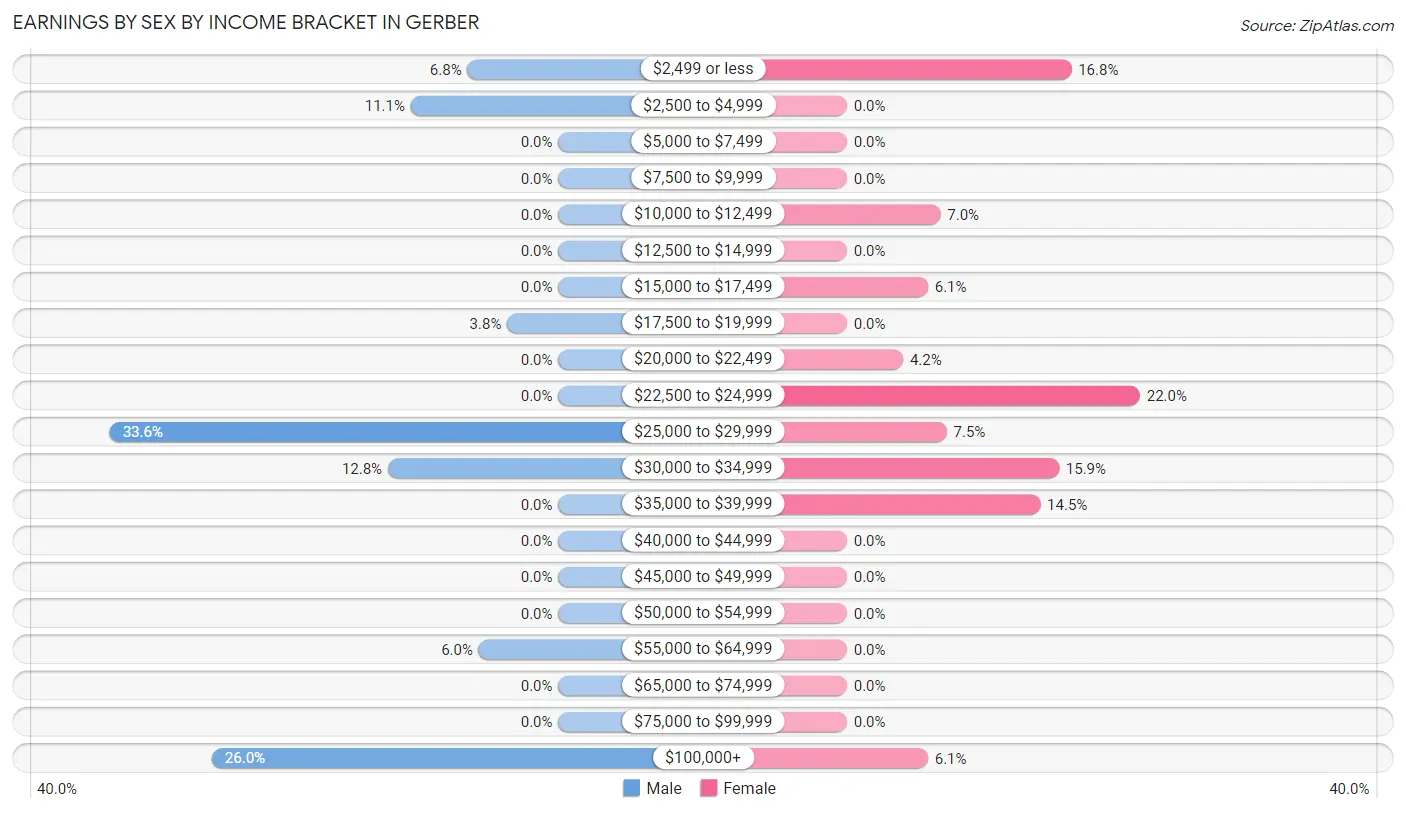
| Income | Male | Female |
| $2,499 or less | 16 (6.8%) | 36 (16.8%) |
| $2,500 to $4,999 | 26 (11.1%) | 0 (0.0%) |
| $5,000 to $7,499 | 0 (0.0%) | 0 (0.0%) |
| $7,500 to $9,999 | 0 (0.0%) | 0 (0.0%) |
| $10,000 to $12,499 | 0 (0.0%) | 15 (7.0%) |
| $12,500 to $14,999 | 0 (0.0%) | 0 (0.0%) |
| $15,000 to $17,499 | 0 (0.0%) | 13 (6.1%) |
| $17,500 to $19,999 | 9 (3.8%) | 0 (0.0%) |
| $20,000 to $22,499 | 0 (0.0%) | 9 (4.2%) |
| $22,500 to $24,999 | 0 (0.0%) | 47 (22.0%) |
| $25,000 to $29,999 | 79 (33.6%) | 16 (7.5%) |
| $30,000 to $34,999 | 30 (12.8%) | 34 (15.9%) |
| $35,000 to $39,999 | 0 (0.0%) | 31 (14.5%) |
| $40,000 to $44,999 | 0 (0.0%) | 0 (0.0%) |
| $45,000 to $49,999 | 0 (0.0%) | 0 (0.0%) |
| $50,000 to $54,999 | 0 (0.0%) | 0 (0.0%) |
| $55,000 to $64,999 | 14 (6.0%) | 0 (0.0%) |
| $65,000 to $74,999 | 0 (0.0%) | 0 (0.0%) |
| $75,000 to $99,999 | 0 (0.0%) | 0 (0.0%) |
| $100,000+ | 61 (26.0%) | 13 (6.1%) |
| Total | 235 (100.0%) | 214 (100.0%) |
Earnings by Sex by Educational Attainment in Gerber
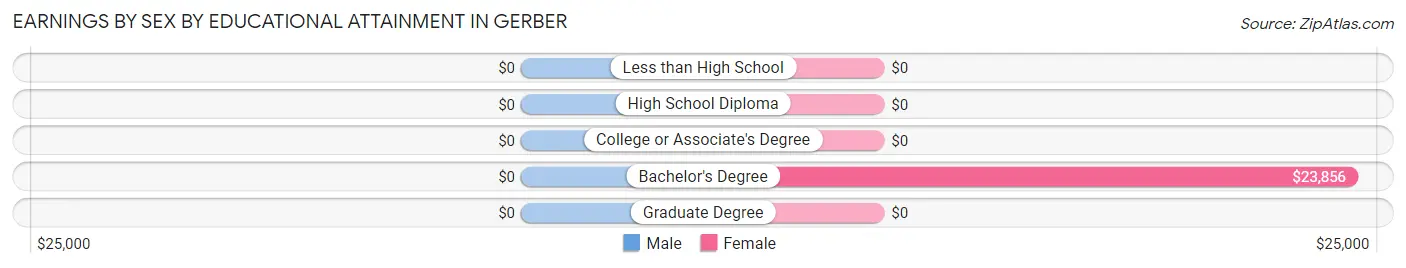
| Educational Attainment | Male Income | Female Income |
| Less than High School | - | - |
| High School Diploma | - | - |
| College or Associate's Degree | - | - |
| Bachelor's Degree | - | - |
| Graduate Degree | - | - |
| Total | - | - |
Family Income in Gerber
Family Income Brackets in Gerber
According to the Gerber family income data, there are 102 families falling into the $25,000 to $34,999 income range, which is the most common income bracket and makes up 38.9% of all families.
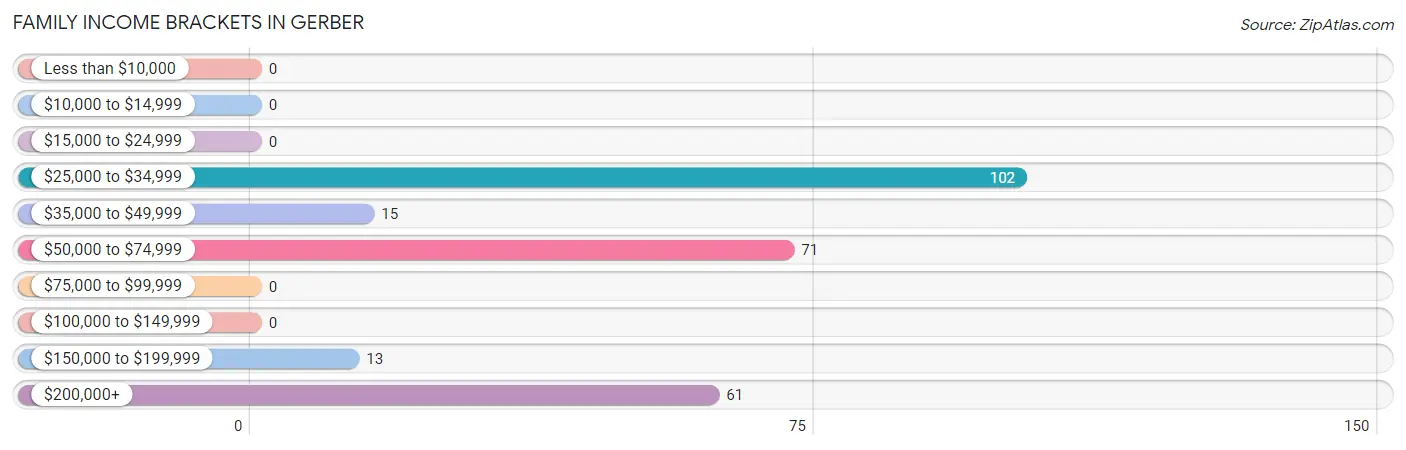
| Income Bracket | # Families | % Families |
| Less than $10,000 | 0 | 0.0% |
| $10,000 to $14,999 | 0 | 0.0% |
| $15,000 to $24,999 | 0 | 0.0% |
| $25,000 to $34,999 | 102 | 38.9% |
| $35,000 to $49,999 | 15 | 5.7% |
| $50,000 to $74,999 | 71 | 27.1% |
| $75,000 to $99,999 | 0 | 0.0% |
| $100,000 to $149,999 | 0 | 0.0% |
| $150,000 to $199,999 | 13 | 5.0% |
| $200,000+ | 61 | 23.3% |
Family Income by Famaliy Size in Gerber
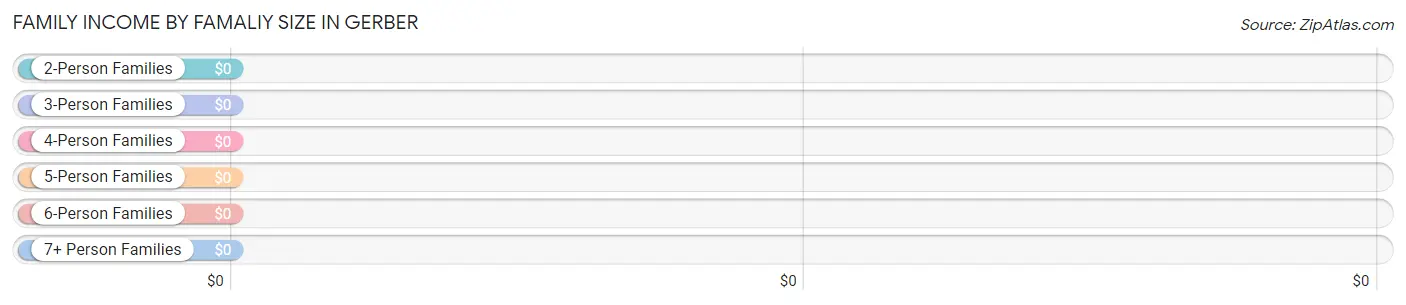
| Income Bracket | # Families | Median Income |
| 2-Person Families | 90 (34.4%) | $0 |
| 3-Person Families | 138 (52.7%) | $0 |
| 4-Person Families | 0 (0.0%) | $0 |
| 5-Person Families | 0 (0.0%) | $0 |
| 6-Person Families | 34 (13.0%) | $0 |
| 7+ Person Families | 0 (0.0%) | $0 |
| Total | 262 (100.0%) | $50,636 |
Family Income by Number of Earners in Gerber
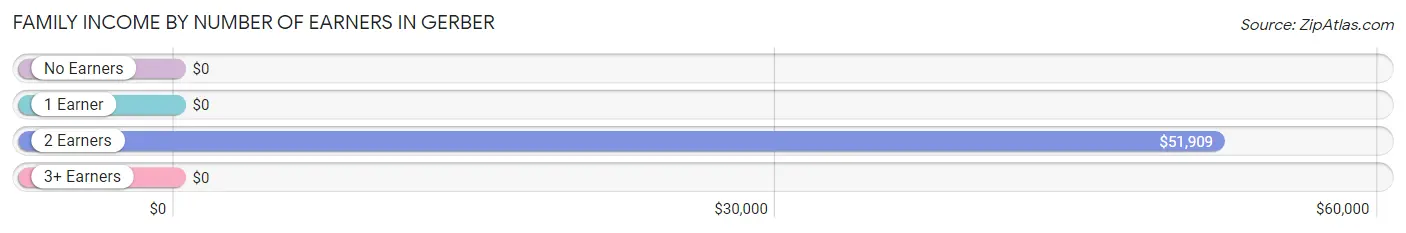
| Number of Earners | # Families | Median Income |
| No Earners | 37 (14.1%) | $0 |
| 1 Earner | 126 (48.1%) | $0 |
| 2 Earners | 84 (32.1%) | $51,909 |
| 3+ Earners | 15 (5.7%) | $0 |
| Total | 262 (100.0%) | $50,636 |
Household Income in Gerber
Household Income Brackets in Gerber
With 165 households falling in the category, the $25,000 to $34,999 income range is the most frequent in Gerber, accounting for 29.8% of all households.
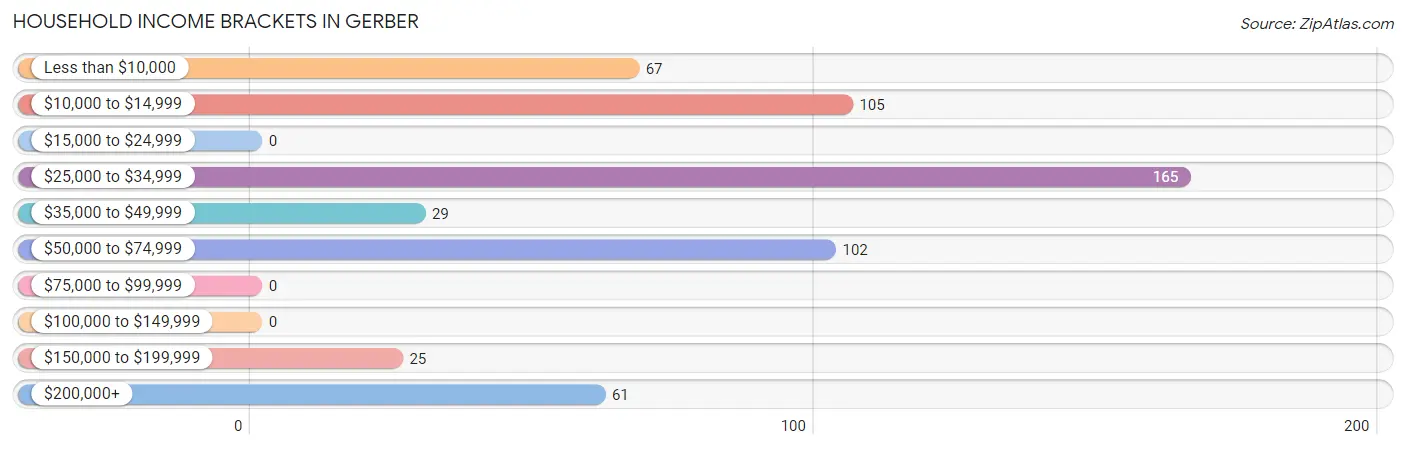
| Income Bracket | # Households | % Households |
| Less than $10,000 | 67 | 12.1% |
| $10,000 to $14,999 | 105 | 19.0% |
| $15,000 to $24,999 | 0 | 0.0% |
| $25,000 to $34,999 | 165 | 29.8% |
| $35,000 to $49,999 | 29 | 5.2% |
| $50,000 to $74,999 | 102 | 18.4% |
| $75,000 to $99,999 | 0 | 0.0% |
| $100,000 to $149,999 | 0 | 0.0% |
| $150,000 to $199,999 | 25 | 4.5% |
| $200,000+ | 61 | 11.0% |
Household Income by Householder Age in Gerber
The median household income in Gerber is $31,324, with the highest median household income of $34,966 found in the 65+ years age bracket for the primary householder. A total of 259 households (46.8%) fall into this category. Meanwhile, the 15 to 24 years age bracket for the primary householder has the lowest median household income of $0, with 82 households (14.8%) in this group.
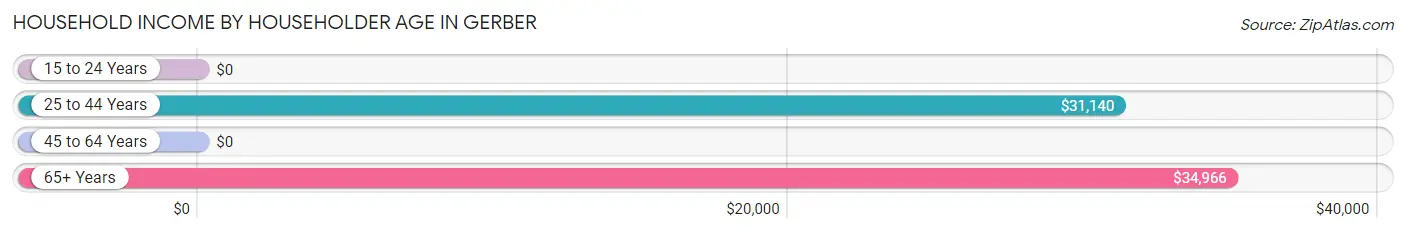
| Income Bracket | # Households | Median Income |
| 15 to 24 Years | 82 (14.8%) | $0 |
| 25 to 44 Years | 63 (11.4%) | $31,140 |
| 45 to 64 Years | 150 (27.1%) | $0 |
| 65+ Years | 259 (46.8%) | $34,966 |
| Total | 554 (100.0%) | $31,324 |
Poverty in Gerber
Income Below Poverty by Sex and Age in Gerber
With 37.4% poverty level for males and 23.0% for females among the residents of Gerber, 6 to 11 year old males and 16 and 17 year old females are the most vulnerable to poverty, with 74 males (100.0%) and 24 females (100.0%) in their respective age groups living below the poverty level.
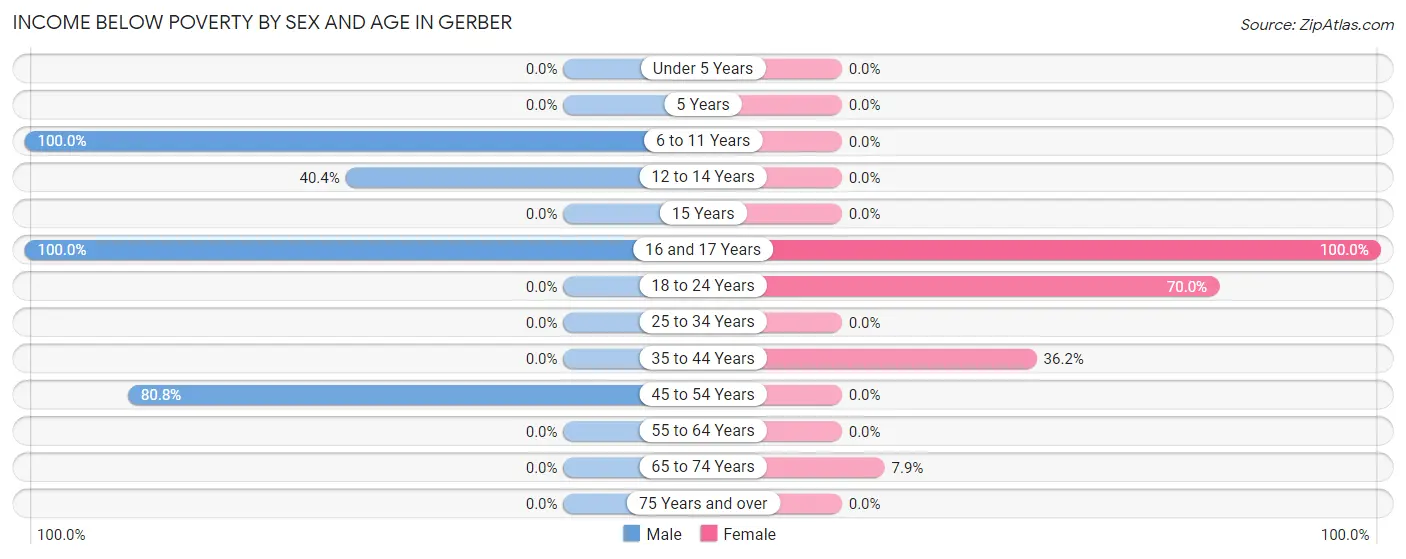
| Age Bracket | Male | Female |
| Under 5 Years | 0 (0.0%) | 0 (0.0%) |
| 5 Years | 0 (0.0%) | 0 (0.0%) |
| 6 to 11 Years | 74 (100.0%) | 0 (0.0%) |
| 12 to 14 Years | 38 (40.4%) | 0 (0.0%) |
| 15 Years | 0 (0.0%) | 0 (0.0%) |
| 16 and 17 Years | 67 (100.0%) | 24 (100.0%) |
| 18 to 24 Years | 0 (0.0%) | 35 (70.0%) |
| 25 to 34 Years | 0 (0.0%) | 0 (0.0%) |
| 35 to 44 Years | 0 (0.0%) | 34 (36.2%) |
| 45 to 54 Years | 59 (80.8%) | 0 (0.0%) |
| 55 to 64 Years | 0 (0.0%) | 0 (0.0%) |
| 65 to 74 Years | 0 (0.0%) | 10 (7.9%) |
| 75 Years and over | 0 (0.0%) | 0 (0.0%) |
| Total | 238 (37.4%) | 103 (23.0%) |
Income Above Poverty by Sex and Age in Gerber
According to the poverty statistics in Gerber, males aged 18 to 24 years and females aged 12 to 14 years are the age groups that are most secure financially, with 100.0% of males and 100.0% of females in these age groups living above the poverty line.
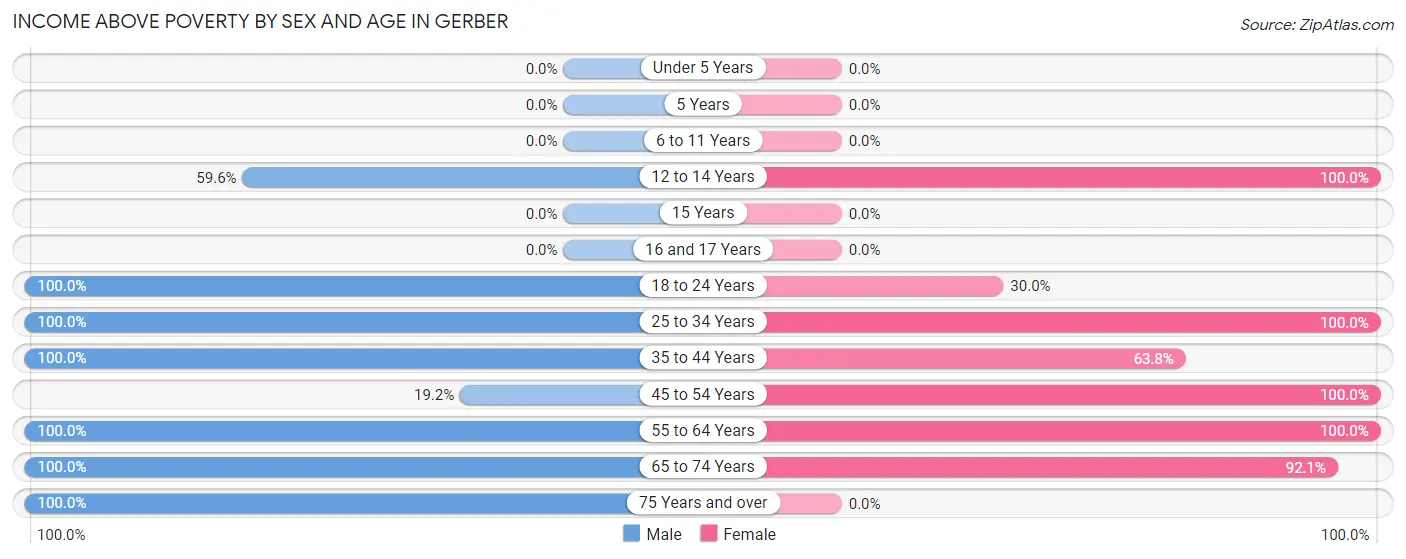
| Age Bracket | Male | Female |
| Under 5 Years | 0 (0.0%) | 0 (0.0%) |
| 5 Years | 0 (0.0%) | 0 (0.0%) |
| 6 to 11 Years | 0 (0.0%) | 0 (0.0%) |
| 12 to 14 Years | 56 (59.6%) | 50 (100.0%) |
| 15 Years | 0 (0.0%) | 0 (0.0%) |
| 16 and 17 Years | 0 (0.0%) | 0 (0.0%) |
| 18 to 24 Years | 26 (100.0%) | 15 (30.0%) |
| 25 to 34 Years | 6 (100.0%) | 16 (100.0%) |
| 35 to 44 Years | 14 (100.0%) | 60 (63.8%) |
| 45 to 54 Years | 14 (19.2%) | 30 (100.0%) |
| 55 to 64 Years | 109 (100.0%) | 58 (100.0%) |
| 65 to 74 Years | 61 (100.0%) | 116 (92.1%) |
| 75 Years and over | 112 (100.0%) | 0 (0.0%) |
| Total | 398 (62.6%) | 345 (77.0%) |
Income Below Poverty Among Married-Couple Families in Gerber
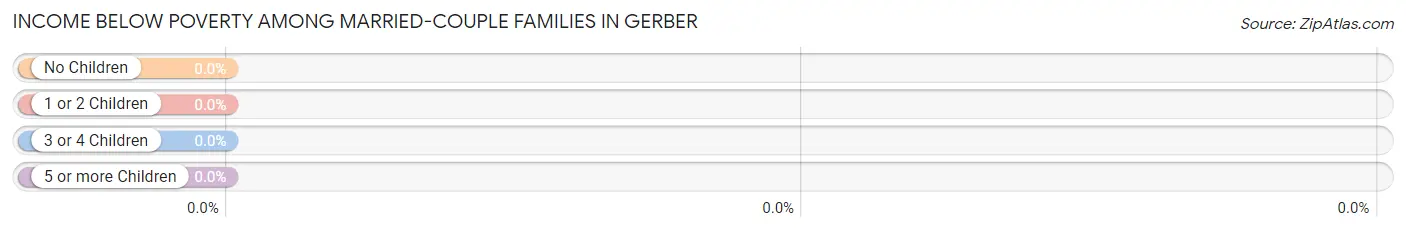
| Children | Above Poverty | Below Poverty |
| No Children | 97 (100.0%) | 0 (0.0%) |
| 1 or 2 Children | 61 (100.0%) | 0 (0.0%) |
| 3 or 4 Children | 0 (0.0%) | 0 (0.0%) |
| 5 or more Children | 0 (0.0%) | 0 (0.0%) |
| Total | 158 (100.0%) | 0 (0.0%) |
Income Below Poverty Among Single-Parent Households in Gerber
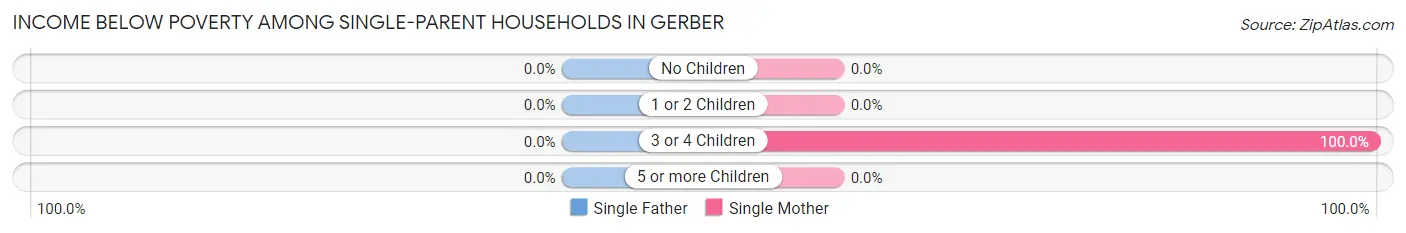
| Children | Single Father | Single Mother |
| No Children | 0 (0.0%) | 0 (0.0%) |
| 1 or 2 Children | 0 (0.0%) | 0 (0.0%) |
| 3 or 4 Children | 0 (0.0%) | 34 (100.0%) |
| 5 or more Children | 0 (0.0%) | 0 (0.0%) |
| Total | 0 (0.0%) | 34 (69.4%) |
Income Below Poverty Among Married-Couple vs Single-Parent Households in Gerber
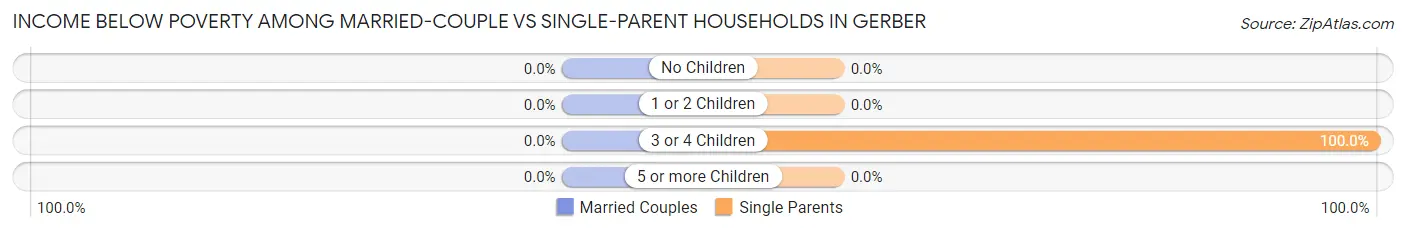
| Children | Married-Couple Families | Single-Parent Households |
| No Children | 0 (0.0%) | 0 (0.0%) |
| 1 or 2 Children | 0 (0.0%) | 0 (0.0%) |
| 3 or 4 Children | 0 (0.0%) | 34 (100.0%) |
| 5 or more Children | 0 (0.0%) | 0 (0.0%) |
| Total | 0 (0.0%) | 34 (32.7%) |
Race in Gerber
The most populous races in Gerber are Hispanic or Latino (878 | 81.0%), White / Caucasian (472 | 43.5%), and Two or more Races (389 | 35.9%).
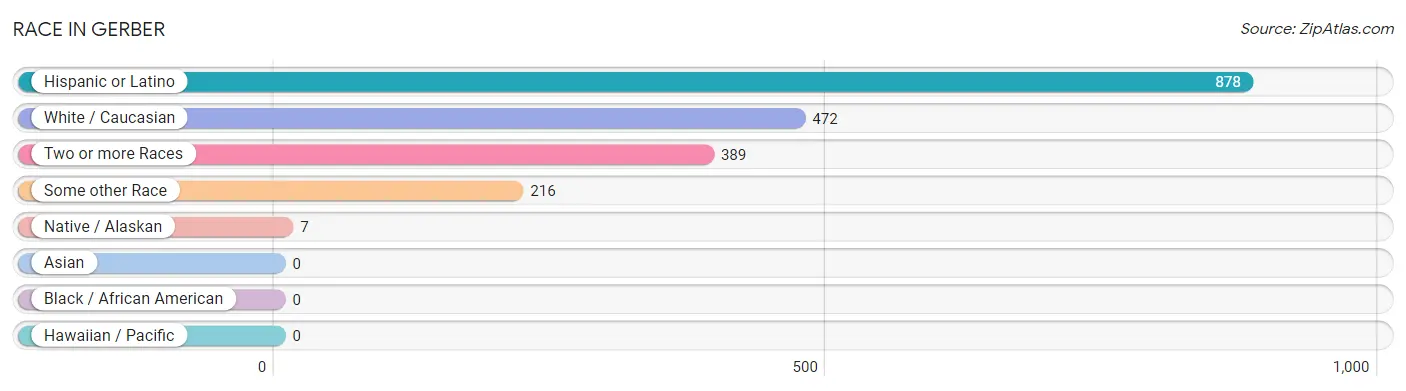
| Race | # Population | % Population |
| Asian | 0 | 0.0% |
| Black / African American | 0 | 0.0% |
| Hawaiian / Pacific | 0 | 0.0% |
| Hispanic or Latino | 878 | 81.0% |
| Native / Alaskan | 7 | 0.6% |
| White / Caucasian | 472 | 43.5% |
| Two or more Races | 389 | 35.9% |
| Some other Race | 216 | 19.9% |
| Total | 1,084 | 100.0% |
Ancestry in Gerber
The most populous ancestries reported in Gerber are Mexican (801 | 73.9%), Ecuadorian (77 | 7.1%), South American (77 | 7.1%), English (61 | 5.6%), and Irish (61 | 5.6%), together accounting for 99.3% of all Gerber residents.
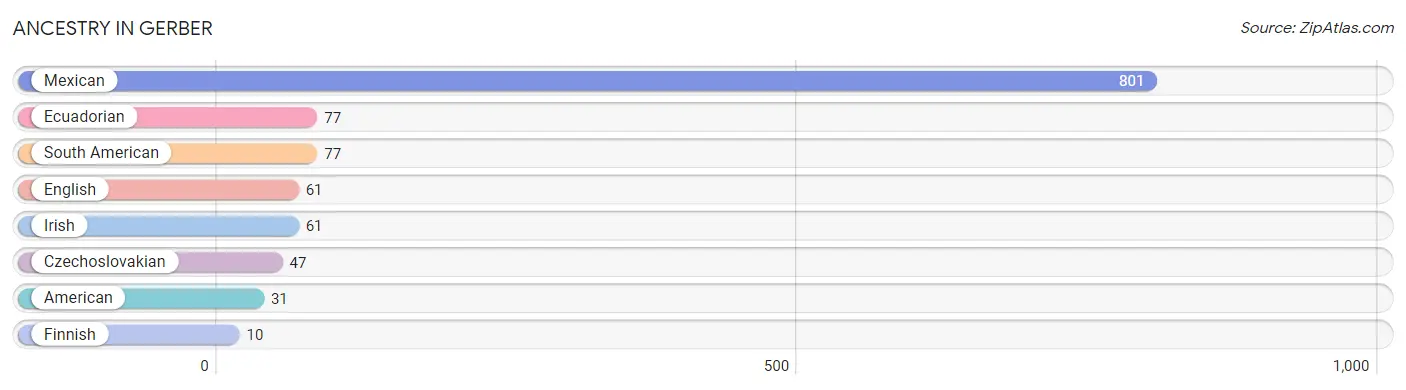
| Ancestry | # Population | % Population |
| American | 31 | 2.9% |
| Czechoslovakian | 47 | 4.3% |
| Ecuadorian | 77 | 7.1% |
| English | 61 | 5.6% |
| Finnish | 10 | 0.9% |
| Irish | 61 | 5.6% |
| Mexican | 801 | 73.9% |
| South American | 77 | 7.1% | View All 8 Rows |
Immigrants in Gerber
The most numerous immigrant groups reported in Gerber came from Latin America (377 | 34.8%), Central America (300 | 27.7%), Mexico (300 | 27.7%), Ecuador (77 | 7.1%), and South America (77 | 7.1%), together accounting for 104.3% of all Gerber residents.
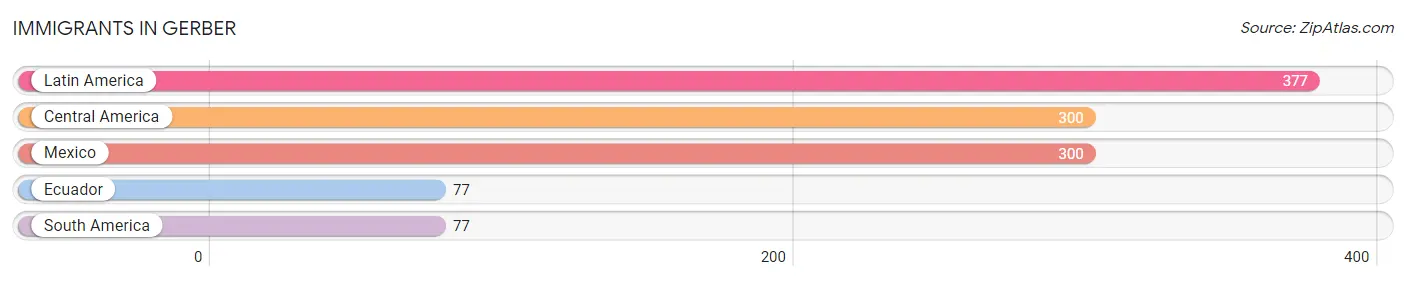
| Immigration Origin | # Population | % Population |
| Central America | 300 | 27.7% |
| Ecuador | 77 | 7.1% |
| Latin America | 377 | 34.8% |
| Mexico | 300 | 27.7% |
| South America | 77 | 7.1% | View All 5 Rows |
Sex and Age in Gerber
Sex and Age in Gerber
The most populous age groups in Gerber are 10 to 14 Years (168 | 26.4%) for men and 65 to 69 Years (86 | 19.2%) for women.
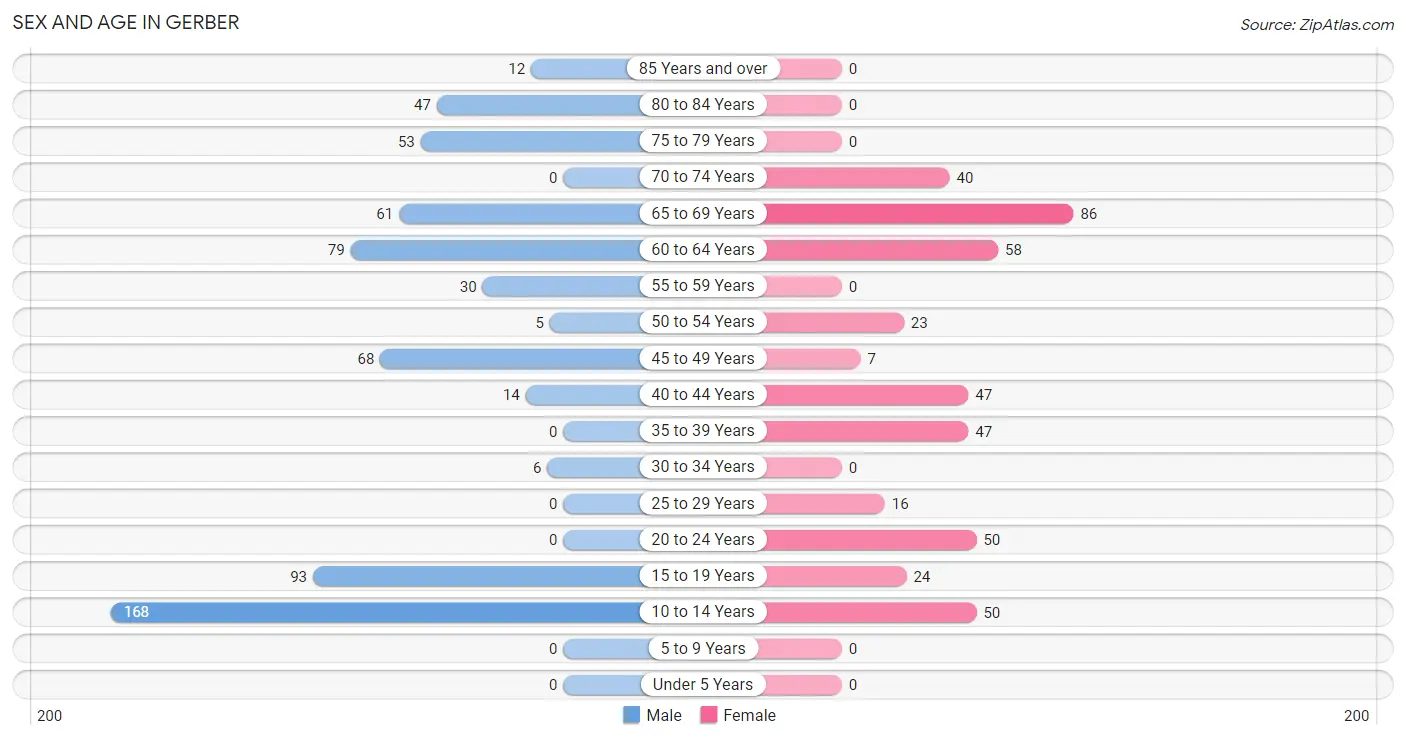
| Age Bracket | Male | Female |
| Under 5 Years | 0 (0.0%) | 0 (0.0%) |
| 5 to 9 Years | 0 (0.0%) | 0 (0.0%) |
| 10 to 14 Years | 168 (26.4%) | 50 (11.2%) |
| 15 to 19 Years | 93 (14.6%) | 24 (5.4%) |
| 20 to 24 Years | 0 (0.0%) | 50 (11.2%) |
| 25 to 29 Years | 0 (0.0%) | 16 (3.6%) |
| 30 to 34 Years | 6 (0.9%) | 0 (0.0%) |
| 35 to 39 Years | 0 (0.0%) | 47 (10.5%) |
| 40 to 44 Years | 14 (2.2%) | 47 (10.5%) |
| 45 to 49 Years | 68 (10.7%) | 7 (1.6%) |
| 50 to 54 Years | 5 (0.8%) | 23 (5.1%) |
| 55 to 59 Years | 30 (4.7%) | 0 (0.0%) |
| 60 to 64 Years | 79 (12.4%) | 58 (13.0%) |
| 65 to 69 Years | 61 (9.6%) | 86 (19.2%) |
| 70 to 74 Years | 0 (0.0%) | 40 (8.9%) |
| 75 to 79 Years | 53 (8.3%) | 0 (0.0%) |
| 80 to 84 Years | 47 (7.4%) | 0 (0.0%) |
| 85 Years and over | 12 (1.9%) | 0 (0.0%) |
| Total | 636 (100.0%) | 448 (100.0%) |
Families and Households in Gerber
Median Family Size in Gerber
The median family size in Gerber is 3.02 persons per family, with single female/mother families (49 | 18.7%) accounting for the largest median family size of 5.63 persons per family. On the other hand, married-couple families (158 | 60.3%) represent the smallest median family size with 2.30 persons per family.
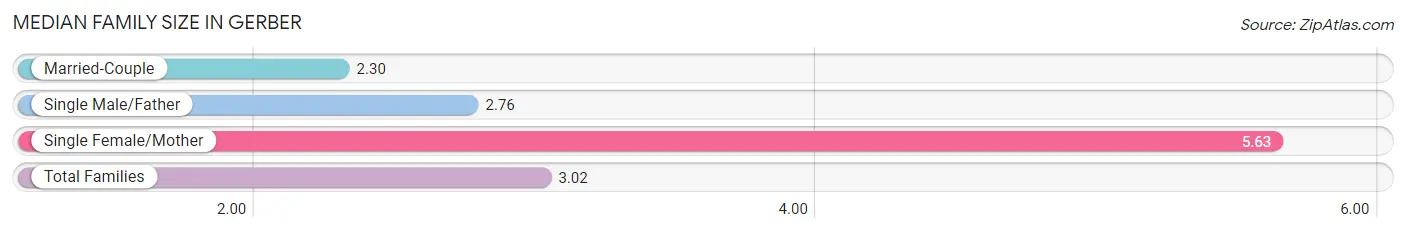
| Family Type | # Families | Family Size |
| Married-Couple | 158 (60.3%) | 2.30 |
| Single Male/Father | 55 (21.0%) | 2.76 |
| Single Female/Mother | 49 (18.7%) | 5.63 |
| Total Families | 262 (100.0%) | 3.02 |
Median Household Size in Gerber
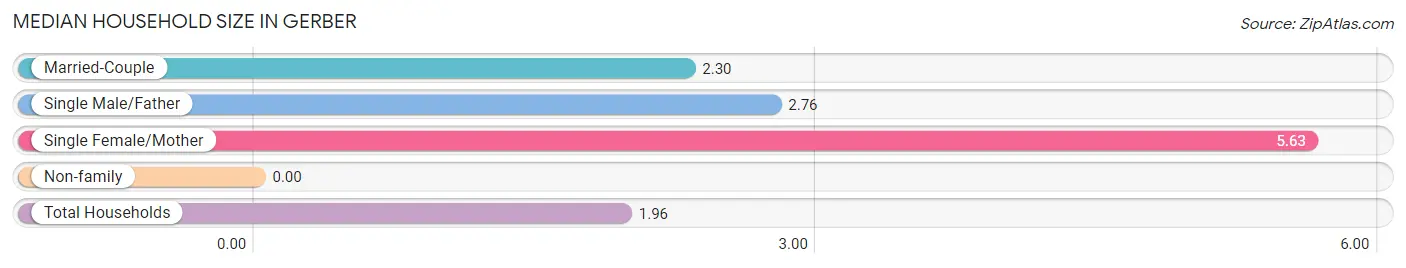
| Household Type | # Households | Household Size |
| Married-Couple | 158 (28.5%) | 2.30 |
| Single Male/Father | 55 (9.9%) | 2.76 |
| Single Female/Mother | 49 (8.8%) | 5.63 |
| Non-family | 292 (52.7%) | - |
| Total Households | 554 (100.0%) | 1.96 |
Household Size by Marriage Status in Gerber
Out of a total of 554 households in Gerber, 262 (47.3%) are family households, while 292 (52.7%) are nonfamily households. The most numerous type of family households are 3-person households, comprising 138, and the most common type of nonfamily households are 1-person households, comprising 292.
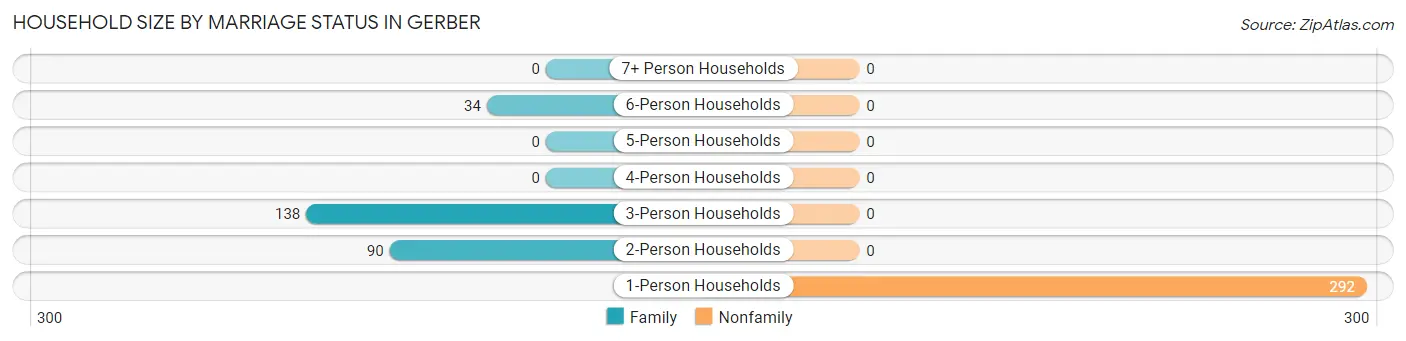
| Household Size | Family Households | Nonfamily Households |
| 1-Person Households | - | 292 (52.7%) |
| 2-Person Households | 90 (16.3%) | 0 (0.0%) |
| 3-Person Households | 138 (24.9%) | 0 (0.0%) |
| 4-Person Households | 0 (0.0%) | 0 (0.0%) |
| 5-Person Households | 0 (0.0%) | 0 (0.0%) |
| 6-Person Households | 34 (6.1%) | 0 (0.0%) |
| 7+ Person Households | 0 (0.0%) | 0 (0.0%) |
| Total | 262 (47.3%) | 292 (52.7%) |
Female Fertility in Gerber
Fertility by Age in Gerber
| Age Bracket | Women with Births | Births / 1,000 Women |
| 15 to 19 years | 0 (0.0%) | 0.0 |
| 20 to 34 years | 0 (0.0%) | 0.0 |
| 35 to 50 years | 0 (0.0%) | 0.0 |
| Total | 0 (0.0%) | 0.0 |
Fertility by Age by Marriage Status in Gerber
| Age Bracket | Married | Unmarried |
| 15 to 19 years | 0 (0.0%) | 0 (0.0%) |
| 20 to 34 years | 0 (0.0%) | 0 (0.0%) |
| 35 to 50 years | 0 (0.0%) | 0 (0.0%) |
| Total | 0 (0.0%) | 0 (0.0%) |
Fertility by Education in Gerber
| Educational Attainment | Women with Births | Births / 1,000 Women |
| Less than High School | 0 (0.0%) | 0.0 |
| High School Diploma | 0 (0.0%) | 0.0 |
| College or Associate's Degree | 0 (0.0%) | 0.0 |
| Bachelor's Degree | 0 (0.0%) | 0.0 |
| Graduate Degree | 0 (0.0%) | 0.0 |
| Total | 0 (0.0%) | 0.0 |
Fertility by Education by Marriage Status in Gerber
| Educational Attainment | Married | Unmarried |
| Less than High School | 0 (0.0%) | 0 (0.0%) |
| High School Diploma | 0 (0.0%) | 0 (0.0%) |
| College or Associate's Degree | 0 (0.0%) | 0 (0.0%) |
| Bachelor's Degree | 0 (0.0%) | 0 (0.0%) |
| Graduate Degree | 0 (0.0%) | 0 (0.0%) |
| Total | 0 (0.0%) | 0 (0.0%) |
Employment Characteristics in Gerber
Employment by Class of Employer in Gerber
Among the 404 employed individuals in Gerber, private company employees (239 | 59.2%), self-employed (not incorporated) (78 | 19.3%), and not-for-profit organizations (47 | 11.6%) make up the most common classes of employment.
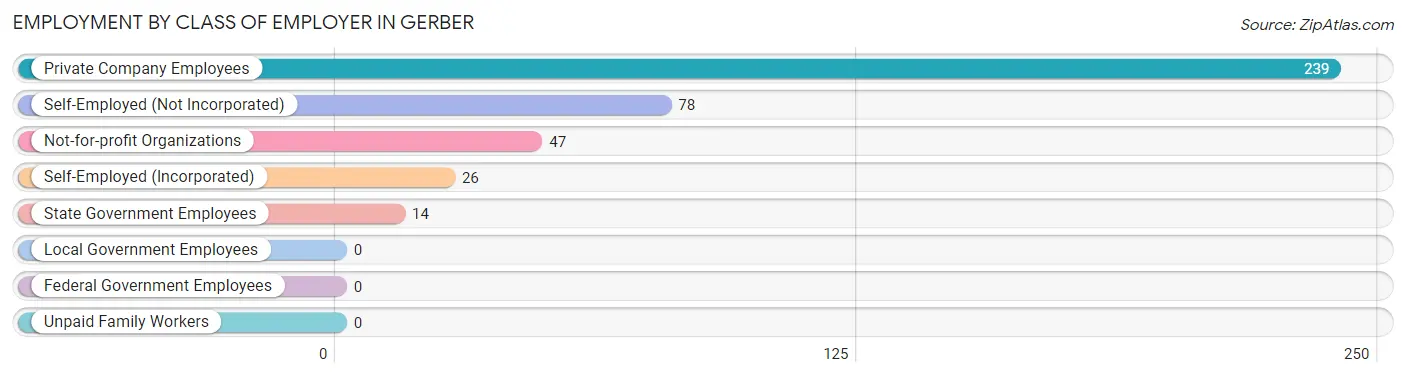
| Employer Class | # Employees | % Employees |
| Private Company Employees | 239 | 59.2% |
| Self-Employed (Incorporated) | 26 | 6.4% |
| Self-Employed (Not Incorporated) | 78 | 19.3% |
| Not-for-profit Organizations | 47 | 11.6% |
| Local Government Employees | 0 | 0.0% |
| State Government Employees | 14 | 3.5% |
| Federal Government Employees | 0 | 0.0% |
| Unpaid Family Workers | 0 | 0.0% |
| Total | 404 | 100.0% |
Employment Status by Age in Gerber
According to the labor force statistics for Gerber, out of the total population over 16 years of age (866), 48.5% or 420 individuals are in the labor force, with 3.8% or 16 of them unemployed. The age group with the highest labor force participation rate is 25 to 29 years, with 100.0% or 16 individuals in the labor force. Within the labor force, the 25 to 29 years age range has the highest percentage of unemployed individuals, with 100.0% or 16 of them being unemployed.
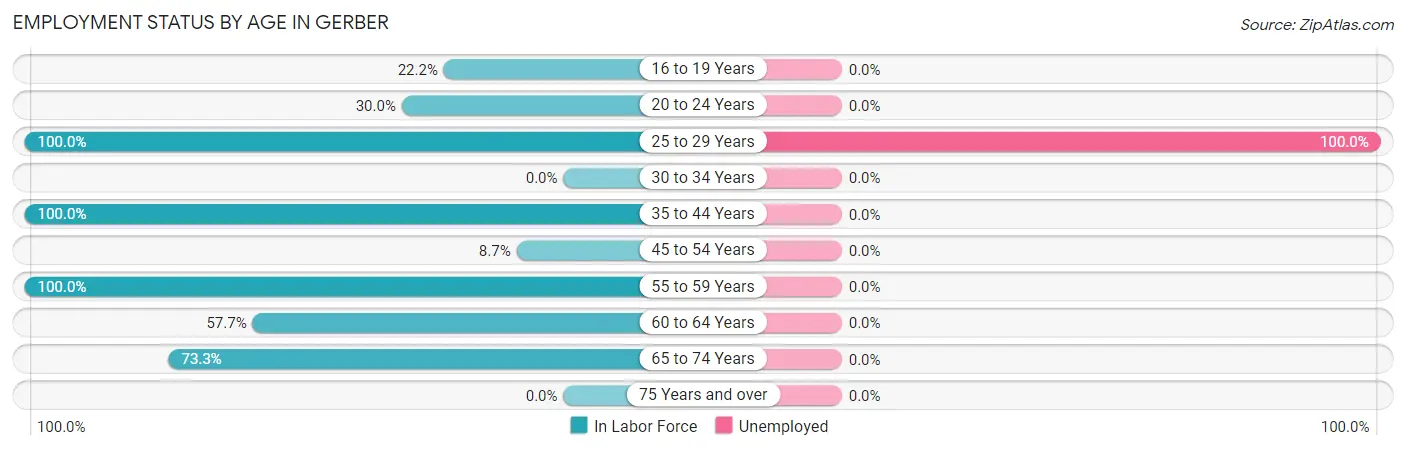
| Age Bracket | In Labor Force | Unemployed |
| 16 to 19 Years | 26 (22.2%) | 0 (0.0%) |
| 20 to 24 Years | 15 (30.0%) | 0 (0.0%) |
| 25 to 29 Years | 16 (100.0%) | 16 (100.0%) |
| 30 to 34 Years | 0 (0.0%) | 0 (0.0%) |
| 35 to 44 Years | 108 (100.0%) | 0 (0.0%) |
| 45 to 54 Years | 9 (8.7%) | 0 (0.0%) |
| 55 to 59 Years | 30 (100.0%) | 0 (0.0%) |
| 60 to 64 Years | 79 (57.7%) | 0 (0.0%) |
| 65 to 74 Years | 137 (73.3%) | 0 (0.0%) |
| 75 Years and over | 0 (0.0%) | 0 (0.0%) |
| Total | 420 (48.5%) | 16 (3.8%) |
Employment Status by Educational Attainment in Gerber
According to labor force statistics for Gerber, 60.5% of individuals (242) out of the total population between 25 and 64 years of age (400) are in the labor force, with 6.6% or 16 of them being unemployed. The group with the highest labor force participation rate are those with the educational attainment of college / associate degree, with 88.4% or 38 individuals in the labor force. Within the labor force, individuals with high school diploma education have the highest percentage of unemployment, with 64.0% or 16 of them being unemployed.
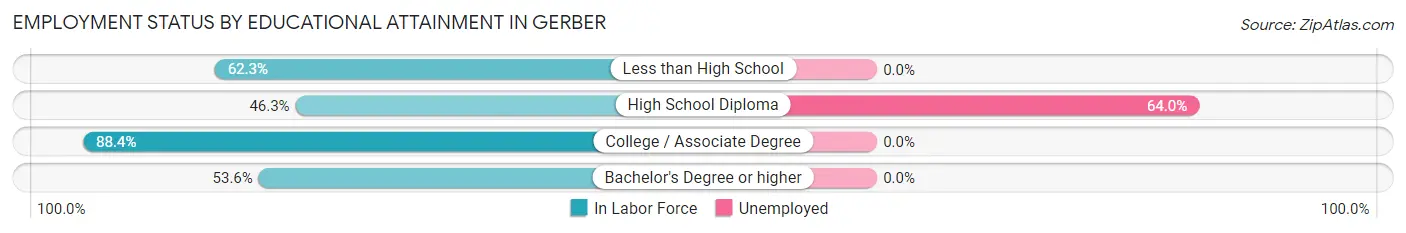
| Educational Attainment | In Labor Force | Unemployed |
| Less than High School | 119 (62.3%) | 0 (0.0%) |
| High School Diploma | 25 (46.3%) | 35 (64.0%) |
| College / Associate Degree | 38 (88.4%) | 0 (0.0%) |
| Bachelor's Degree or higher | 60 (53.6%) | 0 (0.0%) |
| Total | 242 (60.5%) | 26 (6.6%) |
Employment Occupations by Sex in Gerber
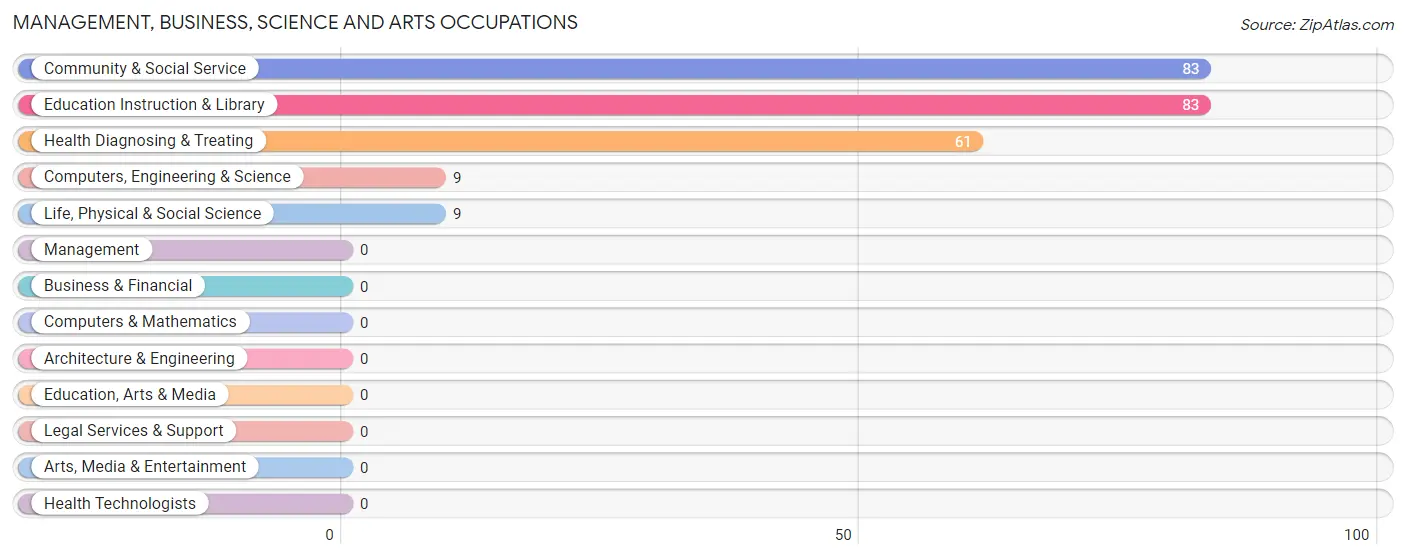
Management, Business, Science and Arts Occupations
The most common Management, Business, Science and Arts occupations in Gerber are Community & Social Service (83 | 20.5%), Education Instruction & Library (83 | 20.5%), Health Diagnosing & Treating (61 | 15.1%), Computers, Engineering & Science (9 | 2.2%), and Life, Physical & Social Science (9 | 2.2%).
Management, Business, Science and Arts Occupations by Sex
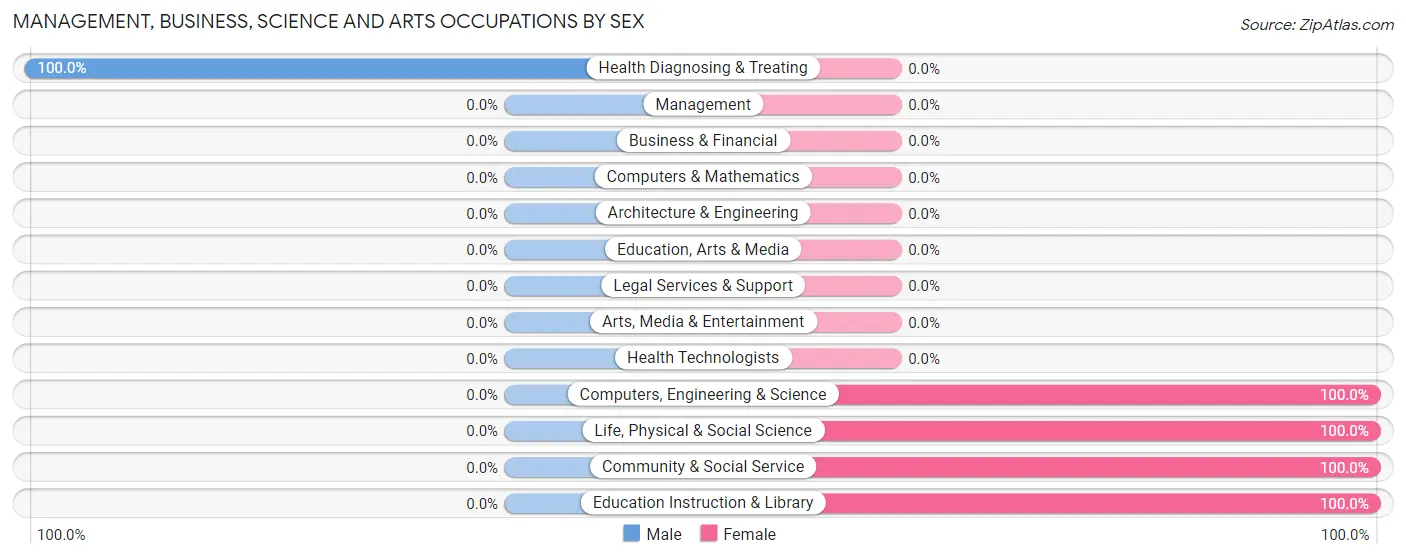
| Occupation | Male | Female |
| Management | 0 (0.0%) | 0 (0.0%) |
| Business & Financial | 0 (0.0%) | 0 (0.0%) |
| Computers, Engineering & Science | 0 (0.0%) | 9 (100.0%) |
| Computers & Mathematics | 0 (0.0%) | 0 (0.0%) |
| Architecture & Engineering | 0 (0.0%) | 0 (0.0%) |
| Life, Physical & Social Science | 0 (0.0%) | 9 (100.0%) |
| Community & Social Service | 0 (0.0%) | 83 (100.0%) |
| Education, Arts & Media | 0 (0.0%) | 0 (0.0%) |
| Legal Services & Support | 0 (0.0%) | 0 (0.0%) |
| Education Instruction & Library | 0 (0.0%) | 83 (100.0%) |
| Arts, Media & Entertainment | 0 (0.0%) | 0 (0.0%) |
| Health Diagnosing & Treating | 61 (100.0%) | 0 (0.0%) |
| Health Technologists | 0 (0.0%) | 0 (0.0%) |
| Total (Category) | 61 (39.9%) | 92 (60.1%) |
| Total (Overall) | 219 (54.2%) | 185 (45.8%) |
Services Occupations
The most common Services occupations in Gerber are Food Preparation & Serving (31 | 7.7%), Cleaning & Maintenance (24 | 5.9%), and Healthcare Support (15 | 3.7%).
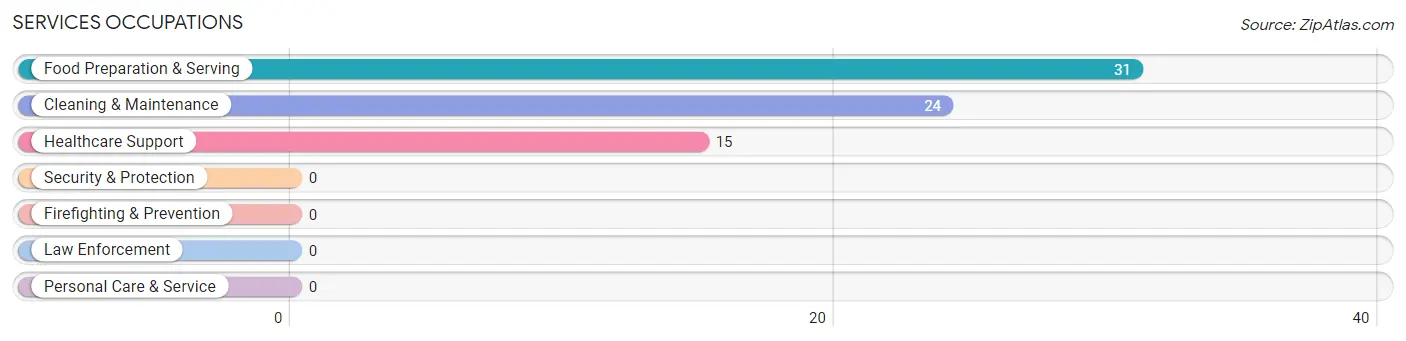
Services Occupations by Sex
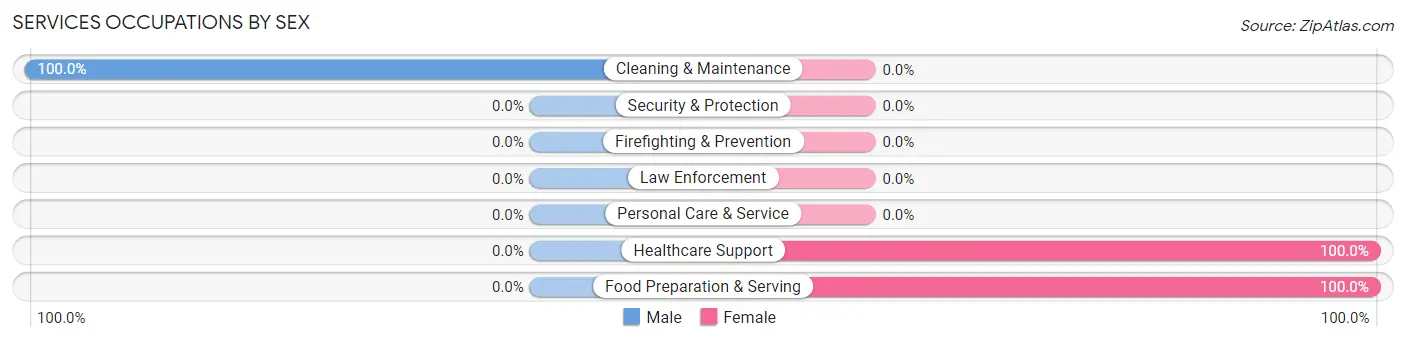
| Occupation | Male | Female |
| Healthcare Support | 0 (0.0%) | 15 (100.0%) |
| Security & Protection | 0 (0.0%) | 0 (0.0%) |
| Firefighting & Prevention | 0 (0.0%) | 0 (0.0%) |
| Law Enforcement | 0 (0.0%) | 0 (0.0%) |
| Food Preparation & Serving | 0 (0.0%) | 31 (100.0%) |
| Cleaning & Maintenance | 24 (100.0%) | 0 (0.0%) |
| Personal Care & Service | 0 (0.0%) | 0 (0.0%) |
| Total (Category) | 24 (34.3%) | 46 (65.7%) |
| Total (Overall) | 219 (54.2%) | 185 (45.8%) |
Sales and Office Occupations
The most common Sales and Office occupations in Gerber are Office & Administration (14 | 3.5%), and Sales & Related (13 | 3.2%).
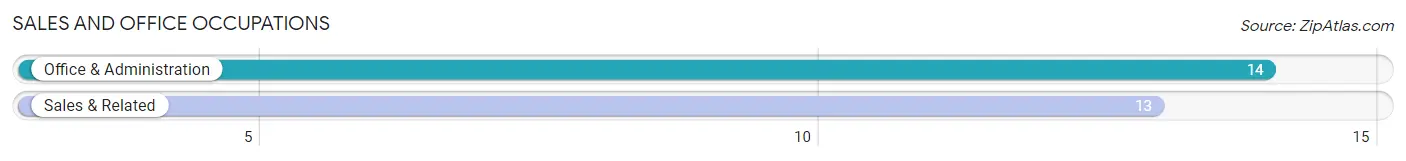
Sales and Office Occupations by Sex

| Occupation | Male | Female |
| Sales & Related | 0 (0.0%) | 13 (100.0%) |
| Office & Administration | 14 (100.0%) | 0 (0.0%) |
| Total (Category) | 14 (51.8%) | 13 (48.1%) |
| Total (Overall) | 219 (54.2%) | 185 (45.8%) |
Natural Resources, Construction and Maintenance Occupations
The most common Natural Resources, Construction and Maintenance occupations in Gerber are , and Farming, Fishing & Forestry (89 | 22.0%).
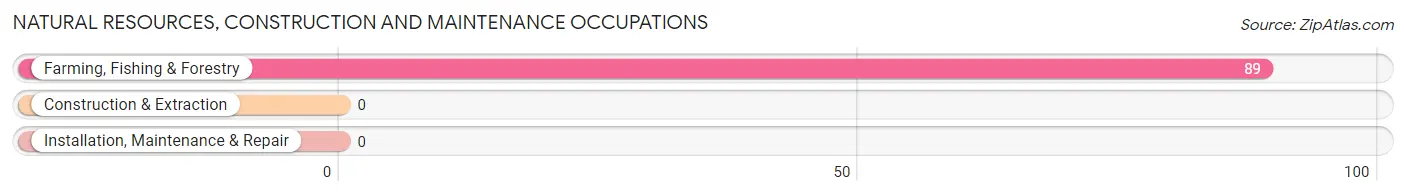
Natural Resources, Construction and Maintenance Occupations by Sex
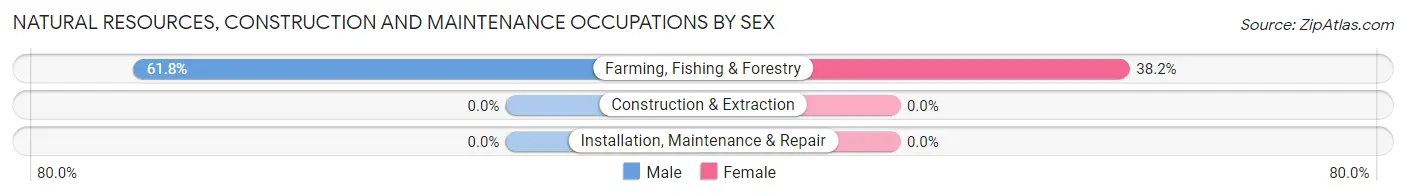
| Occupation | Male | Female |
| Farming, Fishing & Forestry | 55 (61.8%) | 34 (38.2%) |
| Construction & Extraction | 0 (0.0%) | 0 (0.0%) |
| Installation, Maintenance & Repair | 0 (0.0%) | 0 (0.0%) |
| Total (Category) | 55 (61.8%) | 34 (38.2%) |
| Total (Overall) | 219 (54.2%) | 185 (45.8%) |
Production, Transportation and Moving Occupations
The most common Production, Transportation and Moving occupations in Gerber are Transportation (30 | 7.4%), Material Moving (26 | 6.4%), and Production (9 | 2.2%).
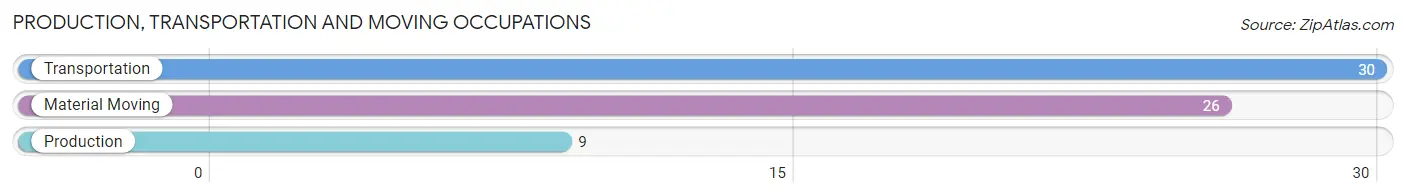
Production, Transportation and Moving Occupations by Sex
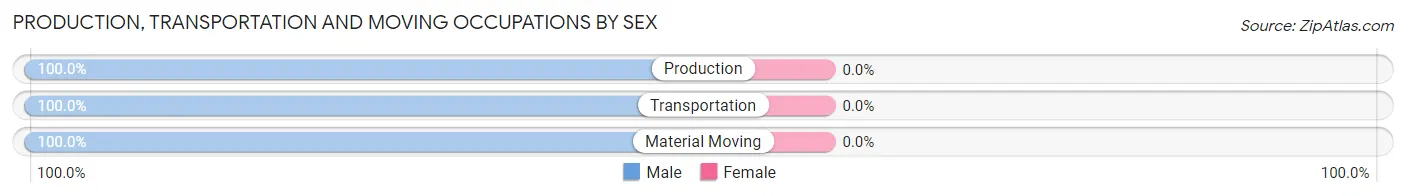
| Occupation | Male | Female |
| Production | 9 (100.0%) | 0 (0.0%) |
| Transportation | 30 (100.0%) | 0 (0.0%) |
| Material Moving | 26 (100.0%) | 0 (0.0%) |
| Total (Category) | 65 (100.0%) | 0 (0.0%) |
| Total (Overall) | 219 (54.2%) | 185 (45.8%) |
Employment Industries by Sex in Gerber
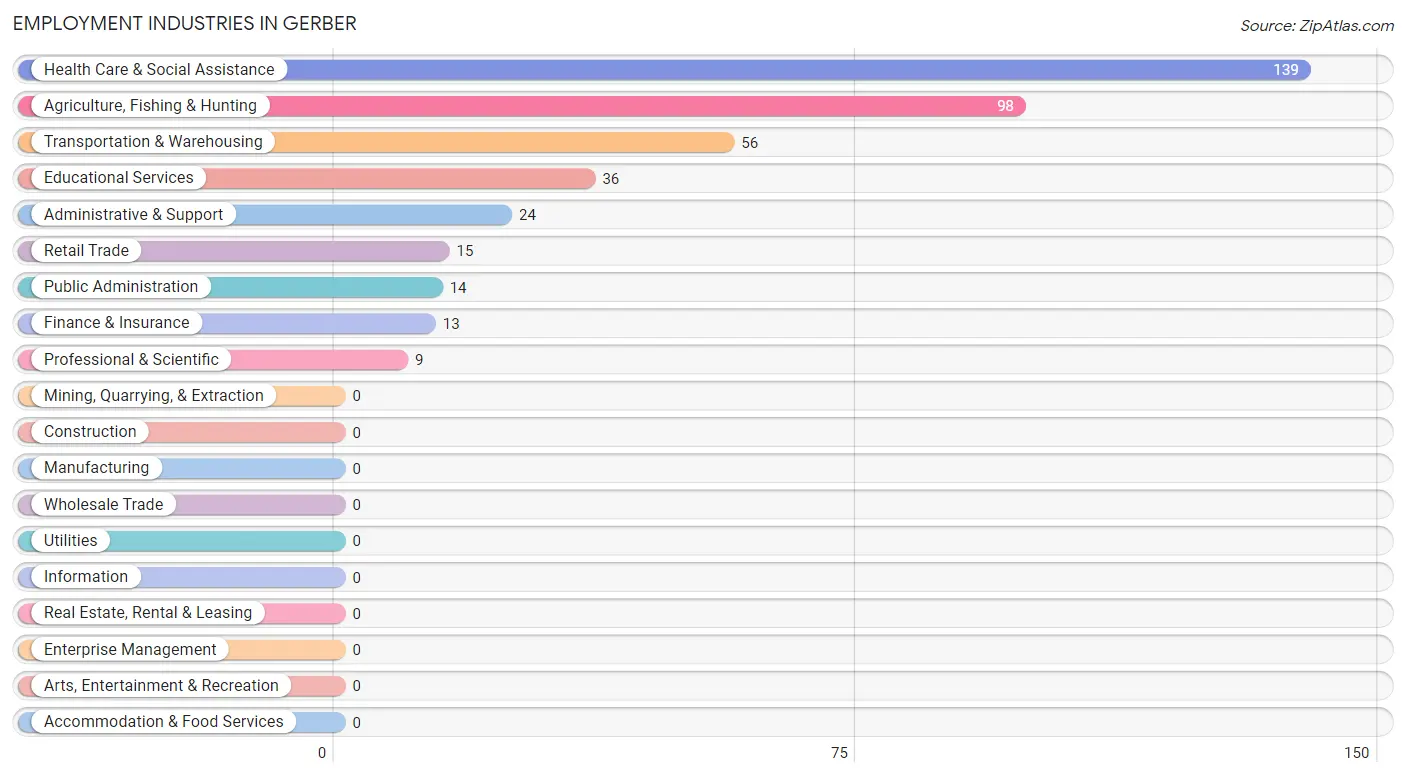
Employment Industries in Gerber
The major employment industries in Gerber include Health Care & Social Assistance (139 | 34.4%), Agriculture, Fishing & Hunting (98 | 24.3%), Transportation & Warehousing (56 | 13.9%), Educational Services (36 | 8.9%), and Administrative & Support (24 | 5.9%).
Employment Industries by Sex in Gerber
The Gerber industries that see more men than women are Transportation & Warehousing (100.0%), Administrative & Support (100.0%), and Public Administration (100.0%), whereas the industries that tend to have a higher number of women are Retail Trade (100.0%), Finance & Insurance (100.0%), and Professional & Scientific (100.0%).
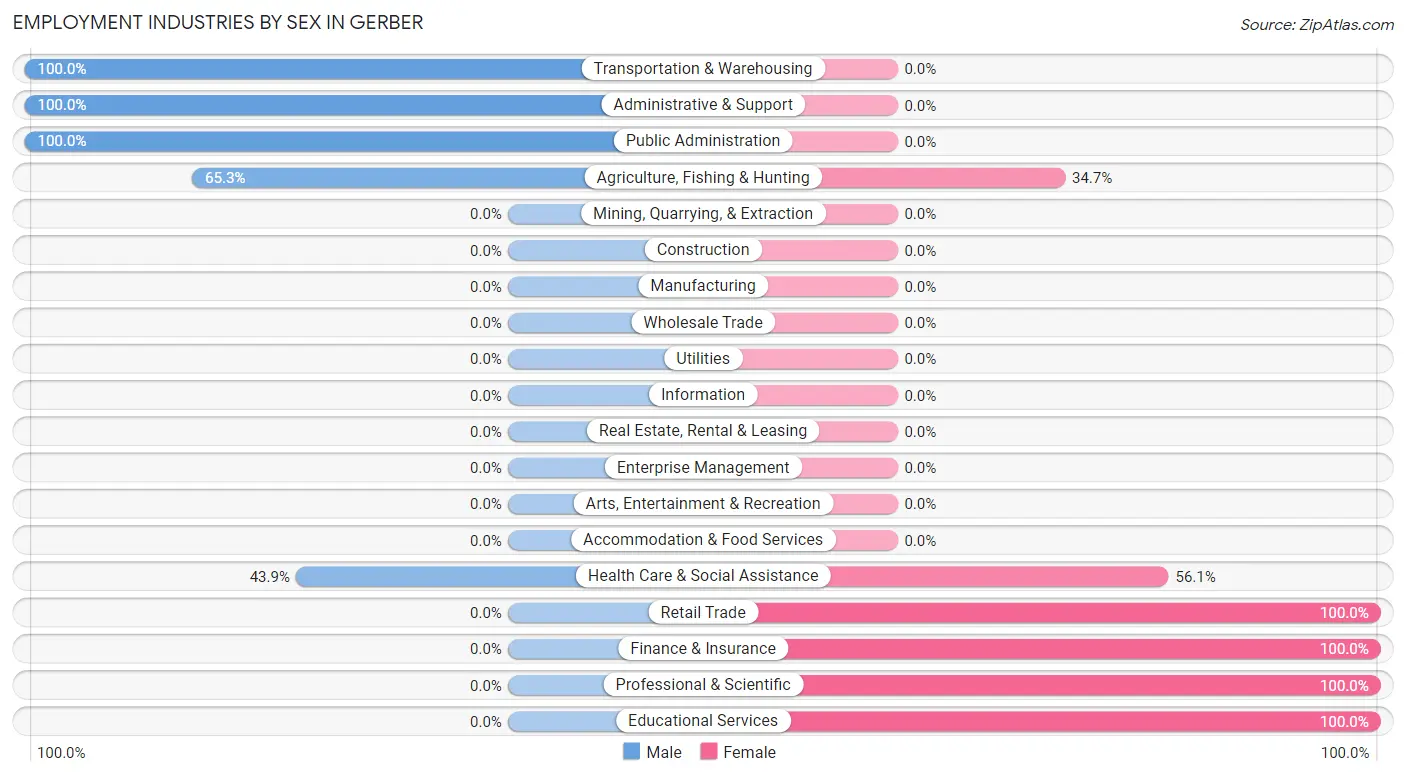
| Industry | Male | Female |
| Agriculture, Fishing & Hunting | 64 (65.3%) | 34 (34.7%) |
| Mining, Quarrying, & Extraction | 0 (0.0%) | 0 (0.0%) |
| Construction | 0 (0.0%) | 0 (0.0%) |
| Manufacturing | 0 (0.0%) | 0 (0.0%) |
| Wholesale Trade | 0 (0.0%) | 0 (0.0%) |
| Retail Trade | 0 (0.0%) | 15 (100.0%) |
| Transportation & Warehousing | 56 (100.0%) | 0 (0.0%) |
| Utilities | 0 (0.0%) | 0 (0.0%) |
| Information | 0 (0.0%) | 0 (0.0%) |
| Finance & Insurance | 0 (0.0%) | 13 (100.0%) |
| Real Estate, Rental & Leasing | 0 (0.0%) | 0 (0.0%) |
| Professional & Scientific | 0 (0.0%) | 9 (100.0%) |
| Enterprise Management | 0 (0.0%) | 0 (0.0%) |
| Administrative & Support | 24 (100.0%) | 0 (0.0%) |
| Educational Services | 0 (0.0%) | 36 (100.0%) |
| Health Care & Social Assistance | 61 (43.9%) | 78 (56.1%) |
| Arts, Entertainment & Recreation | 0 (0.0%) | 0 (0.0%) |
| Accommodation & Food Services | 0 (0.0%) | 0 (0.0%) |
| Public Administration | 14 (100.0%) | 0 (0.0%) |
| Total | 219 (54.2%) | 185 (45.8%) |
Education in Gerber
School Enrollment in Gerber
The most common levels of schooling among the 323 students in Gerber are high school (235 | 72.8%), middle school (74 | 22.9%), and college / undergraduate (14 | 4.3%).
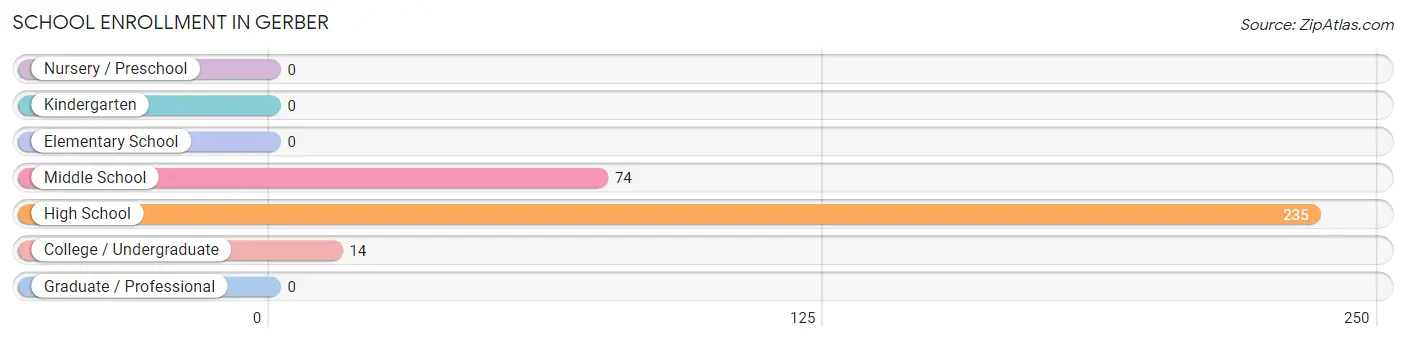
| School Level | # Students | % Students |
| Nursery / Preschool | 0 | 0.0% |
| Kindergarten | 0 | 0.0% |
| Elementary School | 0 | 0.0% |
| Middle School | 74 | 22.9% |
| High School | 235 | 72.8% |
| College / Undergraduate | 14 | 4.3% |
| Graduate / Professional | 0 | 0.0% |
| Total | 323 | 100.0% |
School Enrollment by Age by Funding Source in Gerber
| Age Bracket | Public School | Private School |
| 3 to 4 Year Olds | 0 (0.0%) | 0 (0.0%) |
| 5 to 9 Year Old | 0 (0.0%) | 0 (0.0%) |
| 10 to 14 Year Olds | 218 (100.0%) | 0 (0.0%) |
| 15 to 17 Year Olds | 91 (100.0%) | 0 (0.0%) |
| 18 to 19 Year Olds | 0 (0.0%) | 0 (0.0%) |
| 20 to 24 Year Olds | 0 (0.0%) | 0 (0.0%) |
| 25 to 34 Year Olds | 0 (0.0%) | 0 (0.0%) |
| 35 Years and over | 14 (100.0%) | 0 (0.0%) |
| Total | 323 (100.0%) | 0 (0.0%) |
Educational Attainment by Field of Study in Gerber
Education (47 | 35.3%), arts & humanities (45 | 33.8%), business (13 | 9.8%), science & technology (12 | 9.0%), and bio, nature & agricultural (9 | 6.8%) are the most common fields of study among 133 individuals in Gerber who have obtained a bachelor's degree or higher.
| Field of Study | # Graduates | % Graduates |
| Computers & Mathematics | 0 | 0.0% |
| Bio, Nature & Agricultural | 9 | 6.8% |
| Physical & Health Sciences | 0 | 0.0% |
| Psychology | 0 | 0.0% |
| Social Sciences | 7 | 5.3% |
| Engineering | 0 | 0.0% |
| Multidisciplinary Studies | 0 | 0.0% |
| Science & Technology | 12 | 9.0% |
| Business | 13 | 9.8% |
| Education | 47 | 35.3% |
| Literature & Languages | 0 | 0.0% |
| Liberal Arts & History | 0 | 0.0% |
| Visual & Performing Arts | 0 | 0.0% |
| Communications | 0 | 0.0% |
| Arts & Humanities | 45 | 33.8% |
| Total | 133 | 100.0% |
Transportation & Commute in Gerber
Vehicle Availability by Sex in Gerber
The most prevalent vehicle ownership categories in Gerber are males with 2 vehicles (219, accounting for 100.0%) and females with 2 vehicles (75, making up 118.4%).
| Vehicles Available | Male | Female |
| No Vehicle | 0 (0.0%) | 0 (0.0%) |
| 1 Vehicle | 0 (0.0%) | 110 (59.5%) |
| 2 Vehicles | 219 (100.0%) | 75 (40.5%) |
| 3 Vehicles | 0 (0.0%) | 0 (0.0%) |
| 4 Vehicles | 0 (0.0%) | 0 (0.0%) |
| 5 or more Vehicles | 0 (0.0%) | 0 (0.0%) |
| Total | 219 (100.0%) | 185 (100.0%) |
Commute Time in Gerber
The most frequently occuring commute durations in Gerber are 10 to 14 minutes (154 commuters, 40.8%), 20 to 24 minutes (102 commuters, 27.1%), and less than 5 minutes (67 commuters, 17.8%).
| Commute Time | # Commuters | % Commuters |
| Less than 5 Minutes | 67 | 17.8% |
| 5 to 9 Minutes | 0 | 0.0% |
| 10 to 14 Minutes | 154 | 40.8% |
| 15 to 19 Minutes | 15 | 4.0% |
| 20 to 24 Minutes | 102 | 27.1% |
| 25 to 29 Minutes | 0 | 0.0% |
| 30 to 34 Minutes | 0 | 0.0% |
| 35 to 39 Minutes | 0 | 0.0% |
| 40 to 44 Minutes | 0 | 0.0% |
| 45 to 59 Minutes | 9 | 2.4% |
| 60 to 89 Minutes | 30 | 8.0% |
| 90 or more Minutes | 0 | 0.0% |
Commute Time by Sex in Gerber
The most common commute times in Gerber are 10 to 14 minutes (120 commuters, 58.5%) for males and less than 5 minutes (67 commuters, 39.0%) for females.
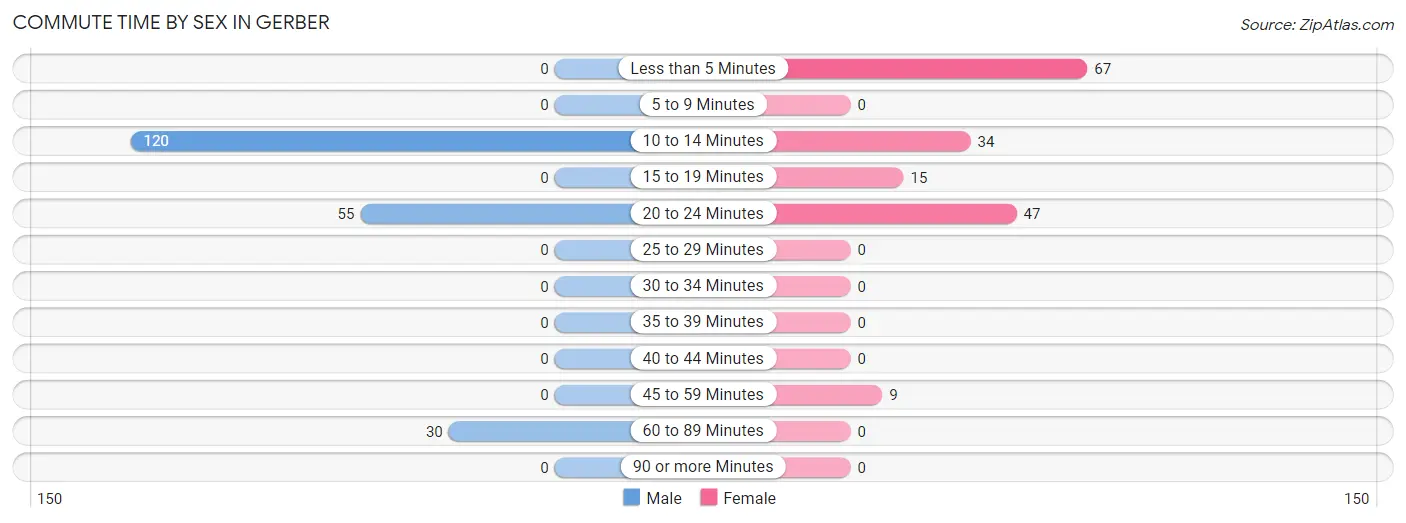
| Commute Time | Male | Female |
| Less than 5 Minutes | 0 (0.0%) | 67 (39.0%) |
| 5 to 9 Minutes | 0 (0.0%) | 0 (0.0%) |
| 10 to 14 Minutes | 120 (58.5%) | 34 (19.8%) |
| 15 to 19 Minutes | 0 (0.0%) | 15 (8.7%) |
| 20 to 24 Minutes | 55 (26.8%) | 47 (27.3%) |
| 25 to 29 Minutes | 0 (0.0%) | 0 (0.0%) |
| 30 to 34 Minutes | 0 (0.0%) | 0 (0.0%) |
| 35 to 39 Minutes | 0 (0.0%) | 0 (0.0%) |
| 40 to 44 Minutes | 0 (0.0%) | 0 (0.0%) |
| 45 to 59 Minutes | 0 (0.0%) | 9 (5.2%) |
| 60 to 89 Minutes | 30 (14.6%) | 0 (0.0%) |
| 90 or more Minutes | 0 (0.0%) | 0 (0.0%) |
Time of Departure to Work by Sex in Gerber
The most frequent times of departure to work in Gerber are 4:00 PM to 11:59 PM (87, 42.4%) for males and 7:00 AM to 7:29 AM (114, 66.3%) for females.
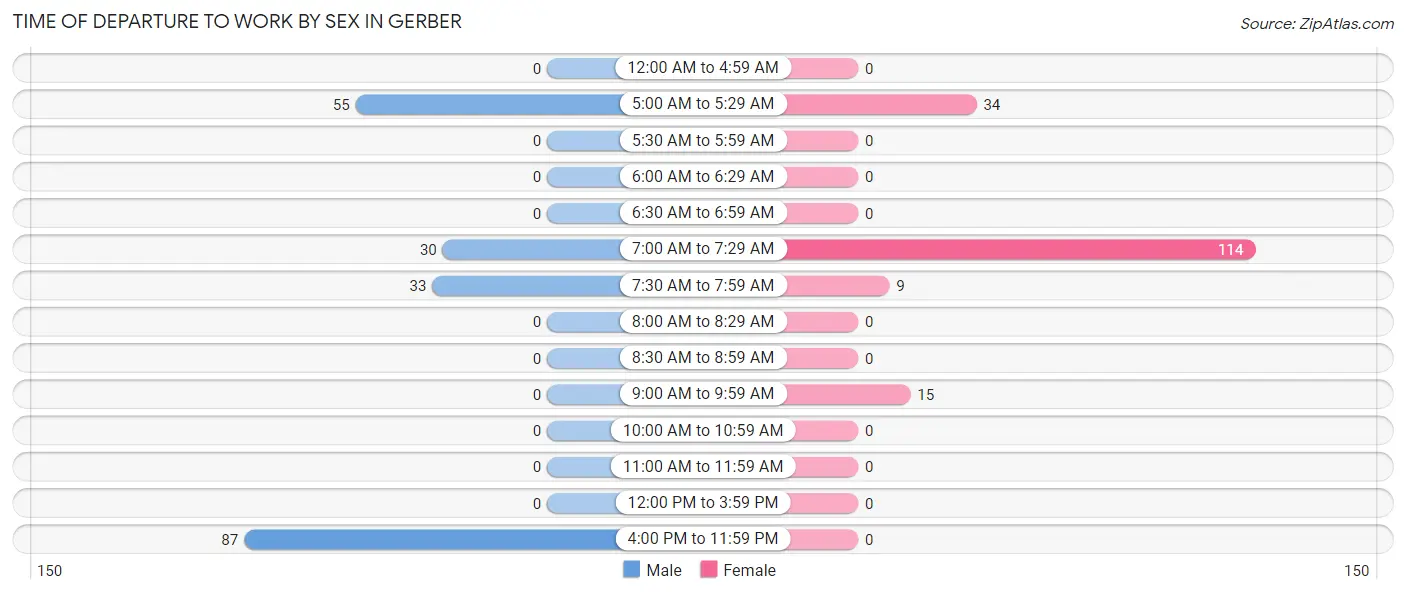
| Time of Departure | Male | Female |
| 12:00 AM to 4:59 AM | 0 (0.0%) | 0 (0.0%) |
| 5:00 AM to 5:29 AM | 55 (26.8%) | 34 (19.8%) |
| 5:30 AM to 5:59 AM | 0 (0.0%) | 0 (0.0%) |
| 6:00 AM to 6:29 AM | 0 (0.0%) | 0 (0.0%) |
| 6:30 AM to 6:59 AM | 0 (0.0%) | 0 (0.0%) |
| 7:00 AM to 7:29 AM | 30 (14.6%) | 114 (66.3%) |
| 7:30 AM to 7:59 AM | 33 (16.1%) | 9 (5.2%) |
| 8:00 AM to 8:29 AM | 0 (0.0%) | 0 (0.0%) |
| 8:30 AM to 8:59 AM | 0 (0.0%) | 0 (0.0%) |
| 9:00 AM to 9:59 AM | 0 (0.0%) | 15 (8.7%) |
| 10:00 AM to 10:59 AM | 0 (0.0%) | 0 (0.0%) |
| 11:00 AM to 11:59 AM | 0 (0.0%) | 0 (0.0%) |
| 12:00 PM to 3:59 PM | 0 (0.0%) | 0 (0.0%) |
| 4:00 PM to 11:59 PM | 87 (42.4%) | 0 (0.0%) |
| Total | 205 (100.0%) | 172 (100.0%) |
Housing Occupancy in Gerber
Occupancy by Ownership in Gerber
Of the total 554 dwellings in Gerber, owner-occupied units account for 306 (55.2%), while renter-occupied units make up 248 (44.8%).
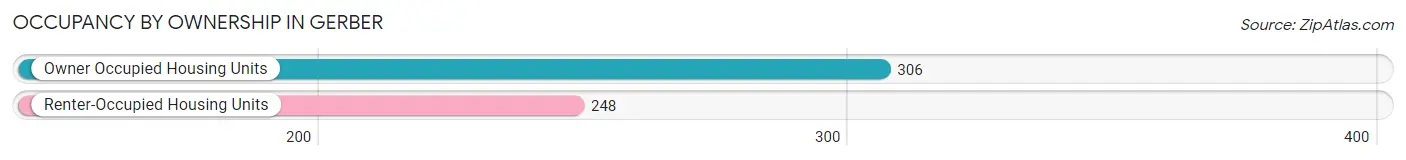
| Occupancy | # Housing Units | % Housing Units |
| Owner Occupied Housing Units | 306 | 55.2% |
| Renter-Occupied Housing Units | 248 | 44.8% |
| Total Occupied Housing Units | 554 | 100.0% |
Occupancy by Household Size in Gerber
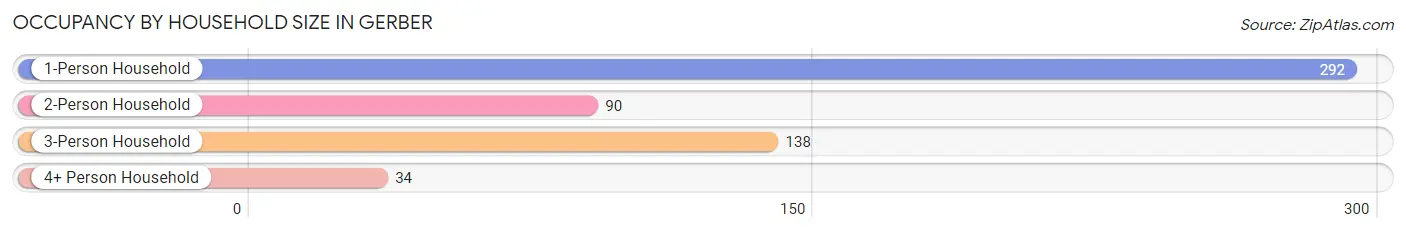
| Household Size | # Housing Units | % Housing Units |
| 1-Person Household | 292 | 52.7% |
| 2-Person Household | 90 | 16.3% |
| 3-Person Household | 138 | 24.9% |
| 4+ Person Household | 34 | 6.1% |
| Total Housing Units | 554 | 100.0% |
Occupancy by Ownership by Household Size in Gerber
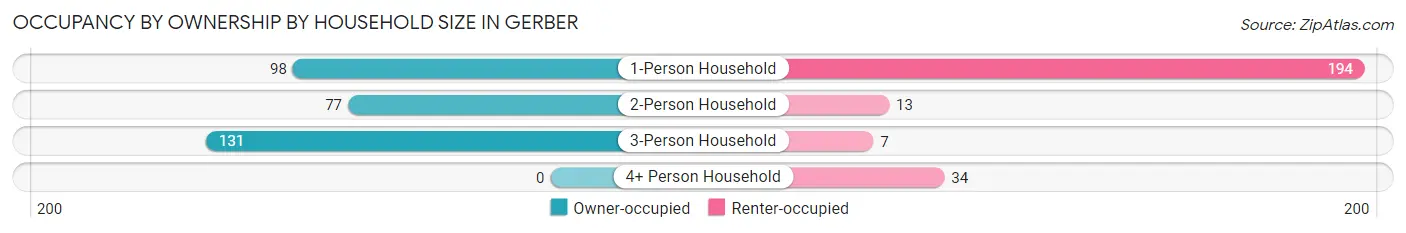
| Household Size | Owner-occupied | Renter-occupied |
| 1-Person Household | 98 (33.6%) | 194 (66.4%) |
| 2-Person Household | 77 (85.6%) | 13 (14.4%) |
| 3-Person Household | 131 (94.9%) | 7 (5.1%) |
| 4+ Person Household | 0 (0.0%) | 34 (100.0%) |
| Total Housing Units | 306 (55.2%) | 248 (44.8%) |
Occupancy by Educational Attainment in Gerber
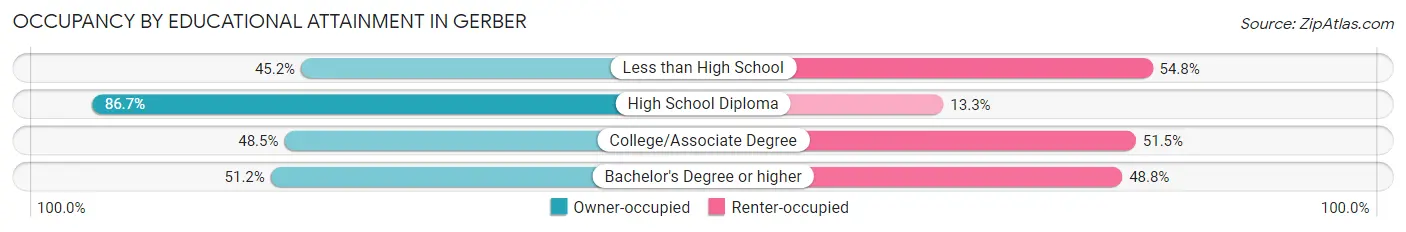
| Household Size | Owner-occupied | Renter-occupied |
| Less than High School | 132 (45.2%) | 160 (54.8%) |
| High School Diploma | 104 (86.7%) | 16 (13.3%) |
| College/Associate Degree | 49 (48.5%) | 52 (51.5%) |
| Bachelor's Degree or higher | 21 (51.2%) | 20 (48.8%) |
Occupancy by Age of Householder in Gerber
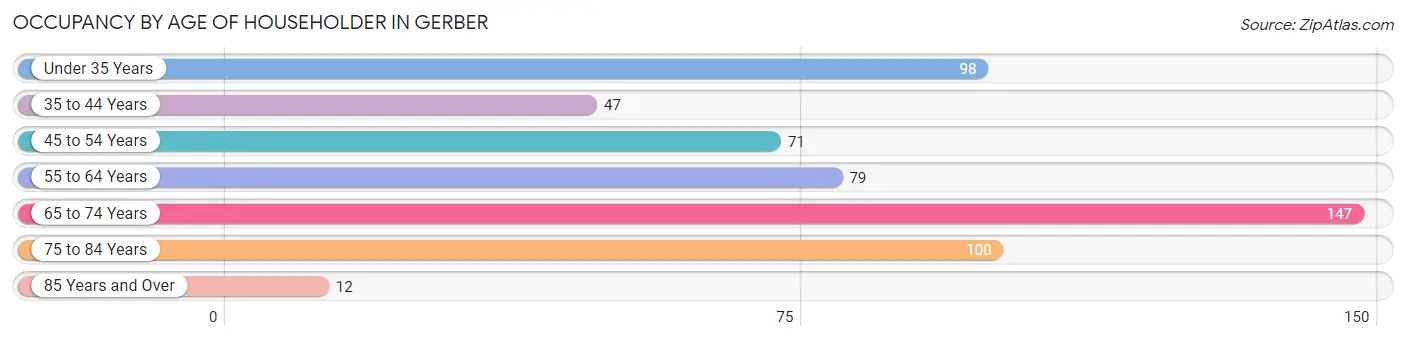
| Age Bracket | # Households | % Households |
| Under 35 Years | 98 | 17.7% |
| 35 to 44 Years | 47 | 8.5% |
| 45 to 54 Years | 71 | 12.8% |
| 55 to 64 Years | 79 | 14.3% |
| 65 to 74 Years | 147 | 26.5% |
| 75 to 84 Years | 100 | 18.0% |
| 85 Years and Over | 12 | 2.2% |
| Total | 554 | 100.0% |
Housing Finances in Gerber
Median Income by Occupancy in Gerber
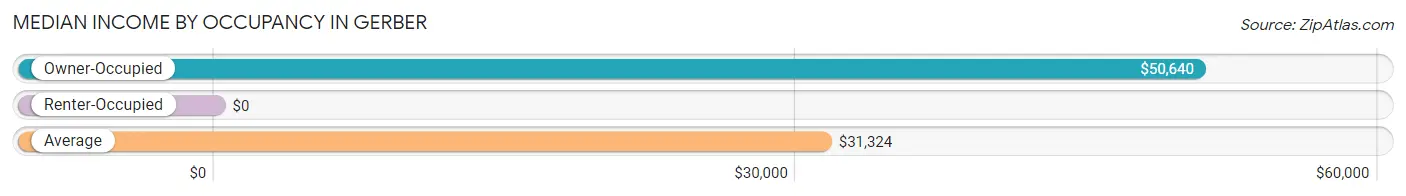
| Occupancy Type | # Households | Median Income |
| Owner-Occupied | 306 (55.2%) | $50,640 |
| Renter-Occupied | 248 (44.8%) | $0 |
| Average | 554 (100.0%) | $31,324 |
Occupancy by Householder Income Bracket in Gerber
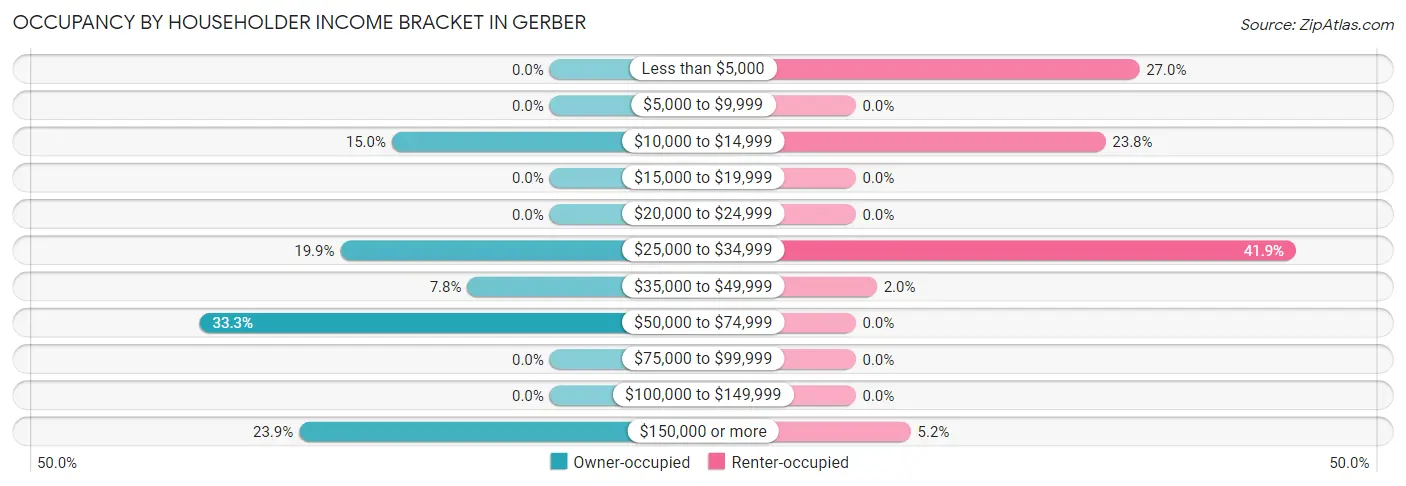
| Income Bracket | Owner-occupied | Renter-occupied |
| Less than $5,000 | 0 (0.0%) | 67 (27.0%) |
| $5,000 to $9,999 | 0 (0.0%) | 0 (0.0%) |
| $10,000 to $14,999 | 46 (15.0%) | 59 (23.8%) |
| $15,000 to $19,999 | 0 (0.0%) | 0 (0.0%) |
| $20,000 to $24,999 | 0 (0.0%) | 0 (0.0%) |
| $25,000 to $34,999 | 61 (19.9%) | 104 (41.9%) |
| $35,000 to $49,999 | 24 (7.8%) | 5 (2.0%) |
| $50,000 to $74,999 | 102 (33.3%) | 0 (0.0%) |
| $75,000 to $99,999 | 0 (0.0%) | 0 (0.0%) |
| $100,000 to $149,999 | 0 (0.0%) | 0 (0.0%) |
| $150,000 or more | 73 (23.9%) | 13 (5.2%) |
| Total | 306 (100.0%) | 248 (100.0%) |
Monthly Housing Cost Tiers in Gerber
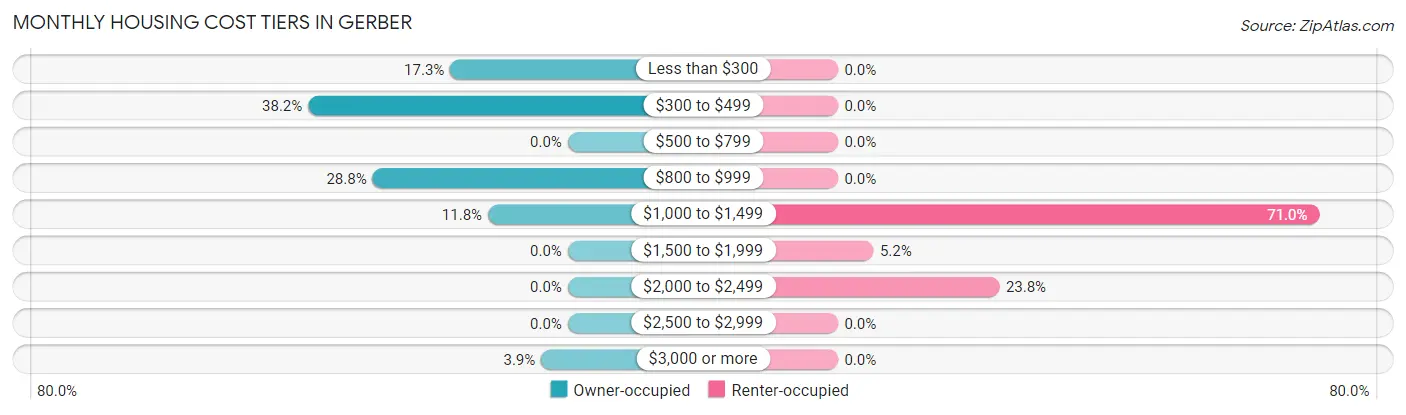
| Monthly Cost | Owner-occupied | Renter-occupied |
| Less than $300 | 53 (17.3%) | 0 (0.0%) |
| $300 to $499 | 117 (38.2%) | 0 (0.0%) |
| $500 to $799 | 0 (0.0%) | 0 (0.0%) |
| $800 to $999 | 88 (28.8%) | 0 (0.0%) |
| $1,000 to $1,499 | 36 (11.8%) | 176 (71.0%) |
| $1,500 to $1,999 | 0 (0.0%) | 13 (5.2%) |
| $2,000 to $2,499 | 0 (0.0%) | 59 (23.8%) |
| $2,500 to $2,999 | 0 (0.0%) | 0 (0.0%) |
| $3,000 or more | 12 (3.9%) | 0 (0.0%) |
| Total | 306 (100.0%) | 248 (100.0%) |
Physical Housing Characteristics in Gerber
Housing Structures in Gerber
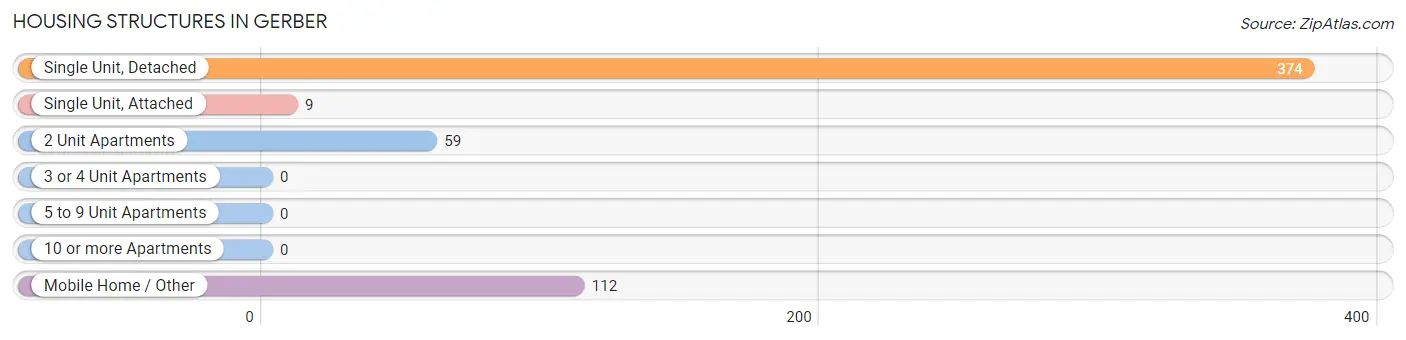
| Structure Type | # Housing Units | % Housing Units |
| Single Unit, Detached | 374 | 67.5% |
| Single Unit, Attached | 9 | 1.6% |
| 2 Unit Apartments | 59 | 10.6% |
| 3 or 4 Unit Apartments | 0 | 0.0% |
| 5 to 9 Unit Apartments | 0 | 0.0% |
| 10 or more Apartments | 0 | 0.0% |
| Mobile Home / Other | 112 | 20.2% |
| Total | 554 | 100.0% |
Housing Structures by Occupancy in Gerber
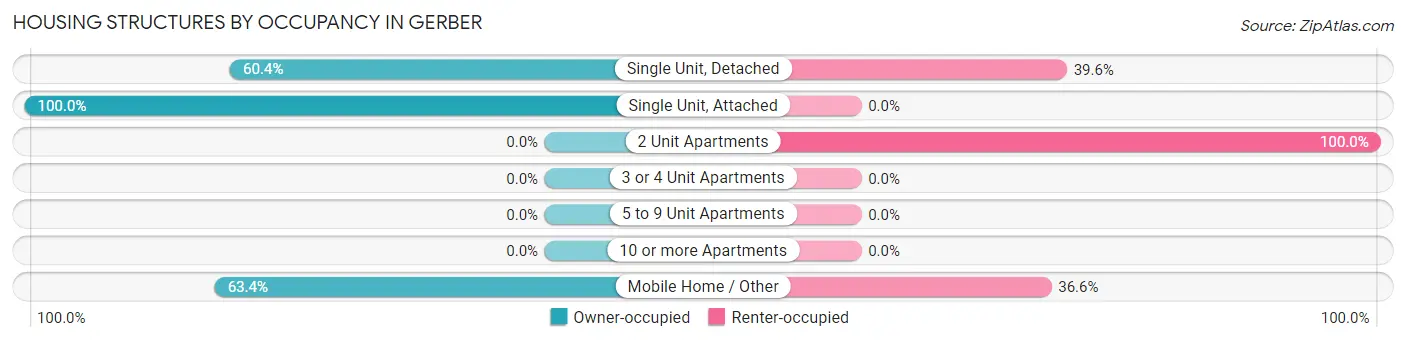
| Structure Type | Owner-occupied | Renter-occupied |
| Single Unit, Detached | 226 (60.4%) | 148 (39.6%) |
| Single Unit, Attached | 9 (100.0%) | 0 (0.0%) |
| 2 Unit Apartments | 0 (0.0%) | 59 (100.0%) |
| 3 or 4 Unit Apartments | 0 (0.0%) | 0 (0.0%) |
| 5 to 9 Unit Apartments | 0 (0.0%) | 0 (0.0%) |
| 10 or more Apartments | 0 (0.0%) | 0 (0.0%) |
| Mobile Home / Other | 71 (63.4%) | 41 (36.6%) |
| Total | 306 (55.2%) | 248 (44.8%) |
Housing Structures by Number of Rooms in Gerber
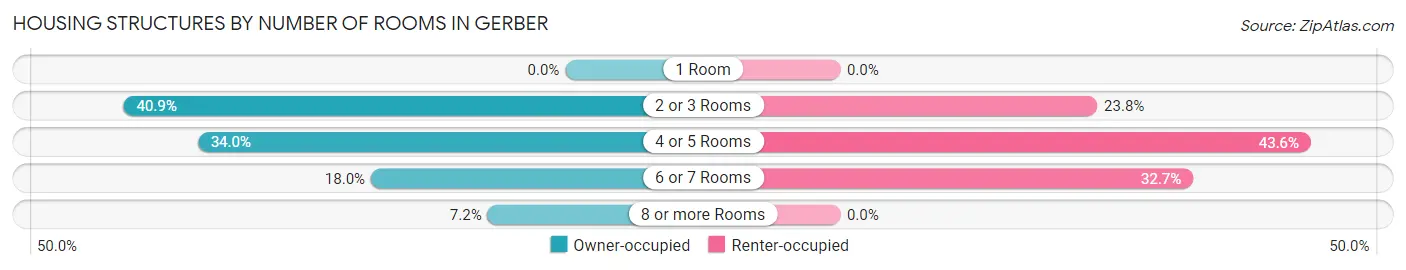
| Number of Rooms | Owner-occupied | Renter-occupied |
| 1 Room | 0 (0.0%) | 0 (0.0%) |
| 2 or 3 Rooms | 125 (40.8%) | 59 (23.8%) |
| 4 or 5 Rooms | 104 (34.0%) | 108 (43.5%) |
| 6 or 7 Rooms | 55 (18.0%) | 81 (32.7%) |
| 8 or more Rooms | 22 (7.2%) | 0 (0.0%) |
| Total | 306 (100.0%) | 248 (100.0%) |
Housing Structure by Heating Type in Gerber
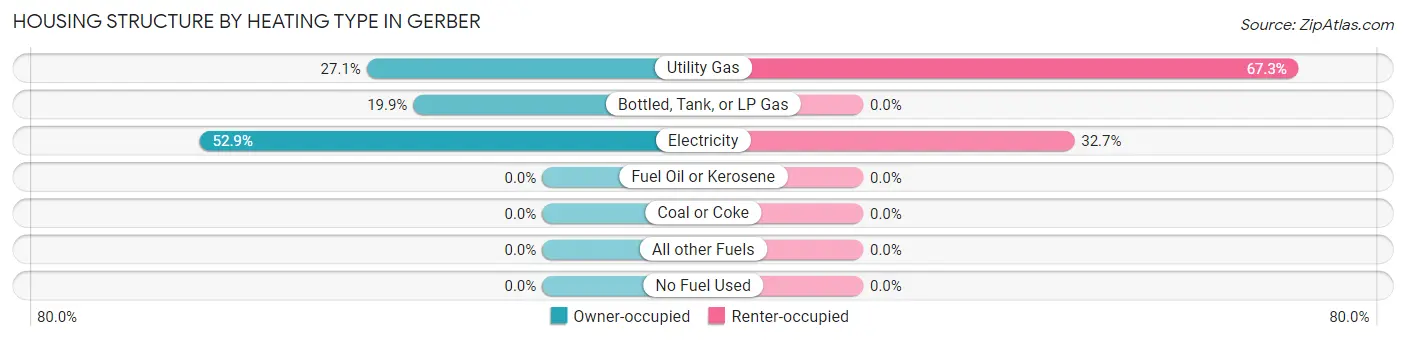
| Heating Type | Owner-occupied | Renter-occupied |
| Utility Gas | 83 (27.1%) | 167 (67.3%) |
| Bottled, Tank, or LP Gas | 61 (19.9%) | 0 (0.0%) |
| Electricity | 162 (52.9%) | 81 (32.7%) |
| Fuel Oil or Kerosene | 0 (0.0%) | 0 (0.0%) |
| Coal or Coke | 0 (0.0%) | 0 (0.0%) |
| All other Fuels | 0 (0.0%) | 0 (0.0%) |
| No Fuel Used | 0 (0.0%) | 0 (0.0%) |
| Total | 306 (100.0%) | 248 (100.0%) |
Household Vehicle Usage in Gerber
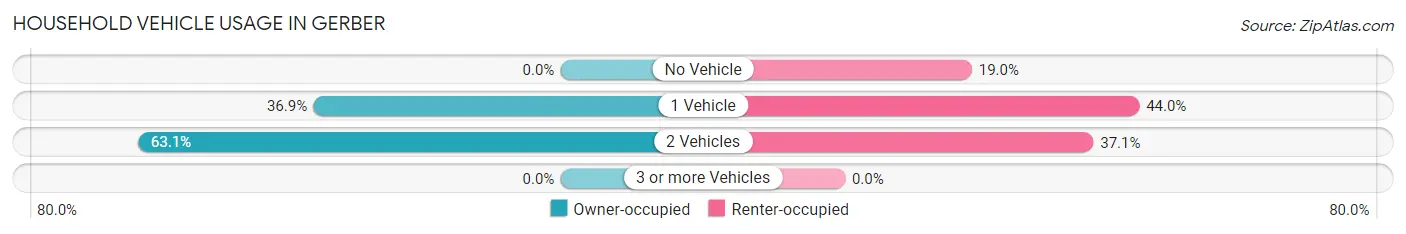
| Vehicles per Household | Owner-occupied | Renter-occupied |
| No Vehicle | 0 (0.0%) | 47 (19.0%) |
| 1 Vehicle | 113 (36.9%) | 109 (44.0%) |
| 2 Vehicles | 193 (63.1%) | 92 (37.1%) |
| 3 or more Vehicles | 0 (0.0%) | 0 (0.0%) |
| Total | 306 (100.0%) | 248 (100.0%) |
Real Estate & Mortgages in Gerber
Real Estate and Mortgage Overview in Gerber
| Characteristic | Without Mortgage | With Mortgage |
| Housing Units | 225 | 81 |
| Median Property Value | $119,000 | $130,200 |
| Median Household Income | $51,468 | $12 |
| Monthly Housing Costs | $332 | $12 |
| Real Estate Taxes | $541 | $0 |
Property Value by Mortgage Status in Gerber
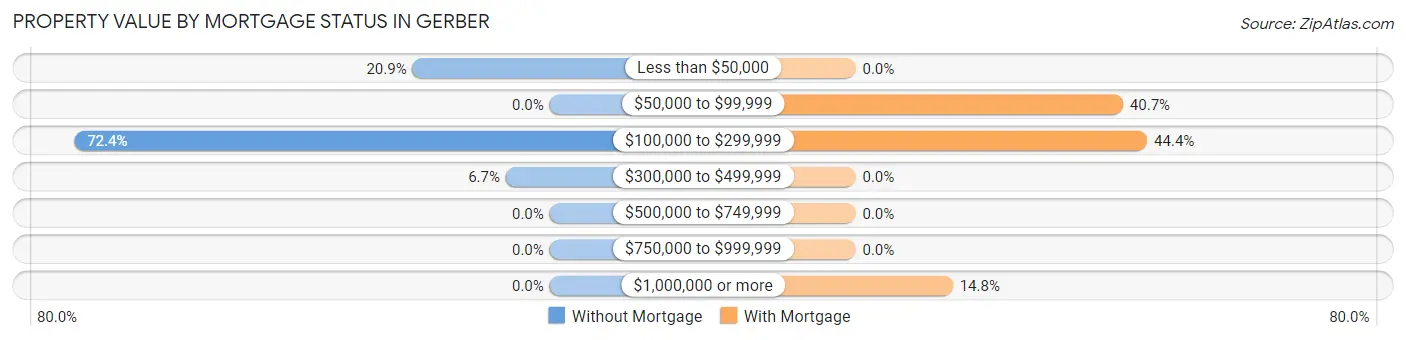
| Property Value | Without Mortgage | With Mortgage |
| Less than $50,000 | 47 (20.9%) | 0 (0.0%) |
| $50,000 to $99,999 | 0 (0.0%) | 33 (40.7%) |
| $100,000 to $299,999 | 163 (72.4%) | 36 (44.4%) |
| $300,000 to $499,999 | 15 (6.7%) | 0 (0.0%) |
| $500,000 to $749,999 | 0 (0.0%) | 0 (0.0%) |
| $750,000 to $999,999 | 0 (0.0%) | 0 (0.0%) |
| $1,000,000 or more | 0 (0.0%) | 12 (14.8%) |
| Total | 225 (100.0%) | 81 (100.0%) |
Household Income by Mortgage Status in Gerber
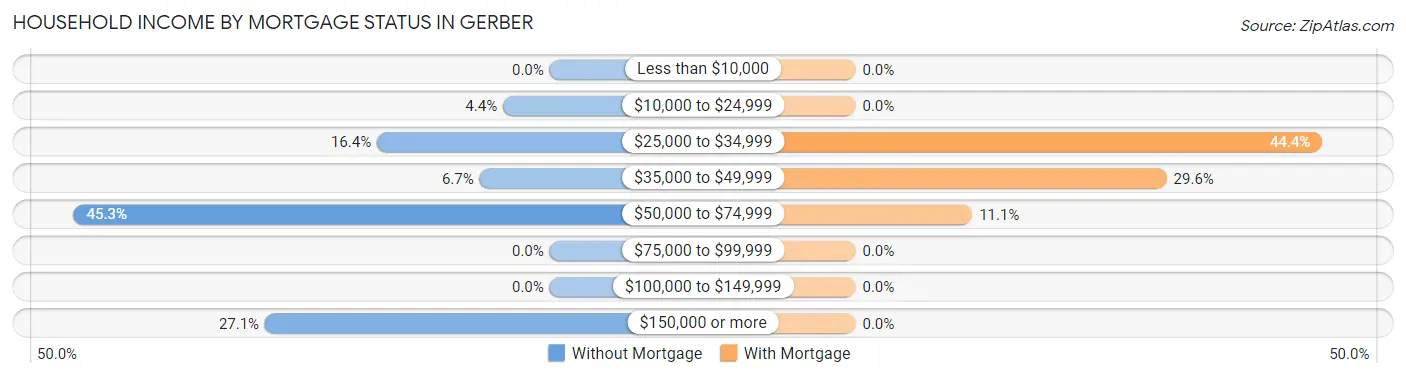
| Household Income | Without Mortgage | With Mortgage |
| Less than $10,000 | 0 (0.0%) | 0 (0.0%) |
| $10,000 to $24,999 | 10 (4.4%) | 0 (0.0%) |
| $25,000 to $34,999 | 37 (16.4%) | 36 (44.4%) |
| $35,000 to $49,999 | 15 (6.7%) | 24 (29.6%) |
| $50,000 to $74,999 | 102 (45.3%) | 9 (11.1%) |
| $75,000 to $99,999 | 0 (0.0%) | 0 (0.0%) |
| $100,000 to $149,999 | 0 (0.0%) | 0 (0.0%) |
| $150,000 or more | 61 (27.1%) | 0 (0.0%) |
| Total | 225 (100.0%) | 81 (100.0%) |
Property Value to Household Income Ratio in Gerber
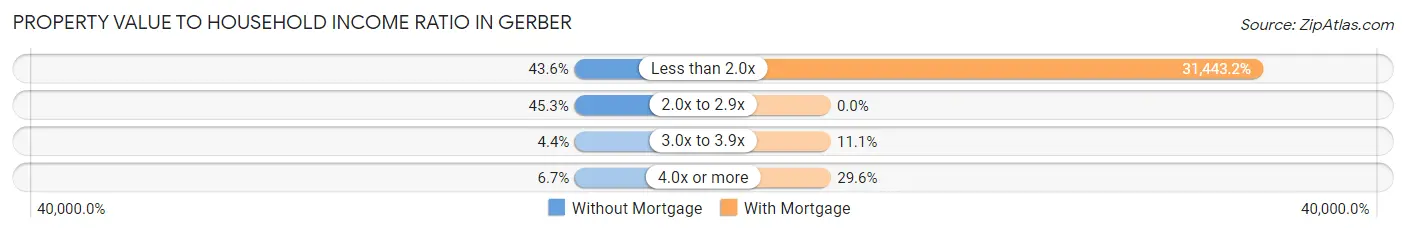
| Value-to-Income Ratio | Without Mortgage | With Mortgage |
| Less than 2.0x | 98 (43.6%) | 25,469 (31,443.2%) |
| 2.0x to 2.9x | 102 (45.3%) | 0 (0.0%) |
| 3.0x to 3.9x | 10 (4.4%) | 9 (11.1%) |
| 4.0x or more | 15 (6.7%) | 24 (29.6%) |
| Total | 225 (100.0%) | 81 (100.0%) |
Real Estate Taxes by Mortgage Status in Gerber
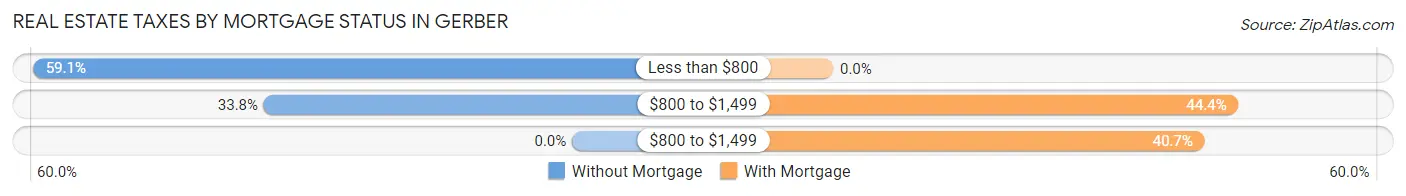
| Property Taxes | Without Mortgage | With Mortgage |
| Less than $800 | 133 (59.1%) | 0 (0.0%) |
| $800 to $1,499 | 76 (33.8%) | 36 (44.4%) |
| $800 to $1,499 | 0 (0.0%) | 33 (40.7%) |
| Total | 225 (100.0%) | 81 (100.0%) |
Health & Disability in Gerber
Health Insurance Coverage by Age in Gerber
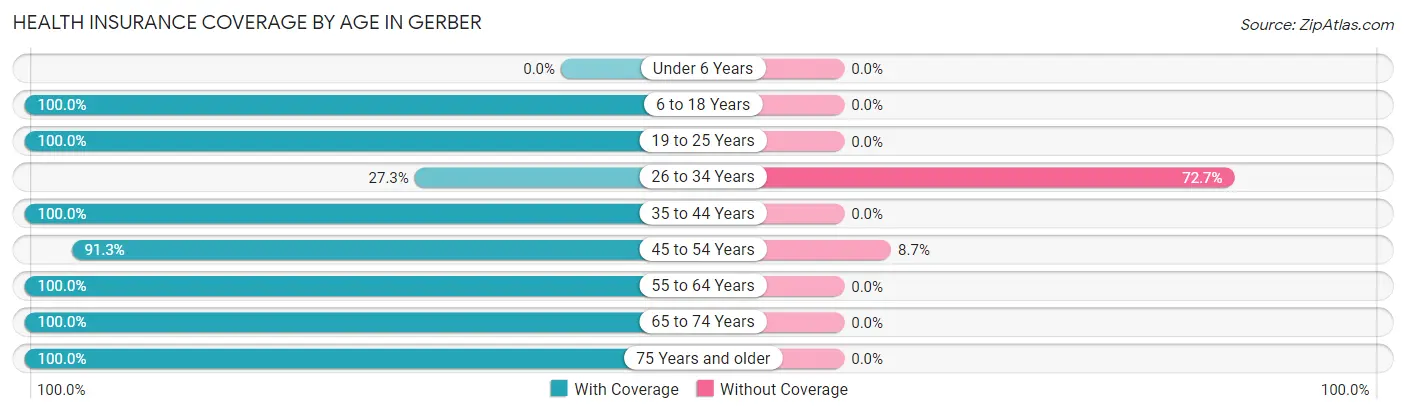
| Age Bracket | With Coverage | Without Coverage |
| Under 6 Years | 0 (0.0%) | 0 (0.0%) |
| 6 to 18 Years | 335 (100.0%) | 0 (0.0%) |
| 19 to 25 Years | 50 (100.0%) | 0 (0.0%) |
| 26 to 34 Years | 6 (27.3%) | 16 (72.7%) |
| 35 to 44 Years | 108 (100.0%) | 0 (0.0%) |
| 45 to 54 Years | 94 (91.3%) | 9 (8.7%) |
| 55 to 64 Years | 167 (100.0%) | 0 (0.0%) |
| 65 to 74 Years | 187 (100.0%) | 0 (0.0%) |
| 75 Years and older | 112 (100.0%) | 0 (0.0%) |
| Total | 1,059 (97.7%) | 25 (2.3%) |
Health Insurance Coverage by Citizenship Status in Gerber
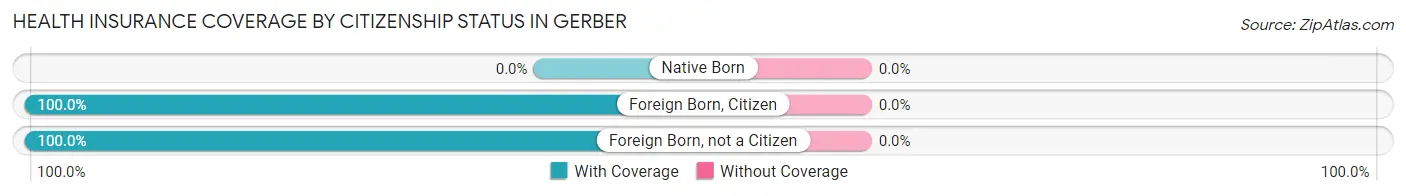
| Citizenship Status | With Coverage | Without Coverage |
| Native Born | 0 (0.0%) | 0 (0.0%) |
| Foreign Born, Citizen | 335 (100.0%) | 0 (0.0%) |
| Foreign Born, not a Citizen | 50 (100.0%) | 0 (0.0%) |
Health Insurance Coverage by Household Income in Gerber
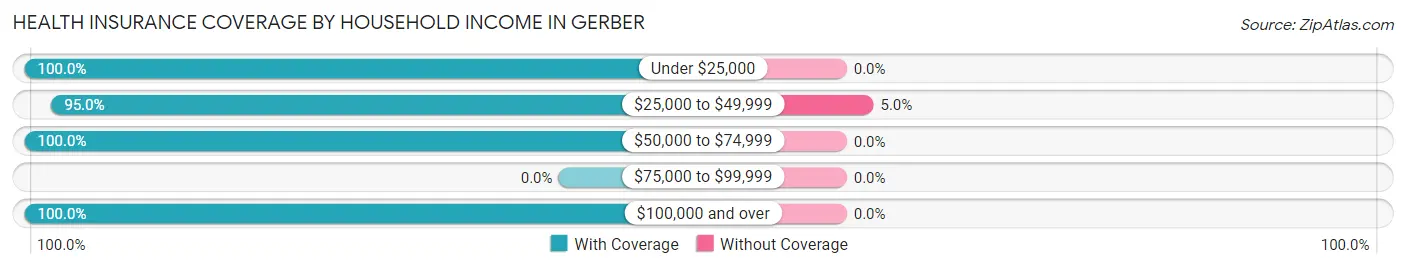
| Household Income | With Coverage | Without Coverage |
| Under $25,000 | 172 (100.0%) | 0 (0.0%) |
| $25,000 to $49,999 | 474 (95.0%) | 25 (5.0%) |
| $50,000 to $74,999 | 212 (100.0%) | 0 (0.0%) |
| $75,000 to $99,999 | 0 (0.0%) | 0 (0.0%) |
| $100,000 and over | 201 (100.0%) | 0 (0.0%) |
Public vs Private Health Insurance Coverage by Age in Gerber
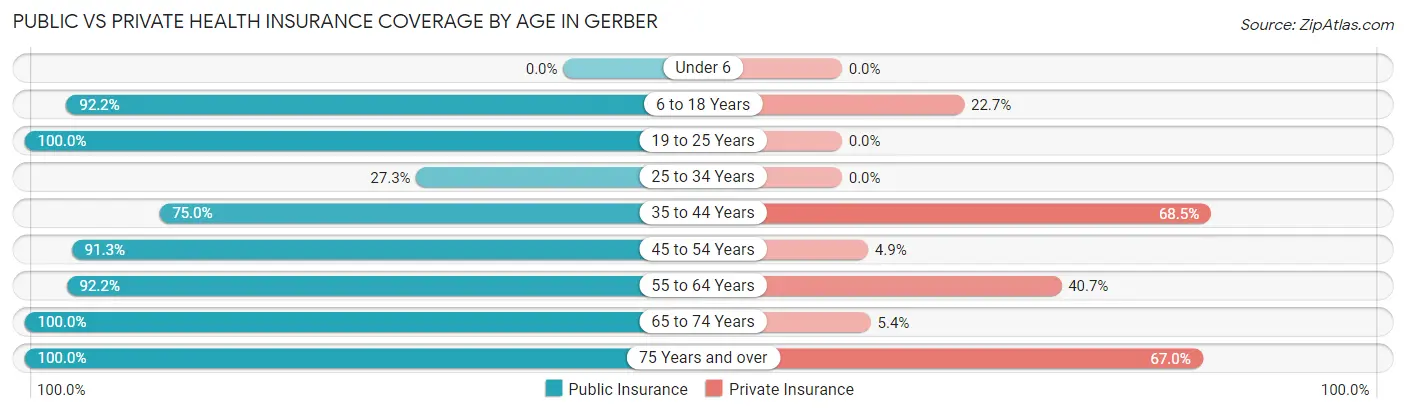
| Age Bracket | Public Insurance | Private Insurance |
| Under 6 | 0 (0.0%) | 0 (0.0%) |
| 6 to 18 Years | 309 (92.2%) | 76 (22.7%) |
| 19 to 25 Years | 50 (100.0%) | 0 (0.0%) |
| 25 to 34 Years | 6 (27.3%) | 0 (0.0%) |
| 35 to 44 Years | 81 (75.0%) | 74 (68.5%) |
| 45 to 54 Years | 94 (91.3%) | 5 (4.9%) |
| 55 to 64 Years | 154 (92.2%) | 68 (40.7%) |
| 65 to 74 Years | 187 (100.0%) | 10 (5.3%) |
| 75 Years and over | 112 (100.0%) | 75 (67.0%) |
| Total | 993 (91.6%) | 308 (28.4%) |
Disability Status by Sex by Age in Gerber
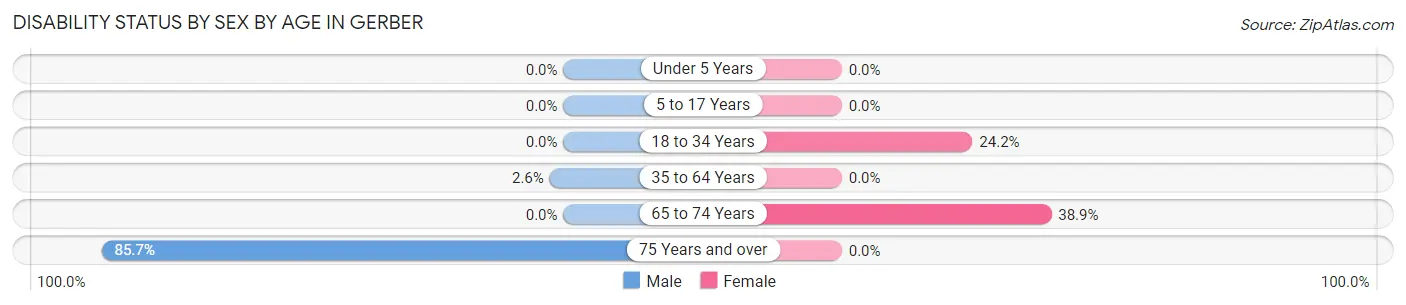
| Age Bracket | Male | Female |
| Under 5 Years | 0 (0.0%) | 0 (0.0%) |
| 5 to 17 Years | 0 (0.0%) | 0 (0.0%) |
| 18 to 34 Years | 0 (0.0%) | 16 (24.2%) |
| 35 to 64 Years | 5 (2.5%) | 0 (0.0%) |
| 65 to 74 Years | 0 (0.0%) | 49 (38.9%) |
| 75 Years and over | 96 (85.7%) | 0 (0.0%) |
Disability Class by Sex by Age in Gerber
Disability Class: Hearing Difficulty
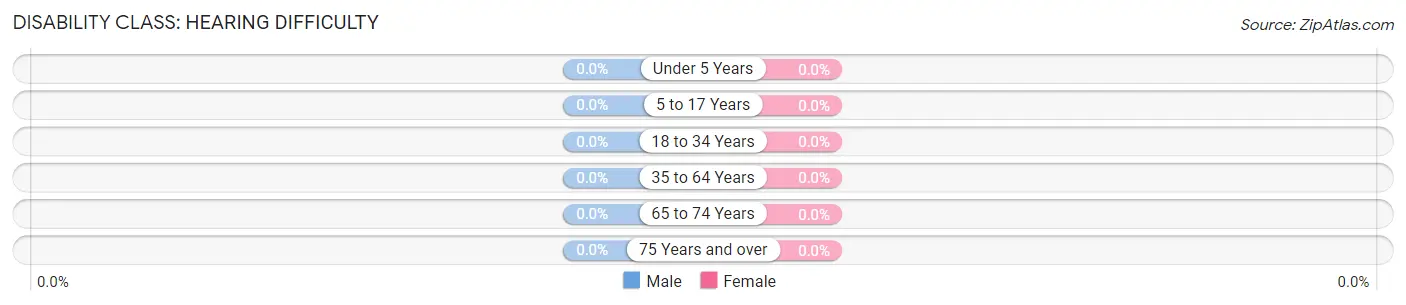
| Age Bracket | Male | Female |
| Under 5 Years | 0 (0.0%) | 0 (0.0%) |
| 5 to 17 Years | 0 (0.0%) | 0 (0.0%) |
| 18 to 34 Years | 0 (0.0%) | 0 (0.0%) |
| 35 to 64 Years | 0 (0.0%) | 0 (0.0%) |
| 65 to 74 Years | 0 (0.0%) | 0 (0.0%) |
| 75 Years and over | 0 (0.0%) | 0 (0.0%) |
Disability Class: Vision Difficulty
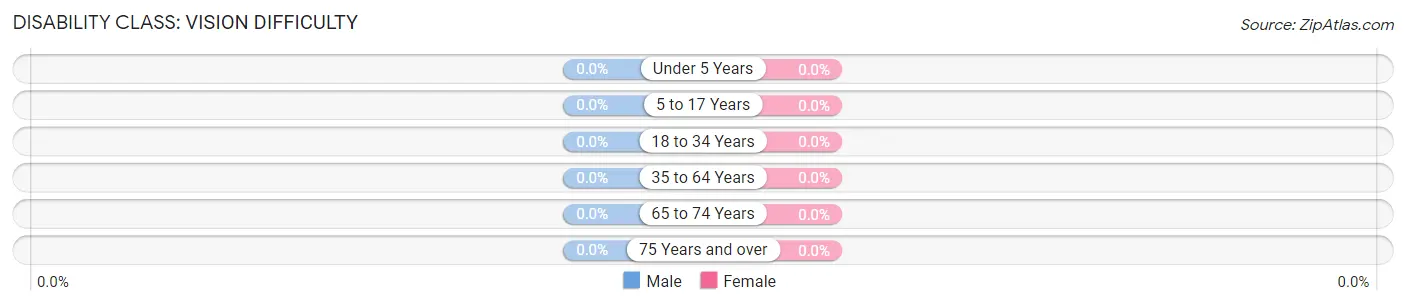
| Age Bracket | Male | Female |
| Under 5 Years | 0 (0.0%) | 0 (0.0%) |
| 5 to 17 Years | 0 (0.0%) | 0 (0.0%) |
| 18 to 34 Years | 0 (0.0%) | 0 (0.0%) |
| 35 to 64 Years | 0 (0.0%) | 0 (0.0%) |
| 65 to 74 Years | 0 (0.0%) | 0 (0.0%) |
| 75 Years and over | 0 (0.0%) | 0 (0.0%) |
Disability Class: Cognitive Difficulty
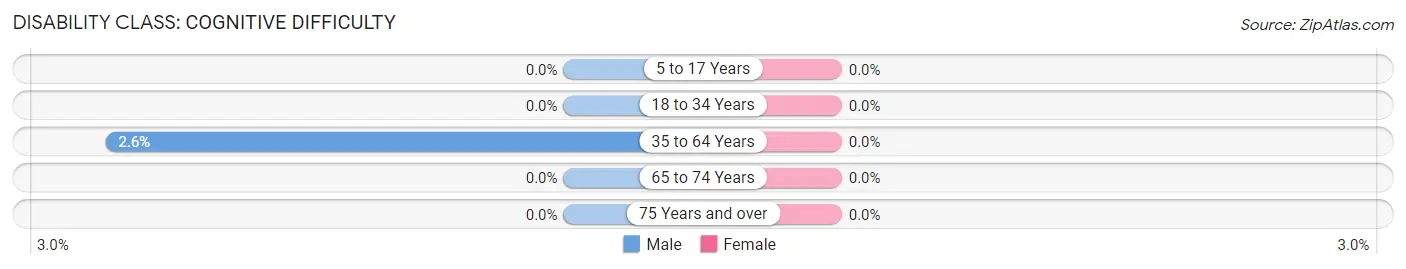
| Age Bracket | Male | Female |
| 5 to 17 Years | 0 (0.0%) | 0 (0.0%) |
| 18 to 34 Years | 0 (0.0%) | 0 (0.0%) |
| 35 to 64 Years | 5 (2.5%) | 0 (0.0%) |
| 65 to 74 Years | 0 (0.0%) | 0 (0.0%) |
| 75 Years and over | 0 (0.0%) | 0 (0.0%) |
Disability Class: Ambulatory Difficulty
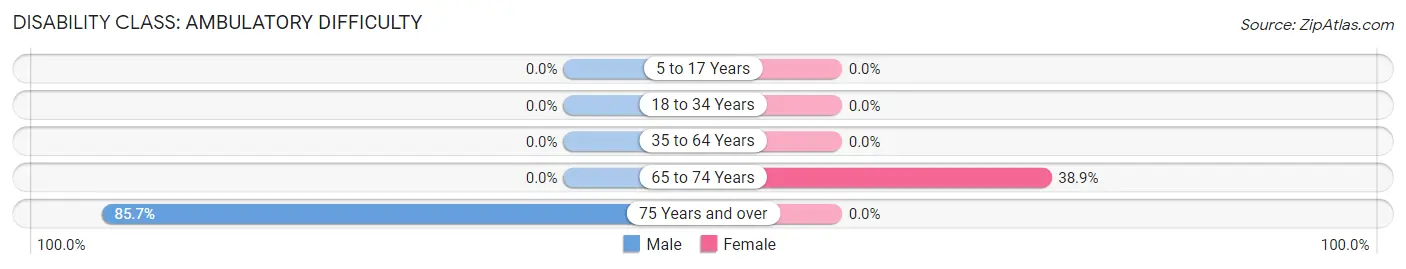
| Age Bracket | Male | Female |
| 5 to 17 Years | 0 (0.0%) | 0 (0.0%) |
| 18 to 34 Years | 0 (0.0%) | 0 (0.0%) |
| 35 to 64 Years | 0 (0.0%) | 0 (0.0%) |
| 65 to 74 Years | 0 (0.0%) | 49 (38.9%) |
| 75 Years and over | 96 (85.7%) | 0 (0.0%) |
Disability Class: Self-Care Difficulty
| Age Bracket | Male | Female |
| 5 to 17 Years | 0 (0.0%) | 0 (0.0%) |
| 18 to 34 Years | 0 (0.0%) | 0 (0.0%) |
| 35 to 64 Years | 0 (0.0%) | 0 (0.0%) |
| 65 to 74 Years | 0 (0.0%) | 0 (0.0%) |
| 75 Years and over | 0 (0.0%) | 0 (0.0%) |
Technology Access in Gerber
Computing Device Access in Gerber
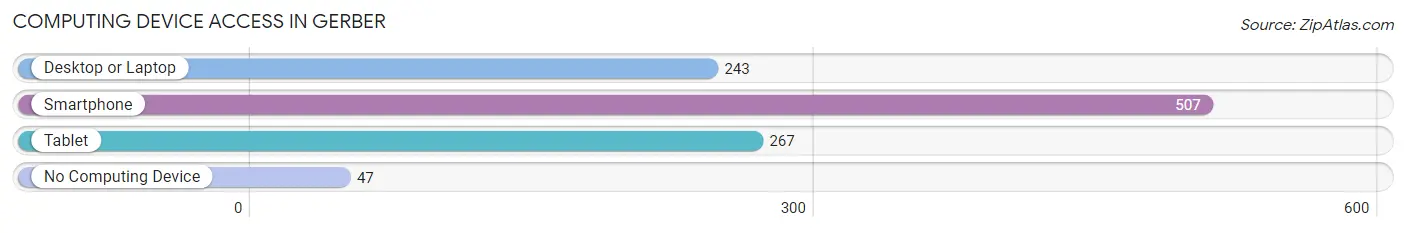
| Device Type | # Households | % Households |
| Desktop or Laptop | 243 | 43.9% |
| Smartphone | 507 | 91.5% |
| Tablet | 267 | 48.2% |
| No Computing Device | 47 | 8.5% |
| Total | 554 | 100.0% |
Internet Access in Gerber
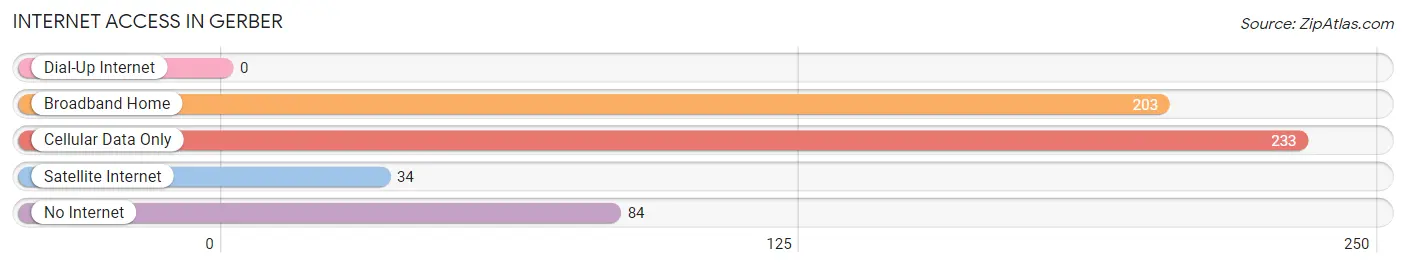
| Internet Type | # Households | % Households |
| Dial-Up Internet | 0 | 0.0% |
| Broadband Home | 203 | 36.6% |
| Cellular Data Only | 233 | 42.1% |
| Satellite Internet | 34 | 6.1% |
| No Internet | 84 | 15.2% |
| Total | 554 | 100.0% |
Gerber Summary
Gerber is a small unincorporated community located in Tehama County, California. It is situated in the northern part of the state, about 20 miles south of Red Bluff and about 40 miles north of Chico. The population of Gerber was estimated to be around 1,000 in 2020.
History
Gerber was founded in 1876 by German immigrant, John Gerber. He purchased a large tract of land in the area and began to develop it into a farming community. The town was originally called “Gerber’s Station”, but the name was later changed to Gerber. The town was officially incorporated in 1891.
In the early 1900s, Gerber was a thriving agricultural community. The town was home to a number of farms, including a large dairy farm owned by the Gerber family. The town also had a general store, a post office, a blacksmith shop, and a hotel.
In the 1920s, Gerber began to experience a decline in population as many of the town’s residents moved away to larger cities. The town’s population continued to decline until the 1950s, when the construction of the nearby Oroville Dam brought new jobs and economic opportunities to the area.
Geography
Gerber is located in the northern part of Tehama County, about 20 miles south of Red Bluff and about 40 miles north of Chico. The town is situated in the foothills of the Sierra Nevada Mountains, and is surrounded by rolling hills and open farmland. The town is located at an elevation of about 1,000 feet above sea level.
The climate in Gerber is generally mild, with hot summers and cool winters. The average annual temperature is around 60 degrees Fahrenheit. The area receives an average of about 20 inches of precipitation each year, mostly in the form of rain.
Economy
The economy of Gerber is largely based on agriculture. The town is home to a number of farms, including a large dairy farm owned by the Gerber family. The town also has a number of small businesses, including a general store, a post office, and a hotel.
The town is also home to a number of manufacturing companies, including a furniture factory and a woodworking shop. The town is also home to a number of wineries, which produce a variety of wines.
Demographics
The population of Gerber was estimated to be around 1,000 in 2020. The town is predominantly white, with about 90% of the population identifying as Caucasian. The town also has a small Hispanic population, with about 5% of the population identifying as Hispanic or Latino. The town also has a small African American population, with about 2% of the population identifying as African American.
The median household income in Gerber is around $50,000, which is slightly lower than the national average. The town has a relatively low poverty rate, with about 8% of the population living below the poverty line. The town also has a relatively low unemployment rate, with about 4% of the population unemployed.
Common Questions
What is Per Capita Income in Gerber?
Per Capita income in Gerber is $31,043.
What is the Median Family Income in Gerber?
Median Family Income in Gerber is $50,636.
What is the Median Household income in Gerber?
Median Household Income in Gerber is $31,324.
What is Income or Wage Gap in Gerber?
Income or Wage Gap in Gerber is 17.4%.
Women in Gerber earn 82.6 cents for every dollar earned by a man.
What is Inequality or Gini Index in Gerber?
Inequality or Gini Index in Gerber is 0.58.
What is the Total Population of Gerber?
Total Population of Gerber is 1,084.
What is the Total Male Population of Gerber?
Total Male Population of Gerber is 636.
What is the Total Female Population of Gerber?
Total Female Population of Gerber is 448.
What is the Ratio of Males per 100 Females in Gerber?
There are 141.96 Males per 100 Females in Gerber.
What is the Ratio of Females per 100 Males in Gerber?
There are 70.44 Females per 100 Males in Gerber.
What is the Median Population Age in Gerber?
Median Population Age in Gerber is 48.2 Years.
What is the Average Family Size in Gerber
Average Family Size in Gerber is 3.0 People.
What is the Average Household Size in Gerber
Average Household Size in Gerber is 2.0 People.
How Large is the Labor Force in Gerber?
There are 420 People in the Labor Forcein in Gerber.
What is the Percentage of People in the Labor Force in Gerber?
48.5% of People are in the Labor Force in Gerber.
What is the Unemployment Rate in Gerber?
Unemployment Rate in Gerber is 3.8%.