Cities with the Highest Percentage of Population Employed in Health Diagnosing & Treating in Alabama
RELATED REPORTS & OPTIONS
Health Diagnosing & Treating
Alabama
Compare Cities
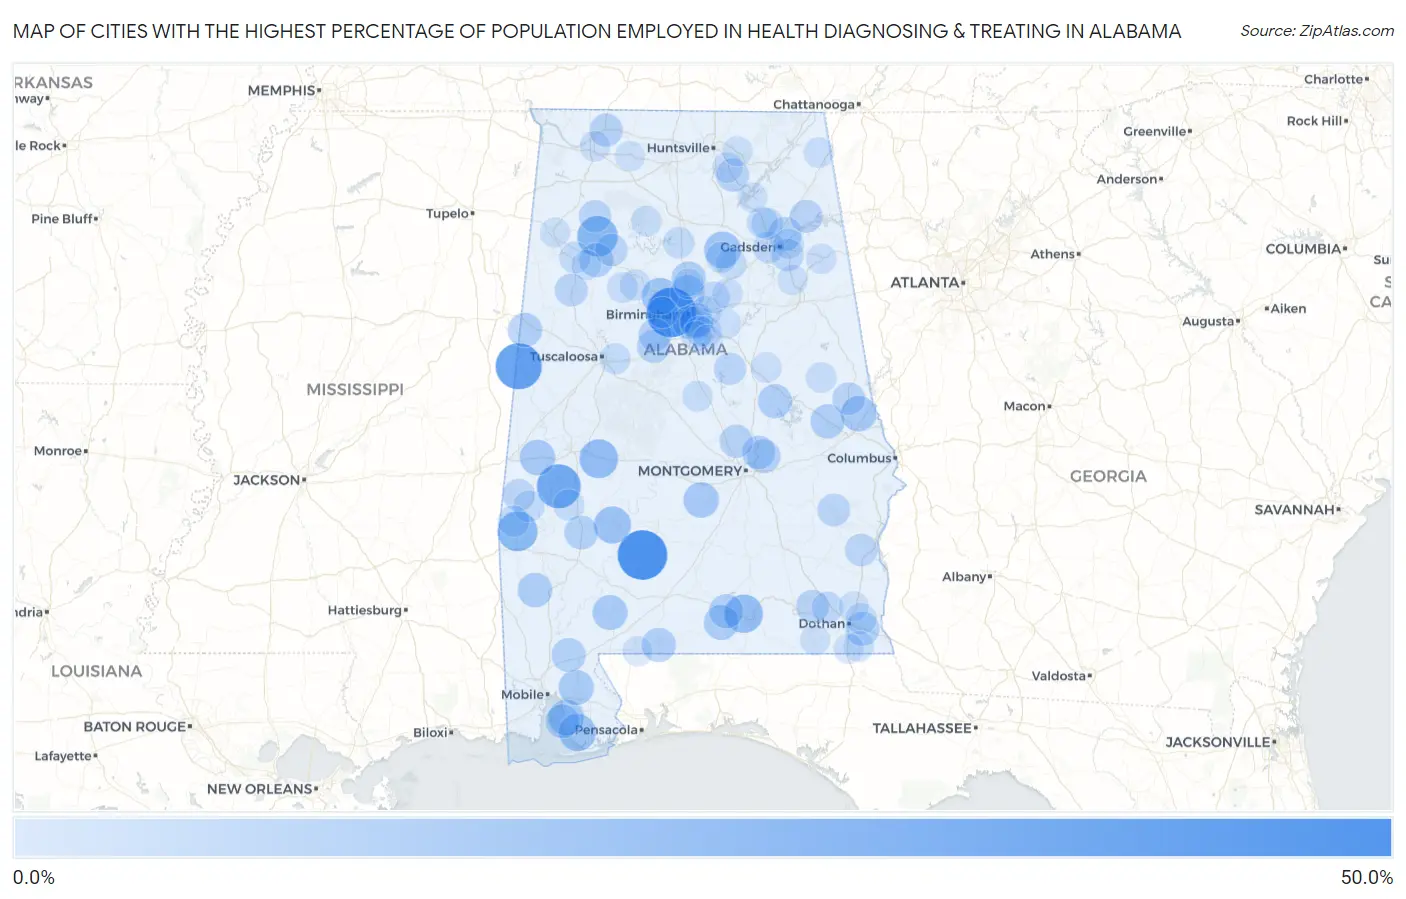
Map of Cities with the Highest Percentage of Population Employed in Health Diagnosing & Treating in Alabama
0.0%
50.0%
Cities with the Highest Percentage of Population Employed in Health Diagnosing & Treating in Alabama
| City | % Employed | vs State | vs National | |
| 1. | Beatrice | 42.1% | 7.0%(+35.1)#1 | 6.2%(+35.9)#126 |
| 2. | Edgewater | 42.1% | 7.0%(+35.0)#2 | 6.2%(+35.8)#127 |
| 3. | Memphis | 36.4% | 7.0%(+29.3)#3 | 6.2%(+30.1)#177 |
| 4. | Myrtlewood | 32.3% | 7.0%(+25.2)#4 | 6.2%(+26.0)#261 |
| 5. | Natural Bridge | 26.7% | 7.0%(+19.6)#5 | 6.2%(+20.4)#384 |
| 6. | Toxey | 25.8% | 7.0%(+18.7)#6 | 6.2%(+19.5)#417 |
| 7. | Faunsdale | 23.6% | 7.0%(+16.6)#7 | 6.2%(+17.4)#511 |
| 8. | Babbie | 23.1% | 7.0%(+16.1)#8 | 6.2%(+16.8)#541 |
| 9. | Magnolia Springs | 21.1% | 7.0%(+14.1)#9 | 6.2%(+14.9)#650 |
| 10. | Yellow Bluff | 21.1% | 7.0%(+14.0)#10 | 6.2%(+14.8)#656 |
| 11. | West Jefferson | 20.6% | 7.0%(+13.5)#11 | 6.2%(+14.3)#698 |
| 12. | Rosa | 20.4% | 7.0%(+13.4)#12 | 6.2%(+14.2)#708 |
| 13. | Fairhope | 19.0% | 7.0%(+12.0)#13 | 6.2%(+12.7)#845 |
| 14. | Cusseta | 18.5% | 7.0%(+11.5)#14 | 6.2%(+12.3)#893 |
| 15. | Bellamy | 18.5% | 7.0%(+11.5)#15 | 6.2%(+12.3)#894 |
| 16. | Gordonville | 18.5% | 7.0%(+11.5)#16 | 6.2%(+12.2)#897 |
| 17. | Stapleton | 17.7% | 7.0%(+10.7)#17 | 6.2%(+11.5)#984 |
| 18. | Uriah | 17.6% | 7.0%(+10.6)#18 | 6.2%(+11.4)#999 |
| 19. | Carolina | 17.4% | 7.0%(+10.3)#19 | 6.2%(+11.1)#1,029 |
| 20. | Hobson | 16.8% | 7.0%(+9.82)#20 | 6.2%(+10.6)#1,117 |
| 21. | Gardendale | 16.8% | 7.0%(+9.74)#21 | 6.2%(+10.5)#1,130 |
| 22. | Kimberly | 16.7% | 7.0%(+9.71)#22 | 6.2%(+10.5)#1,135 |
| 23. | Macedonia | 16.4% | 7.0%(+9.36)#23 | 6.2%(+10.1)#1,204 |
| 24. | Andalusia | 16.3% | 7.0%(+9.31)#24 | 6.2%(+10.1)#1,209 |
| 25. | Riverview | 16.3% | 7.0%(+9.30)#25 | 6.2%(+10.1)#1,212 |
| 26. | Waverly | 16.2% | 7.0%(+9.22)#26 | 6.2%(+9.99)#1,233 |
| 27. | Eldridge | 16.1% | 7.0%(+9.11)#27 | 6.2%(+9.88)#1,259 |
| 28. | Ray | 16.1% | 7.0%(+9.04)#28 | 6.2%(+9.82)#1,276 |
| 29. | Stockton | 16.0% | 7.0%(+8.94)#29 | 6.2%(+9.72)#1,287 |
| 30. | Avon | 15.9% | 7.0%(+8.90)#30 | 6.2%(+9.68)#1,297 |
| 31. | Point Clear | 15.9% | 7.0%(+8.83)#31 | 6.2%(+9.61)#1,315 |
| 32. | Lookout Mountain | 15.6% | 7.0%(+8.56)#32 | 6.2%(+9.34)#1,374 |
| 33. | Thomasville | 15.6% | 7.0%(+8.55)#33 | 6.2%(+9.33)#1,375 |
| 34. | Mountain Brook | 15.5% | 7.0%(+8.50)#34 | 6.2%(+9.27)#1,390 |
| 35. | Redland | 15.3% | 7.0%(+8.29)#35 | 6.2%(+9.07)#1,436 |
| 36. | Lake View | 15.1% | 7.0%(+8.04)#36 | 6.2%(+8.82)#1,491 |
| 37. | Blue Ridge | 15.0% | 7.0%(+7.98)#37 | 6.2%(+8.76)#1,504 |
| 38. | Deatsville | 14.7% | 7.0%(+7.66)#38 | 6.2%(+8.44)#1,582 |
| 39. | North Johns | 14.6% | 7.0%(+7.56)#39 | 6.2%(+8.34)#1,626 |
| 40. | Killen | 14.6% | 7.0%(+7.54)#40 | 6.2%(+8.32)#1,631 |
| 41. | New Hope | 14.5% | 7.0%(+7.47)#41 | 6.2%(+8.25)#1,648 |
| 42. | Sand Rock | 14.2% | 7.0%(+7.16)#42 | 6.2%(+7.94)#1,753 |
| 43. | Fayette | 14.0% | 7.0%(+7.00)#43 | 6.2%(+7.78)#1,801 |
| 44. | Homewood | 14.0% | 7.0%(+6.99)#44 | 6.2%(+7.76)#1,805 |
| 45. | Fort Rucker | 14.0% | 7.0%(+6.97)#45 | 6.2%(+7.74)#1,811 |
| 46. | Vestavia Hills | 13.9% | 7.0%(+6.89)#46 | 6.2%(+7.67)#1,824 |
| 47. | La Fayette | 13.9% | 7.0%(+6.88)#47 | 6.2%(+7.66)#1,829 |
| 48. | Midway | 13.7% | 7.0%(+6.70)#48 | 6.2%(+7.48)#1,897 |
| 49. | Nauvoo | 13.7% | 7.0%(+6.70)#49 | 6.2%(+7.48)#1,899 |
| 50. | Glencoe | 13.7% | 7.0%(+6.69)#50 | 6.2%(+7.47)#1,903 |
| 51. | Bakerhill | 13.5% | 7.0%(+6.49)#51 | 6.2%(+7.27)#1,973 |
| 52. | Haleyville | 13.4% | 7.0%(+6.41)#52 | 6.2%(+7.18)#2,018 |
| 53. | Talladega Springs | 13.3% | 7.0%(+6.31)#53 | 6.2%(+7.09)#2,048 |
| 54. | Lisman | 12.8% | 7.0%(+5.76)#54 | 6.2%(+6.54)#2,295 |
| 55. | Attalla | 12.7% | 7.0%(+5.67)#55 | 6.2%(+6.45)#2,336 |
| 56. | Sardis City | 12.6% | 7.0%(+5.54)#56 | 6.2%(+6.32)#2,395 |
| 57. | Trussville | 12.4% | 7.0%(+5.40)#57 | 6.2%(+6.18)#2,469 |
| 58. | Newton | 12.2% | 7.0%(+5.20)#58 | 6.2%(+5.98)#2,569 |
| 59. | Dodge City | 11.9% | 7.0%(+4.88)#59 | 6.2%(+5.66)#2,723 |
| 60. | Butler | 11.9% | 7.0%(+4.85)#60 | 6.2%(+5.62)#2,735 |
| 61. | Winfield | 11.9% | 7.0%(+4.84)#61 | 6.2%(+5.62)#2,739 |
| 62. | Needham | 11.8% | 7.0%(+4.74)#62 | 6.2%(+5.52)#2,801 |
| 63. | Sweet Water | 11.7% | 7.0%(+4.63)#63 | 6.2%(+5.41)#2,873 |
| 64. | Sylvan Springs | 11.5% | 7.0%(+4.51)#64 | 6.2%(+5.29)#2,967 |
| 65. | Highland Lake | 11.4% | 7.0%(+4.42)#65 | 6.2%(+5.20)#3,029 |
| 66. | Webb | 11.4% | 7.0%(+4.40)#66 | 6.2%(+5.17)#3,049 |
| 67. | Boaz | 11.4% | 7.0%(+4.37)#67 | 6.2%(+5.15)#3,061 |
| 68. | Cottondale | 11.3% | 7.0%(+4.28)#68 | 6.2%(+5.05)#3,121 |
| 69. | Oneonta | 11.2% | 7.0%(+4.19)#69 | 6.2%(+4.97)#3,173 |
| 70. | Oakman | 11.1% | 7.0%(+4.04)#70 | 6.2%(+4.82)#3,292 |
| 71. | Parrish | 11.0% | 7.0%(+4.02)#71 | 6.2%(+4.80)#3,307 |
| 72. | Mccalla | 10.8% | 7.0%(+3.73)#72 | 6.2%(+4.51)#3,508 |
| 73. | Thorsby | 10.7% | 7.0%(+3.72)#73 | 6.2%(+4.50)#3,525 |
| 74. | Addison | 10.7% | 7.0%(+3.66)#74 | 6.2%(+4.44)#3,568 |
| 75. | Daviston | 10.6% | 7.0%(+3.62)#75 | 6.2%(+4.39)#3,606 |
| 76. | Irondale | 10.5% | 7.0%(+3.52)#76 | 6.2%(+4.30)#3,692 |
| 77. | Muscle Shoals | 10.5% | 7.0%(+3.49)#77 | 6.2%(+4.26)#3,736 |
| 78. | Morris | 10.5% | 7.0%(+3.45)#78 | 6.2%(+4.23)#3,757 |
| 79. | Ider | 10.4% | 7.0%(+3.42)#79 | 6.2%(+4.20)#3,780 |
| 80. | Tidmore Bend | 10.3% | 7.0%(+3.32)#80 | 6.2%(+4.10)#3,866 |
| 81. | Highland Lakes | 10.3% | 7.0%(+3.29)#81 | 6.2%(+4.07)#3,903 |
| 82. | Piedmont | 10.3% | 7.0%(+3.28)#82 | 6.2%(+4.06)#3,913 |
| 83. | Hollins | 10.3% | 7.0%(+3.27)#83 | 6.2%(+4.05)#3,919 |
| 84. | Margaret | 10.3% | 7.0%(+3.26)#84 | 6.2%(+4.03)#3,939 |
| 85. | Owens Cross Roads | 10.2% | 7.0%(+3.18)#85 | 6.2%(+3.96)#4,003 |
| 86. | Cottonwood | 10.2% | 7.0%(+3.18)#86 | 6.2%(+3.95)#4,016 |
| 87. | Alexandria | 10.1% | 7.0%(+3.10)#87 | 6.2%(+3.87)#4,092 |
| 88. | Indian Springs Village | 10.1% | 7.0%(+3.10)#88 | 6.2%(+3.87)#4,094 |
| 89. | Meadowbrook | 10.0% | 7.0%(+3.03)#89 | 6.2%(+3.80)#4,154 |
| 90. | Hartford | 10.0% | 7.0%(+3.02)#90 | 6.2%(+3.79)#4,163 |
| 91. | Madrid | 10.0% | 7.0%(+2.98)#91 | 6.2%(+3.76)#4,208 |
| 92. | Flomaton | 10.0% | 7.0%(+2.96)#92 | 6.2%(+3.74)#4,237 |
| 93. | Gurley | 10.0% | 7.0%(+2.93)#93 | 6.2%(+3.71)#4,260 |
| 94. | Chelsea | 9.9% | 7.0%(+2.93)#94 | 6.2%(+3.70)#4,267 |
| 95. | Hamilton | 9.9% | 7.0%(+2.85)#95 | 6.2%(+3.63)#4,346 |
| 96. | Courtland | 9.8% | 7.0%(+2.82)#96 | 6.2%(+3.60)#4,378 |
| 97. | Glen Allen | 9.8% | 7.0%(+2.81)#97 | 6.2%(+3.59)#4,385 |
| 98. | Guntersville | 9.8% | 7.0%(+2.79)#98 | 6.2%(+3.57)#4,414 |
| 99. | Headland | 9.8% | 7.0%(+2.77)#99 | 6.2%(+3.55)#4,437 |
| 100. | Sterrett | 9.8% | 7.0%(+2.76)#100 | 6.2%(+3.54)#4,447 |
Common Questions
What are the Top 10 Cities with the Highest Percentage of Population Employed in Health Diagnosing & Treating in Alabama?
Top 10 Cities with the Highest Percentage of Population Employed in Health Diagnosing & Treating in Alabama are:
#1
42.1%
#2
42.1%
#3
36.4%
#4
32.3%
#5
26.7%
#6
25.8%
#7
23.6%
#8
23.1%
#9
21.1%
#10
21.1%
What city has the Highest Percentage of Population Employed in Health Diagnosing & Treating in Alabama?
Beatrice has the Highest Percentage of Population Employed in Health Diagnosing & Treating in Alabama with 42.1%.
What is the Percentage of Population Employed in Health Diagnosing & Treating in the State of Alabama?
Percentage of Population Employed in Health Diagnosing & Treating in Alabama is 7.0%.
What is the Percentage of Population Employed in Health Diagnosing & Treating in the United States?
Percentage of Population Employed in Health Diagnosing & Treating in the United States is 6.2%.