Ladera, CA Map & Demographics
Ladera Map
Ladera Overview
$134,707
PER CAPITA INCOME
$250,001
AVG FAMILY INCOME
$190,486
AVG HOUSEHOLD INCOME
0.49
INEQUALITY / GINI INDEX
1,427
TOTAL POPULATION
903
MALE POPULATION
524
FEMALE POPULATION
172.33
MALES / 100 FEMALES
58.03
FEMALES / 100 MALES
58.5
MEDIAN AGE
3.1
AVG FAMILY SIZE
2.6
AVG HOUSEHOLD SIZE
706
LABOR FORCE [ PEOPLE ]
52.2%
PERCENT IN LABOR FORCE
12.9%
UNEMPLOYMENT RATE
Income in Ladera
Income Overview in Ladera
Per Capita Income in Ladera is $134,707, while median incomes of families and households are $250,001 and $190,486 respectively.
| Characteristic | Number | Measure |
| Per Capita Income | 1,427 | $134,707 |
| Median Family Income | 402 | $250,001 |
| Mean Family Income | 402 | $422,858 |
| Median Household Income | 555 | $190,486 |
| Mean Household Income | 555 | $345,294 |
| Income Deficit | 402 | $0 |
| Wage / Income Gap (%) | 1,427 | 0.00% |
| Wage / Income Gap ($) | 1,427 | 100.00¢ per $1 |
| Gini / Inequality Index | 1,427 | 0.49 |
Earnings by Sex in Ladera
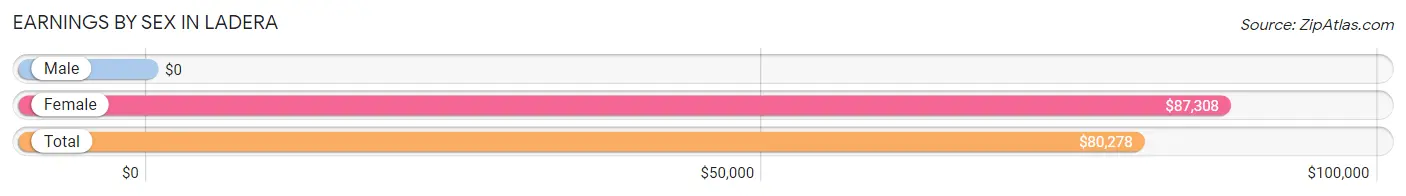
| Sex | Number | Average Earnings |
| Male | 526 (72.1%) | $0 |
| Female | 204 (28.0%) | $87,308 |
| Total | 730 (100.0%) | $80,278 |
Earnings by Sex by Income Bracket in Ladera
The most common earnings brackets in Ladera are $100,000+ for men (235 | 44.7%) and $100,000+ for women (101 | 49.5%).
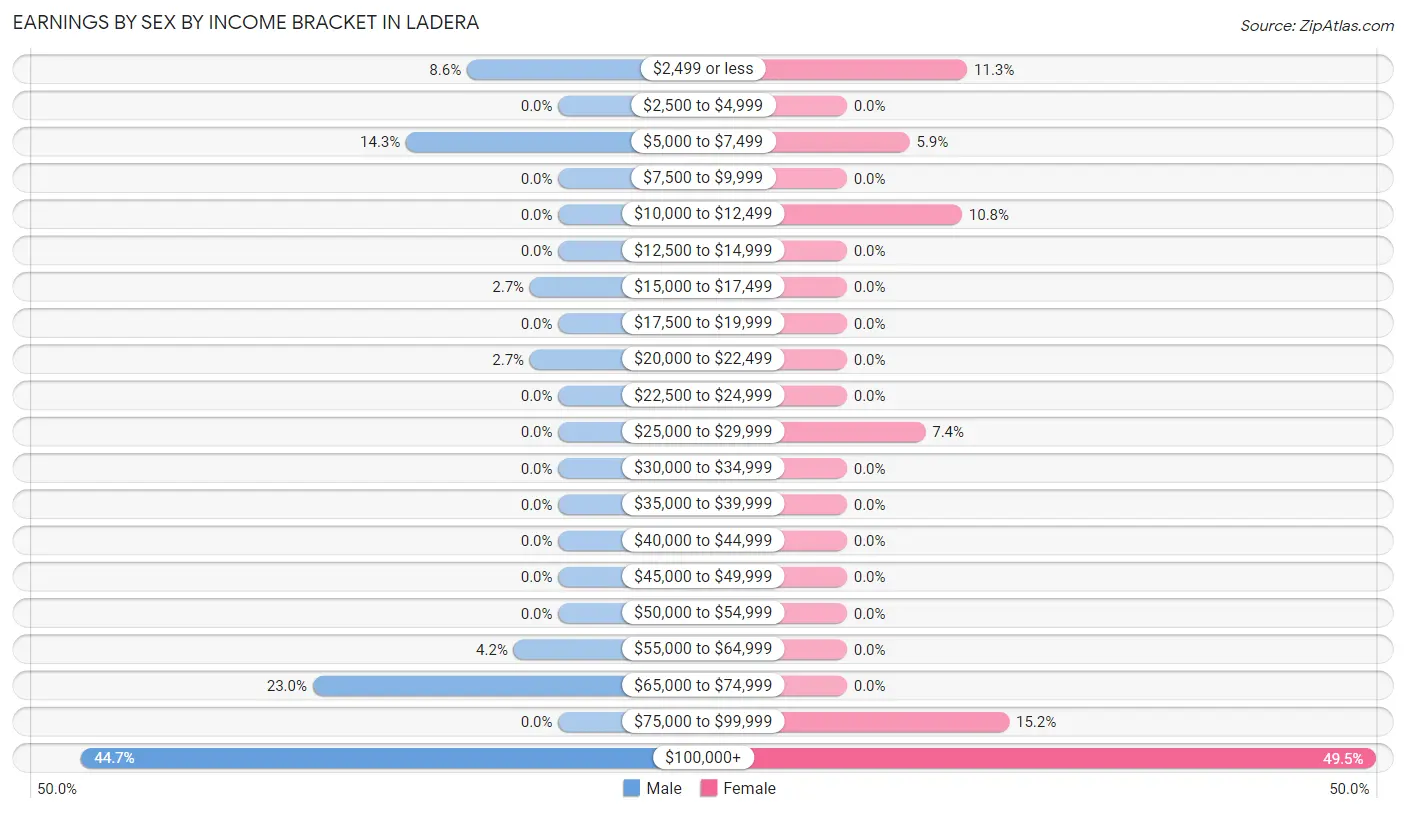
| Income | Male | Female |
| $2,499 or less | 45 (8.6%) | 23 (11.3%) |
| $2,500 to $4,999 | 0 (0.0%) | 0 (0.0%) |
| $5,000 to $7,499 | 75 (14.3%) | 12 (5.9%) |
| $7,500 to $9,999 | 0 (0.0%) | 0 (0.0%) |
| $10,000 to $12,499 | 0 (0.0%) | 22 (10.8%) |
| $12,500 to $14,999 | 0 (0.0%) | 0 (0.0%) |
| $15,000 to $17,499 | 14 (2.7%) | 0 (0.0%) |
| $17,500 to $19,999 | 0 (0.0%) | 0 (0.0%) |
| $20,000 to $22,499 | 14 (2.7%) | 0 (0.0%) |
| $22,500 to $24,999 | 0 (0.0%) | 0 (0.0%) |
| $25,000 to $29,999 | 0 (0.0%) | 15 (7.3%) |
| $30,000 to $34,999 | 0 (0.0%) | 0 (0.0%) |
| $35,000 to $39,999 | 0 (0.0%) | 0 (0.0%) |
| $40,000 to $44,999 | 0 (0.0%) | 0 (0.0%) |
| $45,000 to $49,999 | 0 (0.0%) | 0 (0.0%) |
| $50,000 to $54,999 | 0 (0.0%) | 0 (0.0%) |
| $55,000 to $64,999 | 22 (4.2%) | 0 (0.0%) |
| $65,000 to $74,999 | 121 (23.0%) | 0 (0.0%) |
| $75,000 to $99,999 | 0 (0.0%) | 31 (15.2%) |
| $100,000+ | 235 (44.7%) | 101 (49.5%) |
| Total | 526 (100.0%) | 204 (100.0%) |
Earnings by Sex by Educational Attainment in Ladera
Average earnings in Ladera are $186,310 for men and $118,015 for women, a difference of 36.7%. Men with an educational attainment of bachelor's degree enjoy the highest average annual earnings of $186,726, while those with bachelor's degree education earn the least with $186,726. Women with an educational attainment of graduate degree earn the most with the average annual earnings of $162,083, while those with graduate degree education have the smallest earnings of $162,083.
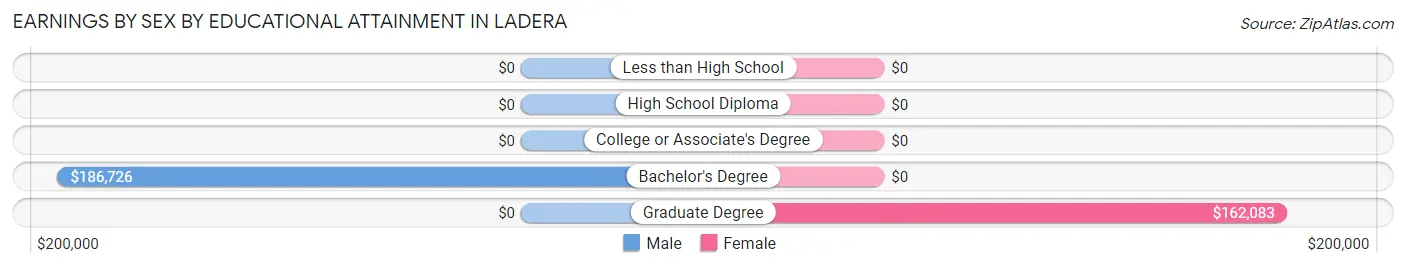
| Educational Attainment | Male Income | Female Income |
| Less than High School | - | - |
| High School Diploma | - | - |
| College or Associate's Degree | - | - |
| Bachelor's Degree | $186,726 | $0 |
| Graduate Degree | - | - |
| Total | $186,310 | $118,015 |
Family Income in Ladera
Family Income Brackets in Ladera
According to the Ladera family income data, there are 254 families falling into the $200,000+ income range, which is the most common income bracket and makes up 63.2% of all families.
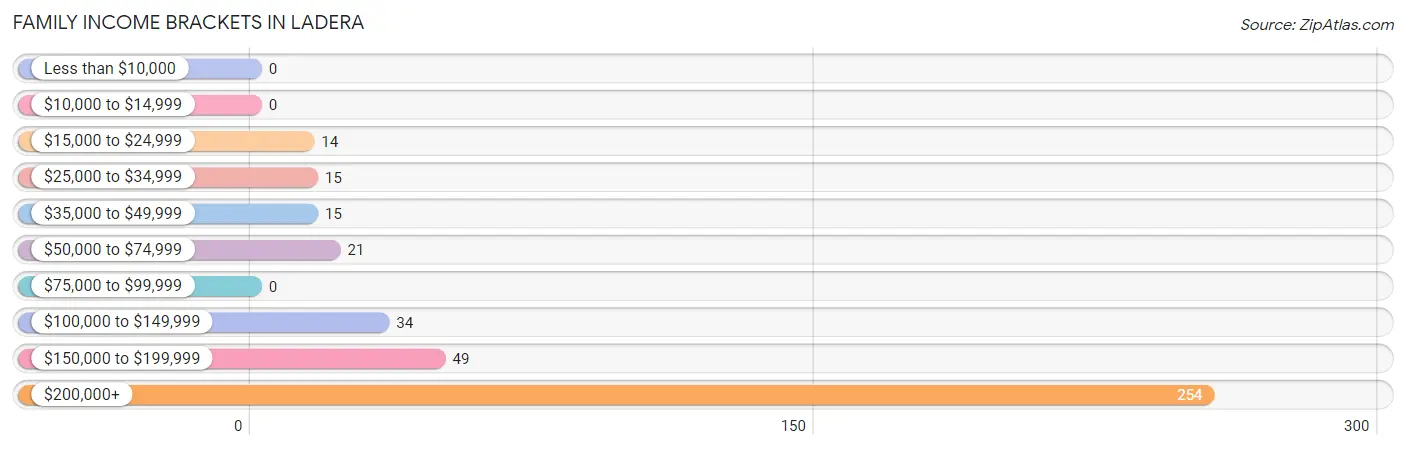
| Income Bracket | # Families | % Families |
| Less than $10,000 | 0 | 0.0% |
| $10,000 to $14,999 | 0 | 0.0% |
| $15,000 to $24,999 | 14 | 3.5% |
| $25,000 to $34,999 | 15 | 3.7% |
| $35,000 to $49,999 | 15 | 3.7% |
| $50,000 to $74,999 | 21 | 5.2% |
| $75,000 to $99,999 | 0 | 0.0% |
| $100,000 to $149,999 | 34 | 8.5% |
| $150,000 to $199,999 | 49 | 12.2% |
| $200,000+ | 254 | 63.2% |
Family Income by Famaliy Size in Ladera
2-person families (194 | 48.3%) account for the highest median family income in Ladera with $250,001 per family, while 2-person families (194 | 48.3%) have the highest median income of $125,000 per family member.
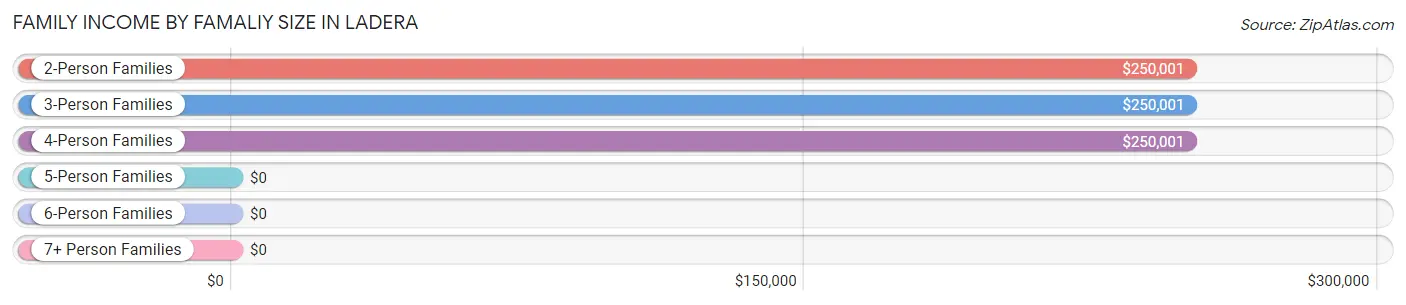
| Income Bracket | # Families | Median Income |
| 2-Person Families | 194 (48.3%) | $250,001 |
| 3-Person Families | 111 (27.6%) | $250,001 |
| 4-Person Families | 91 (22.6%) | $250,001 |
| 5-Person Families | 0 (0.0%) | $0 |
| 6-Person Families | 0 (0.0%) | $0 |
| 7+ Person Families | 6 (1.5%) | $0 |
| Total | 402 (100.0%) | $250,001 |
Family Income by Number of Earners in Ladera
The median family income in Ladera is $250,001, with families comprising no earners (100) having the highest median family income of $250,001, while families with 1 earner (111) have the lowest median family income of $177,578, accounting for 24.9% and 27.6% of families, respectively.
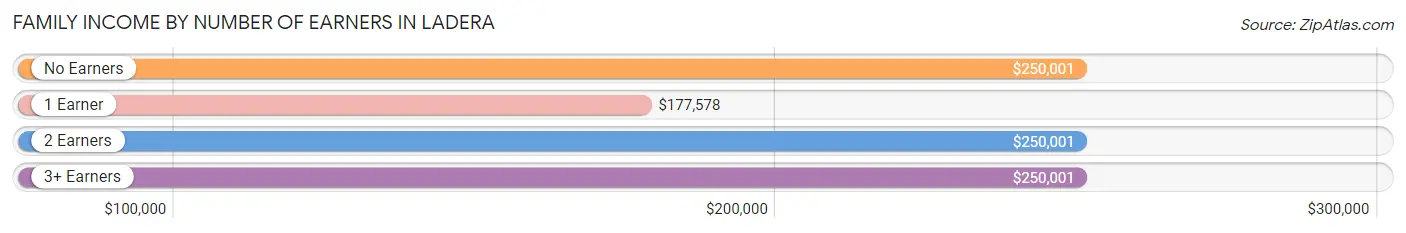
| Number of Earners | # Families | Median Income |
| No Earners | 100 (24.9%) | $250,001 |
| 1 Earner | 111 (27.6%) | $177,578 |
| 2 Earners | 139 (34.6%) | $250,001 |
| 3+ Earners | 52 (12.9%) | $250,001 |
| Total | 402 (100.0%) | $250,001 |
Household Income in Ladera
Household Income Brackets in Ladera
With 263 households falling in the category, the $200,000+ income range is the most frequent in Ladera, accounting for 47.4% of all households.
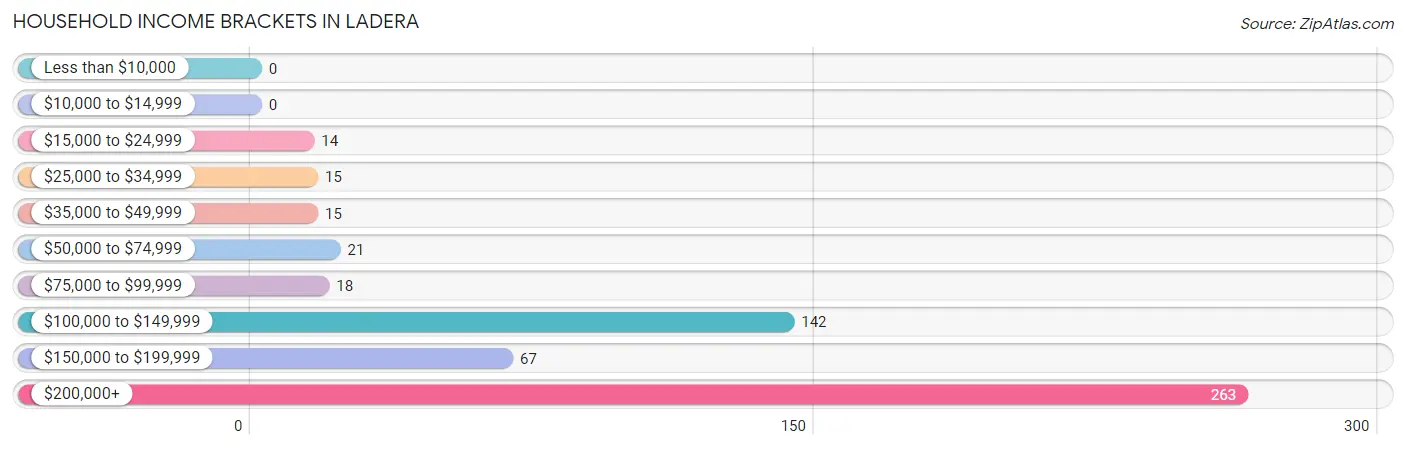
| Income Bracket | # Households | % Households |
| Less than $10,000 | 0 | 0.0% |
| $10,000 to $14,999 | 0 | 0.0% |
| $15,000 to $24,999 | 14 | 2.5% |
| $25,000 to $34,999 | 15 | 2.7% |
| $35,000 to $49,999 | 15 | 2.7% |
| $50,000 to $74,999 | 21 | 3.8% |
| $75,000 to $99,999 | 18 | 3.2% |
| $100,000 to $149,999 | 142 | 25.6% |
| $150,000 to $199,999 | 67 | 12.1% |
| $200,000+ | 263 | 47.4% |
Household Income by Householder Age in Ladera
The median household income in Ladera is $190,486, with the highest median household income of $244,375 found in the 45 to 64 years age bracket for the primary householder. A total of 220 households (39.6%) fall into this category.
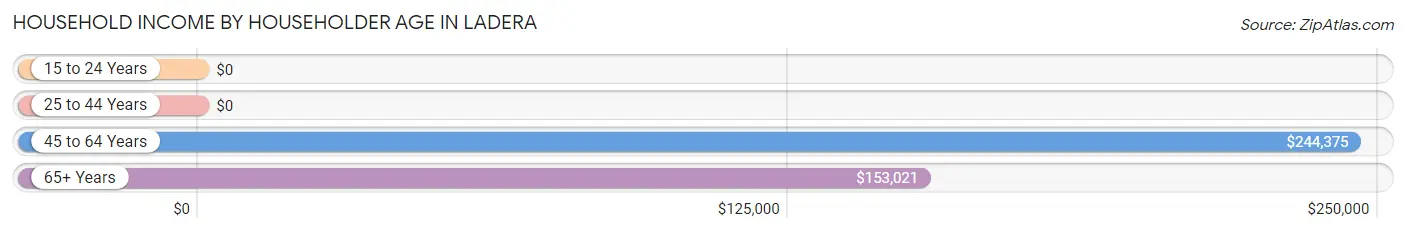
| Income Bracket | # Households | Median Income |
| 15 to 24 Years | 0 (0.0%) | $0 |
| 25 to 44 Years | 28 (5.1%) | $0 |
| 45 to 64 Years | 220 (39.6%) | $244,375 |
| 65+ Years | 307 (55.3%) | $153,021 |
| Total | 555 (100.0%) | $190,486 |
Poverty in Ladera
Income Below Poverty by Sex and Age in Ladera
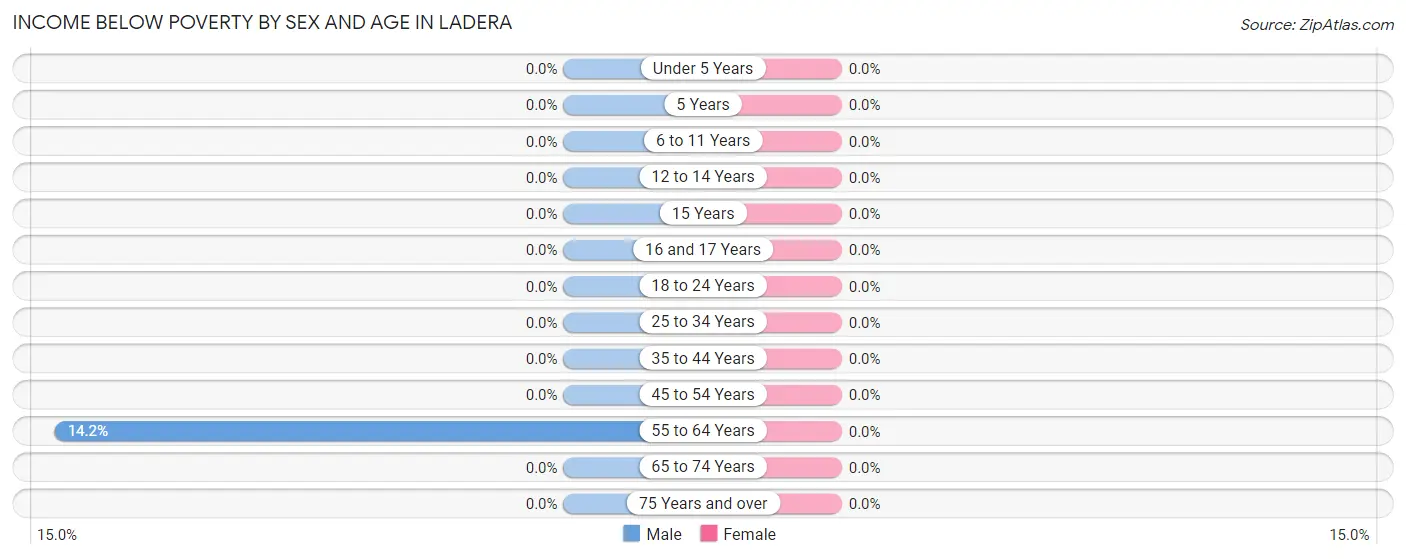
| Age Bracket | Male | Female |
| Under 5 Years | 0 (0.0%) | 0 (0.0%) |
| 5 Years | 0 (0.0%) | 0 (0.0%) |
| 6 to 11 Years | 0 (0.0%) | 0 (0.0%) |
| 12 to 14 Years | 0 (0.0%) | 0 (0.0%) |
| 15 Years | 0 (0.0%) | 0 (0.0%) |
| 16 and 17 Years | 0 (0.0%) | 0 (0.0%) |
| 18 to 24 Years | 0 (0.0%) | 0 (0.0%) |
| 25 to 34 Years | 0 (0.0%) | 0 (0.0%) |
| 35 to 44 Years | 0 (0.0%) | 0 (0.0%) |
| 45 to 54 Years | 0 (0.0%) | 0 (0.0%) |
| 55 to 64 Years | 16 (14.2%) | 0 (0.0%) |
| 65 to 74 Years | 0 (0.0%) | 0 (0.0%) |
| 75 Years and over | 0 (0.0%) | 0 (0.0%) |
| Total | 16 (1.8%) | 0 (0.0%) |
Income Above Poverty by Sex and Age in Ladera
According to the poverty statistics in Ladera, males aged under 5 years and females aged 16 and 17 years are the age groups that are most secure financially, with 100.0% of males and 100.0% of females in these age groups living above the poverty line.
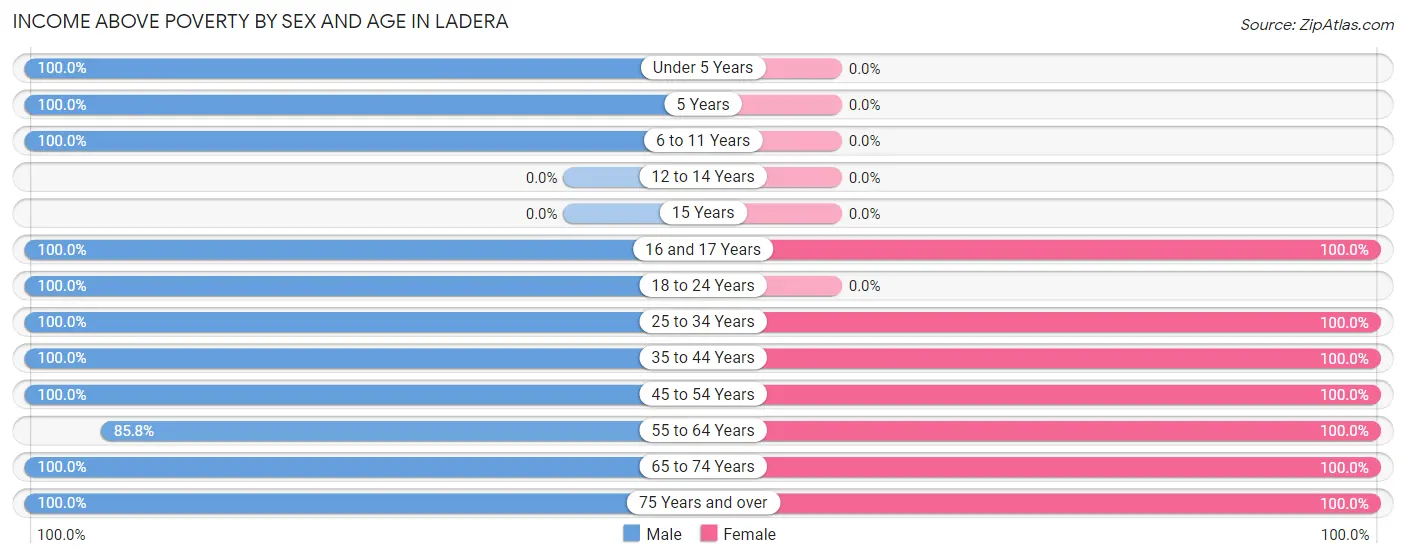
| Age Bracket | Male | Female |
| Under 5 Years | 31 (100.0%) | 0 (0.0%) |
| 5 Years | 6 (100.0%) | 0 (0.0%) |
| 6 to 11 Years | 26 (100.0%) | 0 (0.0%) |
| 12 to 14 Years | 0 (0.0%) | 0 (0.0%) |
| 15 Years | 0 (0.0%) | 0 (0.0%) |
| 16 and 17 Years | 14 (100.0%) | 49 (100.0%) |
| 18 to 24 Years | 227 (100.0%) | 0 (0.0%) |
| 25 to 34 Years | 25 (100.0%) | 46 (100.0%) |
| 35 to 44 Years | 25 (100.0%) | 7 (100.0%) |
| 45 to 54 Years | 95 (100.0%) | 74 (100.0%) |
| 55 to 64 Years | 97 (85.8%) | 188 (100.0%) |
| 65 to 74 Years | 202 (100.0%) | 81 (100.0%) |
| 75 Years and over | 127 (100.0%) | 79 (100.0%) |
| Total | 875 (98.2%) | 524 (100.0%) |
Income Below Poverty Among Married-Couple Families in Ladera
| Children | Above Poverty | Below Poverty |
| No Children | 319 (100.0%) | 0 (0.0%) |
| 1 or 2 Children | 77 (100.0%) | 0 (0.0%) |
| 3 or 4 Children | 6 (100.0%) | 0 (0.0%) |
| 5 or more Children | 0 (0.0%) | 0 (0.0%) |
| Total | 402 (100.0%) | 0 (0.0%) |
Income Below Poverty Among Single-Parent Households in Ladera
| Children | Single Father | Single Mother |
| No Children | 0 (0.0%) | 0 (0.0%) |
| 1 or 2 Children | 0 (0.0%) | 0 (0.0%) |
| 3 or 4 Children | 0 (0.0%) | 0 (0.0%) |
| 5 or more Children | 0 (0.0%) | 0 (0.0%) |
| Total | 0 (0.0%) | 0 (0.0%) |
Income Below Poverty Among Married-Couple vs Single-Parent Households in Ladera
| Children | Married-Couple Families | Single-Parent Households |
| No Children | 0 (0.0%) | 0 (0.0%) |
| 1 or 2 Children | 0 (0.0%) | 0 (0.0%) |
| 3 or 4 Children | 0 (0.0%) | 0 (0.0%) |
| 5 or more Children | 0 (0.0%) | 0 (0.0%) |
| Total | 0 (0.0%) | 0 (0.0%) |
Race in Ladera
The most populous races in Ladera are White / Caucasian (1,232 | 86.3%), Asian (117 | 8.2%), and Two or more Races (78 | 5.5%).

| Race | # Population | % Population |
| Asian | 117 | 8.2% |
| Black / African American | 0 | 0.0% |
| Hawaiian / Pacific | 0 | 0.0% |
| Hispanic or Latino | 18 | 1.3% |
| Native / Alaskan | 0 | 0.0% |
| White / Caucasian | 1,232 | 86.3% |
| Two or more Races | 78 | 5.5% |
| Some other Race | 0 | 0.0% |
| Total | 1,427 | 100.0% |
Ancestry in Ladera
The most populous ancestries reported in Ladera are Irish (488 | 34.2%), English (244 | 17.1%), German (234 | 16.4%), Thai (157 | 11.0%), and French (120 | 8.4%), together accounting for 87.1% of all Ladera residents.
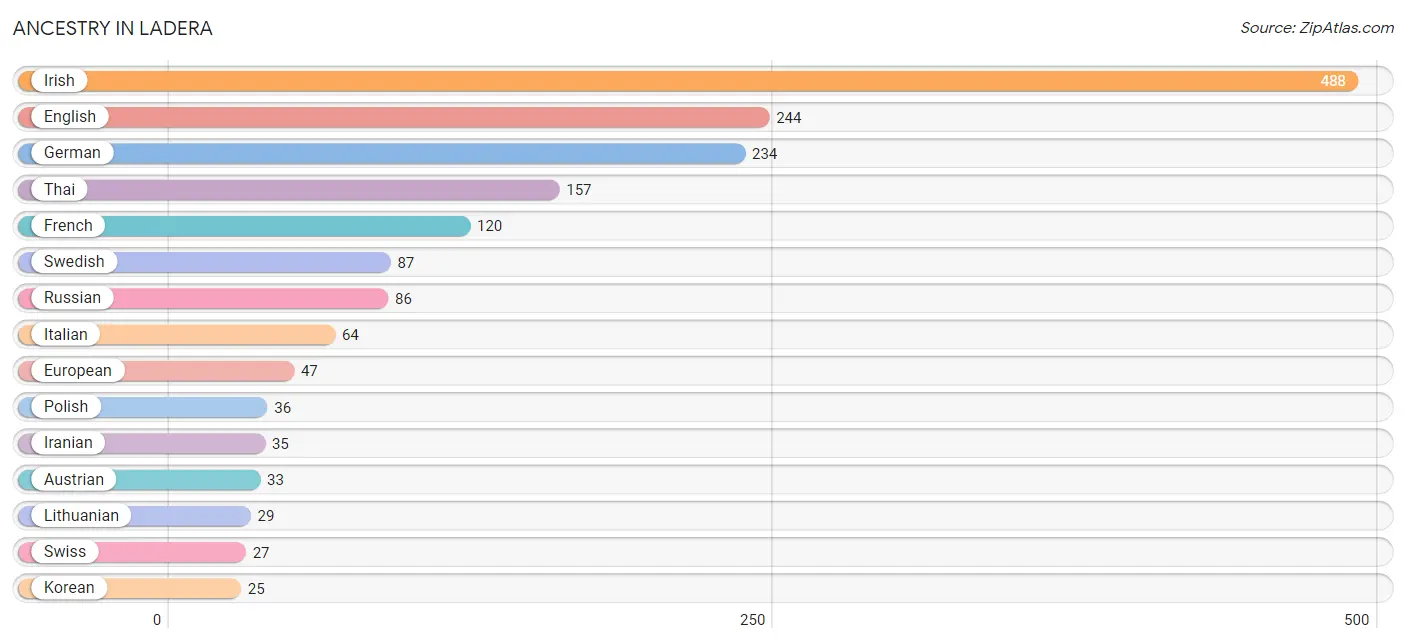
| Ancestry | # Population | % Population |
| American | 24 | 1.7% |
| Austrian | 33 | 2.3% |
| British | 14 | 1.0% |
| Danish | 12 | 0.8% |
| Eastern European | 20 | 1.4% |
| English | 244 | 17.1% |
| European | 47 | 3.3% |
| French | 120 | 8.4% |
| German | 234 | 16.4% |
| Indian (Asian) | 13 | 0.9% |
| Iranian | 35 | 2.5% |
| Irish | 488 | 34.2% |
| Italian | 64 | 4.5% |
| Korean | 25 | 1.8% |
| Lithuanian | 29 | 2.0% |
| Polish | 36 | 2.5% |
| Russian | 86 | 6.0% |
| Scandinavian | 16 | 1.1% |
| Scotch-Irish | 11 | 0.8% |
| Spaniard | 18 | 1.3% |
| Swedish | 87 | 6.1% |
| Swiss | 27 | 1.9% |
| Thai | 157 | 11.0% | View All 23 Rows |
Immigrants in Ladera
The most numerous immigrant groups reported in Ladera came from Asia (152 | 10.6%), South Central Asia (114 | 8.0%), India (79 | 5.5%), Iran (35 | 2.5%), and Philippines (25 | 1.8%), together accounting for 28.4% of all Ladera residents.
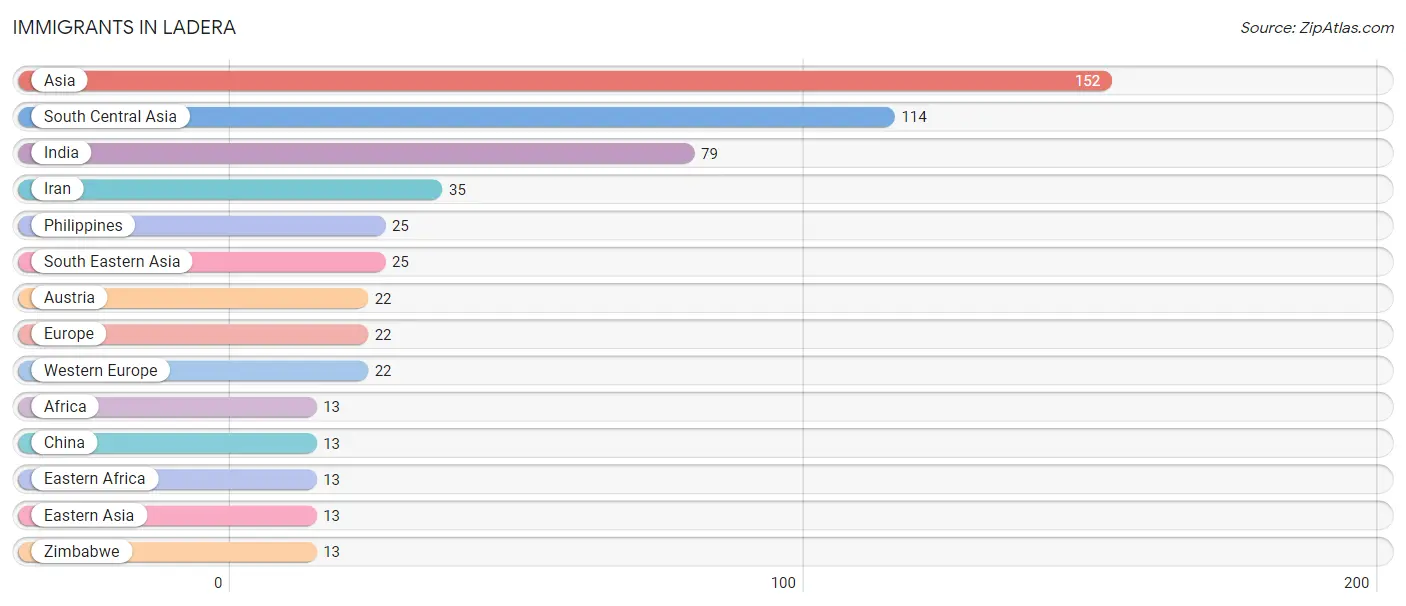
| Immigration Origin | # Population | % Population |
| Africa | 13 | 0.9% |
| Asia | 152 | 10.6% |
| Austria | 22 | 1.5% |
| China | 13 | 0.9% |
| Eastern Africa | 13 | 0.9% |
| Eastern Asia | 13 | 0.9% |
| Europe | 22 | 1.5% |
| India | 79 | 5.5% |
| Iran | 35 | 2.5% |
| Philippines | 25 | 1.8% |
| South Central Asia | 114 | 8.0% |
| South Eastern Asia | 25 | 1.8% |
| Western Europe | 22 | 1.5% |
| Zimbabwe | 13 | 0.9% | View All 14 Rows |
Sex and Age in Ladera
Sex and Age in Ladera
The most populous age groups in Ladera are 20 to 24 Years (196 | 21.7%) for men and 60 to 64 Years (99 | 18.9%) for women.
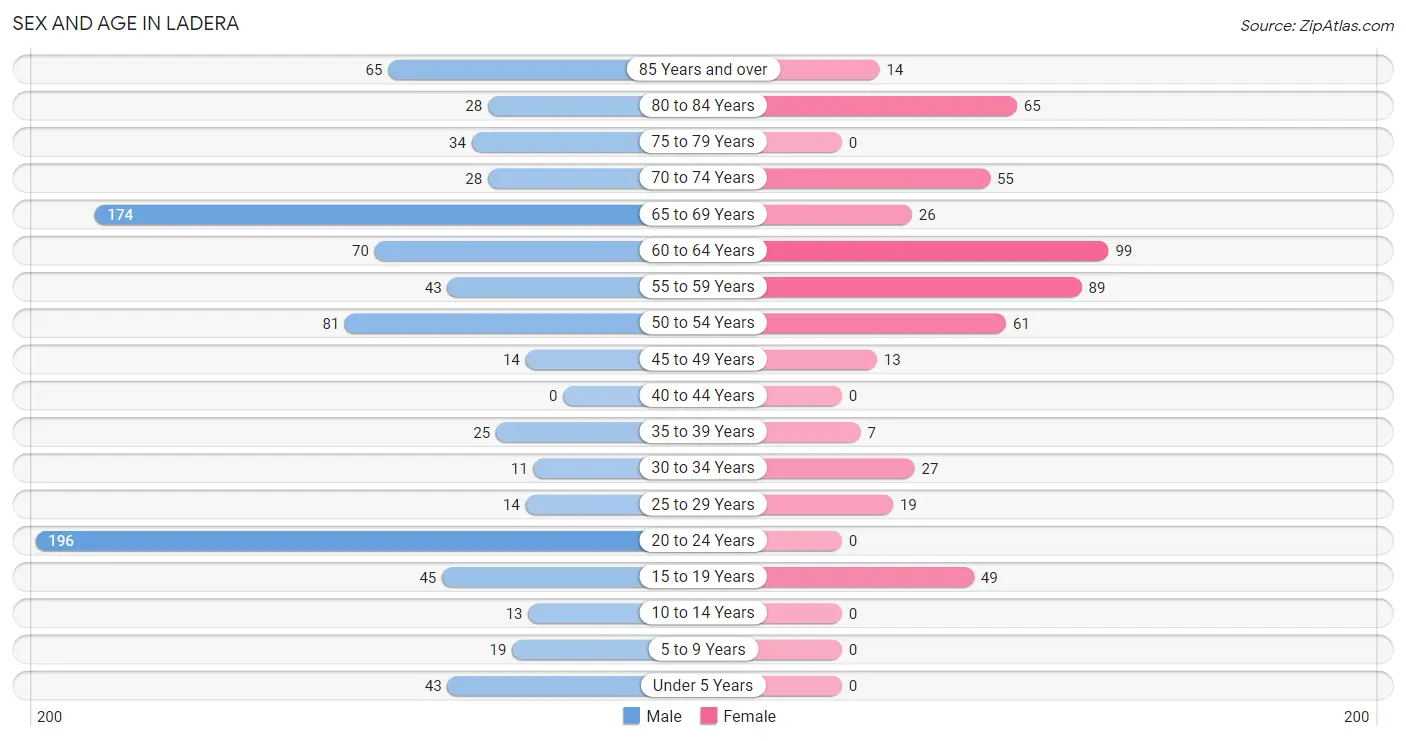
| Age Bracket | Male | Female |
| Under 5 Years | 43 (4.8%) | 0 (0.0%) |
| 5 to 9 Years | 19 (2.1%) | 0 (0.0%) |
| 10 to 14 Years | 13 (1.4%) | 0 (0.0%) |
| 15 to 19 Years | 45 (5.0%) | 49 (9.3%) |
| 20 to 24 Years | 196 (21.7%) | 0 (0.0%) |
| 25 to 29 Years | 14 (1.5%) | 19 (3.6%) |
| 30 to 34 Years | 11 (1.2%) | 27 (5.1%) |
| 35 to 39 Years | 25 (2.8%) | 7 (1.3%) |
| 40 to 44 Years | 0 (0.0%) | 0 (0.0%) |
| 45 to 49 Years | 14 (1.5%) | 13 (2.5%) |
| 50 to 54 Years | 81 (9.0%) | 61 (11.6%) |
| 55 to 59 Years | 43 (4.8%) | 89 (17.0%) |
| 60 to 64 Years | 70 (7.7%) | 99 (18.9%) |
| 65 to 69 Years | 174 (19.3%) | 26 (5.0%) |
| 70 to 74 Years | 28 (3.1%) | 55 (10.5%) |
| 75 to 79 Years | 34 (3.8%) | 0 (0.0%) |
| 80 to 84 Years | 28 (3.1%) | 65 (12.4%) |
| 85 Years and over | 65 (7.2%) | 14 (2.7%) |
| Total | 903 (100.0%) | 524 (100.0%) |
Families and Households in Ladera
Median Family Size in Ladera
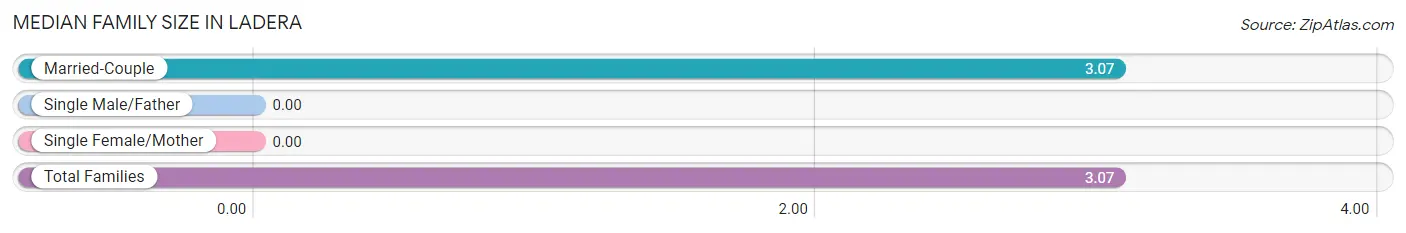
| Family Type | # Families | Family Size |
| Married-Couple | 402 (100.0%) | 3.07 |
| Single Male/Father | 0 (0.0%) | - |
| Single Female/Mother | 0 (0.0%) | - |
| Total Families | 402 (100.0%) | 3.07 |
Median Household Size in Ladera
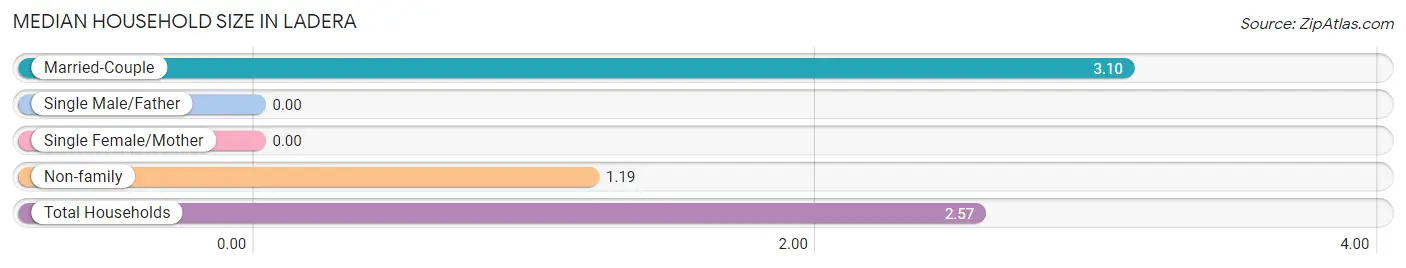
| Household Type | # Households | Household Size |
| Married-Couple | 402 (72.4%) | 3.10 |
| Single Male/Father | 0 (0.0%) | - |
| Single Female/Mother | 0 (0.0%) | - |
| Non-family | 153 (27.6%) | 1.19 |
| Total Households | 555 (100.0%) | 2.57 |
Household Size by Marriage Status in Ladera
Out of a total of 555 households in Ladera, 402 (72.4%) are family households, while 153 (27.6%) are nonfamily households. The most numerous type of family households are 2-person households, comprising 194, and the most common type of nonfamily households are 1-person households, comprising 126.
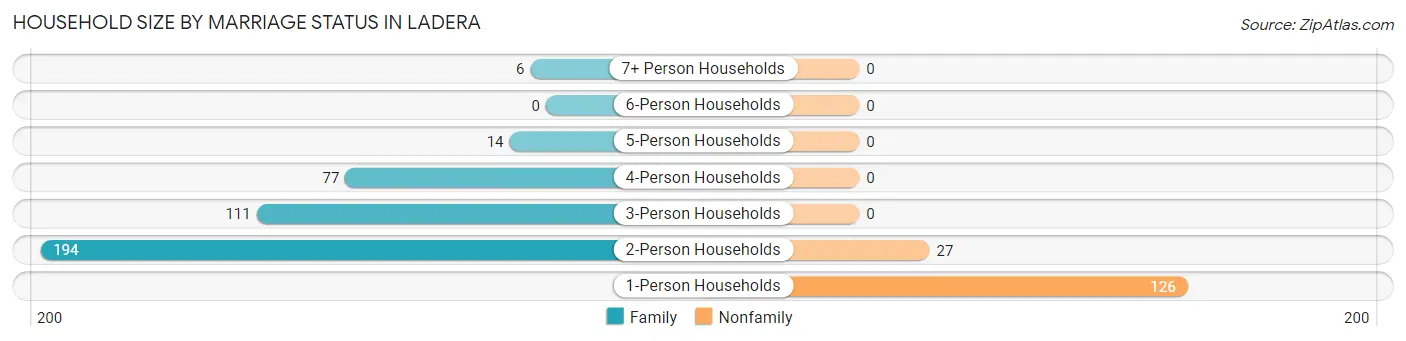
| Household Size | Family Households | Nonfamily Households |
| 1-Person Households | - | 126 (22.7%) |
| 2-Person Households | 194 (34.9%) | 27 (4.9%) |
| 3-Person Households | 111 (20.0%) | 0 (0.0%) |
| 4-Person Households | 77 (13.9%) | 0 (0.0%) |
| 5-Person Households | 14 (2.5%) | 0 (0.0%) |
| 6-Person Households | 0 (0.0%) | 0 (0.0%) |
| 7+ Person Households | 6 (1.1%) | 0 (0.0%) |
| Total | 402 (72.4%) | 153 (27.6%) |
Female Fertility in Ladera
Fertility by Age in Ladera
Average fertility rate in Ladera is 87.0 births per 1,000 women. Women in the age bracket of 20 to 34 years have the highest fertility rate with 217.0 births per 1,000 women. Women in the age bracket of 20 to 34 years acount for 100.0% of all women with births.
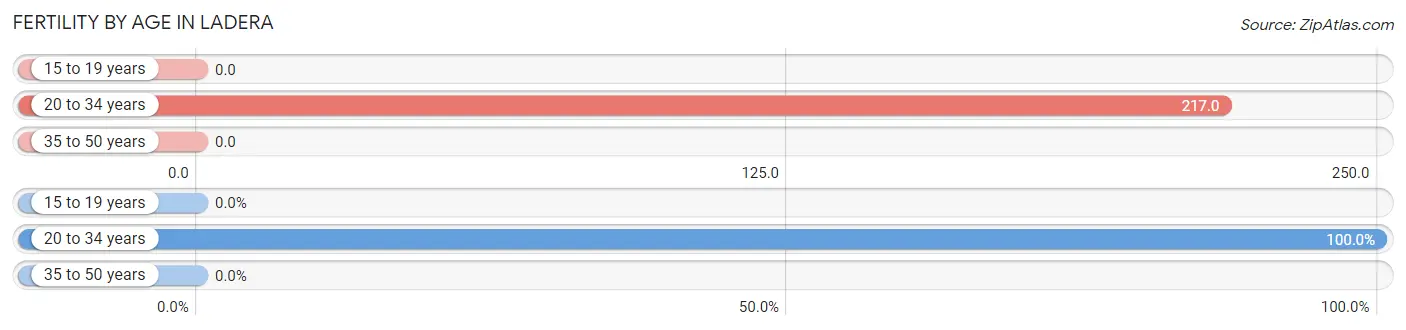
| Age Bracket | Women with Births | Births / 1,000 Women |
| 15 to 19 years | 0 (0.0%) | 0.0 |
| 20 to 34 years | 10 (100.0%) | 217.0 |
| 35 to 50 years | 0 (0.0%) | 0.0 |
| Total | 10 (100.0%) | 87.0 |
Fertility by Age by Marriage Status in Ladera
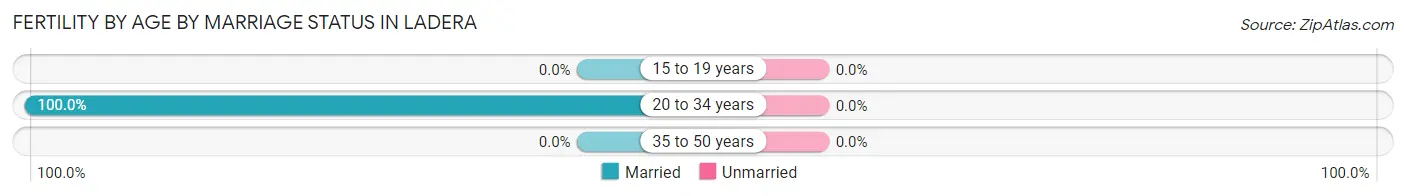
| Age Bracket | Married | Unmarried |
| 15 to 19 years | 0 (0.0%) | 0 (0.0%) |
| 20 to 34 years | 10 (100.0%) | 0 (0.0%) |
| 35 to 50 years | 0 (0.0%) | 0 (0.0%) |
| Total | 10 (100.0%) | 0 (0.0%) |
Fertility by Education in Ladera
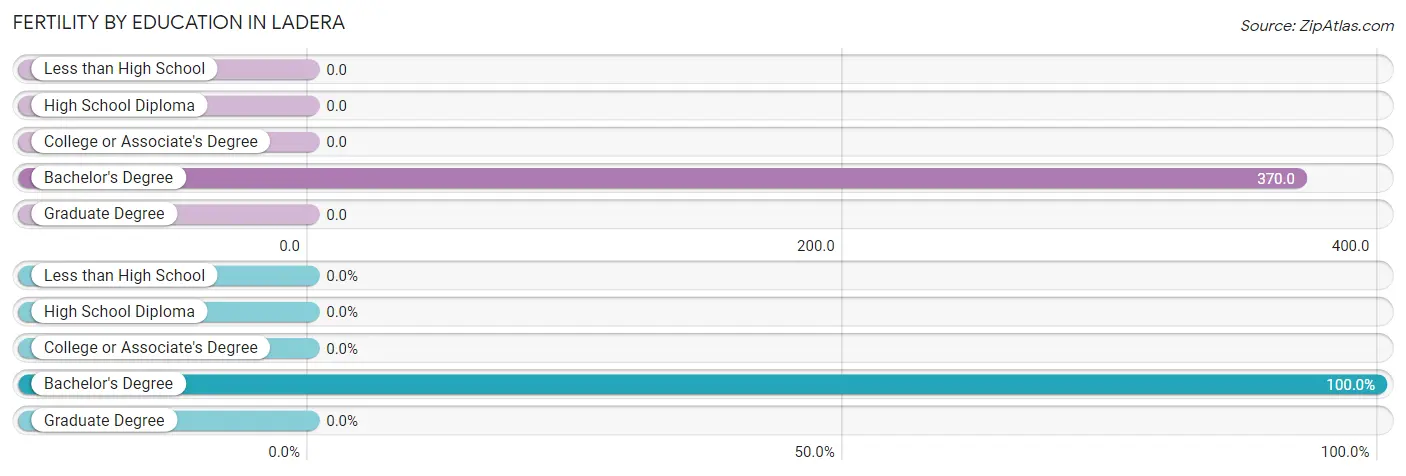
| Educational Attainment | Women with Births | Births / 1,000 Women |
| Less than High School | 0 (0.0%) | 0.0 |
| High School Diploma | 0 (0.0%) | 0.0 |
| College or Associate's Degree | 0 (0.0%) | 0.0 |
| Bachelor's Degree | 10 (100.0%) | 370.0 |
| Graduate Degree | 0 (0.0%) | 0.0 |
| Total | 10 (100.0%) | 87.0 |
Fertility by Education by Marriage Status in Ladera
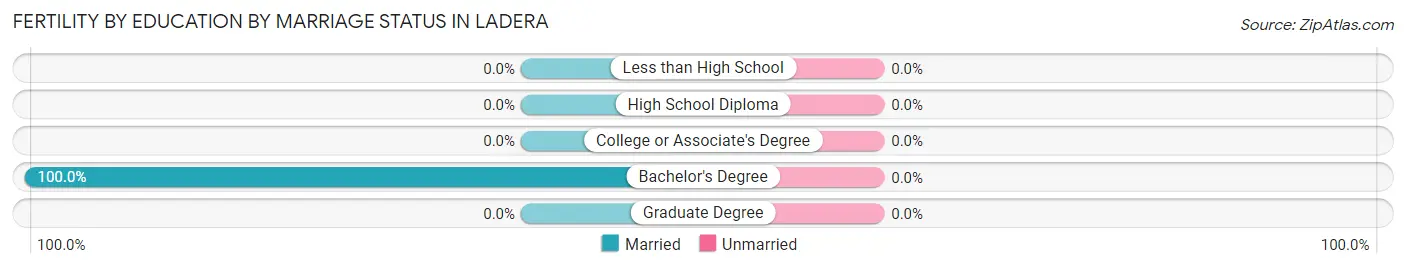
| Educational Attainment | Married | Unmarried |
| Less than High School | 0 (0.0%) | 0 (0.0%) |
| High School Diploma | 0 (0.0%) | 0 (0.0%) |
| College or Associate's Degree | 0 (0.0%) | 0 (0.0%) |
| Bachelor's Degree | 10 (100.0%) | 0 (0.0%) |
| Graduate Degree | 0 (0.0%) | 0 (0.0%) |
| Total | 10 (100.0%) | 0 (0.0%) |
Employment Characteristics in Ladera
Employment by Class of Employer in Ladera
Among the 615 employed individuals in Ladera, private company employees (342 | 55.6%), not-for-profit organizations (199 | 32.4%), and self-employed (not incorporated) (35 | 5.7%) make up the most common classes of employment.
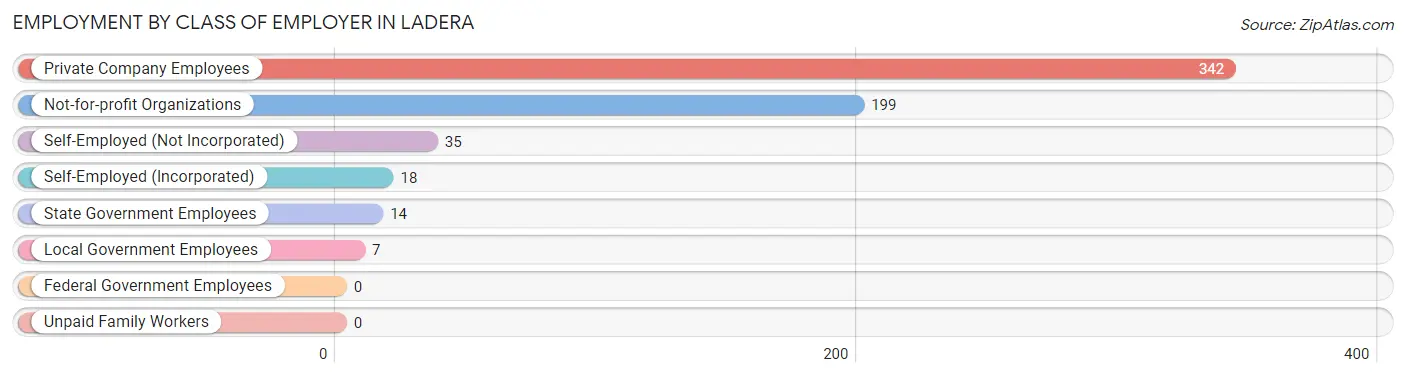
| Employer Class | # Employees | % Employees |
| Private Company Employees | 342 | 55.6% |
| Self-Employed (Incorporated) | 18 | 2.9% |
| Self-Employed (Not Incorporated) | 35 | 5.7% |
| Not-for-profit Organizations | 199 | 32.4% |
| Local Government Employees | 7 | 1.1% |
| State Government Employees | 14 | 2.3% |
| Federal Government Employees | 0 | 0.0% |
| Unpaid Family Workers | 0 | 0.0% |
| Total | 615 | 100.0% |
Employment Status by Age in Ladera
According to the labor force statistics for Ladera, out of the total population over 16 years of age (1,352), 52.2% or 706 individuals are in the labor force, with 12.9% or 91 of them unemployed. The age group with the highest labor force participation rate is 30 to 34 years, with 100.0% or 38 individuals in the labor force. Within the labor force, the 16 to 19 years age range has the highest percentage of unemployed individuals, with 100.0% or 23 of them being unemployed.
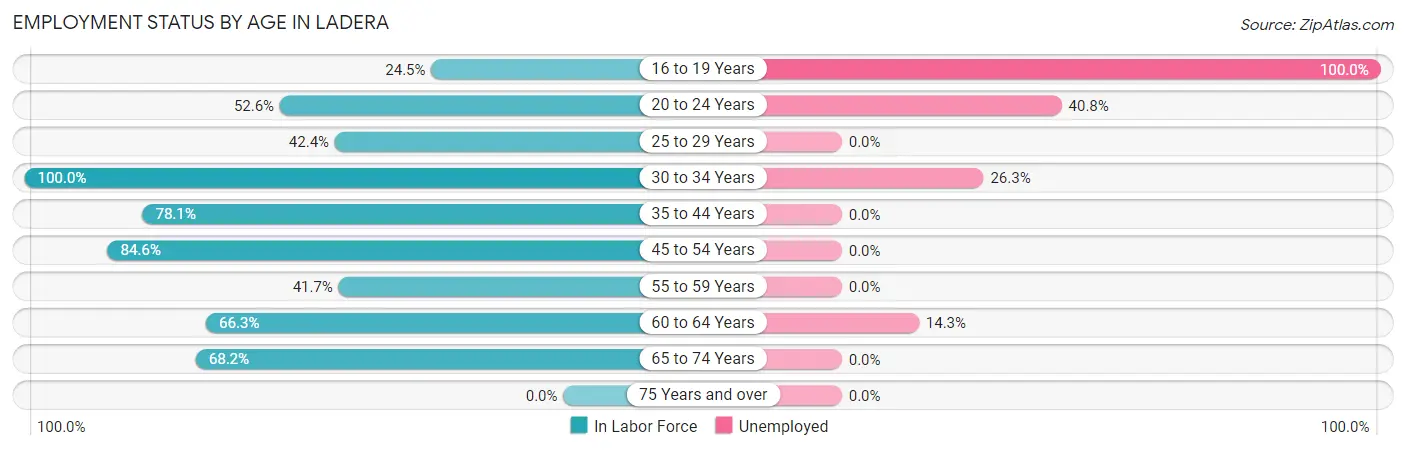
| Age Bracket | In Labor Force | Unemployed |
| 16 to 19 Years | 23 (24.5%) | 23 (100.0%) |
| 20 to 24 Years | 103 (52.6%) | 42 (40.8%) |
| 25 to 29 Years | 14 (42.4%) | 0 (0.0%) |
| 30 to 34 Years | 38 (100.0%) | 10 (26.3%) |
| 35 to 44 Years | 25 (78.1%) | 0 (0.0%) |
| 45 to 54 Years | 143 (84.6%) | 0 (0.0%) |
| 55 to 59 Years | 55 (41.7%) | 0 (0.0%) |
| 60 to 64 Years | 112 (66.3%) | 16 (14.3%) |
| 65 to 74 Years | 193 (68.2%) | 0 (0.0%) |
| 75 Years and over | 0 (0.0%) | 0 (0.0%) |
| Total | 706 (52.2%) | 91 (12.9%) |
Employment Status by Educational Attainment in Ladera
According to labor force statistics for Ladera, 67.5% of individuals (387) out of the total population between 25 and 64 years of age (573) are in the labor force, with 6.7% or 26 of them being unemployed. The group with the highest labor force participation rate are those with the educational attainment of high school diploma, with 100.0% or 30 individuals in the labor force. Within the labor force, individuals with high school diploma education have the highest percentage of unemployment, with 53.3% or 16 of them being unemployed.
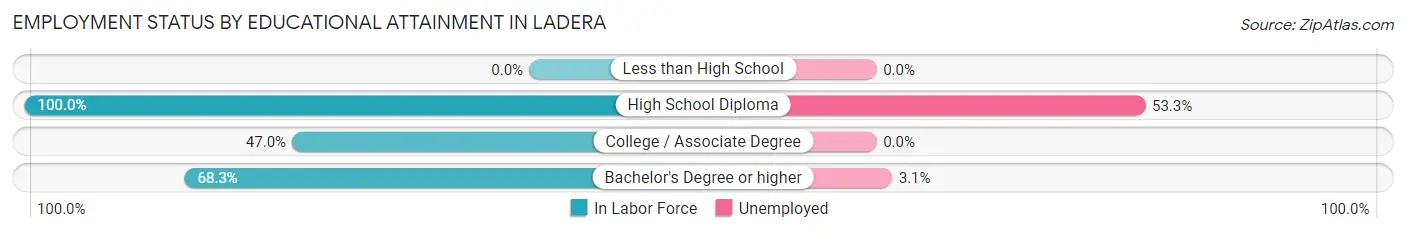
| Educational Attainment | In Labor Force | Unemployed |
| Less than High School | 0 (0.0%) | 0 (0.0%) |
| High School Diploma | 30 (100.0%) | 16 (53.3%) |
| College / Associate Degree | 31 (47.0%) | 0 (0.0%) |
| Bachelor's Degree or higher | 326 (68.3%) | 15 (3.1%) |
| Total | 387 (67.5%) | 38 (6.7%) |
Employment Occupations by Sex in Ladera
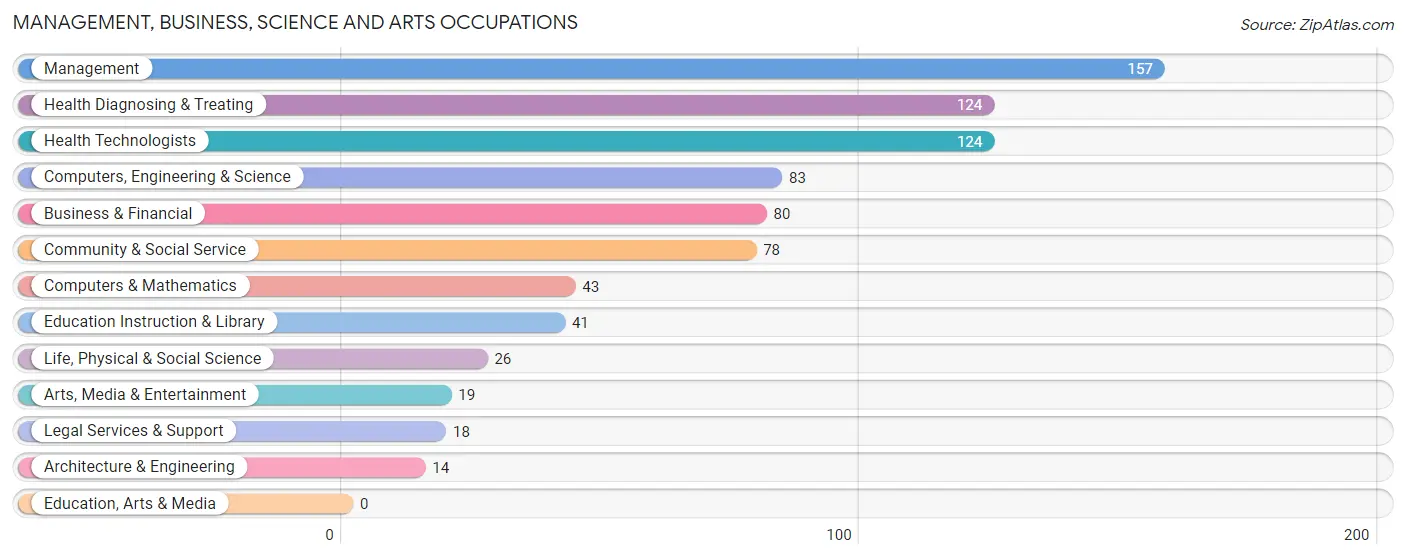
Management, Business, Science and Arts Occupations
The most common Management, Business, Science and Arts occupations in Ladera are Management (157 | 25.5%), Health Diagnosing & Treating (124 | 20.2%), Health Technologists (124 | 20.2%), Computers, Engineering & Science (83 | 13.5%), and Business & Financial (80 | 13.0%).
Management, Business, Science and Arts Occupations by Sex
Within the Management, Business, Science and Arts occupations in Ladera, the most male-oriented occupations are Architecture & Engineering (100.0%), Arts, Media & Entertainment (100.0%), and Health Diagnosing & Treating (91.1%), while the most female-oriented occupations are Legal Services & Support (100.0%), Education Instruction & Library (70.7%), and Community & Social Service (60.3%).
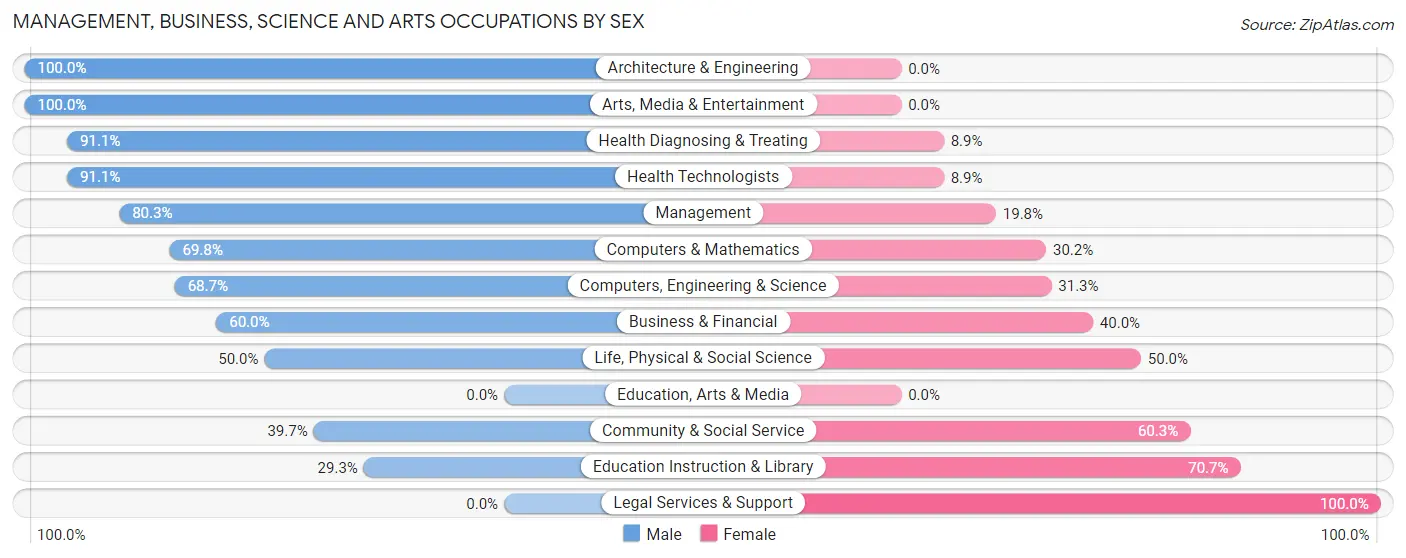
| Occupation | Male | Female |
| Management | 126 (80.2%) | 31 (19.8%) |
| Business & Financial | 48 (60.0%) | 32 (40.0%) |
| Computers, Engineering & Science | 57 (68.7%) | 26 (31.3%) |
| Computers & Mathematics | 30 (69.8%) | 13 (30.2%) |
| Architecture & Engineering | 14 (100.0%) | 0 (0.0%) |
| Life, Physical & Social Science | 13 (50.0%) | 13 (50.0%) |
| Community & Social Service | 31 (39.7%) | 47 (60.3%) |
| Education, Arts & Media | 0 (0.0%) | 0 (0.0%) |
| Legal Services & Support | 0 (0.0%) | 18 (100.0%) |
| Education Instruction & Library | 12 (29.3%) | 29 (70.7%) |
| Arts, Media & Entertainment | 19 (100.0%) | 0 (0.0%) |
| Health Diagnosing & Treating | 113 (91.1%) | 11 (8.9%) |
| Health Technologists | 113 (91.1%) | 11 (8.9%) |
| Total (Category) | 375 (71.8%) | 147 (28.2%) |
| Total (Overall) | 446 (72.5%) | 169 (27.5%) |
Services Occupations
Services Occupations by Sex
| Occupation | Male | Female |
| Healthcare Support | 0 (0.0%) | 0 (0.0%) |
| Security & Protection | 0 (0.0%) | 0 (0.0%) |
| Firefighting & Prevention | 0 (0.0%) | 0 (0.0%) |
| Law Enforcement | 0 (0.0%) | 0 (0.0%) |
| Food Preparation & Serving | 0 (0.0%) | 0 (0.0%) |
| Cleaning & Maintenance | 0 (0.0%) | 0 (0.0%) |
| Personal Care & Service | 0 (0.0%) | 0 (0.0%) |
| Total (Category) | 0 (0.0%) | 0 (0.0%) |
| Total (Overall) | 446 (72.5%) | 169 (27.5%) |
Sales and Office Occupations
The most common Sales and Office occupations in Ladera are Office & Administration (36 | 5.9%), and Sales & Related (30 | 4.9%).
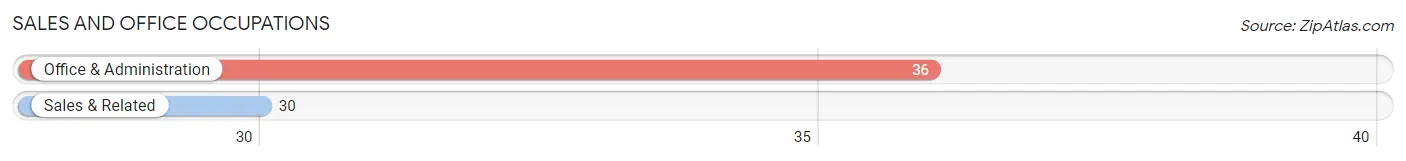
Sales and Office Occupations by Sex

| Occupation | Male | Female |
| Sales & Related | 30 (100.0%) | 0 (0.0%) |
| Office & Administration | 14 (38.9%) | 22 (61.1%) |
| Total (Category) | 44 (66.7%) | 22 (33.3%) |
| Total (Overall) | 446 (72.5%) | 169 (27.5%) |
Natural Resources, Construction and Maintenance Occupations
The most common Natural Resources, Construction and Maintenance occupations in Ladera are , and Construction & Extraction (13 | 2.1%).
Natural Resources, Construction and Maintenance Occupations by Sex
| Occupation | Male | Female |
| Farming, Fishing & Forestry | 0 (0.0%) | 0 (0.0%) |
| Construction & Extraction | 13 (100.0%) | 0 (0.0%) |
| Installation, Maintenance & Repair | 0 (0.0%) | 0 (0.0%) |
| Total (Category) | 13 (100.0%) | 0 (0.0%) |
| Total (Overall) | 446 (72.5%) | 169 (27.5%) |
Production, Transportation and Moving Occupations
The most common Production, Transportation and Moving occupations in Ladera are , and Material Moving (14 | 2.3%).
Production, Transportation and Moving Occupations by Sex
| Occupation | Male | Female |
| Production | 0 (0.0%) | 0 (0.0%) |
| Transportation | 0 (0.0%) | 0 (0.0%) |
| Material Moving | 14 (100.0%) | 0 (0.0%) |
| Total (Category) | 14 (100.0%) | 0 (0.0%) |
| Total (Overall) | 446 (72.5%) | 169 (27.5%) |
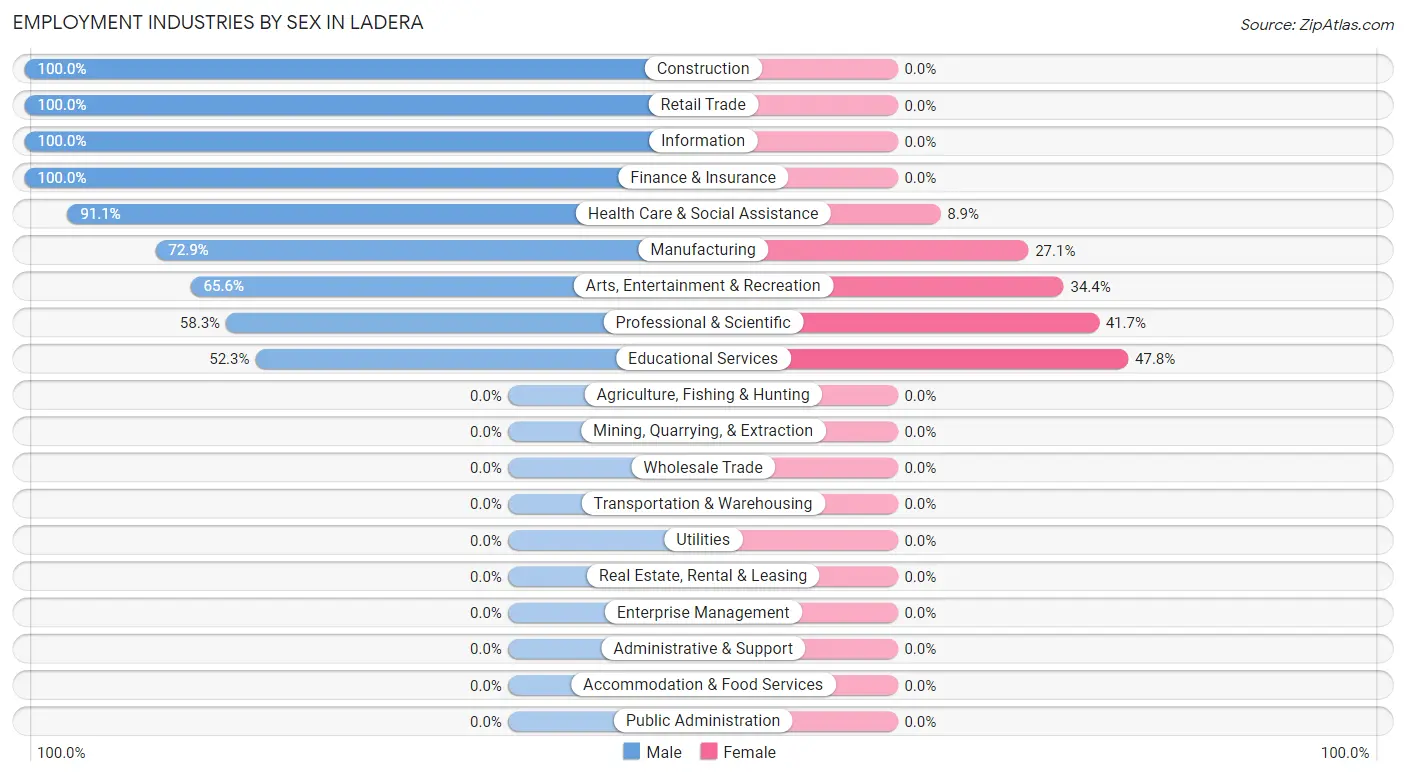
Employment Industries by Sex in Ladera
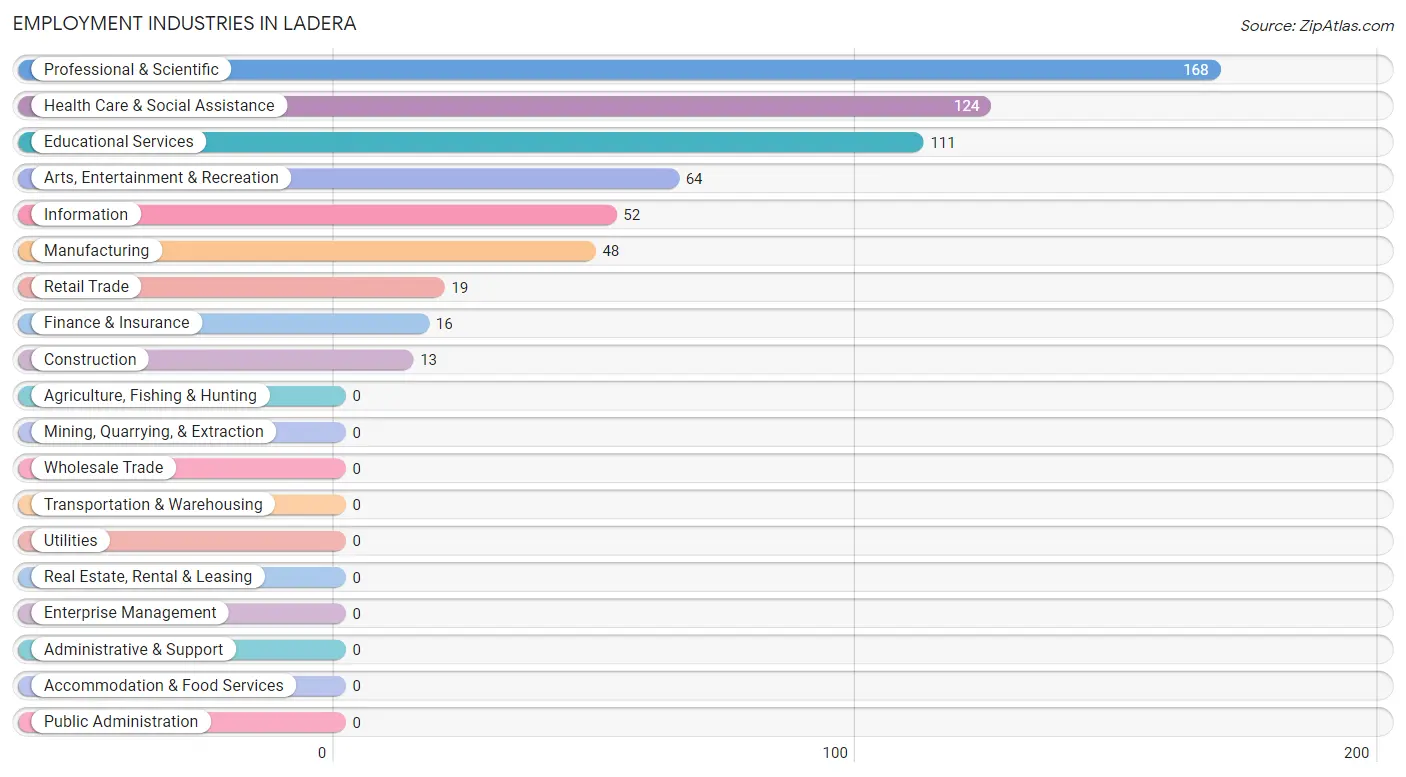
Employment Industries in Ladera
The major employment industries in Ladera include Professional & Scientific (168 | 27.3%), Health Care & Social Assistance (124 | 20.2%), Educational Services (111 | 18.0%), Arts, Entertainment & Recreation (64 | 10.4%), and Information (52 | 8.5%).
Employment Industries by Sex in Ladera
The Ladera industries that see more men than women are Construction (100.0%), Retail Trade (100.0%), and Information (100.0%), whereas the industries that tend to have a higher number of women are Educational Services (47.7%), Professional & Scientific (41.7%), and Arts, Entertainment & Recreation (34.4%).
| Industry | Male | Female |
| Agriculture, Fishing & Hunting | 0 (0.0%) | 0 (0.0%) |
| Mining, Quarrying, & Extraction | 0 (0.0%) | 0 (0.0%) |
| Construction | 13 (100.0%) | 0 (0.0%) |
| Manufacturing | 35 (72.9%) | 13 (27.1%) |
| Wholesale Trade | 0 (0.0%) | 0 (0.0%) |
| Retail Trade | 19 (100.0%) | 0 (0.0%) |
| Transportation & Warehousing | 0 (0.0%) | 0 (0.0%) |
| Utilities | 0 (0.0%) | 0 (0.0%) |
| Information | 52 (100.0%) | 0 (0.0%) |
| Finance & Insurance | 16 (100.0%) | 0 (0.0%) |
| Real Estate, Rental & Leasing | 0 (0.0%) | 0 (0.0%) |
| Professional & Scientific | 98 (58.3%) | 70 (41.7%) |
| Enterprise Management | 0 (0.0%) | 0 (0.0%) |
| Administrative & Support | 0 (0.0%) | 0 (0.0%) |
| Educational Services | 58 (52.2%) | 53 (47.7%) |
| Health Care & Social Assistance | 113 (91.1%) | 11 (8.9%) |
| Arts, Entertainment & Recreation | 42 (65.6%) | 22 (34.4%) |
| Accommodation & Food Services | 0 (0.0%) | 0 (0.0%) |
| Public Administration | 0 (0.0%) | 0 (0.0%) |
| Total | 446 (72.5%) | 169 (27.5%) |
Education in Ladera
School Enrollment in Ladera
The most common levels of schooling among the 319 students in Ladera are college / undergraduate (181 | 56.7%), high school (63 | 19.8%), and graduate / professional (33 | 10.3%).
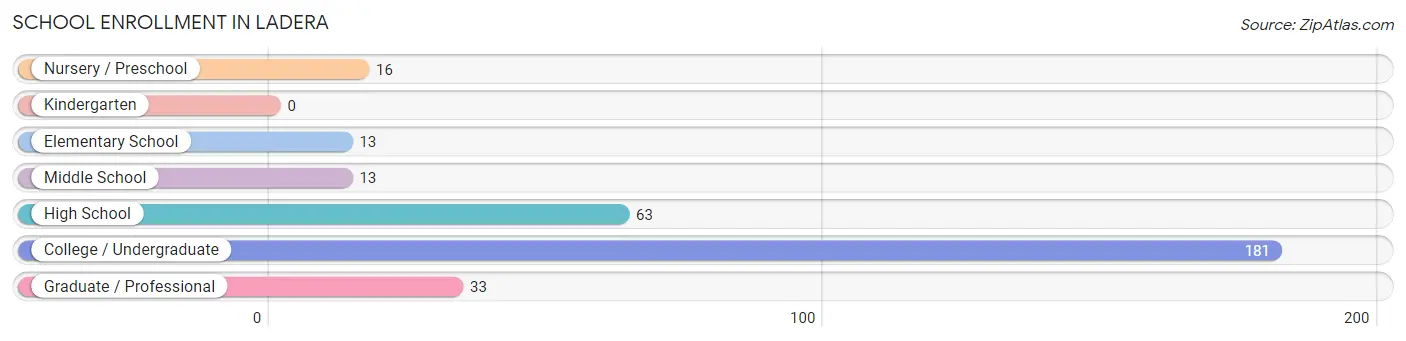
| School Level | # Students | % Students |
| Nursery / Preschool | 16 | 5.0% |
| Kindergarten | 0 | 0.0% |
| Elementary School | 13 | 4.1% |
| Middle School | 13 | 4.1% |
| High School | 63 | 19.8% |
| College / Undergraduate | 181 | 56.7% |
| Graduate / Professional | 33 | 10.3% |
| Total | 319 | 100.0% |
School Enrollment by Age by Funding Source in Ladera
Out of a total of 319 students who are enrolled in schools in Ladera, 219 (68.7%) attend a private institution, while the remaining 100 (31.3%) are enrolled in public schools. The age group of 3 to 4 year olds has the highest likelihood of being enrolled in private schools, with 10 (100.0% in the age bracket) enrolled. Conversely, the age group of 10 to 14 year olds has the lowest likelihood of being enrolled in a private school, with 13 (100.0% in the age bracket) attending a public institution.
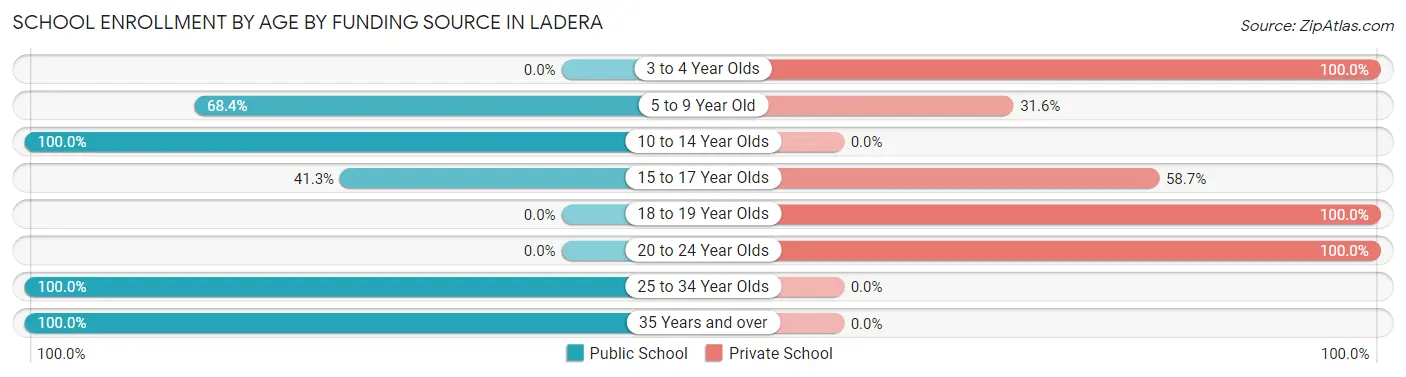
| Age Bracket | Public School | Private School |
| 3 to 4 Year Olds | 0 (0.0%) | 10 (100.0%) |
| 5 to 9 Year Old | 13 (68.4%) | 6 (31.6%) |
| 10 to 14 Year Olds | 13 (100.0%) | 0 (0.0%) |
| 15 to 17 Year Olds | 26 (41.3%) | 37 (58.7%) |
| 18 to 19 Year Olds | 0 (0.0%) | 31 (100.0%) |
| 20 to 24 Year Olds | 0 (0.0%) | 135 (100.0%) |
| 25 to 34 Year Olds | 33 (100.0%) | 0 (0.0%) |
| 35 Years and over | 15 (100.0%) | 0 (0.0%) |
| Total | 100 (31.3%) | 219 (68.7%) |
Educational Attainment by Field of Study in Ladera
Social sciences (236 | 22.9%), engineering (140 | 13.6%), bio, nature & agricultural (139 | 13.5%), liberal arts & history (136 | 13.2%), and psychology (77 | 7.4%) are the most common fields of study among 1,033 individuals in Ladera who have obtained a bachelor's degree or higher.
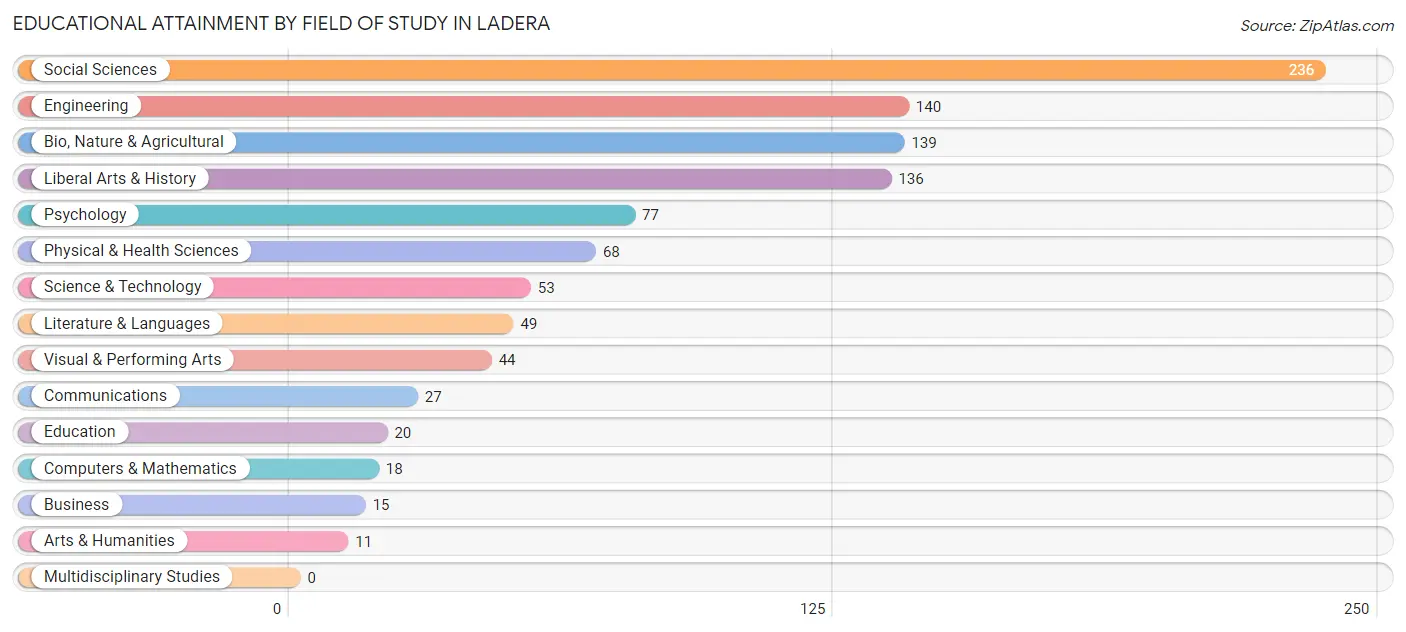
| Field of Study | # Graduates | % Graduates |
| Computers & Mathematics | 18 | 1.7% |
| Bio, Nature & Agricultural | 139 | 13.5% |
| Physical & Health Sciences | 68 | 6.6% |
| Psychology | 77 | 7.4% |
| Social Sciences | 236 | 22.9% |
| Engineering | 140 | 13.6% |
| Multidisciplinary Studies | 0 | 0.0% |
| Science & Technology | 53 | 5.1% |
| Business | 15 | 1.5% |
| Education | 20 | 1.9% |
| Literature & Languages | 49 | 4.7% |
| Liberal Arts & History | 136 | 13.2% |
| Visual & Performing Arts | 44 | 4.3% |
| Communications | 27 | 2.6% |
| Arts & Humanities | 11 | 1.1% |
| Total | 1,033 | 100.0% |
Transportation & Commute in Ladera
Vehicle Availability by Sex in Ladera
The most prevalent vehicle ownership categories in Ladera are males with 3 vehicles (166, accounting for 37.2%) and females with 3 vehicles (86, making up 98.2%).
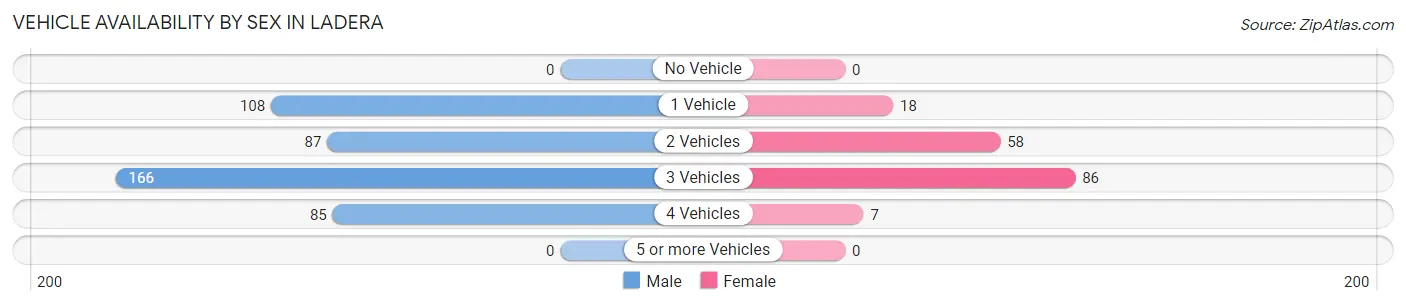
| Vehicles Available | Male | Female |
| No Vehicle | 0 (0.0%) | 0 (0.0%) |
| 1 Vehicle | 108 (24.2%) | 18 (10.6%) |
| 2 Vehicles | 87 (19.5%) | 58 (34.3%) |
| 3 Vehicles | 166 (37.2%) | 86 (50.9%) |
| 4 Vehicles | 85 (19.1%) | 7 (4.1%) |
| 5 or more Vehicles | 0 (0.0%) | 0 (0.0%) |
| Total | 446 (100.0%) | 169 (100.0%) |
Commute Time in Ladera
The most frequently occuring commute durations in Ladera are 25 to 29 minutes (134 commuters, 27.9%), 15 to 19 minutes (63 commuters, 13.1%), and 10 to 14 minutes (58 commuters, 12.1%).
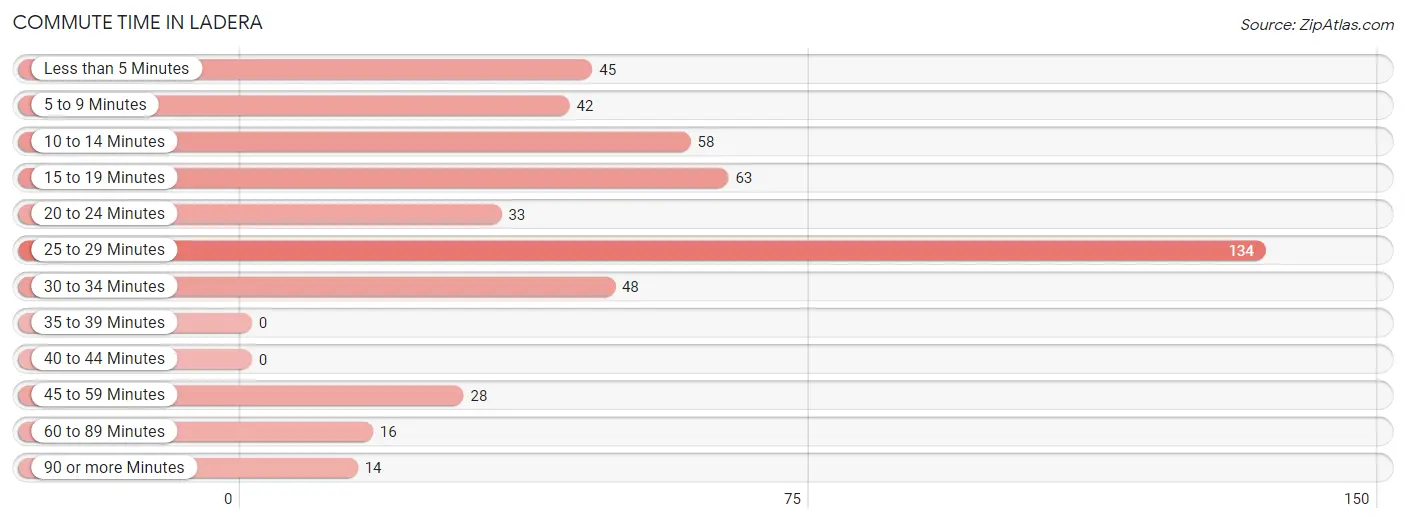
| Commute Time | # Commuters | % Commuters |
| Less than 5 Minutes | 45 | 9.4% |
| 5 to 9 Minutes | 42 | 8.7% |
| 10 to 14 Minutes | 58 | 12.1% |
| 15 to 19 Minutes | 63 | 13.1% |
| 20 to 24 Minutes | 33 | 6.9% |
| 25 to 29 Minutes | 134 | 27.9% |
| 30 to 34 Minutes | 48 | 10.0% |
| 35 to 39 Minutes | 0 | 0.0% |
| 40 to 44 Minutes | 0 | 0.0% |
| 45 to 59 Minutes | 28 | 5.8% |
| 60 to 89 Minutes | 16 | 3.3% |
| 90 or more Minutes | 14 | 2.9% |
Commute Time by Sex in Ladera
The most common commute times in Ladera are 25 to 29 minutes (121 commuters, 32.8%) for males and less than 5 minutes (40 commuters, 35.7%) for females.
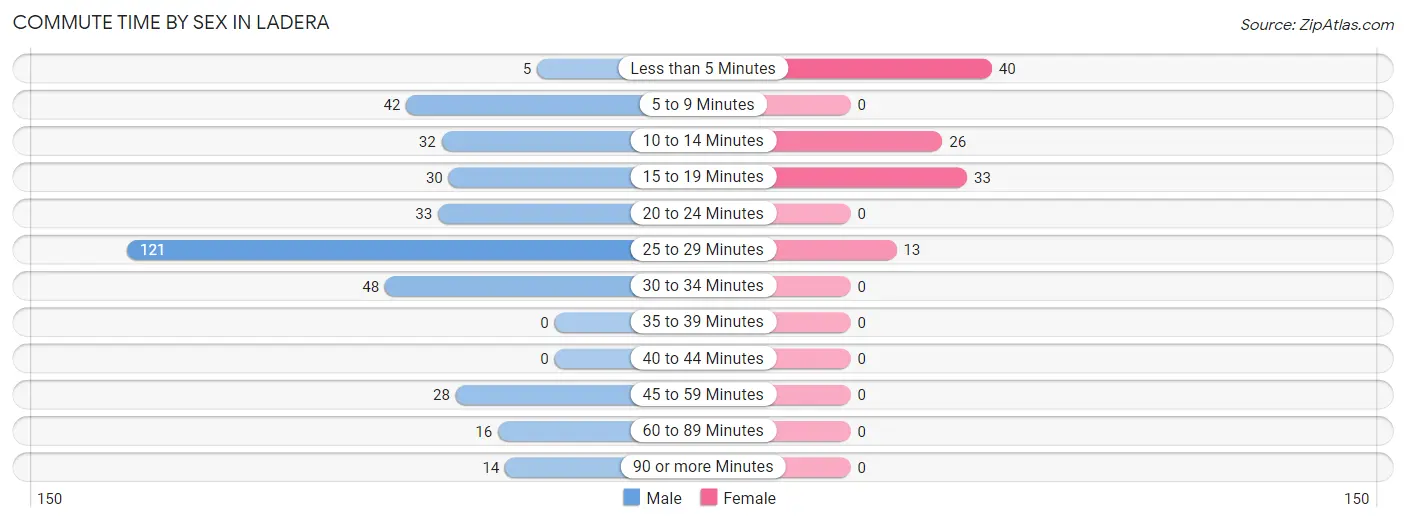
| Commute Time | Male | Female |
| Less than 5 Minutes | 5 (1.4%) | 40 (35.7%) |
| 5 to 9 Minutes | 42 (11.4%) | 0 (0.0%) |
| 10 to 14 Minutes | 32 (8.7%) | 26 (23.2%) |
| 15 to 19 Minutes | 30 (8.1%) | 33 (29.5%) |
| 20 to 24 Minutes | 33 (8.9%) | 0 (0.0%) |
| 25 to 29 Minutes | 121 (32.8%) | 13 (11.6%) |
| 30 to 34 Minutes | 48 (13.0%) | 0 (0.0%) |
| 35 to 39 Minutes | 0 (0.0%) | 0 (0.0%) |
| 40 to 44 Minutes | 0 (0.0%) | 0 (0.0%) |
| 45 to 59 Minutes | 28 (7.6%) | 0 (0.0%) |
| 60 to 89 Minutes | 16 (4.3%) | 0 (0.0%) |
| 90 or more Minutes | 14 (3.8%) | 0 (0.0%) |
Time of Departure to Work by Sex in Ladera
The most frequent times of departure to work in Ladera are 6:00 AM to 6:29 AM (163, 44.2%) for males and 8:00 AM to 8:29 AM (31, 27.7%) for females.
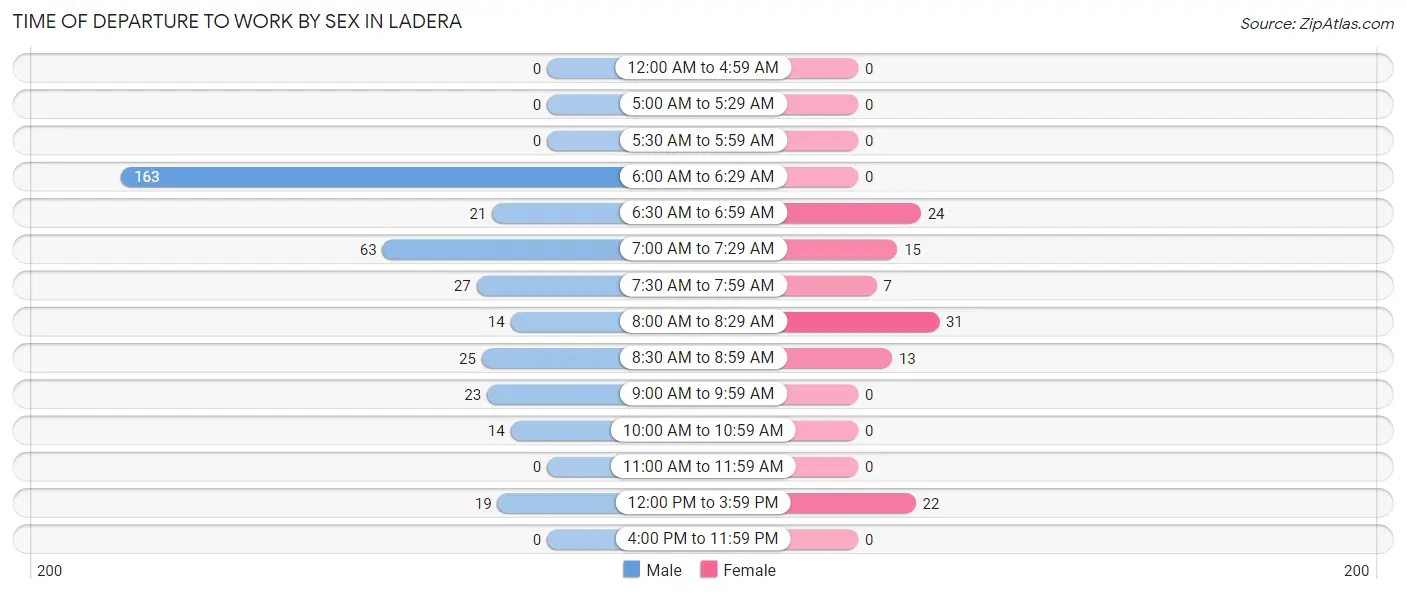
| Time of Departure | Male | Female |
| 12:00 AM to 4:59 AM | 0 (0.0%) | 0 (0.0%) |
| 5:00 AM to 5:29 AM | 0 (0.0%) | 0 (0.0%) |
| 5:30 AM to 5:59 AM | 0 (0.0%) | 0 (0.0%) |
| 6:00 AM to 6:29 AM | 163 (44.2%) | 0 (0.0%) |
| 6:30 AM to 6:59 AM | 21 (5.7%) | 24 (21.4%) |
| 7:00 AM to 7:29 AM | 63 (17.1%) | 15 (13.4%) |
| 7:30 AM to 7:59 AM | 27 (7.3%) | 7 (6.2%) |
| 8:00 AM to 8:29 AM | 14 (3.8%) | 31 (27.7%) |
| 8:30 AM to 8:59 AM | 25 (6.8%) | 13 (11.6%) |
| 9:00 AM to 9:59 AM | 23 (6.2%) | 0 (0.0%) |
| 10:00 AM to 10:59 AM | 14 (3.8%) | 0 (0.0%) |
| 11:00 AM to 11:59 AM | 0 (0.0%) | 0 (0.0%) |
| 12:00 PM to 3:59 PM | 19 (5.1%) | 22 (19.6%) |
| 4:00 PM to 11:59 PM | 0 (0.0%) | 0 (0.0%) |
| Total | 369 (100.0%) | 112 (100.0%) |
Housing Occupancy in Ladera
Occupancy by Ownership in Ladera
Of the total 555 dwellings in Ladera, owner-occupied units account for 537 (96.8%), while renter-occupied units make up 18 (3.2%).
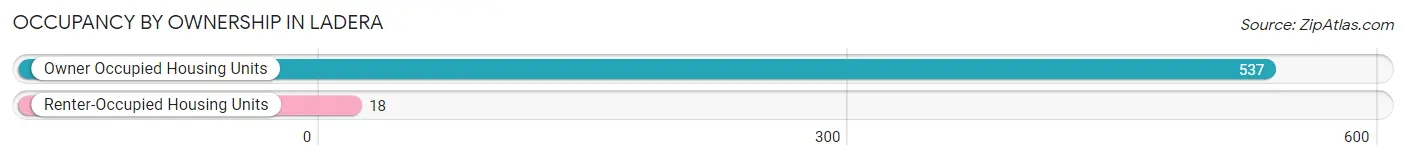
| Occupancy | # Housing Units | % Housing Units |
| Owner Occupied Housing Units | 537 | 96.8% |
| Renter-Occupied Housing Units | 18 | 3.2% |
| Total Occupied Housing Units | 555 | 100.0% |
Occupancy by Household Size in Ladera
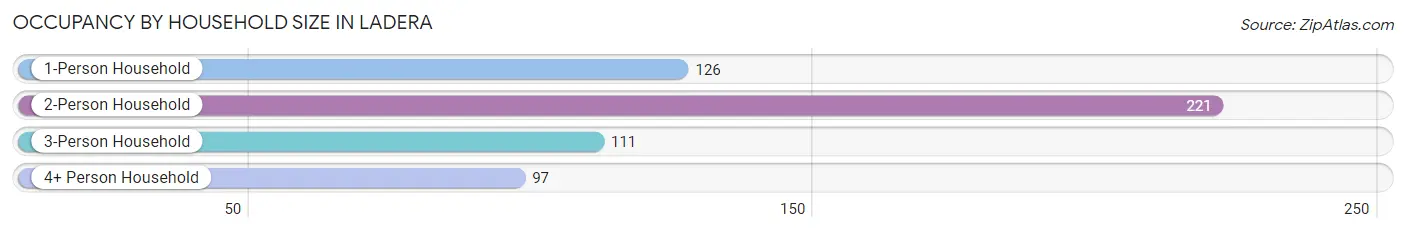
| Household Size | # Housing Units | % Housing Units |
| 1-Person Household | 126 | 22.7% |
| 2-Person Household | 221 | 39.8% |
| 3-Person Household | 111 | 20.0% |
| 4+ Person Household | 97 | 17.5% |
| Total Housing Units | 555 | 100.0% |
Occupancy by Ownership by Household Size in Ladera
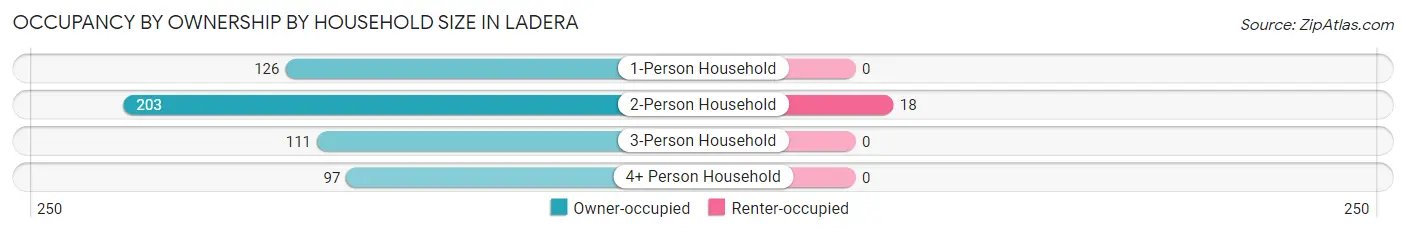
| Household Size | Owner-occupied | Renter-occupied |
| 1-Person Household | 126 (100.0%) | 0 (0.0%) |
| 2-Person Household | 203 (91.9%) | 18 (8.1%) |
| 3-Person Household | 111 (100.0%) | 0 (0.0%) |
| 4+ Person Household | 97 (100.0%) | 0 (0.0%) |
| Total Housing Units | 537 (96.8%) | 18 (3.2%) |
Occupancy by Educational Attainment in Ladera
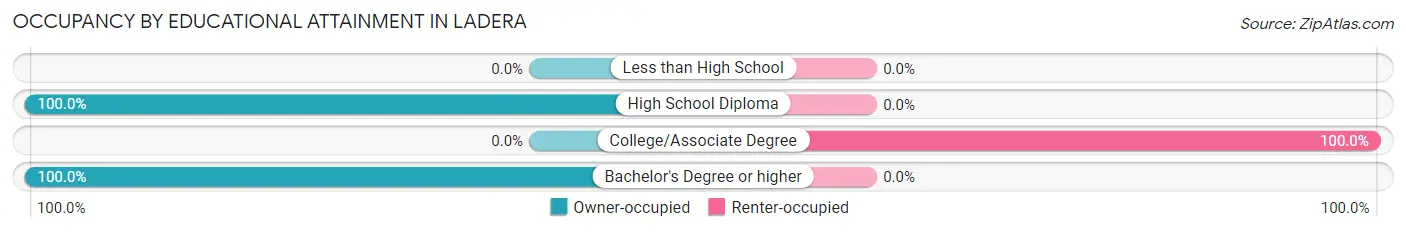
| Household Size | Owner-occupied | Renter-occupied |
| Less than High School | 0 (0.0%) | 0 (0.0%) |
| High School Diploma | 15 (100.0%) | 0 (0.0%) |
| College/Associate Degree | 0 (0.0%) | 18 (100.0%) |
| Bachelor's Degree or higher | 522 (100.0%) | 0 (0.0%) |
Occupancy by Age of Householder in Ladera
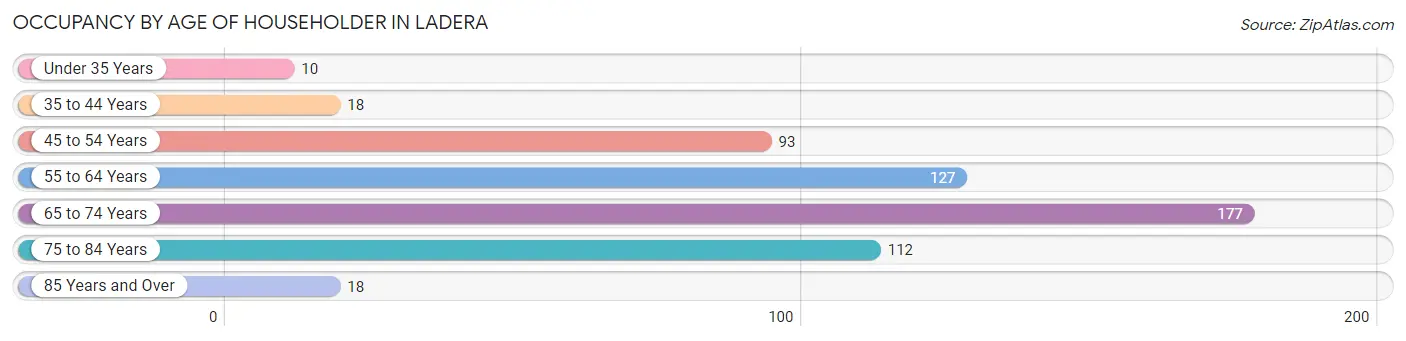
| Age Bracket | # Households | % Households |
| Under 35 Years | 10 | 1.8% |
| 35 to 44 Years | 18 | 3.2% |
| 45 to 54 Years | 93 | 16.8% |
| 55 to 64 Years | 127 | 22.9% |
| 65 to 74 Years | 177 | 31.9% |
| 75 to 84 Years | 112 | 20.2% |
| 85 Years and Over | 18 | 3.2% |
| Total | 555 | 100.0% |
Housing Finances in Ladera
Median Income by Occupancy in Ladera
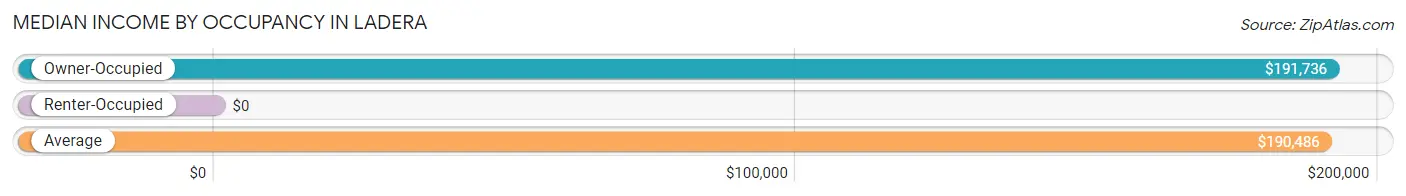
| Occupancy Type | # Households | Median Income |
| Owner-Occupied | 537 (96.8%) | $191,736 |
| Renter-Occupied | 18 (3.2%) | $0 |
| Average | 555 (100.0%) | $190,486 |
Occupancy by Householder Income Bracket in Ladera
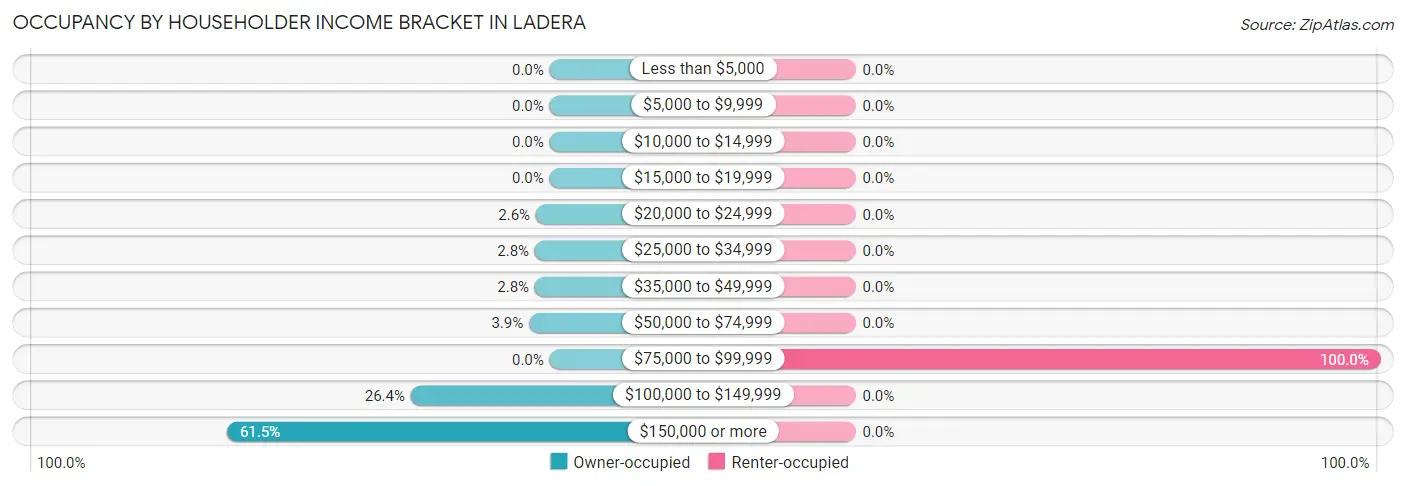
| Income Bracket | Owner-occupied | Renter-occupied |
| Less than $5,000 | 0 (0.0%) | 0 (0.0%) |
| $5,000 to $9,999 | 0 (0.0%) | 0 (0.0%) |
| $10,000 to $14,999 | 0 (0.0%) | 0 (0.0%) |
| $15,000 to $19,999 | 0 (0.0%) | 0 (0.0%) |
| $20,000 to $24,999 | 14 (2.6%) | 0 (0.0%) |
| $25,000 to $34,999 | 15 (2.8%) | 0 (0.0%) |
| $35,000 to $49,999 | 15 (2.8%) | 0 (0.0%) |
| $50,000 to $74,999 | 21 (3.9%) | 0 (0.0%) |
| $75,000 to $99,999 | 0 (0.0%) | 18 (100.0%) |
| $100,000 to $149,999 | 142 (26.4%) | 0 (0.0%) |
| $150,000 or more | 330 (61.5%) | 0 (0.0%) |
| Total | 537 (100.0%) | 18 (100.0%) |
Monthly Housing Cost Tiers in Ladera
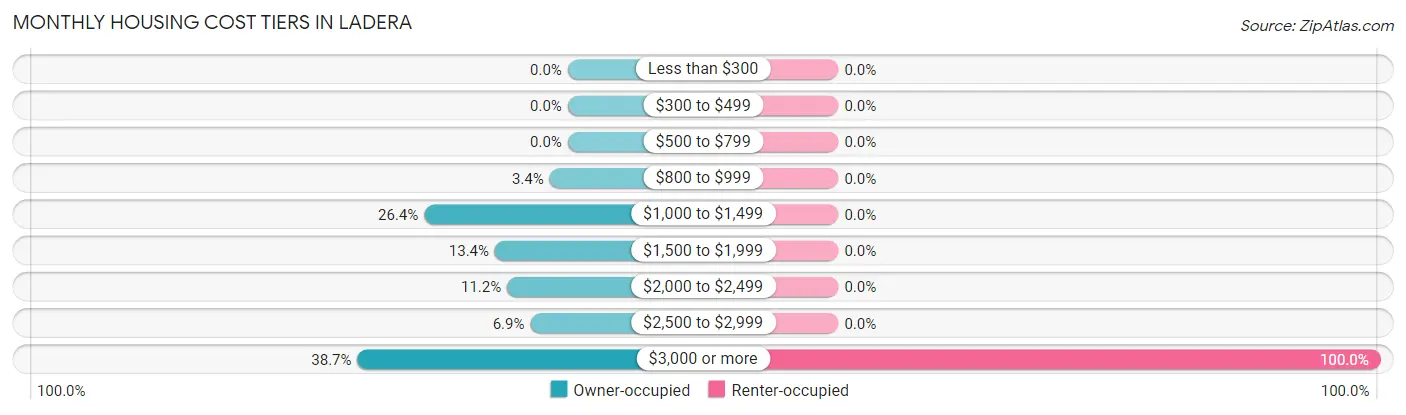
| Monthly Cost | Owner-occupied | Renter-occupied |
| Less than $300 | 0 (0.0%) | 0 (0.0%) |
| $300 to $499 | 0 (0.0%) | 0 (0.0%) |
| $500 to $799 | 0 (0.0%) | 0 (0.0%) |
| $800 to $999 | 18 (3.4%) | 0 (0.0%) |
| $1,000 to $1,499 | 142 (26.4%) | 0 (0.0%) |
| $1,500 to $1,999 | 72 (13.4%) | 0 (0.0%) |
| $2,000 to $2,499 | 60 (11.2%) | 0 (0.0%) |
| $2,500 to $2,999 | 37 (6.9%) | 0 (0.0%) |
| $3,000 or more | 208 (38.7%) | 18 (100.0%) |
| Total | 537 (100.0%) | 18 (100.0%) |
Physical Housing Characteristics in Ladera
Housing Structures in Ladera
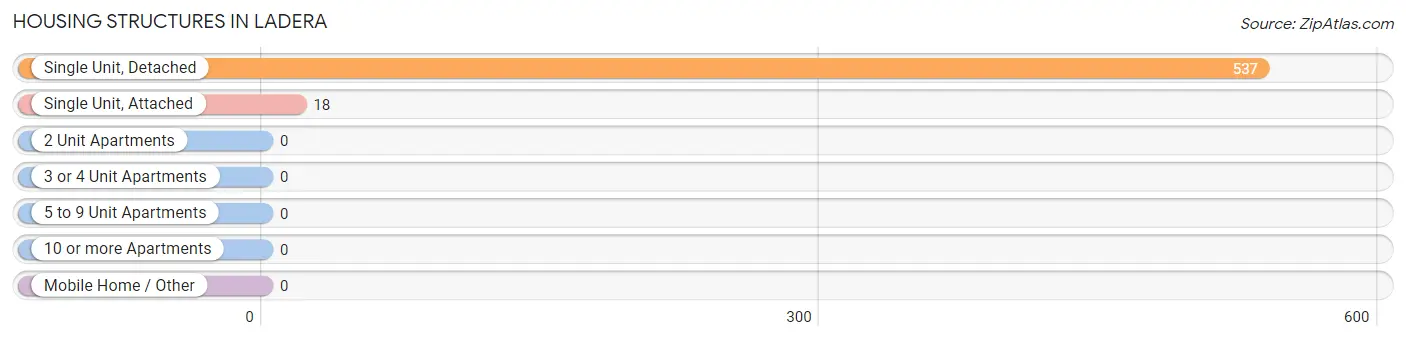
| Structure Type | # Housing Units | % Housing Units |
| Single Unit, Detached | 537 | 96.8% |
| Single Unit, Attached | 18 | 3.2% |
| 2 Unit Apartments | 0 | 0.0% |
| 3 or 4 Unit Apartments | 0 | 0.0% |
| 5 to 9 Unit Apartments | 0 | 0.0% |
| 10 or more Apartments | 0 | 0.0% |
| Mobile Home / Other | 0 | 0.0% |
| Total | 555 | 100.0% |
Housing Structures by Occupancy in Ladera
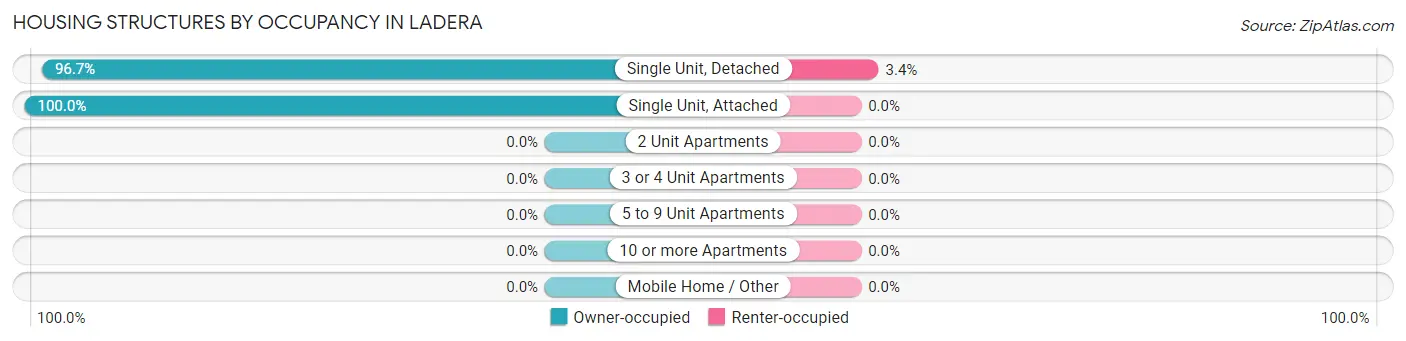
| Structure Type | Owner-occupied | Renter-occupied |
| Single Unit, Detached | 519 (96.7%) | 18 (3.4%) |
| Single Unit, Attached | 18 (100.0%) | 0 (0.0%) |
| 2 Unit Apartments | 0 (0.0%) | 0 (0.0%) |
| 3 or 4 Unit Apartments | 0 (0.0%) | 0 (0.0%) |
| 5 to 9 Unit Apartments | 0 (0.0%) | 0 (0.0%) |
| 10 or more Apartments | 0 (0.0%) | 0 (0.0%) |
| Mobile Home / Other | 0 (0.0%) | 0 (0.0%) |
| Total | 537 (96.8%) | 18 (3.2%) |
Housing Structures by Number of Rooms in Ladera
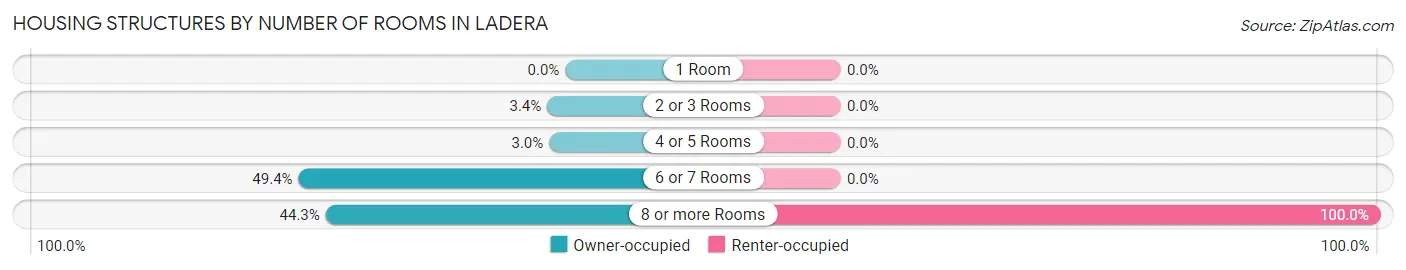
| Number of Rooms | Owner-occupied | Renter-occupied |
| 1 Room | 0 (0.0%) | 0 (0.0%) |
| 2 or 3 Rooms | 18 (3.4%) | 0 (0.0%) |
| 4 or 5 Rooms | 16 (3.0%) | 0 (0.0%) |
| 6 or 7 Rooms | 265 (49.3%) | 0 (0.0%) |
| 8 or more Rooms | 238 (44.3%) | 18 (100.0%) |
| Total | 537 (100.0%) | 18 (100.0%) |
Housing Structure by Heating Type in Ladera
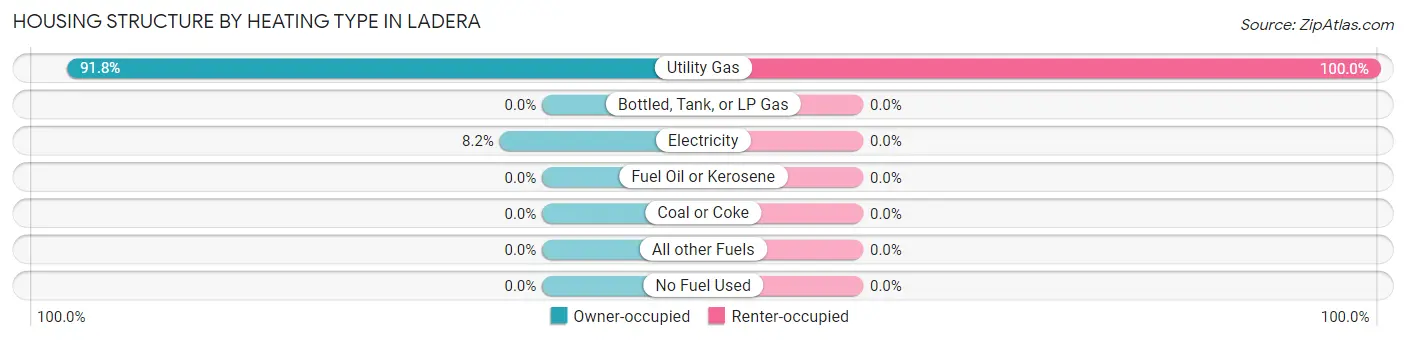
| Heating Type | Owner-occupied | Renter-occupied |
| Utility Gas | 493 (91.8%) | 18 (100.0%) |
| Bottled, Tank, or LP Gas | 0 (0.0%) | 0 (0.0%) |
| Electricity | 44 (8.2%) | 0 (0.0%) |
| Fuel Oil or Kerosene | 0 (0.0%) | 0 (0.0%) |
| Coal or Coke | 0 (0.0%) | 0 (0.0%) |
| All other Fuels | 0 (0.0%) | 0 (0.0%) |
| No Fuel Used | 0 (0.0%) | 0 (0.0%) |
| Total | 537 (100.0%) | 18 (100.0%) |
Household Vehicle Usage in Ladera
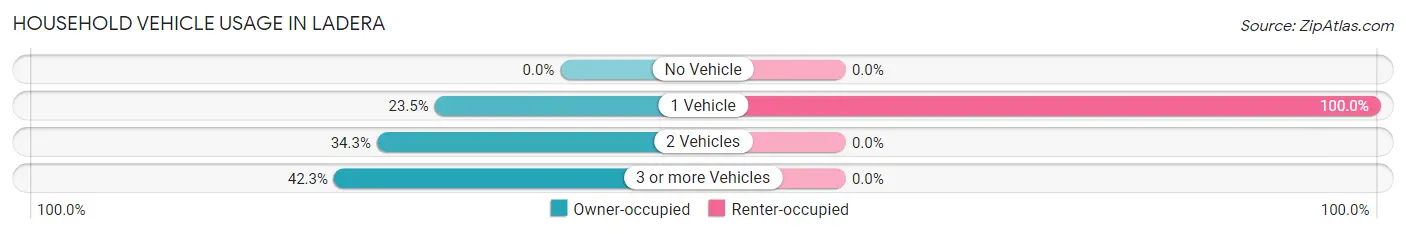
| Vehicles per Household | Owner-occupied | Renter-occupied |
| No Vehicle | 0 (0.0%) | 0 (0.0%) |
| 1 Vehicle | 126 (23.5%) | 18 (100.0%) |
| 2 Vehicles | 184 (34.3%) | 0 (0.0%) |
| 3 or more Vehicles | 227 (42.3%) | 0 (0.0%) |
| Total | 537 (100.0%) | 18 (100.0%) |
Real Estate & Mortgages in Ladera
Real Estate and Mortgage Overview in Ladera
| Characteristic | Without Mortgage | With Mortgage |
| Housing Units | 304 | 233 |
| Median Property Value | $2,000,001 | $2,000,001 |
| Median Household Income | $137,361 | $184 |
| Monthly Housing Costs | $1,293 | $202 |
| Real Estate Taxes | $10,001 | $0 |
Property Value by Mortgage Status in Ladera
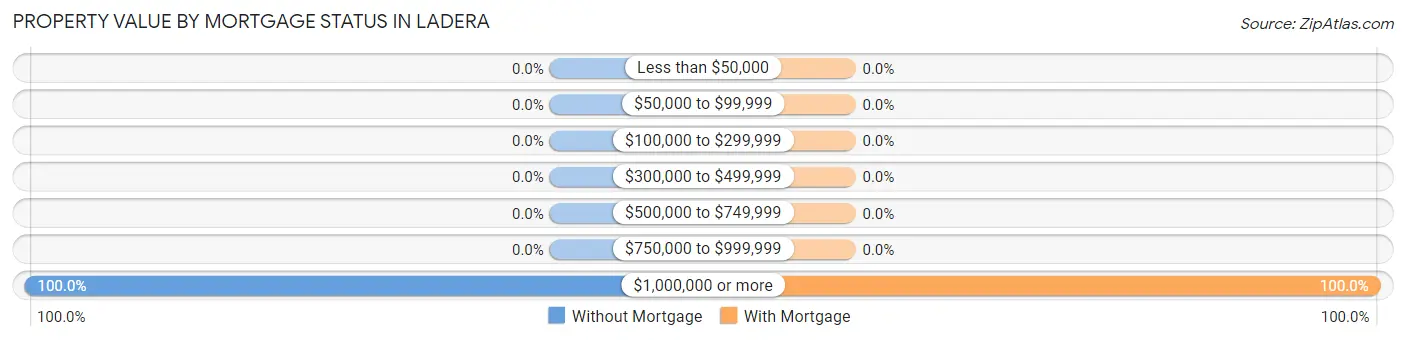
| Property Value | Without Mortgage | With Mortgage |
| Less than $50,000 | 0 (0.0%) | 0 (0.0%) |
| $50,000 to $99,999 | 0 (0.0%) | 0 (0.0%) |
| $100,000 to $299,999 | 0 (0.0%) | 0 (0.0%) |
| $300,000 to $499,999 | 0 (0.0%) | 0 (0.0%) |
| $500,000 to $749,999 | 0 (0.0%) | 0 (0.0%) |
| $750,000 to $999,999 | 0 (0.0%) | 0 (0.0%) |
| $1,000,000 or more | 304 (100.0%) | 233 (100.0%) |
| Total | 304 (100.0%) | 233 (100.0%) |
Household Income by Mortgage Status in Ladera
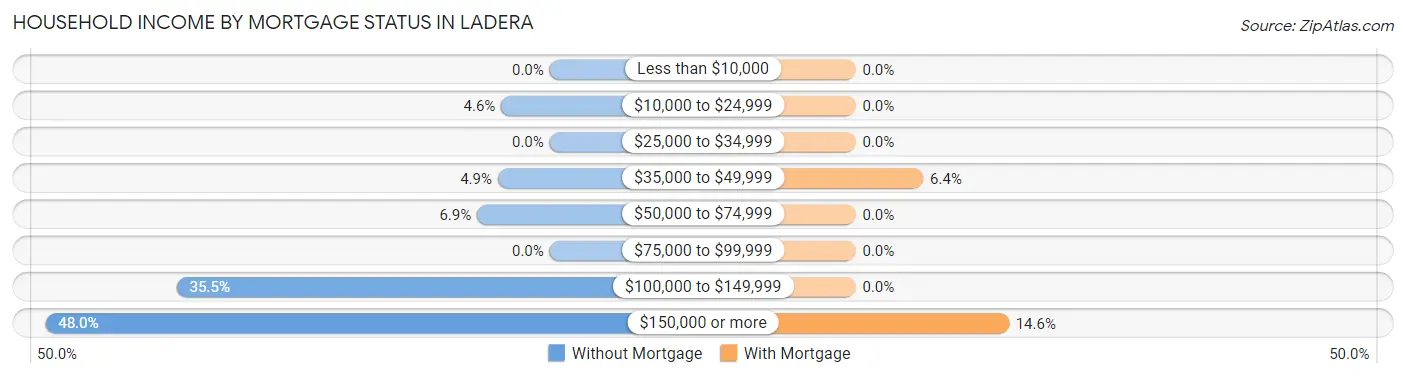
| Household Income | Without Mortgage | With Mortgage |
| Less than $10,000 | 0 (0.0%) | 0 (0.0%) |
| $10,000 to $24,999 | 14 (4.6%) | 0 (0.0%) |
| $25,000 to $34,999 | 0 (0.0%) | 0 (0.0%) |
| $35,000 to $49,999 | 15 (4.9%) | 15 (6.4%) |
| $50,000 to $74,999 | 21 (6.9%) | 0 (0.0%) |
| $75,000 to $99,999 | 0 (0.0%) | 0 (0.0%) |
| $100,000 to $149,999 | 108 (35.5%) | 0 (0.0%) |
| $150,000 or more | 146 (48.0%) | 34 (14.6%) |
| Total | 304 (100.0%) | 233 (100.0%) |
Property Value to Household Income Ratio in Ladera
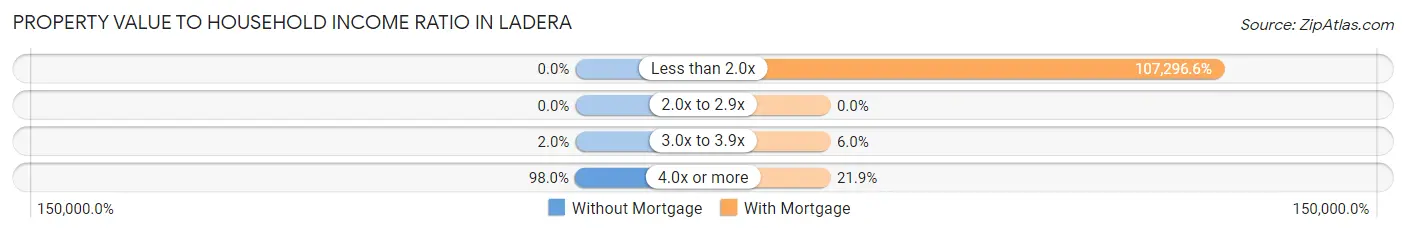
| Value-to-Income Ratio | Without Mortgage | With Mortgage |
| Less than 2.0x | 0 (0.0%) | 250,001 (107,296.6%) |
| 2.0x to 2.9x | 0 (0.0%) | 0 (0.0%) |
| 3.0x to 3.9x | 6 (2.0%) | 14 (6.0%) |
| 4.0x or more | 298 (98.0%) | 51 (21.9%) |
| Total | 304 (100.0%) | 233 (100.0%) |
Real Estate Taxes by Mortgage Status in Ladera
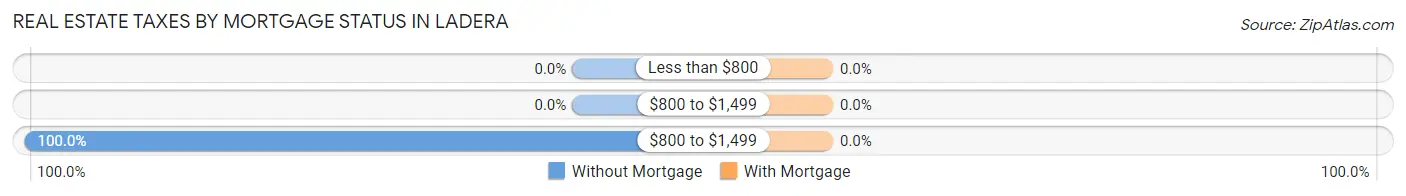
| Property Taxes | Without Mortgage | With Mortgage |
| Less than $800 | 0 (0.0%) | 0 (0.0%) |
| $800 to $1,499 | 0 (0.0%) | 0 (0.0%) |
| $800 to $1,499 | 304 (100.0%) | 0 (0.0%) |
| Total | 304 (100.0%) | 233 (100.0%) |
Health & Disability in Ladera
Health Insurance Coverage by Age in Ladera
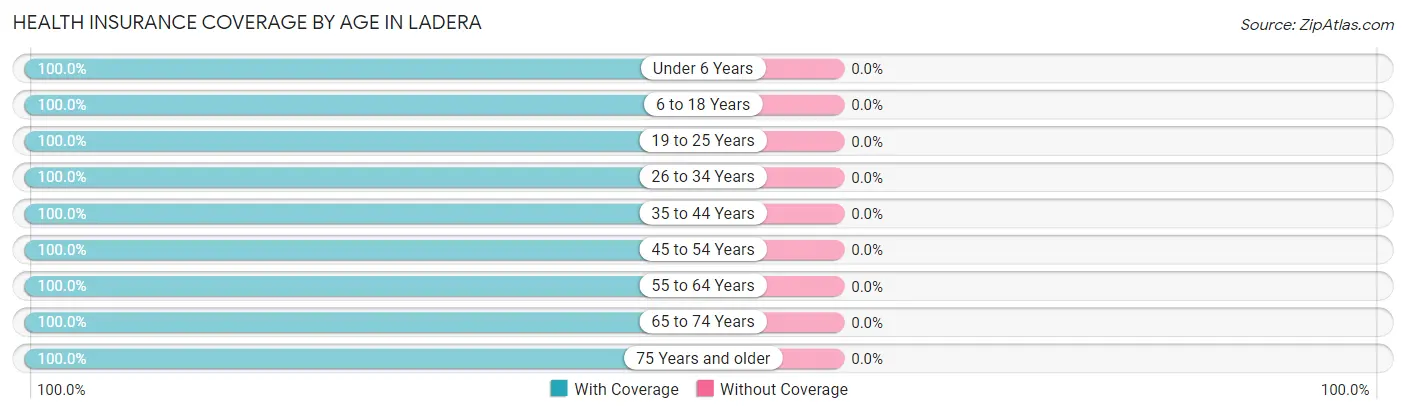
| Age Bracket | With Coverage | Without Coverage |
| Under 6 Years | 49 (100.0%) | 0 (0.0%) |
| 6 to 18 Years | 89 (100.0%) | 0 (0.0%) |
| 19 to 25 Years | 241 (100.0%) | 0 (0.0%) |
| 26 to 34 Years | 57 (100.0%) | 0 (0.0%) |
| 35 to 44 Years | 32 (100.0%) | 0 (0.0%) |
| 45 to 54 Years | 169 (100.0%) | 0 (0.0%) |
| 55 to 64 Years | 301 (100.0%) | 0 (0.0%) |
| 65 to 74 Years | 283 (100.0%) | 0 (0.0%) |
| 75 Years and older | 206 (100.0%) | 0 (0.0%) |
| Total | 1,427 (100.0%) | 0 (0.0%) |
Health Insurance Coverage by Citizenship Status in Ladera
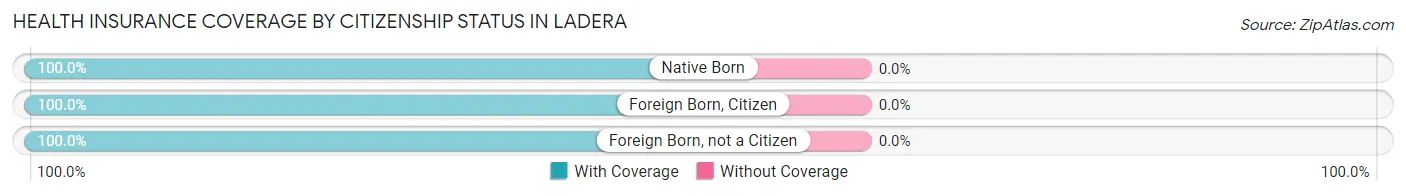
| Citizenship Status | With Coverage | Without Coverage |
| Native Born | 49 (100.0%) | 0 (0.0%) |
| Foreign Born, Citizen | 89 (100.0%) | 0 (0.0%) |
| Foreign Born, not a Citizen | 241 (100.0%) | 0 (0.0%) |
Health Insurance Coverage by Household Income in Ladera
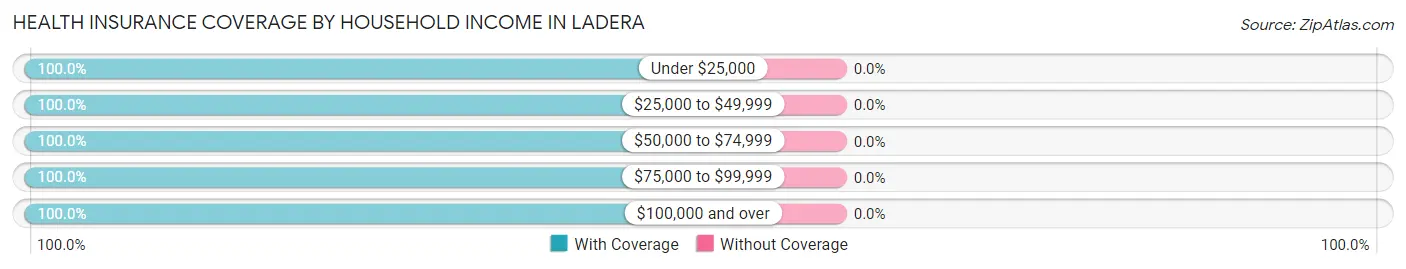
| Household Income | With Coverage | Without Coverage |
| Under $25,000 | 29 (100.0%) | 0 (0.0%) |
| $25,000 to $49,999 | 77 (100.0%) | 0 (0.0%) |
| $50,000 to $74,999 | 103 (100.0%) | 0 (0.0%) |
| $75,000 to $99,999 | 34 (100.0%) | 0 (0.0%) |
| $100,000 and over | 1,184 (100.0%) | 0 (0.0%) |
Public vs Private Health Insurance Coverage by Age in Ladera
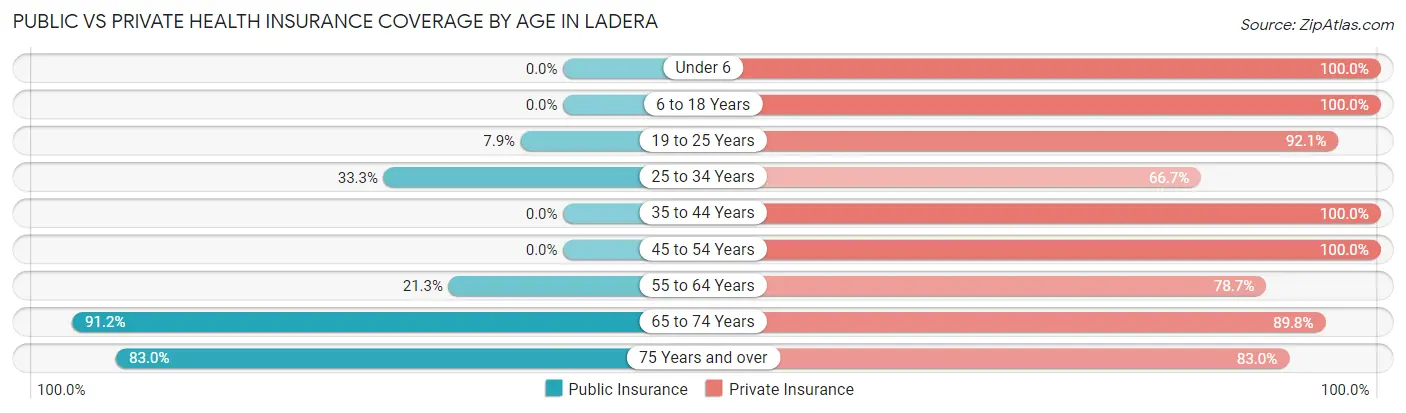
| Age Bracket | Public Insurance | Private Insurance |
| Under 6 | 0 (0.0%) | 49 (100.0%) |
| 6 to 18 Years | 0 (0.0%) | 89 (100.0%) |
| 19 to 25 Years | 19 (7.9%) | 222 (92.1%) |
| 25 to 34 Years | 19 (33.3%) | 38 (66.7%) |
| 35 to 44 Years | 0 (0.0%) | 32 (100.0%) |
| 45 to 54 Years | 0 (0.0%) | 169 (100.0%) |
| 55 to 64 Years | 64 (21.3%) | 237 (78.7%) |
| 65 to 74 Years | 258 (91.2%) | 254 (89.7%) |
| 75 Years and over | 171 (83.0%) | 171 (83.0%) |
| Total | 531 (37.2%) | 1,261 (88.4%) |
Disability Status by Sex by Age in Ladera
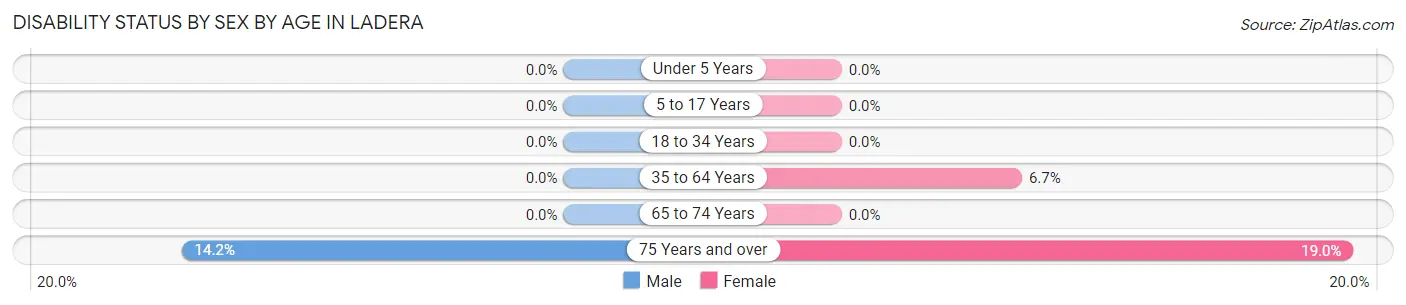
| Age Bracket | Male | Female |
| Under 5 Years | 0 (0.0%) | 0 (0.0%) |
| 5 to 17 Years | 0 (0.0%) | 0 (0.0%) |
| 18 to 34 Years | 0 (0.0%) | 0 (0.0%) |
| 35 to 64 Years | 0 (0.0%) | 18 (6.7%) |
| 65 to 74 Years | 0 (0.0%) | 0 (0.0%) |
| 75 Years and over | 18 (14.2%) | 15 (19.0%) |
Disability Class by Sex by Age in Ladera
Disability Class: Hearing Difficulty
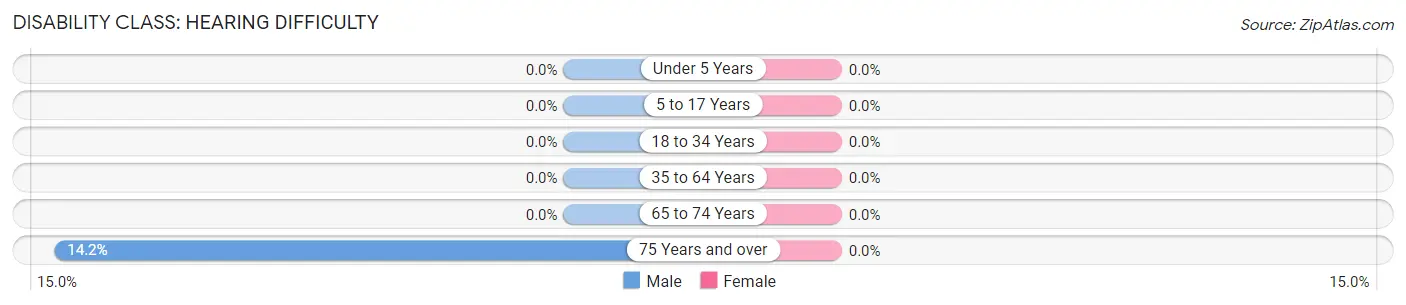
| Age Bracket | Male | Female |
| Under 5 Years | 0 (0.0%) | 0 (0.0%) |
| 5 to 17 Years | 0 (0.0%) | 0 (0.0%) |
| 18 to 34 Years | 0 (0.0%) | 0 (0.0%) |
| 35 to 64 Years | 0 (0.0%) | 0 (0.0%) |
| 65 to 74 Years | 0 (0.0%) | 0 (0.0%) |
| 75 Years and over | 18 (14.2%) | 0 (0.0%) |
Disability Class: Vision Difficulty
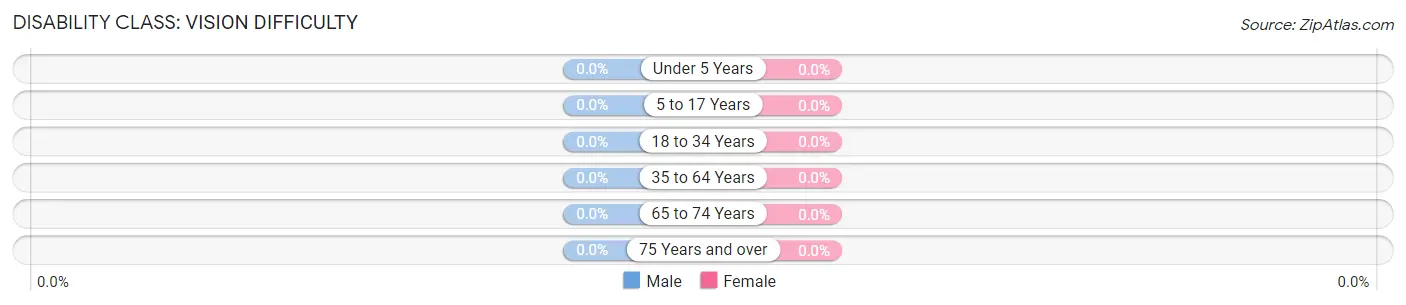
| Age Bracket | Male | Female |
| Under 5 Years | 0 (0.0%) | 0 (0.0%) |
| 5 to 17 Years | 0 (0.0%) | 0 (0.0%) |
| 18 to 34 Years | 0 (0.0%) | 0 (0.0%) |
| 35 to 64 Years | 0 (0.0%) | 0 (0.0%) |
| 65 to 74 Years | 0 (0.0%) | 0 (0.0%) |
| 75 Years and over | 0 (0.0%) | 0 (0.0%) |
Disability Class: Cognitive Difficulty
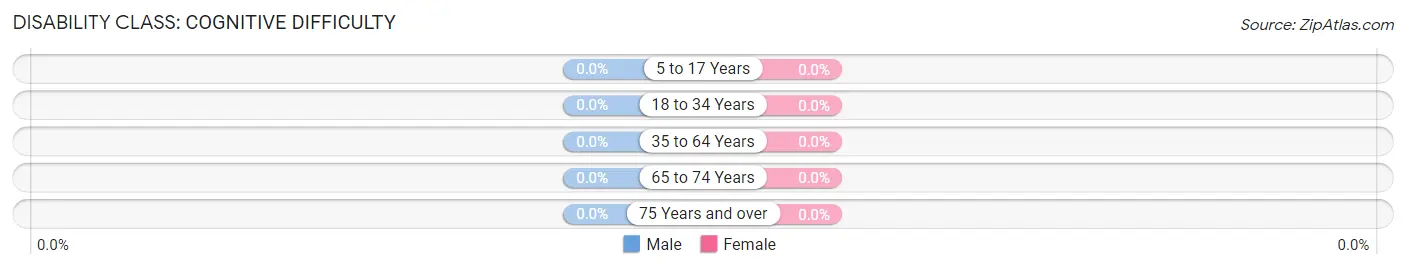
| Age Bracket | Male | Female |
| 5 to 17 Years | 0 (0.0%) | 0 (0.0%) |
| 18 to 34 Years | 0 (0.0%) | 0 (0.0%) |
| 35 to 64 Years | 0 (0.0%) | 0 (0.0%) |
| 65 to 74 Years | 0 (0.0%) | 0 (0.0%) |
| 75 Years and over | 0 (0.0%) | 0 (0.0%) |
Disability Class: Ambulatory Difficulty
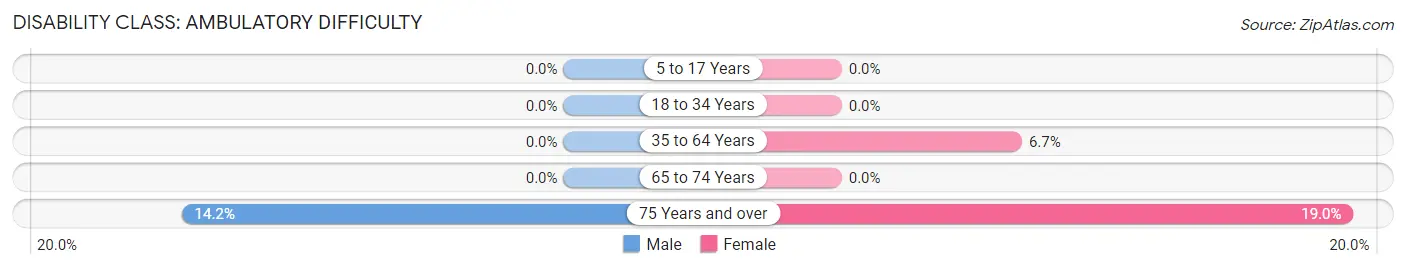
| Age Bracket | Male | Female |
| 5 to 17 Years | 0 (0.0%) | 0 (0.0%) |
| 18 to 34 Years | 0 (0.0%) | 0 (0.0%) |
| 35 to 64 Years | 0 (0.0%) | 18 (6.7%) |
| 65 to 74 Years | 0 (0.0%) | 0 (0.0%) |
| 75 Years and over | 18 (14.2%) | 15 (19.0%) |
Disability Class: Self-Care Difficulty
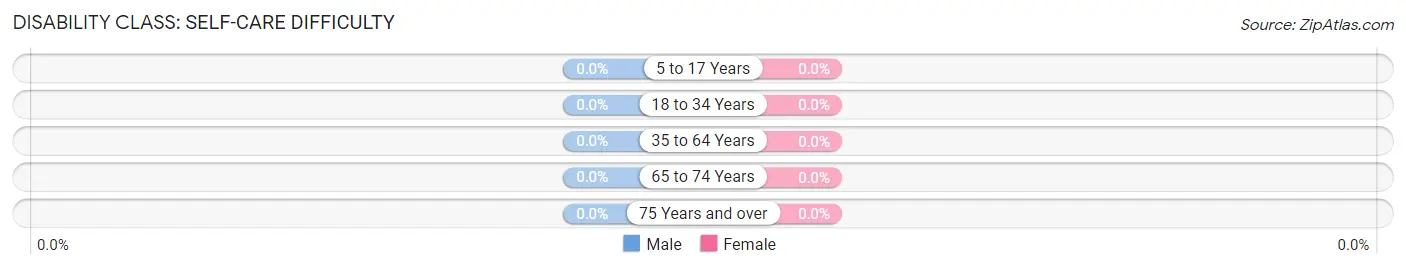
| Age Bracket | Male | Female |
| 5 to 17 Years | 0 (0.0%) | 0 (0.0%) |
| 18 to 34 Years | 0 (0.0%) | 0 (0.0%) |
| 35 to 64 Years | 0 (0.0%) | 0 (0.0%) |
| 65 to 74 Years | 0 (0.0%) | 0 (0.0%) |
| 75 Years and over | 0 (0.0%) | 0 (0.0%) |
Technology Access in Ladera
Computing Device Access in Ladera
| Device Type | # Households | % Households |
| Desktop or Laptop | 447 | 80.5% |
| Smartphone | 540 | 97.3% |
| Tablet | 449 | 80.9% |
| No Computing Device | 0 | 0.0% |
| Total | 555 | 100.0% |
Internet Access in Ladera
| Internet Type | # Households | % Households |
| Dial-Up Internet | 0 | 0.0% |
| Broadband Home | 447 | 80.5% |
| Cellular Data Only | 108 | 19.5% |
| Satellite Internet | 0 | 0.0% |
| No Internet | 0 | 0.0% |
| Total | 555 | 100.0% |
Ladera Summary
Ladera is a small unincorporated community located in the Santa Cruz Mountains of Santa Clara County, California. It is situated between the cities of Portola Valley and Woodside, and is part of the San Francisco Bay Area. The population of Ladera was estimated to be 1,890 in 2019.
History
Ladera was originally inhabited by the Ohlone people, who lived in the area for thousands of years before the arrival of Europeans. The first Europeans to settle in the area were Spanish missionaries, who established the Mission Santa Cruz in 1791. The area was later part of the Rancho Cañada de Raymundo, a Mexican land grant given to José de la Cruz Sánchez in 1839.
In the late 19th century, the area was developed as a summer resort for wealthy San Franciscans. The area was known as "Ladera" because of its location on the hillside. In the early 20th century, the area was developed as a residential community.
Geography
Ladera is located in the Santa Cruz Mountains of Santa Clara County, California. It is situated between the cities of Portola Valley and Woodside, and is part of the San Francisco Bay Area. The area is characterized by rolling hills and redwood forests.
The climate in Ladera is mild and temperate, with warm summers and cool winters. The average annual temperature is 57°F (14°C). The average annual precipitation is 24.5 inches (62 cm).
Economy
The economy of Ladera is largely based on the service industry. The area is home to a number of small businesses, including restaurants, cafes, and retail stores. The area is also home to a number of tech companies, including Oracle, Google, and Apple.
Demographics
The population of Ladera was estimated to be 1,890 in 2019. The racial makeup of the area is 79.3% White, 8.2% Asian, 6.3% Hispanic or Latino, and 4.2% African American. The median household income is $150,000, and the median home value is $1,890,000.
Conclusion
Ladera is a small unincorporated community located in the Santa Cruz Mountains of Santa Clara County, California. It is situated between the cities of Portola Valley and Woodside, and is part of the San Francisco Bay Area. The area is characterized by rolling hills and redwood forests, and has a mild and temperate climate. The economy of Ladera is largely based on the service industry, and the population of the area is estimated to be 1,890. The racial makeup of the area is 79.3% White, 8.2% Asian, 6.3% Hispanic or Latino, and 4.2% African American. The median household income is $150,000, and the median home value is $1,890,000.
Common Questions
What is Per Capita Income in Ladera?
Per Capita income in Ladera is $134,707.
What is the Median Family Income in Ladera?
Median Family Income in Ladera is $250,001.
What is the Median Household income in Ladera?
Median Household Income in Ladera is $190,486.
What is Inequality or Gini Index in Ladera?
Inequality or Gini Index in Ladera is 0.49.
What is the Total Population of Ladera?
Total Population of Ladera is 1,427.
What is the Total Male Population of Ladera?
Total Male Population of Ladera is 903.
What is the Total Female Population of Ladera?
Total Female Population of Ladera is 524.
What is the Ratio of Males per 100 Females in Ladera?
There are 172.33 Males per 100 Females in Ladera.
What is the Ratio of Females per 100 Males in Ladera?
There are 58.03 Females per 100 Males in Ladera.
What is the Median Population Age in Ladera?
Median Population Age in Ladera is 58.5 Years.
What is the Average Family Size in Ladera
Average Family Size in Ladera is 3.1 People.
What is the Average Household Size in Ladera
Average Household Size in Ladera is 2.6 People.
How Large is the Labor Force in Ladera?
There are 706 People in the Labor Forcein in Ladera.
What is the Percentage of People in the Labor Force in Ladera?
52.2% of People are in the Labor Force in Ladera.
What is the Unemployment Rate in Ladera?
Unemployment Rate in Ladera is 12.9%.