Cities with the Highest Percentage of Population Employed in Health Diagnosing & Treating in Hawaii
RELATED REPORTS & OPTIONS
Health Diagnosing & Treating
Hawaii
Compare Cities
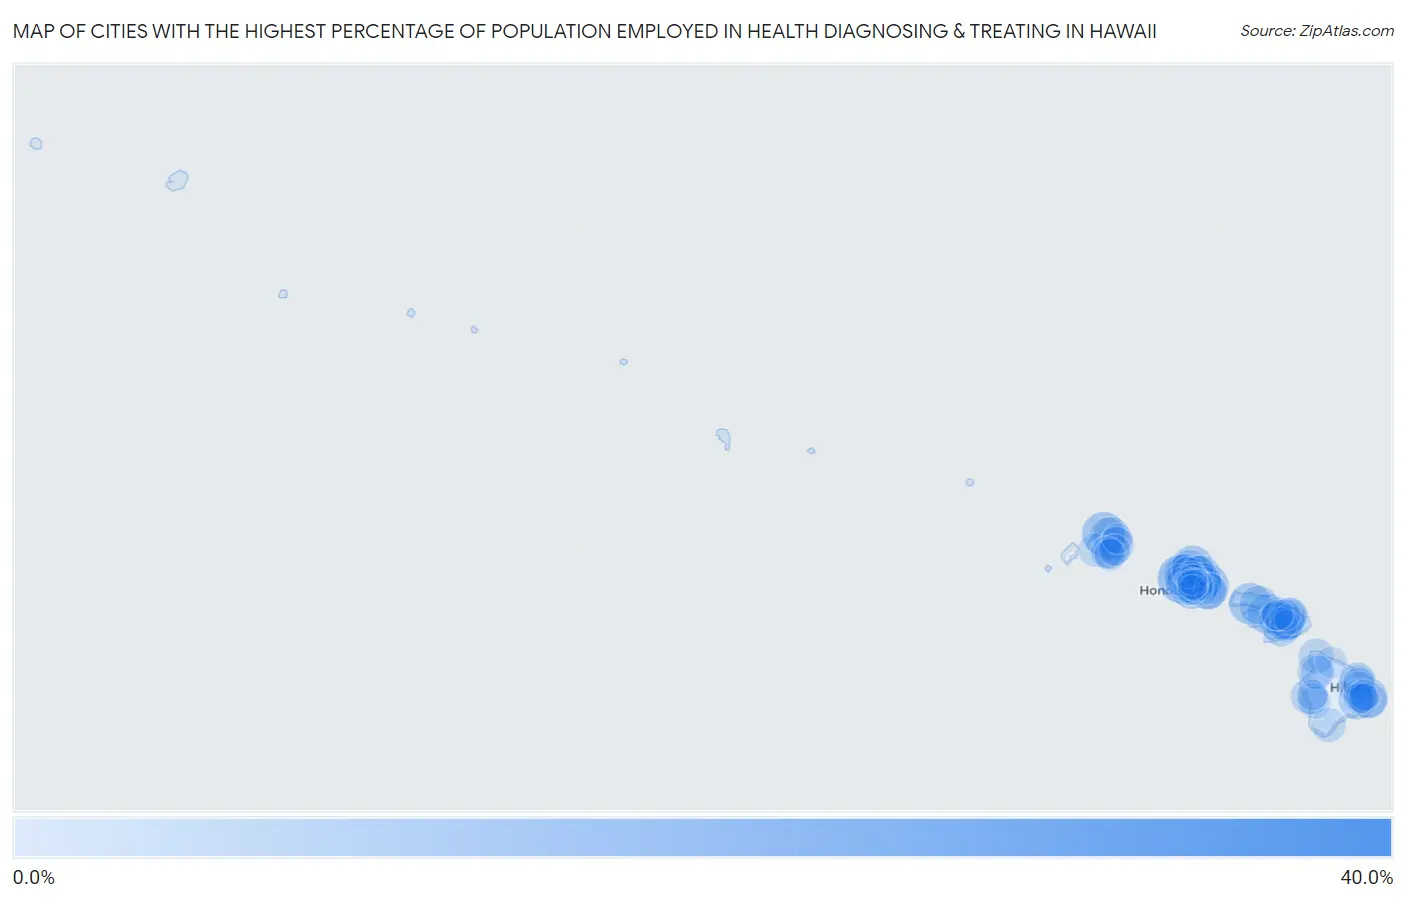
Map of Cities with the Highest Percentage of Population Employed in Health Diagnosing & Treating in Hawaii
0.0%
40.0%
Cities with the Highest Percentage of Population Employed in Health Diagnosing & Treating in Hawaii
| City | % Employed | vs State | vs National | |
| 1. | Seaview | 37.2% | 5.7%(+31.5)#1 | 6.2%(+31.0)#167 |
| 2. | Makaha Valley | 16.7% | 5.7%(+10.9)#2 | 6.2%(+10.4)#1,149 |
| 3. | Maunawili | 13.7% | 5.7%(+8.00)#3 | 6.2%(+7.49)#1,890 |
| 4. | Kaneohe Base | 13.0% | 5.7%(+7.24)#4 | 6.2%(+6.73)#2,202 |
| 5. | Haena | 12.7% | 5.7%(+6.99)#5 | 6.2%(+6.48)#2,318 |
| 6. | Schofield Barracks | 12.3% | 5.7%(+6.54)#6 | 6.2%(+6.03)#2,542 |
| 7. | Kaunakakai | 11.4% | 5.7%(+5.66)#7 | 6.2%(+5.15)#3,060 |
| 8. | Kawela Bay | 11.4% | 5.7%(+5.63)#8 | 6.2%(+5.12)#3,081 |
| 9. | Pukalani | 11.2% | 5.7%(+5.48)#9 | 6.2%(+4.97)#3,177 |
| 10. | Waimea Cdp Hawaii County | 11.0% | 5.7%(+5.24)#10 | 6.2%(+4.73)#3,344 |
| 11. | Hawaiian Beaches | 10.4% | 5.7%(+4.66)#11 | 6.2%(+4.15)#3,827 |
| 12. | Maalaea | 10.4% | 5.7%(+4.65)#12 | 6.2%(+4.14)#3,830 |
| 13. | Kaanapali | 10.3% | 5.7%(+4.57)#13 | 6.2%(+4.06)#3,909 |
| 14. | Kailua Cdp Honolulu County | 10.0% | 5.7%(+4.29)#14 | 6.2%(+3.78)#4,177 |
| 15. | Waialua | 9.8% | 5.7%(+4.09)#15 | 6.2%(+3.59)#4,394 |
| 16. | Heeia | 9.8% | 5.7%(+4.09)#16 | 6.2%(+3.59)#4,397 |
| 17. | Kaaawa | 9.7% | 5.7%(+3.92)#17 | 6.2%(+3.41)#4,586 |
| 18. | Ahuimanu | 9.6% | 5.7%(+3.89)#18 | 6.2%(+3.38)#4,613 |
| 19. | Wainaku | 9.6% | 5.7%(+3.83)#19 | 6.2%(+3.32)#4,686 |
| 20. | Waikele | 9.5% | 5.7%(+3.79)#20 | 6.2%(+3.28)#4,723 |
| 21. | Ualapue | 9.5% | 5.7%(+3.79)#21 | 6.2%(+3.28)#4,732 |
| 22. | Eden Roc | 9.3% | 5.7%(+3.57)#22 | 6.2%(+3.06)#5,027 |
| 23. | Ocean Pointe | 9.2% | 5.7%(+3.46)#23 | 6.2%(+2.95)#5,134 |
| 24. | Mokuleia | 8.8% | 5.7%(+3.07)#24 | 6.2%(+2.56)#5,691 |
| 25. | Pupukea | 8.7% | 5.7%(+2.92)#25 | 6.2%(+2.41)#5,923 |
| 26. | Kahaluu | 8.3% | 5.7%(+2.52)#26 | 6.2%(+2.01)#6,547 |
| 27. | Nanawale Estates | 8.1% | 5.7%(+2.32)#27 | 6.2%(+1.81)#6,893 |
| 28. | East Honolulu | 8.0% | 5.7%(+2.24)#28 | 6.2%(+1.73)#7,038 |
| 29. | Kalihiwai | 7.9% | 5.7%(+2.16)#29 | 6.2%(+1.65)#7,184 |
| 30. | East Kapolei | 7.7% | 5.7%(+1.99)#30 | 6.2%(+1.48)#7,510 |
| 31. | Kahaluu Keauhou | 7.7% | 5.7%(+1.93)#31 | 6.2%(+1.42)#7,643 |
| 32. | Wailea | 7.3% | 5.7%(+1.60)#32 | 6.2%(+1.09)#8,390 |
| 33. | Punaluu | 7.3% | 5.7%(+1.57)#33 | 6.2%(+1.06)#8,461 |
| 34. | Wailua | 7.3% | 5.7%(+1.55)#34 | 6.2%(+1.04)#8,503 |
| 35. | Waikoloa Beach Resort | 7.3% | 5.7%(+1.54)#35 | 6.2%(+1.03)#8,537 |
| 36. | Hanalei | 7.2% | 5.7%(+1.49)#36 | 6.2%(+0.984)#8,639 |
| 37. | Hawi | 7.2% | 5.7%(+1.44)#37 | 6.2%(+0.933)#8,738 |
| 38. | Mililani Mauka | 7.2% | 5.7%(+1.42)#38 | 6.2%(+0.910)#8,781 |
| 39. | Puako | 7.1% | 5.7%(+1.32)#39 | 6.2%(+0.814)#9,013 |
| 40. | Makawao | 7.0% | 5.7%(+1.31)#40 | 6.2%(+0.804)#9,040 |
| 41. | Pepeekeo | 7.0% | 5.7%(+1.31)#41 | 6.2%(+0.797)#9,051 |
| 42. | Haiku Pauwela | 6.9% | 5.7%(+1.15)#42 | 6.2%(+0.643)#9,460 |
| 43. | Helemano | 6.9% | 5.7%(+1.14)#43 | 6.2%(+0.630)#9,485 |
| 44. | Kula | 6.8% | 5.7%(+1.02)#44 | 6.2%(+0.516)#9,778 |
| 45. | Hilo | 6.7% | 5.7%(+0.925)#45 | 6.2%(+0.416)#10,034 |
| 46. | Kapolei | 6.6% | 5.7%(+0.904)#46 | 6.2%(+0.395)#10,088 |
| 47. | Mililani Town | 6.5% | 5.7%(+0.780)#47 | 6.2%(+0.271)#10,408 |
| 48. | Waiohinu | 6.5% | 5.7%(+0.758)#48 | 6.2%(+0.249)#10,463 |
| 49. | Waikapu | 6.3% | 5.7%(+0.593)#49 | 6.2%(+0.084)#10,888 |
| 50. | Pearl City | 6.2% | 5.7%(+0.442)#50 | 6.2%(-0.067)#11,281 |
| 51. | Waikoloa Village | 6.1% | 5.7%(+0.408)#51 | 6.2%(-0.101)#11,365 |
| 52. | Kaneohe | 6.1% | 5.7%(+0.378)#52 | 6.2%(-0.131)#11,443 |
| 53. | Ko Olina | 6.1% | 5.7%(+0.373)#53 | 6.2%(-0.136)#11,465 |
| 54. | Kekaha | 6.0% | 5.7%(+0.219)#54 | 6.2%(-0.290)#11,864 |
| 55. | Urban Honolulu | 5.9% | 5.7%(+0.170)#55 | 6.2%(-0.339)#11,980 |
| 56. | Waihee Waiehu | 5.9% | 5.7%(+0.132)#56 | 6.2%(-0.378)#12,087 |
| 57. | Ewa Villages | 5.8% | 5.7%(+0.106)#57 | 6.2%(-0.404)#12,145 |
| 58. | Hickam Housing | 5.8% | 5.7%(+0.084)#58 | 6.2%(-0.425)#12,201 |
| 59. | Maili | 5.8% | 5.7%(+0.056)#59 | 6.2%(-0.453)#12,288 |
| 60. | Royal Kunia | 5.8% | 5.7%(+0.018)#60 | 6.2%(-0.491)#12,377 |
| 61. | Kurtistown | 5.7% | 5.7%(-0.075)#61 | 6.2%(-0.584)#12,656 |
| 62. | Ewa Gentry | 5.6% | 5.7%(-0.146)#62 | 6.2%(-0.655)#12,875 |
| 63. | Aiea | 5.5% | 5.7%(-0.255)#63 | 6.2%(-0.764)#13,162 |
| 64. | West Loch Estate | 5.5% | 5.7%(-0.256)#64 | 6.2%(-0.765)#13,164 |
| 65. | Halawa | 5.5% | 5.7%(-0.280)#65 | 6.2%(-0.789)#13,229 |
| 66. | Makakilo | 5.4% | 5.7%(-0.303)#66 | 6.2%(-0.812)#13,309 |
| 67. | Kapaa | 5.4% | 5.7%(-0.384)#67 | 6.2%(-0.893)#13,552 |
| 68. | Honaunau Napoopoo | 5.3% | 5.7%(-0.407)#68 | 6.2%(-0.916)#13,607 |
| 69. | Kalaheo | 5.3% | 5.7%(-0.427)#69 | 6.2%(-0.936)#13,663 |
| 70. | Hauula | 5.2% | 5.7%(-0.502)#70 | 6.2%(-1.01)#13,897 |
| 71. | Keokea | 5.2% | 5.7%(-0.531)#71 | 6.2%(-1.04)#13,990 |
| 72. | Paukaa | 5.1% | 5.7%(-0.598)#72 | 6.2%(-1.11)#14,175 |
| 73. | Whitmore Village | 5.1% | 5.7%(-0.627)#73 | 6.2%(-1.14)#14,274 |
| 74. | Kihei | 5.0% | 5.7%(-0.737)#74 | 6.2%(-1.25)#14,626 |
| 75. | Waimalu | 5.0% | 5.7%(-0.758)#75 | 6.2%(-1.27)#14,677 |
| 76. | Orchidlands Estates | 5.0% | 5.7%(-0.781)#76 | 6.2%(-1.29)#14,755 |
| 77. | Poipu | 4.9% | 5.7%(-0.805)#77 | 6.2%(-1.31)#14,831 |
| 78. | Kukuihaele | 4.9% | 5.7%(-0.806)#78 | 6.2%(-1.32)#14,841 |
| 79. | Lawai | 4.9% | 5.7%(-0.834)#79 | 6.2%(-1.34)#14,913 |
| 80. | Kealakekua | 4.9% | 5.7%(-0.858)#80 | 6.2%(-1.37)#14,977 |
| 81. | Makaha | 4.7% | 5.7%(-1.07)#81 | 6.2%(-1.58)#15,629 |
| 82. | Waimanalo Beach | 4.7% | 5.7%(-1.08)#82 | 6.2%(-1.59)#15,646 |
| 83. | Puhi | 4.6% | 5.7%(-1.15)#83 | 6.2%(-1.65)#15,811 |
| 84. | Hawaiian Acres | 4.5% | 5.7%(-1.23)#84 | 6.2%(-1.74)#16,062 |
| 85. | Lihue | 4.5% | 5.7%(-1.27)#85 | 6.2%(-1.78)#16,168 |
| 86. | Fern Acres | 4.4% | 5.7%(-1.33)#86 | 6.2%(-1.84)#16,357 |
| 87. | Hawaiian Paradise Park | 4.4% | 5.7%(-1.35)#87 | 6.2%(-1.86)#16,431 |
| 88. | Olinda | 4.4% | 5.7%(-1.37)#88 | 6.2%(-1.88)#16,496 |
| 89. | Haleiwa | 4.3% | 5.7%(-1.40)#89 | 6.2%(-1.91)#16,604 |
| 90. | Paia | 4.3% | 5.7%(-1.44)#90 | 6.2%(-1.95)#16,726 |
| 91. | Kailua Cdp Hawaii County | 4.3% | 5.7%(-1.46)#91 | 6.2%(-1.97)#16,777 |
| 92. | Wailuku | 4.2% | 5.7%(-1.52)#92 | 6.2%(-2.03)#16,962 |
| 93. | Waipio | 4.2% | 5.7%(-1.54)#93 | 6.2%(-2.05)#17,008 |
| 94. | Koloa | 4.2% | 5.7%(-1.54)#94 | 6.2%(-2.05)#17,034 |
| 95. | Honalo | 4.2% | 5.7%(-1.55)#95 | 6.2%(-2.06)#17,062 |
| 96. | Waipio Acres | 4.1% | 5.7%(-1.59)#96 | 6.2%(-2.10)#17,182 |
| 97. | Anahola | 4.0% | 5.7%(-1.69)#97 | 6.2%(-2.20)#17,473 |
| 98. | Ainaloa | 4.0% | 5.7%(-1.70)#98 | 6.2%(-2.21)#17,509 |
| 99. | Waipahu | 4.0% | 5.7%(-1.75)#99 | 6.2%(-2.26)#17,628 |
| 100. | Ewa Beach | 3.7% | 5.7%(-2.00)#100 | 6.2%(-2.51)#18,360 |
1
2Common Questions
What are the Top 10 Cities with the Highest Percentage of Population Employed in Health Diagnosing & Treating in Hawaii?
Top 10 Cities with the Highest Percentage of Population Employed in Health Diagnosing & Treating in Hawaii are:
#1
16.7%
#2
13.7%
#3
12.7%
#4
12.3%
#5
11.4%
#6
11.4%
#7
11.2%
#8
10.4%
#9
10.4%
#10
10.3%
What city has the Highest Percentage of Population Employed in Health Diagnosing & Treating in Hawaii?
Makaha Valley has the Highest Percentage of Population Employed in Health Diagnosing & Treating in Hawaii with 16.7%.
What is the Percentage of Population Employed in Health Diagnosing & Treating in the State of Hawaii?
Percentage of Population Employed in Health Diagnosing & Treating in Hawaii is 5.7%.
What is the Percentage of Population Employed in Health Diagnosing & Treating in the United States?
Percentage of Population Employed in Health Diagnosing & Treating in the United States is 6.2%.