Zip Codes with the Highest Percentage of Population Employed in Health Diagnosing & Treating in Alameda, CA
RELATED REPORTS & OPTIONS
Health Diagnosing & Treating
Alameda
Compare Zip Codes
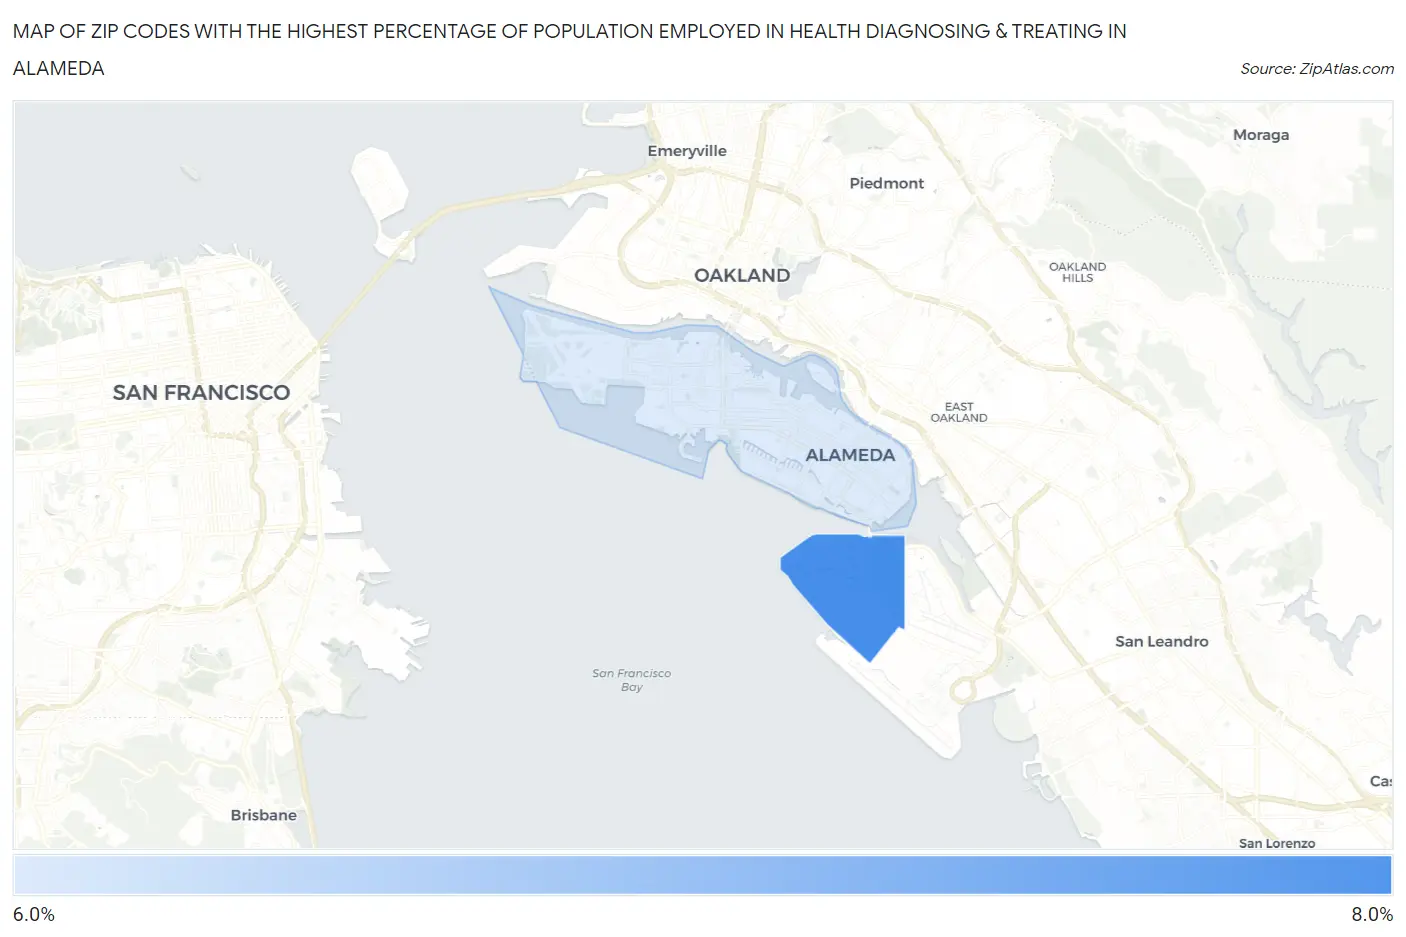
Map of Zip Codes with the Highest Percentage of Population Employed in Health Diagnosing & Treating in Alameda
6.4%
6.5%
Zip Codes with the Highest Percentage of Population Employed in Health Diagnosing & Treating in Alameda, CA
| Zip Code | % Employed | vs State | vs National | |
| 1. | 94502 | 6.5% | 5.3%(+1.14)#478 | 6.2%(+0.207)#12,189 |
| 2. | 94501 | 6.4% | 5.3%(+1.08)#490 | 6.2%(+0.144)#12,423 |
1
Common Questions
What are the Top Zip Codes with the Highest Percentage of Population Employed in Health Diagnosing & Treating in Alameda, CA?
Top Zip Codes with the Highest Percentage of Population Employed in Health Diagnosing & Treating in Alameda, CA are:
What zip code has the Highest Percentage of Population Employed in Health Diagnosing & Treating in Alameda, CA?
94502 has the Highest Percentage of Population Employed in Health Diagnosing & Treating in Alameda, CA with 6.5%.
What is the Percentage of Population Employed in Health Diagnosing & Treating in Alameda, CA?
Percentage of Population Employed in Health Diagnosing & Treating in Alameda is 6.4%.
What is the Percentage of Population Employed in Health Diagnosing & Treating in California?
Percentage of Population Employed in Health Diagnosing & Treating in California is 5.3%.
What is the Percentage of Population Employed in Health Diagnosing & Treating in the United States?
Percentage of Population Employed in Health Diagnosing & Treating in the United States is 6.2%.