Zip Codes with the Highest Percentage of Population Employed in Health Diagnosing & Treating in Lompoc, CA
RELATED REPORTS & OPTIONS
Health Diagnosing & Treating
Lompoc
Compare Zip Codes
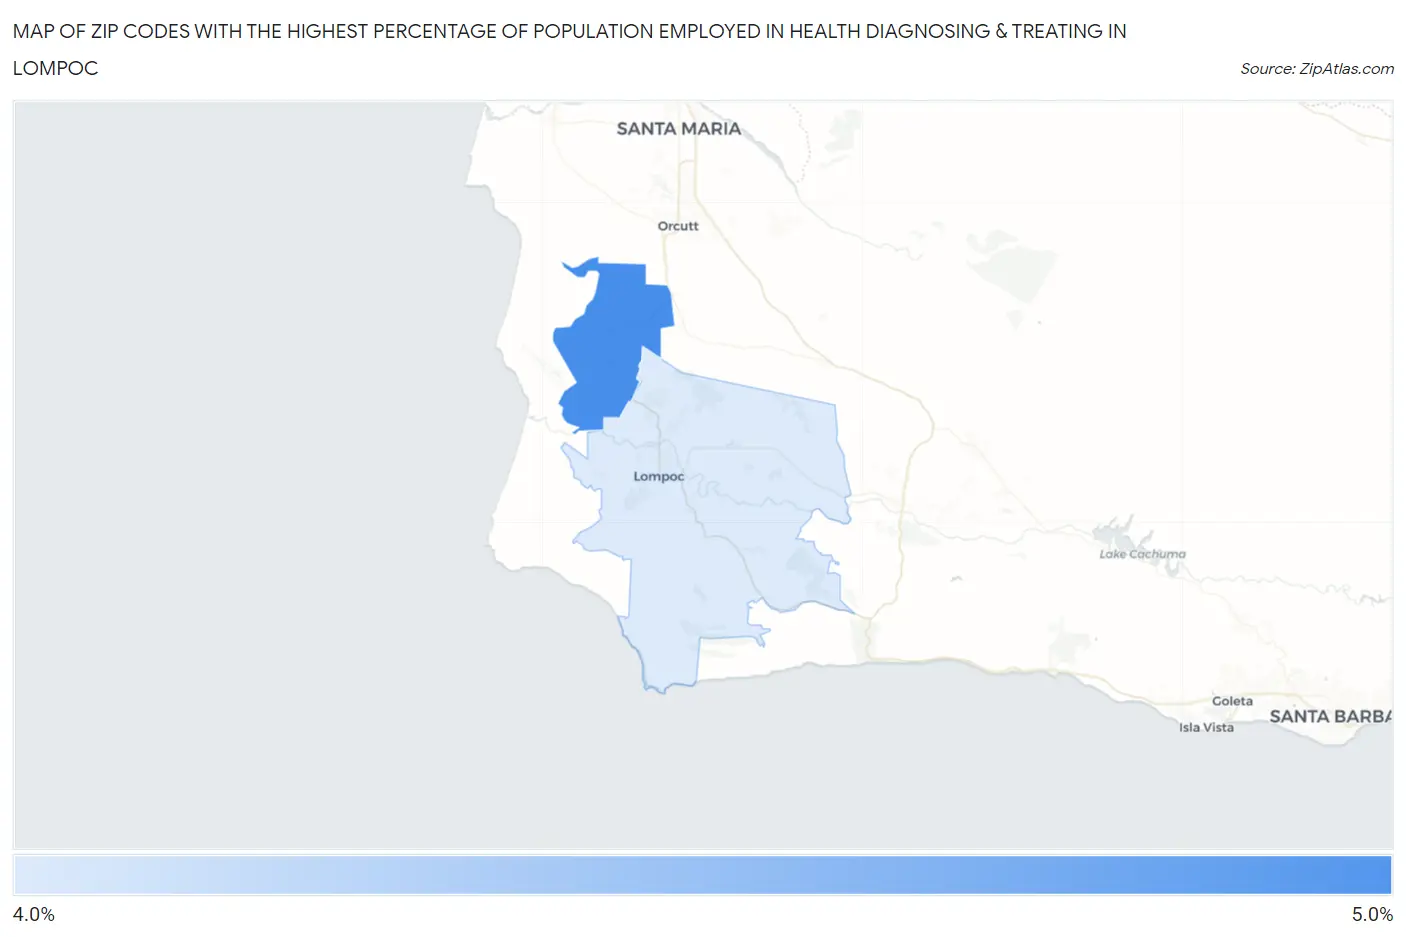
Map of Zip Codes with the Highest Percentage of Population Employed in Health Diagnosing & Treating in Lompoc
4.3%
4.4%
Zip Codes with the Highest Percentage of Population Employed in Health Diagnosing & Treating in Lompoc, CA
| Zip Code | % Employed | vs State | vs National | |
| 1. | 93437 | 4.4% | 5.3%(-0.937)#925 | 6.2%(-1.87)#20,078 |
| 2. | 93436 | 4.3% | 5.3%(-1.04)#953 | 6.2%(-1.97)#20,431 |
1
Common Questions
What are the Top Zip Codes with the Highest Percentage of Population Employed in Health Diagnosing & Treating in Lompoc, CA?
Top Zip Codes with the Highest Percentage of Population Employed in Health Diagnosing & Treating in Lompoc, CA are:
What zip code has the Highest Percentage of Population Employed in Health Diagnosing & Treating in Lompoc, CA?
93437 has the Highest Percentage of Population Employed in Health Diagnosing & Treating in Lompoc, CA with 4.4%.
What is the Percentage of Population Employed in Health Diagnosing & Treating in Lompoc, CA?
Percentage of Population Employed in Health Diagnosing & Treating in Lompoc is 3.8%.
What is the Percentage of Population Employed in Health Diagnosing & Treating in California?
Percentage of Population Employed in Health Diagnosing & Treating in California is 5.3%.
What is the Percentage of Population Employed in Health Diagnosing & Treating in the United States?
Percentage of Population Employed in Health Diagnosing & Treating in the United States is 6.2%.